Article

Optimization of Supercritical Carbon Dioxide Extraction of Polyphenols from Black Rosehip and Their Bioaccessibility Using an In Vitro Digestion/Caco-2 Cell Model

by
Kadriye Nur Kasapoğlu
1,2,
Johanita Kruger
2,
Aslı Barla-Demirkoz
3,
Mine Gültekin-Özgüven
1,
Jan Frank
2 and
Beraat Özçelik
1,*
1
Department of Food Engineering, Faculty of Chemical and Metallurgical Engineering, Istanbul Technical University, 34469 Istanbul, Turkey
2
Institute of Nutritional Sciences, University of Hohenheim, Garbenstraße 28, 70599 Stuttgart, Germany
3
Department of Nutrition and Dietetics, Faculty of Health and Sciences, Halic University, 34060 Istanbul, Turkey
*
Author to whom correspondence should be addressed.
Foods 2023, 12(4), 781; https://doi.org/10.3390/foods12040781
Submission received: 7 January 2023 / Revised: 8 February 2023 / Accepted: 9 February 2023 / Published: 11 February 2023
(This article belongs to the Special Issue Extraction, Characterization and Bioactive Properties of Plants Foods)

Abstract

:
The fruits of Rosa pimpinellifolia are rich sources of (poly)phenols, however they are underutilized due to the limited information available. The influence of the pressure, temperature, and co-solvent concentration (aqueous ethanol) of the supercritical carbon dioxide extraction (SCO2-aqEtOH) on the extraction yield, total phenolic-, total anthocyanin-, catechin-, cyanidin-3-O-glucoside contents, and total antioxidant activity of black rosehip was investigated simultaneously. The maximum obtained total phenolic and total anthocyanin contents under the optimized extraction conditions (280 bar, 60 °C and 25% ethanol, v/v) were 76.58 ± 4.25 mg gallic acid equivalent and 10.89 ± 1.56 mg cyanidin-3-O-glucoside equivalent per g of the dry fruits, respectively. The optimal extract obtained by SCO2-aqEtOH was compared to two other extraction procedures: ultrasonication using ethanol as solvent (UA-EtOH) and pressurized hot water extraction (PH-H2O). The bioaccessibility and cellular metabolism of the phenolic compounds in the different black rosehip extracts were assessed using an in vitro digestion coupled with a human intestinal Caco-2 cell model. The in vitro digestive stability and cellular uptake of the phenolic compounds had no significant difference among the different extraction methods. The results of this study confirm the efficiency of SCO2-aqEtOH extraction for phenolic compounds and, in particular, for anthocyanins, and could be used to produce new functional food ingredients from black rosehip with high antioxidant power containing both hydrophilic and lipophilic compounds.

1. Introduction

The use of large amounts of organic solvent in extraction processes is problematic due to health and environmental concerns. In addition, some organic solvents are unsuitable for applications in pharmaceutical and food industries due to their toxicity [1]. Eliminating the major drawbacks of conventional solvent extraction, supercritical fluid extraction (SFE) is a promising alternative with some additional benefits such as better mass transport, higher yield, faster extraction, and selectivity [2].
The SFE process is controlled by the operating parameters, such as pressure and temperature, to modify the physical properties of the solvent (density, viscosity and diffusivity) in order to optimize the extraction of the target compounds. For the SFE extraction of potentially bioactive compounds, a temperature range of 40–60 °C and a pressure range of 200–400 bar are often applied [3]. CO2 is the most preferred solvent in SFE as it is in gas state at room temperature, enabling its separation from the final extract when the system is decompressed. Additionally, because of its low critical temperature, it can be utilized to extract reactive and thermally sensitive substances and its use decreases post-processing expenses as solvent removal is no longer necessary [4]. When large amounts of CO2 are used, the operation can be controlled to recycle it, which is quite advantageous on an industrial scale. Preeminently, CO2 has GRAS (Generally Recognized as Safe) status, providing extracts that are safe for human health [5].
When using SFE, the assistance of a modifier co-solvent is needed as the polarity of CO2 is low, making it less effective in extracting more polar bioactive compounds. When added in small amounts, methanol or ethanol can induce substantial changes in its solvent properties and can yield the successive extraction of phenolic compounds from plant matrices [6]. Although it is greener than most of organic solvents, large amounts of ethanol-rich solutions are still of concern in both pilot- and industrial-scale productions [7].
The optimization of green and sustainable extraction techniques, such as supercritical fluid technology, is therefore of great value to isolate potentially bioactive compounds from underutilized plants. In that respect, the pseudo fruits of Rosa pimpinellifolia, or black rosehips, are promising sources of a variety of potentially bioactive compounds, including flavonoids, anthocyanins, carotenoids, vitamins E and C [8,9,10], and they belong to the third most culturally important family in Turkey: Rosaceae [11]. Traditionally, decoction prepared from fruit and root parts of black rosehip are used against colds, infections, stomach pain, hemorrhoids, and also as a cardiotonic agent in the East and North East Anatolian regions [12]. However, black rosehips are less well-known than other Rosa species [13]. Several attempts have been made to extend the benefits of locally consumed black rosehips for food industry applications in the forms of vinegar [14], yogurt [15], and ice cream [16]. Sokół-Łętowska et al. reported that black rosehip liqueur had the highest antioxidant activity among liqueurs made from other red fruits, including chokeberry, cornelian cherry, blackcurrant, blackberry, raspberry, mahonia, sloe, strawberry, and sour cherry [17]. In the literature, only a small number of papers deal with the extraction of black rosehip (poly)phenols, using novel techniques, such as microwave assisted aqueous two-phase extraction [18] and ultrasound assisted extraction [19]. Ultrasound and microwaves are recognized as outstanding energy sources that enhance the extraction process, contributing to a good yield and quality of the extract [20]. As a nonconventional technique, pressurized hot water extraction was recently conducted on black rosehip by our group [21]. To the best of our knowledge, supercritical carbon dioxide modified by aqueous ethanol as a co-solvent (SCO2-aqEtOH) has not been systematically used for the extraction of black rosehip compounds.
The purpose of this study was to optimize the SCO2 process variables for the extraction of (poly)phenolic compounds from black rosehip, and to compare it with other extraction methods with respect to the antioxidant activity, phenolic, and anthocyanin contents. Any potential bioactivity of these compounds is limited by their bioaccessibility in the human gastrointestinal tract, and then their cellular uptake and metabolism [22]. Thus, the bioaccessibility of the phenolic compounds from different black rosehip extracts were also investigated using simulated gastrointestinal digestion, followed by a human intestinal epithelial cell model. To the best of our knowledge, this is the first study to compare the phenolic content and antioxidant activity of different black rosehip extracts before and after in vitro digestion. In addition, the effects of the extraction method on the cytotoxic properties of extracts were evaluated.

2. Materials and Methods

2.1. Plant Materials

Black rosehip (Rosa pimpinellifolia L., syn. Rosa spinosissima L.) fruits were obtained from Gümüşhane Province in Blacksea region of Turkey. The morphology of the fresh fruits are shown in Supplementary Figure S1. The collected fresh fruits were cleaned and the stalk parts were removed. Whole fruits consisting of flesh and seeds were milled using liquid nitrogen and lyophilized overnight to adjust the residual moisture content to below 5% (Christ Alpha 1-2 LD plus, Buch and Holm, Herlev, Denmark). The average particle size of the feed was about 1 mm (corresponding to 18 mesh). The samples were stored at −20 °C until extractions and analyses.

2.2. Supercritical Carbon Dioxide Modified by Aqueous Ethanol as Co-Solvent (SCO2-aqEtOH)

The supercritical carbon dioxide (CO2) extraction process was performed using a supercritical fluid extraction system (Waters SFE 1000, Milford, MA, USA). In order to find the optimal experimental conditions for black rosehip, a response surface design was employed for the simultaneous maximization of all the investigated responses (extraction yield, total phenolic-, total anthocyanin-, catechin-, cyanidin-3-O-glucoside contents, and total antioxidant activity). The extraction procedure was carried out dynamically for 60 min at a constant mass flow rate of 50 g min−1 of CO2 (co-solvent is 10%), in which 12 g of lyophilized samples were used for each run. A Box-Behnken experimental design (BBD), considering three factors and three levels, was selected in order to optimize the following process parameters: pressure (X1; 150–350 bar), temperature (X2; 40–60 °C), and co-solvent concentration (X3; 20–100% EtOH:H2O) (Supplementary Table S1). The dependent variables Y1 (extraction yield,%, w/w), Y2 (total phenolic content -TPC, mg GAE/g), Y3 (catechin content -CC, mg/g), Y4 (total anthocyanin content -TAC, mg Cy3GE/g), Y5 (Cy3GC content, mg/g), Y6 (total antioxidant activity –TAA, mmol TE/g by DPPH assay and Y7 (total antioxidant activity –TAA, mmol TE/g by CUPRAC assay were evaluated in the extraction process optimization. The design consisted of 17 experimental runs and was performed in a randomized order (Table 1). The results were statistically analyzed using the Design Expert (Version 13) software to evaluate the suitability of the proposed model and determine the optimum extraction conditions. The treatment of multiple responses and the selection of the optimum conditions were based on the desirability function D. The model fitting was employed by evaluating the coefficient of determination (R2) and lack of fit. The significance was determined for all of the independent variables, their interactions and their quadratic effects, considering p < 0.05 as significant.

2.3. Ultrasound Assisted Solvent Extraction (UA-EtOH)

Ultrasound assisted (UA) extraction was performed in an ultrasonic bath (Sonorex Digitec DT 255 H, Bandelin instruments, Berlin, Germany) using ethanol (99%) as a solvent. The temperature was controlled by ice bags. Two cycles of 30 min extraction were employed, and the supernatants were combined after centrifugation for 10 min at 5000 rpm (Hettich Rotanta 460R, Tuttlingen, Germany). A total of two static extraction cycles were performed and the supernatants were combined.

2.4. Pressurized Hot Water Extraction (PH-H2O)

Pressurized hot water extraction was performed using optimized conditions, as reported in our previous work [21]. A bench-scale pressurized solvent extraction system (SFE-500, Separex, Champigneulles, France) was used at 75 °C for 1 h, maintaining a pressure of 100 bar with no agitation.

2.5. Extraction Yield

The collected extracts were put in glass flasks and weighed in analytical balance. The percentage yield (w/w) was calculated as the mean value of the ratios between the mass of the extract and the mass of the fruit sample used for the extraction, on a dry weight basis.

2.6. Spectrophotometric Assays

2.6.1. Total Phenolic Content (TPC)

The total phenolic content was measured by a colorimetric Folin-Ciocalteu assay, as described earlier [23]. A 1500 µL ten-fold diluted Folin-Ciocalteu’s Phenol Reagent was added into 200 µL of the sample, and then were mixed with 1200 µL of sodium carbonate solution (7.5%, w/v) at room temperature. The absorbance was read after 45 min at 765 nm in a microplate reader (SynergyHT, Biotek, Winooski, VT, USA). Gallic acid was used for quantification and the results were expressed in terms of the gallic acid equivalent per gram fruit in dry weight (mg GAE per g dw).

2.6.2. Total Anthocyanin Content (TAC)

The total anthocyanin content of the phenolic-rich extracts was estimated using the pH differential method [24]. Aliquots of each sample were diluted with 0.025 M potassium chloride buffer (pH 1) and 0.4 M sodium acetate (pH 4.5), respectively. The absorbance of each dilution was measured at 520 and 700 nm, respectively. The anthocyanin concentrations were expressed as cyanidin-3-O-glucoside equivalents (mg Cy3GE per g) = (A × MW × DF × V)/ɛ × W × 0.75, where A = (A520 nm–A700 nm)pH 1.0 − (A520 nm–A700 nm)pH 4.5, MW = 449.2 g/mol for Cy3G, DF = dilution factors, V = extract volume, ε = 26,900 L/mol extinction coefficient, W = plant sample weight, 0.75 = pathlength (cm).

2.6.3. Total Antioxidant Activity (TAA)

The hydrogen-donating or radical-scavenging ability of the samples was measured using the stable radical DPPH (2,2-diphenyl-1-picryl-hydrazyl), according to Altin et al. [23], and CUPRAC (cupric ion reducing antioxidant activity) assays were applied, as described by Apak et al. [25]. All of the results were expressed as mmol of Trolox equivalents per gram of the fruit at dry weight (mmol TE per g dw).

2.7. Analysis of Phenolic Compounds

Individual phenolics and anthocyanins in the extracts were detected using a high performance liquid chromatography with a PDA detector (SPD M20A, Schimadzu, Kyoto, Japan) according to our previous work [26]. For the chromatographic separation of the phenolic compounds, an ACE C18 column (250 mm × 4.6 mm, 3 μm) with a guard column (4.0 mm × 10 mm, 2 μm) (Advanced Chroma-tography Technologies Ltd., Aberdeen, UK) was used. The gradient of mobile phase A (MQ-water/formic acid, 99.9/0.1 v/v) and mobile phase B (acetonitrile) was used.
The chromatographic separation of anthocyanins was performed on a Luna-5μ-Phenyl-Hexyl column (250 mm × 4.6 mm, 5 μm) (Phenomenex, Torrance, CA, USA) using a gradient of MQ-water/formic acid (95:5 v/v) for mobile phase A and acetonitrile for mobile phase B, as previously described [26].

2.8. Analysis of Lipophilic Compounds

For the chromatographic analysis of the liposoluble compounds, the extraction and quantification were performed as described previously in detail [27]. For the analysis of carotenoids, ethanolic suspensions were diluted in acetonitrile–methanol–water (85:10:5, v/v) and injected into the Shimadzu HPLC system, as described in their study. The standards including β-carotene, α-carotene, β-cryptoxanthin, lutein, zeaxanthin and lycopene used for the identification of carotenoids and the UV–visible detector was set to 450 nm for quantification.
For the analysis of vitamin E, the samples suspended in the methanol: ethanol (80:20, v/v) suspension were injected into a JASCO HPLC system, as previously described [28]. The excitation/emission wavelengths of 296/325 nm were used in the fluorescence detector. The identification of vitamin E congeners was performed by comparing the retention times with those of the authentic standards of α-, β-, δ-, γ-tocopherol and α-, β, δ-, γ-tocotrienol.

2.9. In Vitro Gastrointestinal Digestion

The in vitro digestion protocol was performed as described previously in detail [21]. The final digests were centrifuged for 20 min (13,300× g, 4 °C) and then filtered through 0.2 μm membrane filters (Filtropur S, Sarstedt, Germany) to separate the soluble and bioaccessible fractions, respectively. All of the digested fractions were overlaid with a layer of nitrogen gas and stored at −80 °C before HPLC analysis. The digestive stability (%) refers to the amount of compound remaining in the whole digest (not degraded during digestion), as a percentage of the total amount of the compound digested. The aqueous solubility (%) is the amount of compound solubilized after digestion (amount in supernatant after centrifuging), as a percentage of the total amount of compound digested. The bioaccessibility (%) is the amount of compound recovered in the digest after centrifuging and filtration, and is expressed as the percentage of the total amount of the compound initially added to the digestion (µg/mL).

2.10. Cell Culture

Caco-2 cells, a human colon adenocarcinoma cell line (American Type Culture Collection, Manassas, VA, USA), were used 14–16 days post-confluence. The Caco-2 cells were cultured in DMEM, containing 10% foetal bovine serum, 1% sodium pyruvate, 1% non-essential-amino-acids and 1% penicillin/streptomycin at 5% CO2 and 37 °C. All of the experiments were conducted between passages 12 and 46 with replicates from three different passages.

2.11. Cytotoxicity

The cytotoxicity of the extracts (to evaluate possible toxic effects of chemical compounds from extracts) and their digests (to determine the appropriate dilutions before uptake studies) were evaluated using a neutral red uptake (NRU) assay in differentiated Caco-2 cells, according to Flory et al. [29]. The results were expressed as the percentage of viable cells, with 100% representing the control cells treated with only PBS.

2.12. Caco-2 Uptake of (poly)phenols

The intestinal uptake of phenolics was estimated according to Kruger et al. [30]. The bioaccessible fraction of the in vitro digestion was diluted with DMEM at a ratio of 1:6 (v/v) and incubated at 37 °C in a humidified atmosphere of 5% CO2 for 3 h. After the incubation, the supernatant was removed and stored at −80 °C and the cells were rinsed twice with PBS. The cells were detached using a cell scraper, covered with nitrogen gas, and stored at −80 °C before HPLC analysis. The Caco-2 cells were deproteinized by vortexing with 2 mL ethanol for 30 s and centrifuged (1690× g for 5 min, 4 °C). The supernatant was dried under vacuum and the residues were resuspended in 1 mL of PBS. To analyze the free and conjugated catechin and epicatechin, all of the samples were subjected to glucoronidase hydrolysis, extracted using ethyl acetate and analyzed by the JASCO HPLC system, as previously described [30]. The cellular uptake results represent the amount of phenolic absorbed by the Caco-2 cells (µg/well) and is expressed as the percentage of phenolic that remained stable during the incubation period (sum of (poly)phenols in cell lysate and supernatant).

2.13. Statistical Analysis

Statistical analysis of the RSM design results was implemented using Design Expert 13.0 (Stat-Ease, Inc., Minneapolis, MN, USA). Unless otherwise stated, the data were obtained from at least three independent experiments and reported as mean ± standard deviation (SD). The differences between the means were determined using one way analysis of variance (ANOVA) with Tukey’s post-hoc test at 95% confidence level using Minitab 16 (Minitab Inc., State College, TX, USA).

3. Results and Discussion

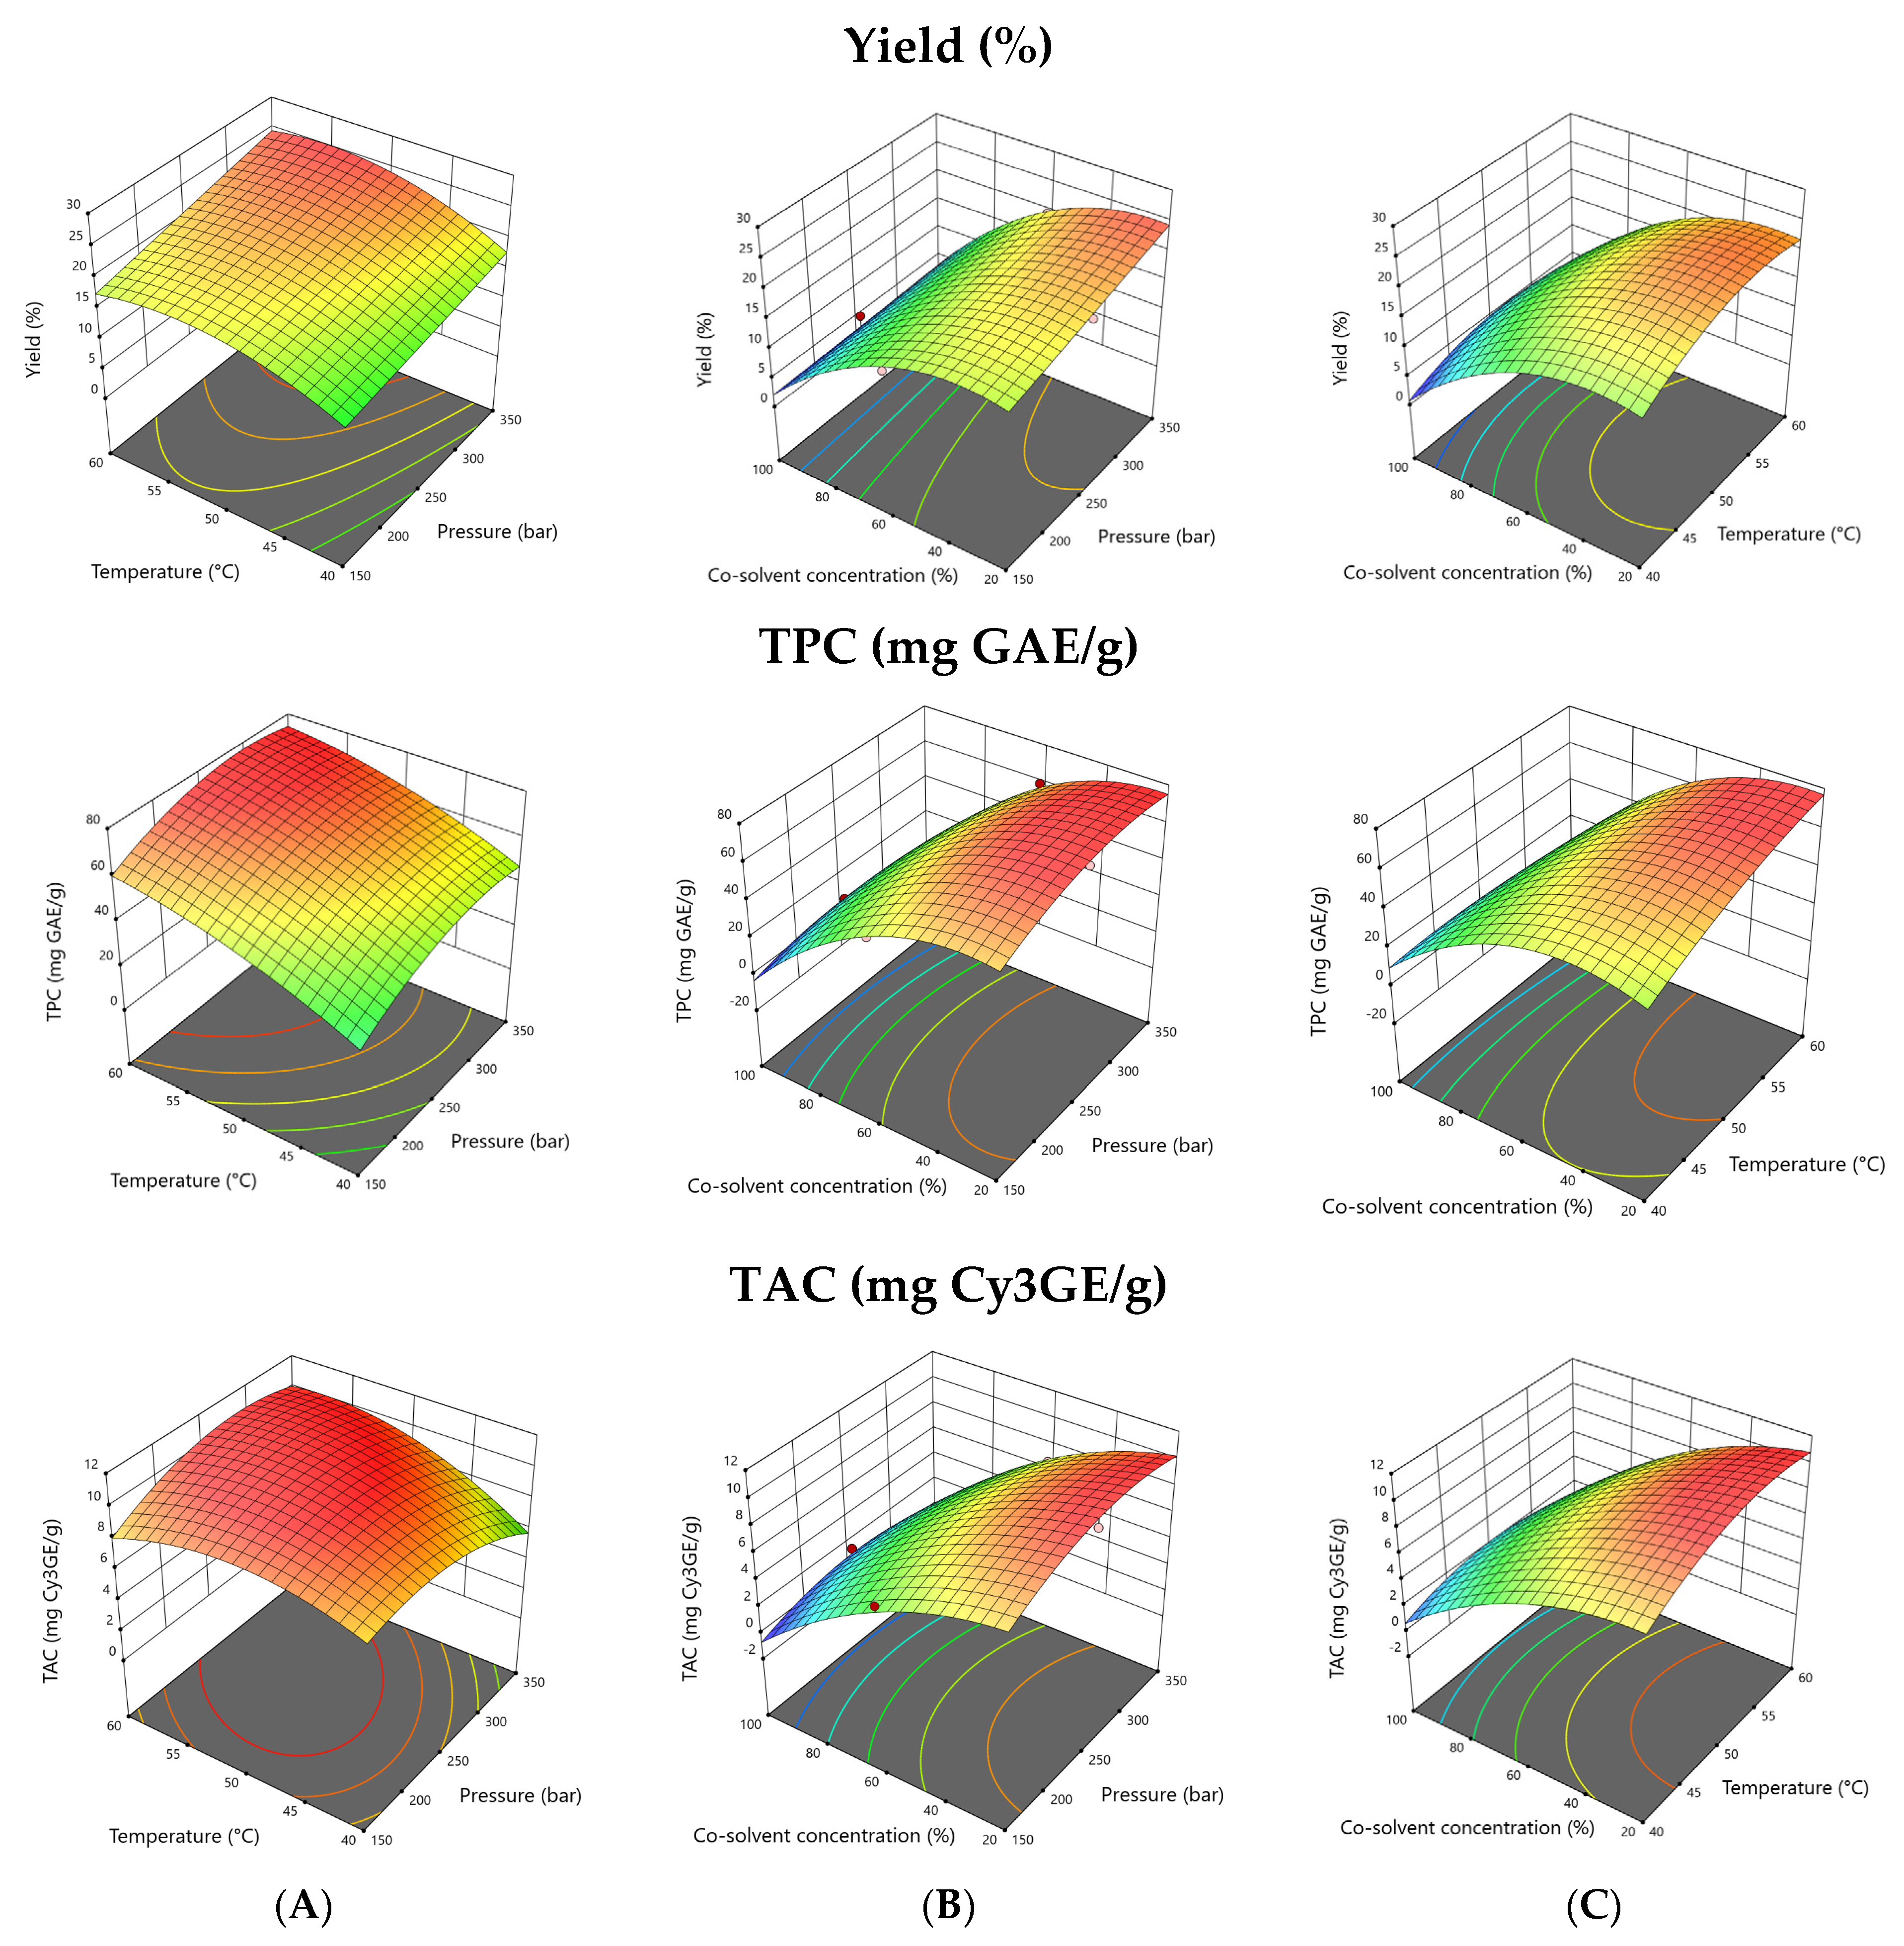
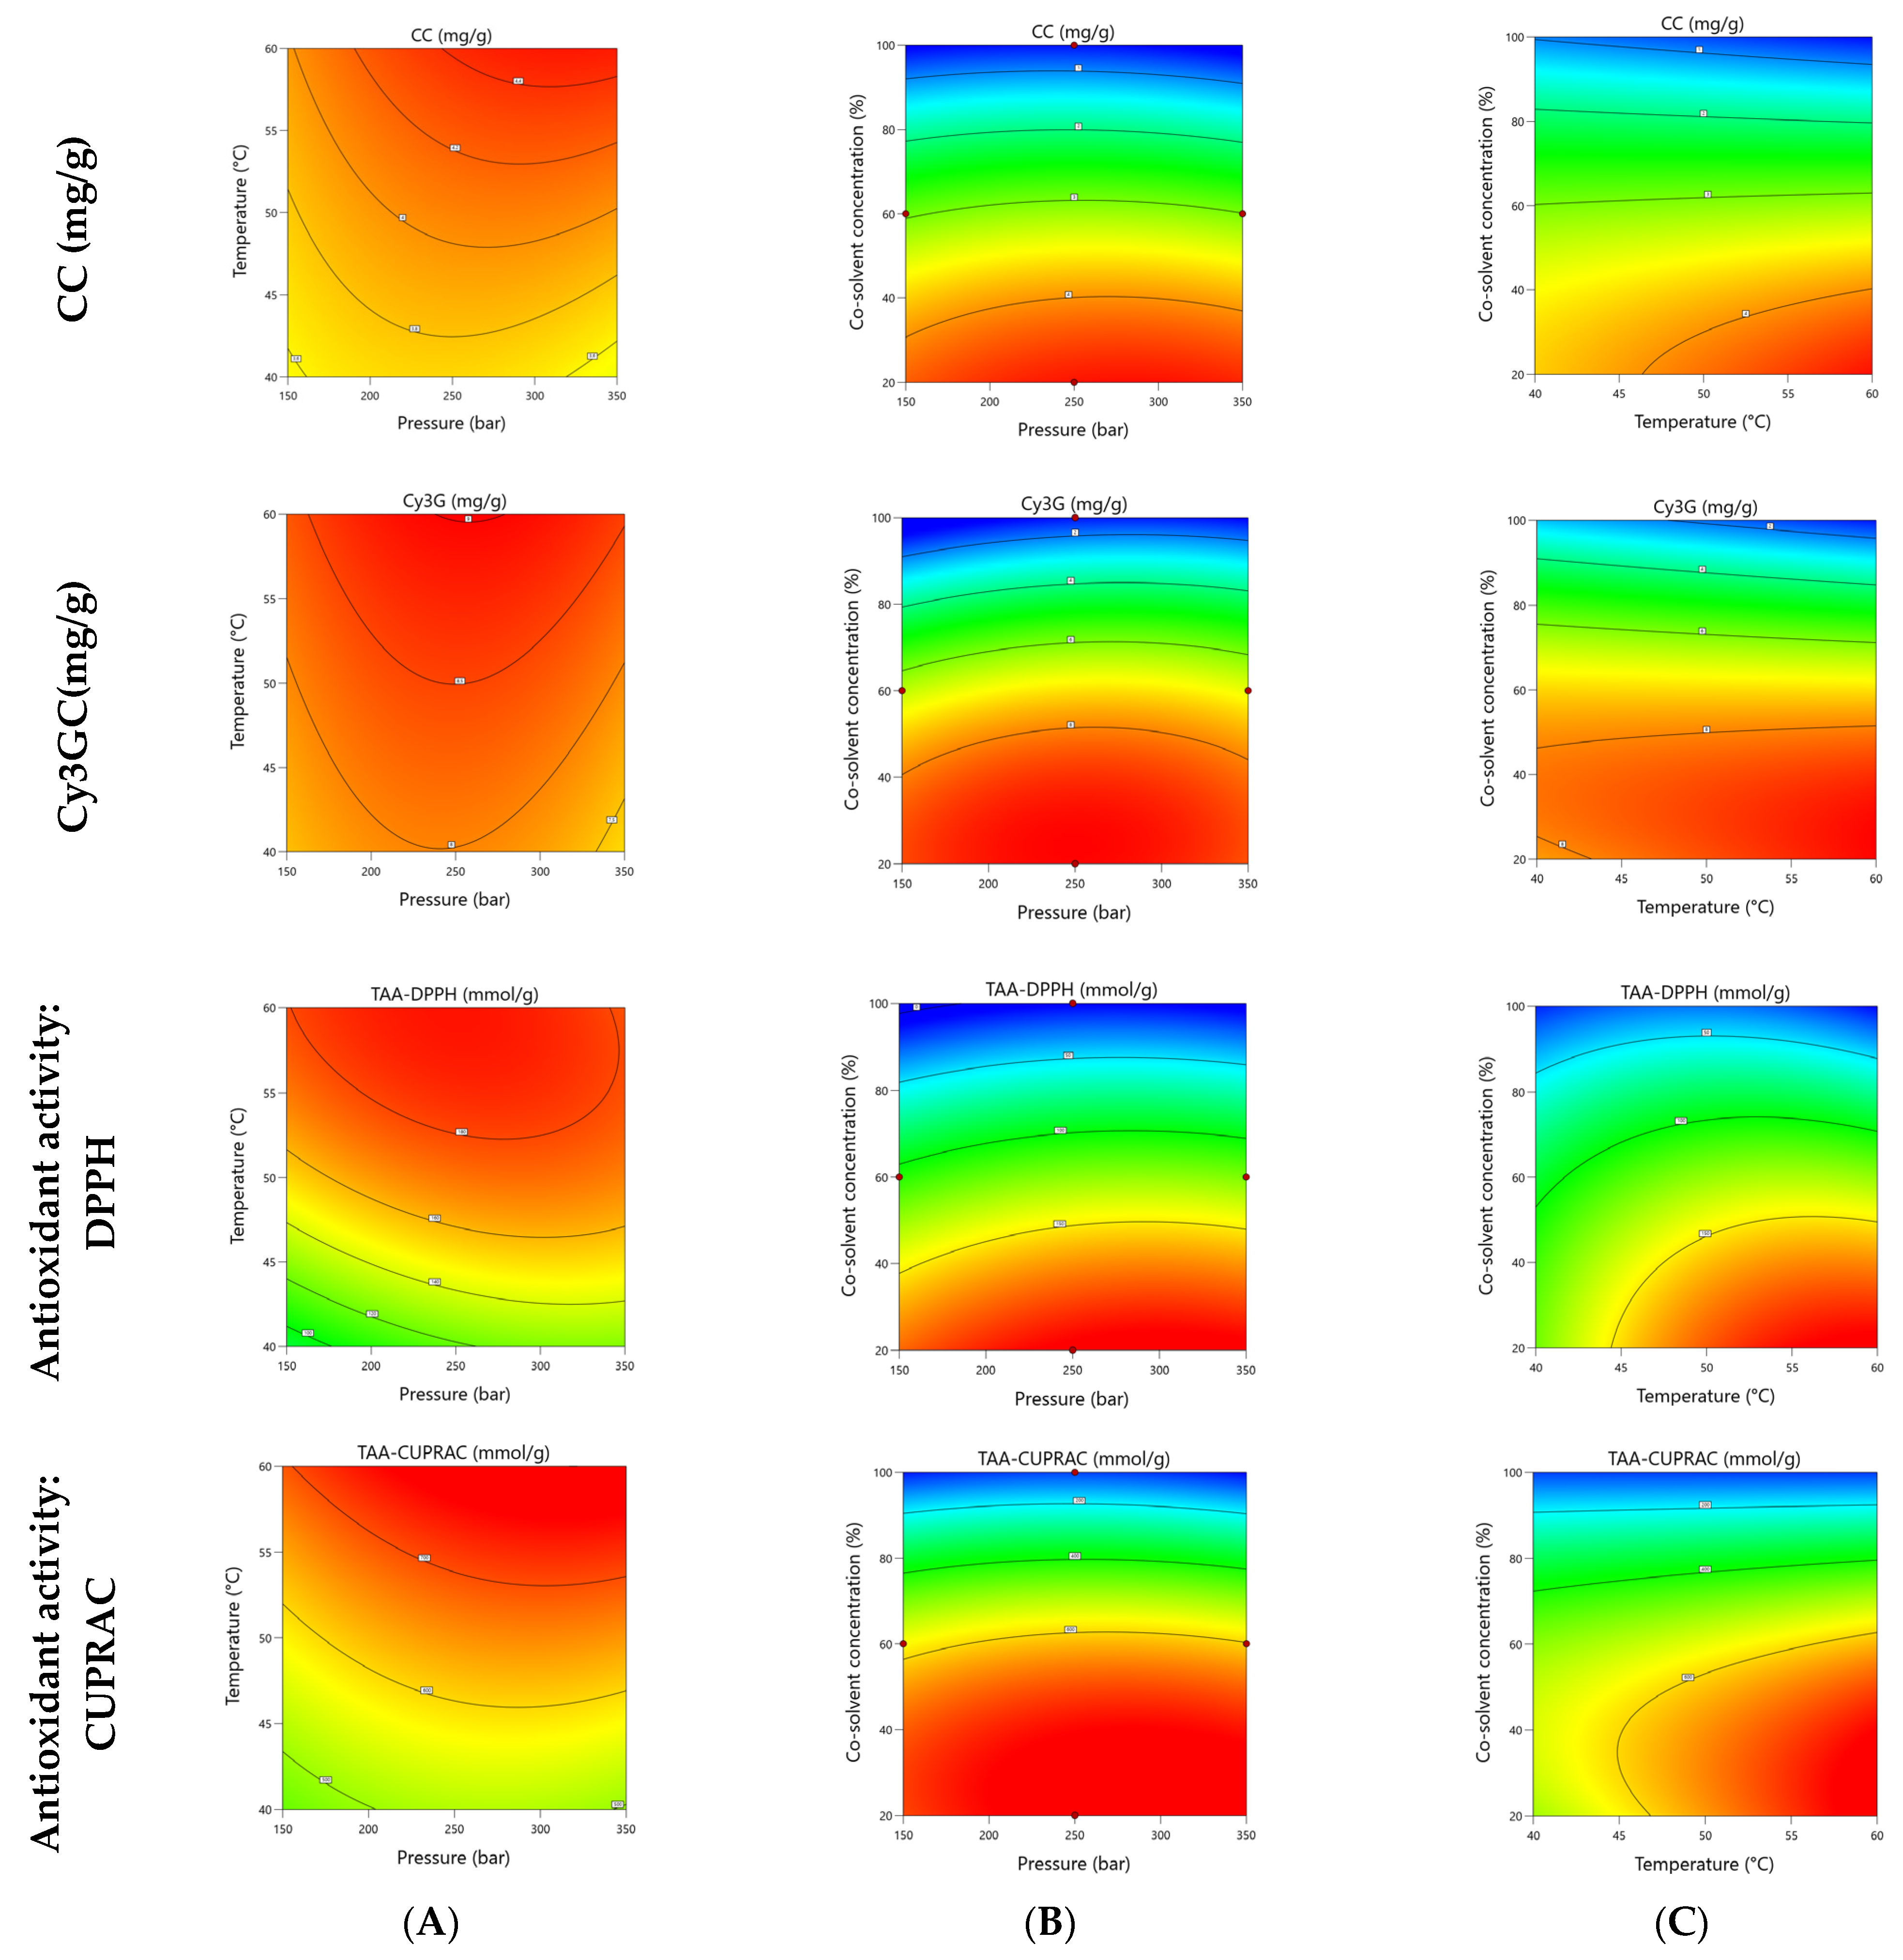
3.1. Model Fitting and Optimization

The optimization of supercritical carbon dioxide modified by aqueous ethanol as co-solvent extraction conditions were carried out to improve the extraction efficiency of the black rosehip (poly)phenols. A three-level and three factor Box-Behnken design (BBD) was implemented for the response surface optimization of the SCO2 extraction process. The operating variables and measured responses in the 17 experiments are given in Table 1. The results of the ANOVA and regression analyses are presented in Supplementary Table S2. In this study, model terms with p < 0.01 are highly significant, those with 0.01 ≤ p < 0.05 are significant and those with p ≥ 0.05 are insignificant [31]. In order to develop the RSM models, the response values were fitted to a second-order polynomial equation using the Design Expert 13.0 software. The nonsignificant factors are excluded from the polynomial equation (p > 0.05). The mathematical equations relating the experimental data to the process parameters, expressed in coded values, are presented in Equations (1)–(7):
Y = 82.92204 + 0.007125 X 1 3.46039 X 2 0.474967 X 3 0.032829 X 2 2 0.003771 X 3 2 + 0.000625 X 1 X 2 0.000394 X 1 X 3 0.0025 X 2 X 3
T P C = 236.30025 + 0.509462 X 1 + 6.45763 X 2 + 2.29167 X 3 0.000812 X 1 2 0.044710 X 2 2 0.012880 X 3 2 0.001031 X 1 X 3 0.022744 X 2 X 3
CC = 1.972965 + 0.002359 X 1 + 0.018750 X 2 + 0.046558 X 3 0.000019 X 1 2 0.000409 X 3 2 + 0.000145 X 1 X 2   0.000794 X 2 X 3
TAC = 28.79900 + 0.017400 X 1 + 1.34125 X 2 + 0.143763 X 3 0.000140 X 1 2 0.014660 X 2 2 0.001151 X 3 2 + 0.001080 X 1 X 2 0.000102 X 1 X 3 0.0016787 X 2 X 3
Cy 3 GC = 1.31336 + 0.030458 X 1 0.091875 X 2 0.162049 X 3 0.0000057 X 1 2 0.001364 X 3 2 0.001606 X 2 X 3
TAA DPPH = 602.23625 + 0.617125 X 1 + 23.05500 X 2 + 2.50650 X 3 0.001073 X 1 2 0.182075 X 2 2 0.014942 X 3 2 0.051062 X 2 X 3
TAA CUPRAC = 718.50461 + 2.35178 X 1 + 17.84375 X 2 + 18.39224 X 3 0.003741 X 1 2 0.125680 X 3 2 0.005412 X 1 X 3 0.181000 X 2 X 3
In the mathematical models developed for each response variable, the coefficients of the terms X1, X2, and X3 illustrate the influence of the independent variables’ operating pressure, temperature, and co-solvent concentration, respectively, and their interactions. The mixtures of ethanol/water were tested as a co-solvent concentration based on the proportion of ethanol in order to determine the effect of using different compositions of the co-solvent. The detailed investigation of the variance and accuracy of the models is summarized and presented in Table S2. The R2 values were above 0.95 for all of the investigated responses and the lack of fit was non-significant, implying that all of the models accurately predicted the related responses (p > 0.05). Notably, the linear coefficients (X2 and X3) and quadratic term coefficients (X22 and X32) greatly influence the overall extraction yield (p < 0.05), while the effect of the other term coefficients is moderate (p > 0.05). The statistical analyses indicated the extent of the impact of the main variables on the extraction yields following the order: co-solvent concentration < extraction temperature < extraction pressure.

3.2. Effects of SCO2 Extraction Process Parameters on the Responses

Graphical illustrations of the 3D response surfaces and contour plots showing the regression equations visually are given in Figure 1 and Figure 2. The co-solvent concentration and extraction temperature were the dominant factors for all of the investigated responses. As shown in Figure 1, the extraction yield increases with the increasing pressure and temperature, while decreasing the co-solvent concentration (the proportion of ethanol within co-solvent). The yield of the extraction process was in the range of 2.4–25.1% under the investigated operation conditions (Table 1). The co-solvent concentration was the most effective parameter on the extraction yield in SCO2 (p < 0.05), which is in agreement with the results reported by Monroy et al. [32]. Being green solvents with the possibility of direct use in edible formulations, water and ethanol are commonly preferred due to their low cost. As co-solvents, water-ethanol mixtures have also been demonstrated to be more efficient for obtaining extracts concentrated in phenolic compounds [33]. The highest extraction of phenolic compounds was obtained at the lowest co-solvent percentages used, when the molar fractions of water and ethanol are the lowest and those of carbon dioxide the highest [34].
When the temperature increased from 40 to 60 °C, the phenolic and anthocyanin content of the extracts was increased (Figure 1). This is because raising the temperature in SCO2 extraction using ethanol as a modifier enhances the solubility of (poly)phenols, eventually increasing their extraction. Similar observations were reported in previous studies [35]. As can be seen in Table 1, the phenolic content increased from 50.92 to 63.59 mg GAE/g when the pressure rose from 150 to 250 bar (at 50 °C with co-solvent concentration 20%). However, the total phenolic content and the total anthocyanin content decreased from 4.93 to 1.10 mg GAE/g and from 1.25 to 0.13 mg Cy3GE/g, respectively, when the co-solvent concentration was 100%. The plots showed that the total phenolic and anthocyanin yield increased with the increasing pressure until a specific point, and then decreased if the pressure was raised further. A rise in the pressure can increase the SCO2 fluid density, and can thereby strengthen the interactions between the supercritical fluid and the raw material [36]. Table S2 shows a highly significant positive linear effect of the co-solvent concentration (p < 0.01) on the recoveries of the total phenolic-, catechin- and cyanidin-3-O-glucoside contents.
Figure 2 displays the effects of the SCO2 extraction conditions on antioxidant activity, assessed by the DPPH and CUPRAC assays, respectively. The highest antioxidant power was achieved when 250 bar was applied at 60 °C with a co-solvent concentration of 20% (192.7 and 754.8 mmol TE/g) by the DPPH and CUPRAC assays, respectively. Nevertheless, further increment in the pressure did not produce better results, which is in accordance with the other findings related to the phenolic contents. At a high pressure, the condition may be more favored for complex substances, which may not be responsible for the antioxidant behavior related to DPPH radical scavenging or Cupric ion reducing activity assays. These results are similar to those reported by de Souza et al., who reached the highest phenolic content at 25 MPa from Arctium Lappa leaves [37]. In another work, the maximum (poly)phenols yield was extracted at 250 bar from guayusa leaves [38].

3.3. Verification of Optimal SCO2 Extraction Conditions

For the numerical optimization of the extraction process, the statistical software provided combinations of the factor levels that simultaneously maximize the responses on each dependent variable. The RSM model predicted SCO2 conditions of 280 bar pressure, 60 °C temperature, and 25% EtOH concentration when a co-solvent ratio of 10% (representing the proportion of co-solvent in CO2) applied. The optimal responses with high desirability values are presented in Table 2. To validate the optimal conditions, an extra extraction run was performed, and the actual values were compared with the predicted values (α = 0.05) and were experimentally verified. In a similar work, factors including pressure (150–300 bar), temperature (40–70 °C), co-solvent ratio (5–15%), and time (30–60 min) were assessed for the SCO2 extraction of custard apple peel [39]. The extract had optimal phenolic content and antioxidant activity after 54 min when 261 bar was applied at 52 °C with a co-solvent ratio of 12%. In the study of Bimakr et al., SCO2 extracts from spearmint leaves obtained at 60 °C, 200 bar, for 60 min, yielded comparable results with conventional solvent extraction (Soxhlet extraction with 70% ethanol) [40].

3.4. Comparison of Supercritical CO2 Extraction with Other Extraction Methods

With the aim of comparison, another extraction was performed using anhydrous ethanol as a solvent in sonication extraction (UA-EtOH) for the efficient recovery of both lipophilic and hydrophilic constituents. In addition, the optimal SCO2-aqEtOH extract was also compared with PH-H2O extract, which was obtained in our previous work [21]. The phenolic and anthocyanin contents of these three black rosehip extracts are shown in Table 2. Although UA-EtOH was superior in terms of the phenolic content and antioxidant activity, the SCO2-aqEtOH had the highest anthocyanin content (10.89 ± 1.56 mg Cy3GE/g) among the above mentioned extraction methods. Polar solvents are required for the effective extraction of anthocyanins as they occur as glycoside forms [41]. Despite the higher ability of water to extract anthocyanins being expected, a lower efficiency of anthocyanin extraction by PH-H2O can be explained by the static mode of extraction in the applied procedure [21]. Odabaş and Koca reported optimal microwave assisted aqueous two-phase extraction conditions to isolate black rosehip anthocyanins. An amount of 13.73 mg Cy3GE/g dry fruit was achieved when 26.85% ethanol (w/w) with 19.15% ammonium sulfate (w/w) were used, whereas only 80% ethanol (v/v) as a solvent yielded 14.85 mg Cy3GE/g fruit. However, the authors noted that the use of the ethanol/ammonium sulfate aqueous two-phase system improved the purity of the extract significantly [18].
Taking the obtained values into consideration (Table 2), the performance of the studied dynamic SCO2-aqEtOH extraction procedure is better than static PH-H2O extraction and comparable with those obtained by UA-EtOH to obtain black rosehip (poly)phenols. The higher extraction efficiency of ethanol together with ultrasonication could be attributed to the phenomenon of cavitation, which occurred in the solvent by the passage of an ultrasonic wave [42]. Zor et al. prepared black rosehip flesh extracts using water and acid–added aqueous ethanol using both conventional and ultrasonication methods. The water extracts revealed higher DPPH free radical scavenging activity, independent from the method of extraction [16]. It has been well-established that the choice of the extracting solvent—in other words, the solvent polarity—has significant effects on the extraction yield of phytochemicals [43,44]. Methanol and ethanol are two efficient choices of co-solvents as they are both soluble in supercritical CO2. Although methanol is the solvent with the best results for phenolic compounds, ethanol was preferred, due to safety reasons, for food and environment applications [45]. The use of methanol as a solvent in comparison to ethanol was also investigated by means of UA and maceration extractions. Supplementary Table S3 shows the trend of the yield, TPC, and TAC in black rosehip extracts obtained via different methods and solvents including methanol. The composition of the major phenolic compounds from the black rosehip extracts analyzed by LC-MS/MS are given in Supplementary Figure S2. The individual lipophilic compounds in different black rosehip extracts and fruit parts are summarized in Table 3.
Carotenoids and vitamin E congeners are lipophilic constituents present in rosehip and may differ in content or composition owing to genetic and time variations, the degree of maturation and the analytical protocol [8]. The results in Table 3 suggested that SCO2 extraction modified by aqueous ethanol as a co-solvent is capable of dissolving a greater variety of phenolic compounds. β-carotene was the major carotenoid in all of the black rosehip samples, followed by zeaxanthin, with 24.5–7.0 times lower concentrations in the SCO2-aqEtOH extract than the UA-EtOH extract (Table 3). On the other hand, the vitamin E content of the SCO2-aqEtOH extract was significantly higher than that of the UA-EtOH extract (p < 0.05) due to the smaller lipophilic nature of α-tocopherol than β-carotene. The tocopherol content of the black rosehip flesh was 136.93 ± 1.09 µg/g dw. Andersson et al. found a mean annual tocopherol content of 187.6 ± 16.9 μg/g dw in seedless black rosehip sampled at different harvesting times, which is also higher than in other Rosa species, such as R. rubiginosa and R. dumalis [9].

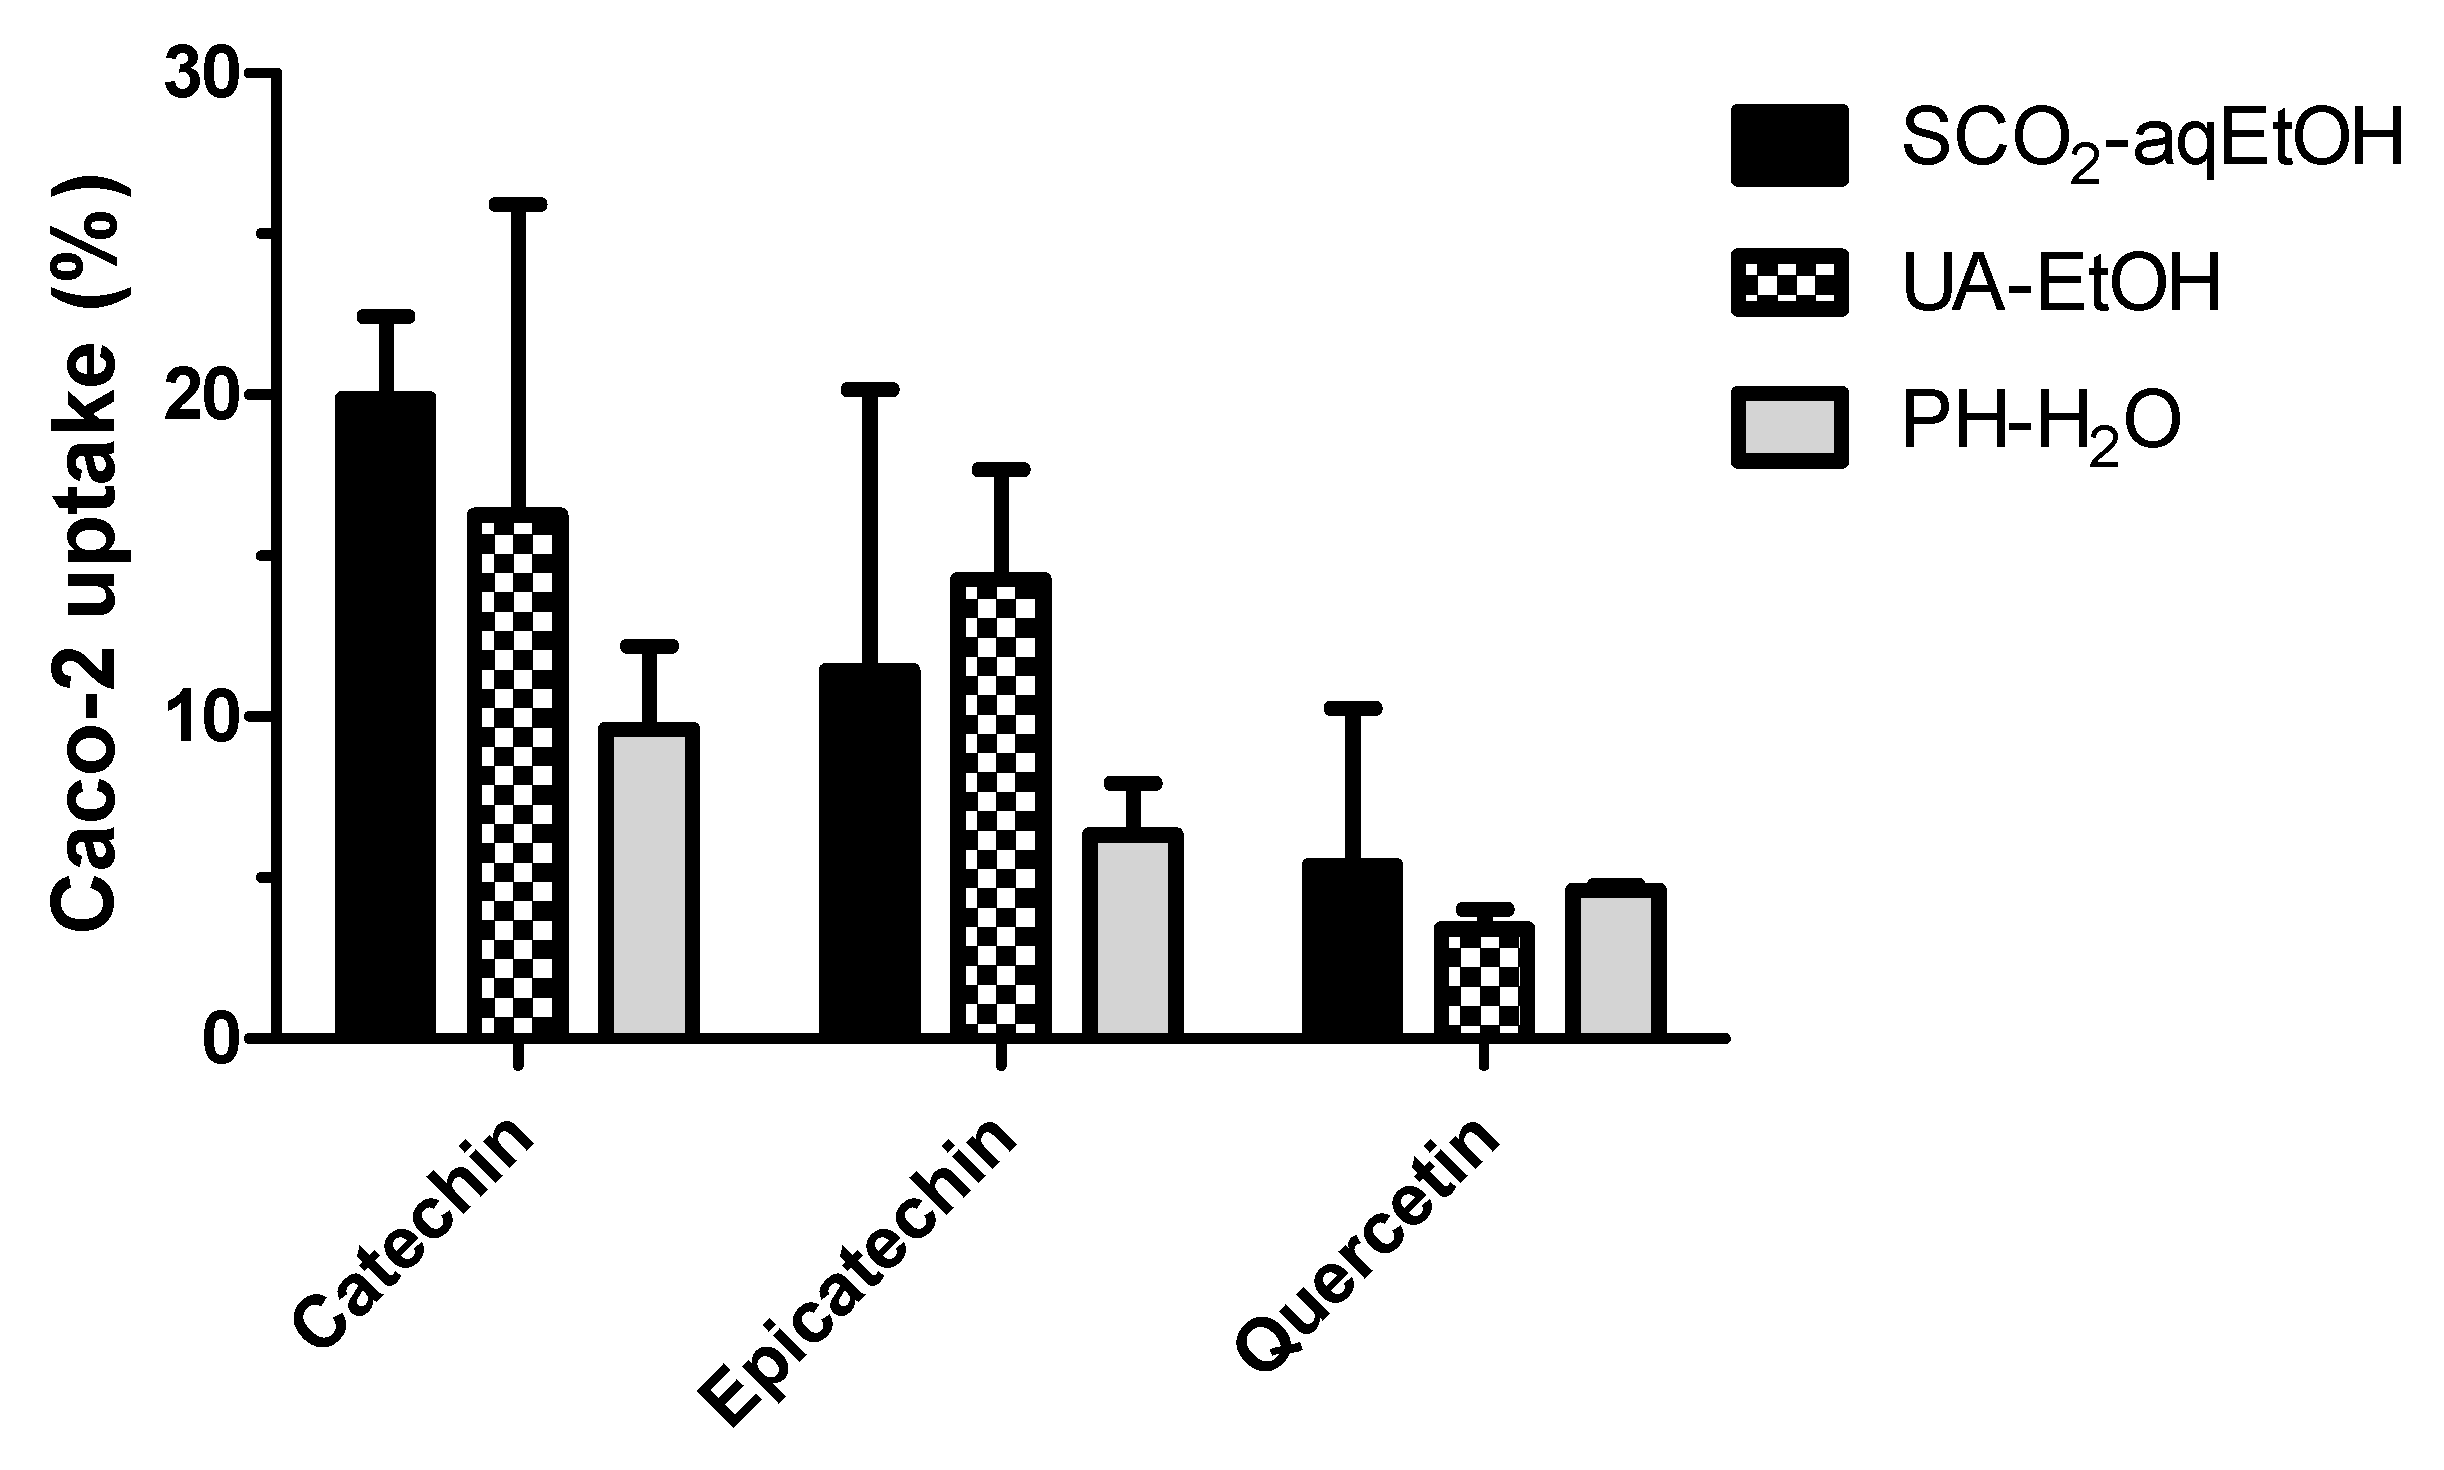
3.5. Bioaccessibility and Caco-2 Uptake of Phenolic Compounds

The phenolic compounds that were predominantly present in the black rosehip extracts were measured in the bioaccessibility and cellular uptake studies. The in vitro digestive stability, solubility, and bioaccessibility of the phenolic compounds from the SCO2-aqEtOH, UA-EtOH and PH-H2O extracts are displayed in Table 4. The in vitro digestive stability of all the phenolic compounds was low (24.33–44.47%), with no significant differences between the different extraction methods (p > 0.05), with the exception of vanillin. The digestive stability of vanillin from the UA-EtOH extract was significantly lower. The in vitro solubility of catechin was the highest (≈40%), followed by epicatechin (30.29–34.17%), vanillin (25.45–30.19%) and quercetin-3-O-glucoside (20.96–26.72%). The quercetin-3-O-glucoside was also the only phenolic that had a difference between the in vitro solubility from the different extracts, and that from the PH-H2O extract was significantly lower than that from the SCO2-aqEtOH extract. The changes in the phenolic compound profile after in vitro digestion (Supplementary Table S4) may occur due to the interactions with other substances in the gastrointestinal environment [46]. Despite the isolated differences, it is important to note that there were no overall differences (p > 0.05) between the digestive stability and in vitro solubility of the different phenolic compounds.
As expected, the bioaccessibility of the phenolics was slightly lower than the solubility, and, overall, there was no difference between the bioaccessibility of the phenolics from the SCO2-aqEtOH and UA-EtOH extracts (p > 0.05). The in vitro digestion studies are important because they estimate the actual amount of soluble and accessible phenolic compounds available for absorption and potential biological function at the intestinal level [47]. Interestingly, there was constant differences between the bioaccessibility of the phenolics from the SCO2-aqEtOH and PH-H2O extract. These variations could be accredited to the lower solubility of these phenolic compounds or the affinity of digestive enzymes to these compounds from the PH-H2O extract. In contrast to the other extracts, the dried form of the PH-H2O extract used in the digestion experiments was obtained via freeze drying, which could lead to the formation of a crystalline structure [48]. The solubility of crystalline substances is lower than amorphous ones as they are thermodynamically stable [49]. The deposition form of the carotenoids has previously been postulated to exert a crucial influence on their bioavailability [50].
The bioaccessibility of quercetin-3-O-glucoside was found to be the lowest. Notably, after digestion, a new compound, quercetin, was observed in the extracts, due to the hydrolysis of the glycosidic bonds upon digestion. Hence, the release of the aglycone compound quercetin occurred [51]. The major phenolics present in black rosehip are flavan-3-ols, namely catechin and epicatechin as monomers, as well as oligomers of these two monomers (dimers and trimers) [10]. They are known to be unstable under alkaline intestinal conditions due to chemical changes, including oxidation, polymerization and transformation [52]. Up to 65% loss in the monomeric flavan-3-ols content was found after in vitro digestion (Table 4). A higher loss (around 90%) was reported for pure (+)-catechin [53].
The cellular uptake of the bioaccessible (digested) catechin, epicatechin, and quercetin from the different black rosehip extracts are illustrated in Figure 3. The uptake results of the Caco-2 cell model experiments are calculated as the percentage of the amount taken up in the cells, and the remaining phenolic compounds were stable after the 3 h incubation period. The results indicated that the studied extracts had different degrees of cellular absorption for each phenolic compound. However, no significant differences were observed in terms of the cellular uptake of the phenolic compounds extracted via different methods (p > 0.05). A higher degree of cellular absorption correlated with a higher stability of the compounds. In the case of the PH-H2O extract, it possessed a considerably lower phenolic absorption rate compared to other two extracts (p < 0.05). These phenolic compounds are normally assumed to be absorbed through passive diffusion in Caco-2 cells, where a higher concentration presented to the cells would result in increased cellular uptake [54]. A linear relationship between the dose and uptake was also suggested for chlorogenic acid [55].

3.6. Cytotoxicity of Black Rosehip Extracts

The cytotoxicity of the extracts was determined with Caco-2 cells using the neutral uptake assay. The histogram reported in Supplementary Figure S3 represents the viability of the cells after 3 h of incubation with black rosehip extracts obtained via different methods and grape pomace extract obtained using ultrasound assisted ethanol extraction, included in the medium in different amounts and expressed as mg/mL. The extracts substantially reduced the viability of the Caco-2 cells after incubation for 3 h (p < 0.05), with no significant differences among extraction methods (p > 0.05). Indeed, given 80% viability as the lowest acceptable limit, all of the extracts were shown to be safe up to a concentration of 15 mg/mL. In the literature, the cytotoxic potential of plant extracts is usually studied at lower concentrations and for longer time periods, such as 24 h. In this study, higher concentrations were applied for a shorter time period to more closely simulate the conditions during gastrointestinal digestion. In the hydromethanolic extracts of grape pomace, a concentration higher than 400 µg/mL was reported to achieve a 50% growth inhibition in human tumor cell lines in 24 h [56]. Salau, Yakubu, and Oladiji investigated the cytotoxic activity of the aqueous extracts of two traditional herbs: Anogeissus leiocarpus and Terminalia avicennioides root barks in Ehrlich Ascites Carcinoma cells for 3 h and 24 h. They reported 80% viability for approximately 10 and 5 µg/mL of plant extract in 3 h and 24 h incubation, respectively [57].

4. Conclusions

Our results highlight the importance of co-solvent polarity and temperature as the main experimental factors determining the yield of (poly)phenolic compounds when using SCO2 extraction. The optimal extract contained a superior content of anthocyanin and comparable amounts of phenolic content to those obtained by UA-EtOH, without the need to use vast amounts of organic solvents. The nature of the applied procedure and the solvent, overall, determined the selectivity of the extraction process. Hence, aqueous ethanol modified supercritical carbon dioxide and ultrasound assisted extraction were the best ‘green’ methods in our experimental settings for the recovery of phenolic compounds from black rosehip. However, the use of anhydrous ethanol as a solvent is not recommended for anthocyanin extraction. Furthermore, the bioaccessibility and cellular uptake of the individual phenolic compounds did not differ significantly among the tested extracts. The optimized models provide important knowledge about the supercritical extraction of black rosehip using a carbon dioxide + ethanol/water mixture as a solvent for future studies in terms of a process scale-up. However, more research is needed in this area to obtain a more complete profile of the phenolic composition of the obtained extracts. Future studies should focus on the investigation of other ’green’ solvents to further improve the extraction efficiency for hydrophilic and lipophilic bioactive compounds from black rosehip. Being rich in a variety of (poly)phenolic compounds, black rosehip extracts can be used as an alternative source to provide natural additives in potential food and beverage formulations, as well as dietary supplements.

Supplementary Materials

The following supporting information can be downloaded at: https://www.mdpi.com/article/10.3390/foods12040781/s1, Figure S1: Morphology of fresh black rosehips; Figure S2: Composition of the major phenolic compounds from black rosehip extracts analyzed by LC-MS/MS. MeOH represents the black rosehip extract obtained by maceration using methanol as a solvent for 60 min; Figure S3: Cell viabilities of the Caco-2 cells after the treatment of different black rosehip extracts at varying doses (mg/mL). The bars represent the standard deviation (n = 3); Table S1: Independent variables and their coded and actual values used for optimization in Box-Behnken design; Table S2: Analysis of variance (ANOVA) of the regression model for the analyzed responses in SCO2-aqEtOH extraction; Table S3: Effect of the extraction method and solvent on the yield, total phenolic content (TPC), and total anthocyanin content (TAC); Table S4: Changes in the phenolic compounds in different black rosehip extracts during in vitro digestion. The results are expressed as µg/mL digesta.

Author Contributions

Conceptualization, K.N.K., J.K., M.G.-Ö. and B.Ö.; methodology, K.N.K., M.G.-Ö. and B.Ö.; software, K.N.K. and M.G.-Ö.; validation, K.N.K. and M.G.-Ö.; formal analysis, K.N.K., J.K. and A.B.-D.; investigation, K.N.K. and A.B.-D.; resources, A.B.-D., J.F. and B.Ö.; data curation, K.N.K. and J.K.; writing—original draft preparation, K.N.K.; writing—review and editing, K.N.K., J.K., M.G.-Ö. and J.F.; visualization, K.N.K. and J.K.; supervision, J.K., J.F. and B.Ö.; project administration, A.B.-D., J.F. and B.Ö.; funding acquisition, J.F. and B.Ö. All authors have read and agreed to the published version of the manuscript.

Funding

This research was supported by The Scientific and Technological Research Council of Turkey with 2214-A International Research Fellowship for PhD Students (application number: 53325897-115.02-166509).

Data Availability Statement

The data are contained within the article or the Supplementary Materials.

Acknowledgments

The authors thank Aromsa A.Ş. in Kocaeli, Turkey, for their support.

Conflicts of Interest

The authors declare no conflict of interest.

References

  1. Płotka-Wasylka, J.; Rutkowska, M.; Owczarek, K.; Tobiszewski, M.; Namieśnik, J. Extraction with Environmentally Friendly Solvents. TrAC Trends Anal. Chem. 2017, 91, 12–25. [Google Scholar] [CrossRef]
  2. Pereira, C.G.; Meireles, M.A.A. Supercritical Fluid Extraction of Bioactive Compounds: Fundamentals, Applications and Economic Perspectives. Food Bioprocess Technol. 2009, 3, 340–372. [Google Scholar] [CrossRef]
  3. da Silva, R.P.F.F.; Rocha-Santos, T.A.P.; Duarte, A.C. Supercritical Fluid Extraction of Bioactive Compounds. TrAC Trends Anal. Chem. 2016, 76, 40–51. [Google Scholar] [CrossRef]
  4. Piantino, C.R.; Aquino, F.W.B.; Follegatti-Romero, L.A.; Cabral, F.A. Supercritical CO2 Extraction of Phenolic Compounds from Baccharis dracunculifolia. J. Supercrit. Fluids 2008, 47, 209–214. [Google Scholar] [CrossRef]
  5. Bubalo, M.C.; Vidović, S.; Radojčić Redovniković, I.; Jokić, S. New Perspective in Extraction of Plant Biologically Active Compounds by Green Solvents. Food Bioprod. Process. 2018, 109, 52–73. [Google Scholar] [CrossRef]
  6. Pimentel-Moral, S.; Borrás-Linares, I.; Lozano-Sánchez, J.; Arráez-Román, D.; Martínez-Férez, A.; Segura-Carretero, A. Supercritical CO2 Extraction of Bioactive Compounds from Hibiscus sabdariffa. J. Supercrit. Fluids 2019, 147, 213–221. [Google Scholar] [CrossRef]
  7. Paini, M.; Casazza, A.A.; Aliakbarian, B.; Perego, P.; Binello, A.; Cravotto, G. Influence of Ethanol/Water Ratio in Ultrasound and High-Pressure/High-Temperature Phenolic Compound Extraction from Agri-Food Waste. Int. J. Food Sci. Technol. 2016, 51, 349–358. [Google Scholar] [CrossRef]
  8. Andersson, S.C.; Rumpunen, K.; Johansson, E.; Olsson, M.E. Carotenoid Content and Composition in Rose Hips (Rosa spp.) during Ripening, Determination of Suitable Maturity Marker and Implications for Health Promoting Food Products. Food Chem. 2011, 128, 689–696. [Google Scholar] [CrossRef]
  9. Andersson, S.C.; Olsson, M.E.; Gustavsson, K.E.; Johansson, E.; Rumpunen, K. Tocopherols in Rose Hips (Rosa spp.) during Ripening. J. Sci. Food Agric. 2012, 92, 2116–2121. [Google Scholar] [CrossRef]
  10. Dabić Zagorac, D.; Fotirić Akšić, M.M.; Glavnik, V.; Gašić, U.M.; Vovk, I.; Tešić, Ž.L.; Natić, M.M. Establishing the Chromatographic Fingerprints of Flavan-3-Ols and Proanthocyanidins from Rose Hip (Rosa sp.) Species. J. Sep. Sci. 2020, 43, 1431–1439. [Google Scholar] [CrossRef]
  11. Kazancı, C.; Oruç, S.; Mosulishvili, M. Medicinal Ethnobotany of Wild Plants: A Cross-Cultural Comparison around Georgia-Turkey Border, the Western Lesser Caucasus. J. Ethnobiol. Ethnomed. 2020, 16, 1–20. [Google Scholar] [CrossRef]
  12. Altundag, E.; Ozturk, M. Ethnomedicinal Studies on the Plant Resources of East Anatolia, Turkey. Procedia Soc. Behav. Sci. 2011, 19, 756–777. [Google Scholar] [CrossRef]
  13. Boyd, P.D.A. Scots Roses and Related Cultivars of Rosa Spinosissima—A Review. In Proceedings of the Acta Horticulturae; International Society for Horticultural Science, Hannover, Germany, 25 January 2013; Volume 1064, pp. 21–30. [Google Scholar]
  14. Pashazadeh, H.; Özdemir, N.; Zannou, O.; Koca, I. Antioxidant Capacity, Phytochemical Compounds, and Volatile Compounds Related to Aromatic Property of Vinegar Produced from Black Rosehip (Rosa pimpinellifolia L.) Juice. Food Biosci. 2021, 44, 101318. [Google Scholar] [CrossRef]
  15. Szołtysik, M.; Kucharska, A.Z.; Sokół-Ł etowska, A.; Dabrowska, A.; Bobak, Ł.; Chrzanowska, J. The Effect of Rosa Spinosissima Fruits Extract on Lactic Acid Bacteria Growth and Other Yoghurt Parameters. Foods 2020, 9, 1167. [Google Scholar] [CrossRef]
  16. Zor, M.; Sengul, M. Possibilities of Using Extracts Obtained from Rosa pimpinellifolia L. Flesh and Seeds in Ice Cream Production. J. Food Process. Preserv. 2022, 46, e16225. [Google Scholar] [CrossRef]
  17. Sokoł-Łȩtowska, A.; Kucharska, A.Z.; Wińska, K.; Szumny, A.; Nawirska-Olszańska, A.; Mizgier, P.; Wyspiańska, D. Composition and Antioxidant Activity of Red Fruit Liqueurs. Food Chem. 2014, 157, 533–539. [Google Scholar] [CrossRef]
  18. Odabaş, H.İ.; Koca, I. Simultaneous Separation and Preliminary Purification of Anthocyanins from Rosa pimpinellifolia L. Fruits by Microwave Assisted Aqueous Two-Phase Extraction. Food Bioprod. Process. 2021, 125, 170–180. [Google Scholar] [CrossRef]
  19. Zor, M.; Şengül, M.; Topdaş, E.F.; Yılmaz, B. Physicochemical Properties, Antioxidant Activities, and Chemical Compositions of Extracts Obtained from Rosa pimpinellifolia L. Flesh and Seeds Using Different Methods and Solvents. Erwerbs-Obstbau 2022, 1–17. [Google Scholar] [CrossRef]
  20. Casazza, A.A.; Aliakbarian, B.; Mantegna, S.; Cravotto, G.; Perego, P. Extraction of Phenolics from Vitis Vinifera Wastes Using Non-Conventional Techniques. J. Food Eng. 2010, 100, 50–55. [Google Scholar] [CrossRef]
  21. Kasapoğlu, K.N.; Demircan, E.; Gültekin-Özgüven, M.; Kruger, J.; Frank, J.; Arslaner, A.; Özçelik, B. Recovery of Polyphenols Using Pressurized Hot Water Extraction (PHWE) from Black Rosehip Followed by Encapsulation for Increased Bioaccessibility and Antioxidant Activity. Molecules 2022, 27, 6807. [Google Scholar] [CrossRef]
  22. Wojtunik-Kulesza, K.; Oniszczuk, A.; Oniszczuk, T.; Combrzyński, M.; Nowakowska, D.; Matwijczuk, A. Influence of In Vitro Digestion on Composition, Bioaccessibility and Antioxidant Activity of Food Polyphenols—A Non-Systematic Review. Nutrients 2020, 12, 1401. [Google Scholar] [CrossRef]
  23. Altin, G.; Gültekin-Özgüven, M.; Ozcelik, B. Chitosan Coated Liposome Dispersions Loaded with Cacao Hull Waste Extract: Effect of Spray Drying on Physico-Chemical Stability and in Vitro Bioaccessibility. J. Food Eng. 2018, 223, 91–98. [Google Scholar] [CrossRef]
  24. Lee, J.; Durst, R.; Wrolstad, R. Aoac Official Method 2005.02: Total Monomeric Anthocyanin Pigment Content of Fruit Juices, Beverages, Natural Colorants, and Wines by the PH Differential Method. In Offical Methods of Analysis of AOAC International; Horowitz, H., Ed.; AOAC: Washington, DC, USA, 2005. [Google Scholar]
  25. Apak, R.; Güçlü, K.; Özyürek, M.; Esi˙n Karademi˙r, S.; Altun, M. Total Antioxidant Capacity Assay of Human Serum Using Copper(II)-Neocuproine as Chromogenic Oxidant: The CUPRAC Method. Free. Radic. Res. 2005, 39, 949–961. [Google Scholar] [CrossRef]
  26. Şensu, E.; Kasapoğlu, K.N.; Gültekin-Özgüven, M.; Demircan, E.; Arslaner, A.; Özçelik, B. Orange, Red and Purple Barberries: Effect of in-Vitro Digestion on Antioxidants and ACE Inhibitors. LWT 2021, 140, 110820. [Google Scholar] [CrossRef]
  27. Montoya-Arroyo, A.; Toro-González, C.; Sus, N.; Warner, J.; Esquivel, P.; Jiménez, V.M.; Frank, J. Vitamin E and Carotenoid Profiles in Leaves, Stems, Petioles and Flowers of Stinging Nettle (Urtica leptophylla Kunth) from Costa Rica. J. Sci. Food Agric. 2022, 102, 6340–6348. [Google Scholar] [CrossRef]
  28. Grebenstein, N.; Frank, J. Rapid Baseline-Separation of All Eight Tocopherols and Tocotrienols by Reversed-Phase Liquid-Chromatography with a Solid-Core Pentafluorophenyl Column and Their Sensitive Quantification in Plasma and Liver. J. Chromatogr. A 2012, 1243, 39–46. [Google Scholar] [CrossRef]
  29. Flory, S.; Benz, A.K.; Frank, J. Uptake and Time-Dependent Subcellular Localization of Native and Micellar Curcumin in Intestinal Cells. BioFactors 2022, 48, 897–907. [Google Scholar] [CrossRef]
  30. Kruger, J.; Sus, N.; Frank, J. Ascorbic Acid, Sucrose and Olive Oil Lipids Mitigate the Inhibitory Effects of Pectin on the Bioaccessibility and Caco-2 Cellular Uptake of Ferulic Acid and Naringenin. Food Funct. 2020, 11, 4138–4145. [Google Scholar] [CrossRef]
  31. Ghoreishi, S.M.; Heidari, E. Extraction of Epigallocatechin-3-Gallate from Green Tea via Supercritical Fluid Technology: Neural Network Modeling and Response Surface Optimization. J. Supercrit. Fluids 2013, 74, 128–136. [Google Scholar] [CrossRef]
  32. Monroy, Y.M.; Rodrigues, R.A.F.; Sartoratto, A.; Cabral, F.A. Influence of Ethanol, Water, and Their Mixtures as Co-Solvents of the Supercritical Carbon Dioxide in the Extraction of Phenolics from Purple Corn Cob (Zea mays L.). J. Supercrit. Fluids 2016, 118, 11–18. [Google Scholar] [CrossRef]
  33. Pagano, I.; Piccinelli, A.L.; Celano, R.; Campone, L.; Gazzerro, P.; Russo, M.; Rastrelli, L. Pressurized Hot Water Extraction of Bioactive Compounds from Artichoke By-Products. Electrophoresis 2018, 39, 1899–1907. [Google Scholar] [CrossRef]
  34. Da Porto, C.; Natolino, A.; Decorti, D. Extraction of Proanthocyanidins from Grape Marc by Supercritical Fluid Extraction Using CO2 as Solvent and Ethanol–Water Mixture as Co-Solvent. J. Supercrit. Fluids 2014, 87, 59–64. [Google Scholar] [CrossRef]
  35. Castro-Vargas, H.I.; Rodríguez-Varela, L.I.; Ferreira, S.R.S.; Parada-Alfonso, F. Extraction of Phenolic Fraction from Guava Seeds (Psidium guajava L.) Using Supercritical Carbon Dioxide and Co-Solvents. J. Supercrit. Fluids 2010, 51, 319–324. [Google Scholar] [CrossRef]
  36. Maran, J.P.; Priya, B.; Manikandan, S. Modeling and Optimization of Supercritical Fluid Extraction of Anthocyanin and Phenolic Compounds from Syzygium Cumini Fruit Pulp. J. Food Sci. Technol. 2014, 51, 1938–1946. [Google Scholar] [CrossRef]
  37. de Souza, A.R.C.; Guedes, A.R.; Folador Rodriguez, J.M.; Bombardelli, M.C.M.; Corazza, M.L. Extraction of Arctium Lappa Leaves Using Supercritical CO2+ ethanol: Kinetics, Chemical Composition, and Bioactivity Assessments. J. Supercrit. Fluids 2018, 140, 137–146. [Google Scholar] [CrossRef]
  38. Cadena-Carrera, S.; Tramontin, D.P.; Bella Cruz, A.; Bella Cruz, R.C.; Müller, J.M.; Hense, H. Biological Activity of Extracts from Guayusa Leaves (Ilex guayusa Loes.) Obtained by Supercritical CO2 and Ethanol as Cosolvent. J. Supercrit. Fluids 2019, 152, 104543. [Google Scholar] [CrossRef]
  39. Tai, H.P.; Hong, C.T.T.; Huu, T.N.; Thi, T.N. Extraction of Custard Apple (Annona squamosal L.) Peel with Supercritical CO2 and Ethanol as Co-Solvent. J. Food Process. Preserv. 2022, 46, e17040. [Google Scholar] [CrossRef]
  40. Bimakr, M.; Rahman, R.A.; Taip, F.S.; Ganjloo, A.; Salleh, L.M.; Selamat, J.; Hamid, A.; Zaidul, I.S.M. Comparison of Different Extraction Methods for the Extraction of Major Bioactive Flavonoid Compounds from Spearmint (Mentha spicata L.) Leaves. Food Bioprod. Process. 2011, 89, 67–72. [Google Scholar] [CrossRef]
  41. Trikas, E.D.; Papi, R.M.; Kyriakidis, D.A.; Zachariadis, G.A. A Sensitive LC-MS Method for Anthocyanins and Comparison of Byproducts and Equivalent Wine Content. Separations 2016, 3, 18. [Google Scholar] [CrossRef]
  42. Maran, J.P.; Priya, B.; Nivetha, C.V. Optimization of Ultrasound-Assisted Extraction of Natural Pigments from Bougainvillea Glabra Flowers. Ind. Crops Prod. 2015, 63, 182–189. [Google Scholar] [CrossRef]
  43. Hayouni, E.A.; Abedrabba, M.; Bouix, M.; Hamdi, M. The Effects of Solvents and Extraction Method on the Phenolic Contents and Biological Activities in Vitro of Tunisian Quercus coccifera L. and Juniperus phoenicea L. Fruit Extracts. Food Chem. 2007, 105, 1126–1134. [Google Scholar] [CrossRef]
  44. Zombe, K.; Nyirenda, J.; Lumai, A.; Phiri, H. Impact of Solvent Type on Total Phenol and Flavonoid Content and Sun Protection Factor of Crude Cashew Nutshell Liquid. Sustain. Chem. 2022, 3, 334–344. [Google Scholar] [CrossRef]
  45. Xiao, W.; Han, L.; Shi, B. Microwave-Assisted Extraction of Flavonoids from Radix Astragali. Sep. Purif. Technol. 2008, 62, 614–618. [Google Scholar] [CrossRef]
  46. Czubinski, J.; Wroblewska, K.; Czyzniejewski, M.; Górnaś, P.; Kachlicki, P.; Siger, A. Bioaccessibility of Defatted Lupin Seed Phenolic Compounds in a Standardized Static in Vitro Digestion System. Food Res. Int. 2019, 116, 1126–1134. [Google Scholar] [CrossRef]
  47. Patil, S.; Vedashree, M.; Murthy, P.S. Phytochemical Profile and Antioxidant Potential of Coffee Leaves Influenced by Green Extraction Techniques and in Vitro Bio-Accessibility of Its Functional Compounds. J. Food Meas. Charact. 2022, 16, 2335–2346. [Google Scholar] [CrossRef]
  48. Levin, P.; Meunier, V.; Kessler, U.; Heinrich, S. Influence of Freezing Parameters on the Formation of Internal Porous Structure and Its Impact on Freeze-Drying Kinetics. Process. 2021, 9, 1273. [Google Scholar] [CrossRef]
  49. Yadav, D.; Kumar, N. Nanonization of Curcumin by Antisolvent Precipitation: Process Development, Characterization, Freeze Drying and Stability Performance. Int. J. Pharm. 2014, 477, 564–577. [Google Scholar] [CrossRef]
  50. Schweiggert, R.M.; Mezger, D.; Schimpf, F.; Steingass, C.B.; Carle, R. Influence of Chromoplast Morphology on Carotenoid Bioaccessibility of Carrot, Mango, Papaya, and Tomato. Food Chem. 2012, 135, 2736–2742. [Google Scholar] [CrossRef]
  51. Valentová, K.; Vrba, J.; Bancířová, M.; Ulrichová, J.; Křen, V. Isoquercitrin: Pharmacology, Toxicology, and Metabolism. Food Chem. Toxicol. 2014, 68, 267–282. [Google Scholar] [CrossRef]
  52. Rodríguez, M.; Tironi, V.A. Polyphenols in Amaranth (A. manteggazianus) Flour and Protein Isolate: Interaction with Other Components and Effect of the Gastrointestinal Digestion. Food Res. Int. 2020, 137, 109524. [Google Scholar] [CrossRef]
  53. Oliveira, A.; Pintado, M. In Vitro Evaluation of the Effects of Protein–Polyphenol–Polysaccharide Interactions on (+)-Catechin and Cyanidin-3-Glucoside Bioaccessibility. Food Funct. 2015, 6, 3444–3453. [Google Scholar] [CrossRef]
  54. Bohn, T.; Mcdougall, G.J.; Alegría, A.; Alminger, M.; Arrigoni, E.; Aura, A.M.; Brito, C.; Cilla, A.; El, S.N.; Karakaya, S.; et al. Mind the Gap—Deficits in Our Knowledge of Aspects Impacting the Bioavailability of Phytochemicals and Their Metabolites—A Position Paper Focusing on Carotenoids and Polyphenols. Mol. Nutr. Food Res. 2015, 59, 1307–1323. [Google Scholar] [CrossRef] [PubMed]
  55. Erk, T.; Hauser, J.; Williamson, G.; Renouf, M.; Steiling, H.; Dionisi, F.; Richling, E. Structure– and Dose–Absorption Relationships of Coffee Polyphenols. BioFactors 2014, 40, 103–112. [Google Scholar] [CrossRef]
  56. Peixoto, C.M.; Dias, M.I.; Alves, M.J.; Calhelha, R.C.; Barros, L.; Pinho, S.P.; Ferreira, I.C.F.R. Grape Pomace as a Source of Phenolic Compounds and Diverse Bioactive Properties. Food Chem. 2018, 253, 132–138. [Google Scholar] [CrossRef] [PubMed]
  57. Salau, A.; Yakubu, M.; Oladiji, A. Cytotoxic Activity of Aqueous Extracts of Anogeissus Leiocarpus and Terminalia Avicennioides Root Barks against Ehrlich Ascites Carcinoma Cells. Indian J. Pharmacol. 2013, 45, 381. [Google Scholar] [CrossRef] [PubMed] [Green Version]
Figure 1. Response surface plots for the interactive effects of (A) pressure and temperature; (B) extraction pressure and co-solvent concentration; (C) temperature and co-solvent concentration on the extraction yield, total phenolics content (TPC) and total anthocyanin content (TAC) recovered from black rosehip. The excluded variable was fixed at its optimal point.
Foods 12 00781 g001
Figure 2. Contour plots for the interactive effects of (A) pressure and temperature; (B) extraction pressure and co-solvent concentration; (C) temperature and co-solvent concentration on the catechin- (CC), cyanidin-3-O-glucoside contents (Cy3GC), and total antioxidant activity (DPPH and CUPRAC assays) in black rosehip. The excluded variable was fixed at its optimal point.
Foods 12 00781 g002
Figure 3. Cellular uptake of phenolics compounds from different black rosehip extracts.
Foods 12 00781 g003
Table 1. Experimental conditions and responses obtained defined by the BBD design matrix for the extraction yield, phenolic-, anthocyanin content, and antioxidant activity in black rosehip.
FactorsExperimental Values
RunX1 (bar)X2 (°C)X3 (%)YTPCCCTACCy3GCTAADTAAC
1250506021.667.743.369.047.91136.2573.9
1250506021.667.743.369.047.91136.2573.9
2250506017.856.733.129.156.77122.9558.2
3250401002.412.890.972.032.4515.884.0
4250402013.744.293.537.987.41112.0491.4
5350501003.11.100.440.131.268.620.3
635040601545.822.833.357.31107.1434.0
7250506021.855.693.067.926.70113.3593.5
8350606019.558.972.996.657.00121.1629.0
9150606014.948.072.746.015.90104.4553.1
10250602019.872.874.599.959.03192.7754.8
11250506017.454.052.959.167.98118.7554.5
12150501003.74.930.461.251.0116.742.7
13250506018.260.102.867.847.26138.6519.8
14150406012.932.233.167.036.6255.4426.6
15150502019.450.923.839.828.31167.9582.0
16350502025.163.594.1710.347.71172.0646.2
17250601004.55.080.761.301.5014.857.8
Abbreviations: Y, yield% (w/w). TPC, total phenolic content (mg GAE/g). CC, catechin content (mg/g). TAC, total anthocyanin content (Cy3GE/g). Cy3GC, cyanidin-3-O-glucoside content (mg/g). TAAD-DPPH and TAAC-CUPRAC, total antioxidant activity by DPPH and CUPRAC assays (mmol TE/g). All in dry basis.
Table 2. Predicted and experimental values of the response variables at optimal conditions for SCO2 and other extraction methods.
CharacteristicsExtraction Methods
SCO2-aqEtOHUA-EtOH 2PH-H2O 3
Predicted Experimental 1 Experimental
Y (%, w/w)22.02424.05 ± 1.54 B23.81 ± 0.92 B27.90 ± 1.60 A
TPC (mg GAE/g)77.10976.58 ± 4.25 AB81.02 ± 3.07 A68.90 ± 3.94 B
CC (mg/g)4.4534.65 ± 0.39 A4.36 ± 0.86 A3.90 ± 0.21 A
TAC (Cy3GE/g)10.59810.89 ± 1.56 A6.05 ± 0.75 B5.28 ± 0.41 B
Cy3GC (mg/g)9.0239.05 ± 1.02 A4.39 ± 0.42 B4.08 ± 0.51 B
TAADPPH (mmol TE/g)190.976193.2 ± 7.4 B206.1 ± 11.3 AB228.3 ± 16.3 A
TAACUPRAC (mmol TE/g)789.168798.2 ± 12.8 B840.3 ± 17.5 B930.5 ± 24.4 A
Different letters indicate significant differences between the extracts (p < 0.05). 1 Extract obtained at optimum conditions of SCO2 extraction, 90:10 (CO2: aqueous EtOH), solvent-solid ratio 1:25, 60 min (dynamic). Desirability = 0.995; 2 Extract obtained by ultrasound assisted ethanol at 24 °C, solvent-solid ratio 1:10, 60 min (static); 3 Extract obtained by pressurized hot water at 75 °C, 100 bar, solvent-solid ratio 1:10, 60 min (static); Abbreviations: Y, yield; TPC, total phenolic content; CC, catechin content; TAC, total anthocyanin content; Cy3GC, cyanidin-3-O-glucoside content; TAA-DPPH and TAA-CUPRAC, total antioxidant activity by DPPH and CUPRAC assays. All in dry basis.
Table 3. Lipophilic compounds (µg/g dw) of black rosehip and its extracts obtained using different extraction methods.
UA-EtOH ExtractSCO2-aqEtOH ExtractFruit *
Carotenoids
Lutein1.04 ± 0.030.18 ± 0.011.08 ± 0.16
Zeaxanthin5.46 ± 0.360.77 ± 0.034.44 ± 0.67
β-cryptroxanthin1.28 ± 0.030.23 ± 0.010.80 ± 0.11
β-carotene106.90 ± 2.674.36 ± 0.1810.75 ± 0.91
Total carotenoids114.69 ± 3.0917.07 ± 1.845.53 ± 0.22
Vitamin E congeners
δ-Tocotrienol1.72 ± 0.122.87 ± 0.12nd
β-Tocotrienolndndnd
γ-Tocotrienol0.10 ± 0.050.38 ± 0.020.48 ± 0.25
α-Tocotrienol45.53 ± 3.56121.76 ± 4.922.05 ± 1.26
δ-Tocopherol0.12 ± 0.031.07 ± 0.040.26 ± 0.04
β-Tocopherol1.38 ± 0.198.57 ± 0.350.23 ± 0.07
γ-Tocopherol2.17 ± 0.239.64 ± 0.392.99 ± 0.33
α-Tocopherol5.27 ± 0.2773.05 ± 2.959.49 ± 2.35
Total tocotrienols47.4 ± 3.6125.0 ± 5.12.5 ± 1.5
Total tocopherols8.9 ± 0.392.3 ± 3.713.0 ± 2.3
Total vitamin E56.4 ± 3.4217.3 ± 8.815.5 ± 3.7
* denotes black rosehip fruit consisting of flesh and seed. nd: not detected.
Table 4. In vitro stability, solubility, and bioaccessibility of phenolic compounds from different black rosehip extracts.
ExtractNondigested (µg/mL)Stability 1 (%)Solubility 2 (%)Bioaccessibility 3 (%)
Catechin
SCO2-aqEtOH1070.4 ± 23.9 B42.94 ± 4.60 A37.48 ± 7.72 A30.17 ± 3.12 A
UA-EtOH1642.5 ± 262.2 A44.16 ± 4.90 A39.24 ± 6.01 A30.32 ± 1.39 A
PH-H2O961.1 ± 37.4 B43.50 ± 7.51 A38.15 ± 9.72 A20.89 ± 4.37 B
Epicatechin
SCO2-aqEtOH406.6 ± 52.5 A39.27 ± 7.15 A31.28 ± 9.54 A29.85 ± 5.09 A
UA-EtOH388.3 ± 98.1 A36.53 ± 1.90 A30.29 ± 4.44 A25.81 ± 1.79 AB
PH-H2O255.0 ± 31.1 B44.47 ± 7.81 A34.17 ± 8.42 A24.35 ± 2.31 B
Quercetin-3-O-glucoside
SCO2-aqEtOH510.7 ± 10.7 A28.75 ± 1.52 A26.72 ± 0.83 A24.99 ± 1.65 A
UA-EtOH479.3 ± 4.3 B28.60 ± 3.23 A25.82 ± 2.99 AB20.46 ± 2.09 AB
PH-H2O252.9 ± 12.1 C24.33 ± 2.34 A20.96 ± 2.37 B18.38 ± 2.56 B
Vanillin
SCO2-aqEtOH37.6 ± 2.0 A39.44 ± 1.11 A26.03 ± 3.70 A23.82 ± 1.06 AB
UA-EtOH28.3 ± 3.1 B28.74 ± 2.29 B25.45 ± 3.11 A22.73 ± 1.14 B
PH-H2O21.8 ± 0.4 C36.14 ± 1.63 A30.19 ± 0.95 A27.57 ± 2.63 A
Data are given as mean ± SD (n = 6); One Way Analysis of Variance (ANOVA) coupled with the Tukey’s post-hoc analysis to identify means with significant differences (p < 0.05) in each extract indicated by different capital letters (same column). 1 Defined as the stability ratio of phenolics after in vitro gastrointestinal digestion. 2 Defined as the percentage of the soluble phenolics to the initial total phenolic content. 3 Defined as the percentage of the soluble phenolics included in small (<200 nm) micelles or particles.
Disclaimer/Publisher’s Note: The statements, opinions and data contained in all publications are solely those of the individual author(s) and contributor(s) and not of MDPI and/or the editor(s). MDPI and/or the editor(s) disclaim responsibility for any injury to people or property resulting from any ideas, methods, instructions or products referred to in the content.

