
Deep Learning-Based Intelligent Apple Variety Classification System and Model Interpretability Analysis


Abstract
:1. Introduction
- 1.
- We used five CNNs from two different frameworks, i.e., series networks (AlexNet and VGG-19) and DAG networks (ResNet-18, ResNet-50, and ResNet-101), to classify 13 classes of apple. The performance of the different models was evaluated and compared in detail, and the strengths and weaknesses of each model were clarified and summarized.
- 2.
- We set up two datasets to investigate the dataset configuration on the classification results of CNN-based models. Specifically, one is a common dataset configuration, i.e., more training data–less testing data, and the other is designed to approach the reality that the testing set is infinite, i.e., less training data–more testing data.
- 3.
- We used three visualization methods (feature visualization, strongest activations, and local interpretable model-agnostic explanation techniques) step by step to reveal how the “black box” models make classification decisions.
2. Material and Methods
2.1. Fruits-360 Dataset
2.2. Training and Testing Datasets Set-Up
2.3. Network Architectures
2.3.1. Series Networks
2.3.2. Directed Acyclic Graph Networks
2.4. Transfer Learning
2.5. Image Processing
2.6. Metrics for Performance Evaluation of CNN-Based Models
2.7. Visualization Methods
2.7.1. Feature Visualization
2.7.2. Strongest Activations
2.7.3. Local Interpretable Model-Agnostic Explanations
2.8. Computer Configuration and Model Hyperparameters
3. Results and Discussion
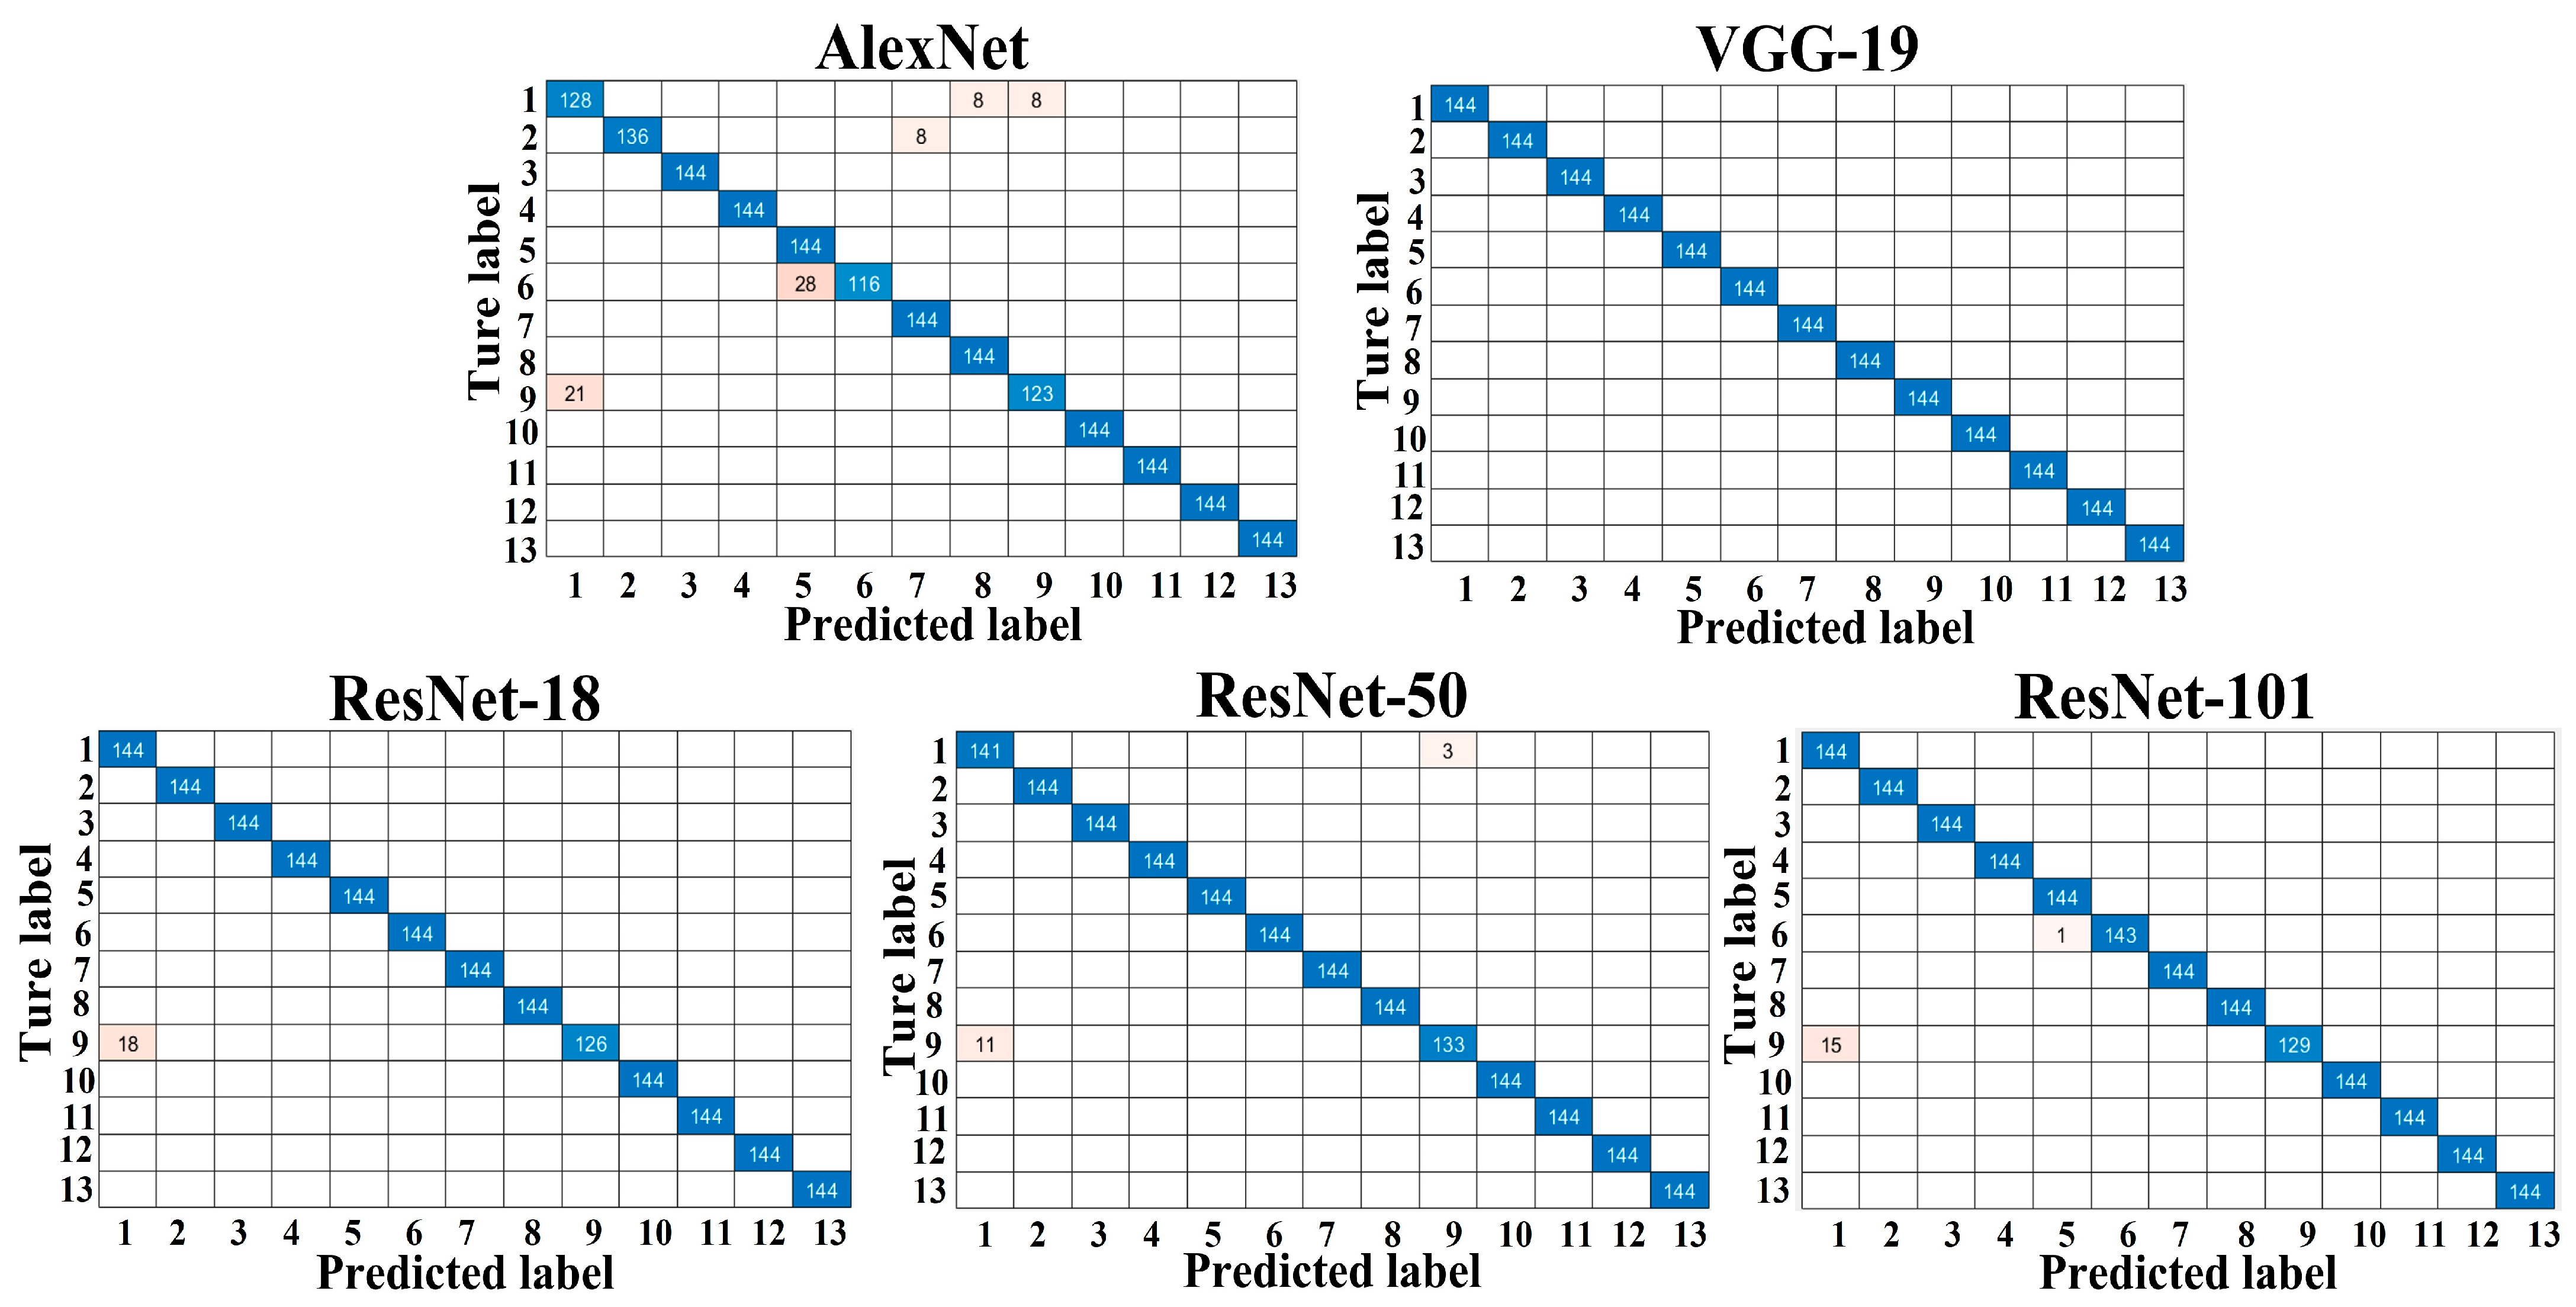
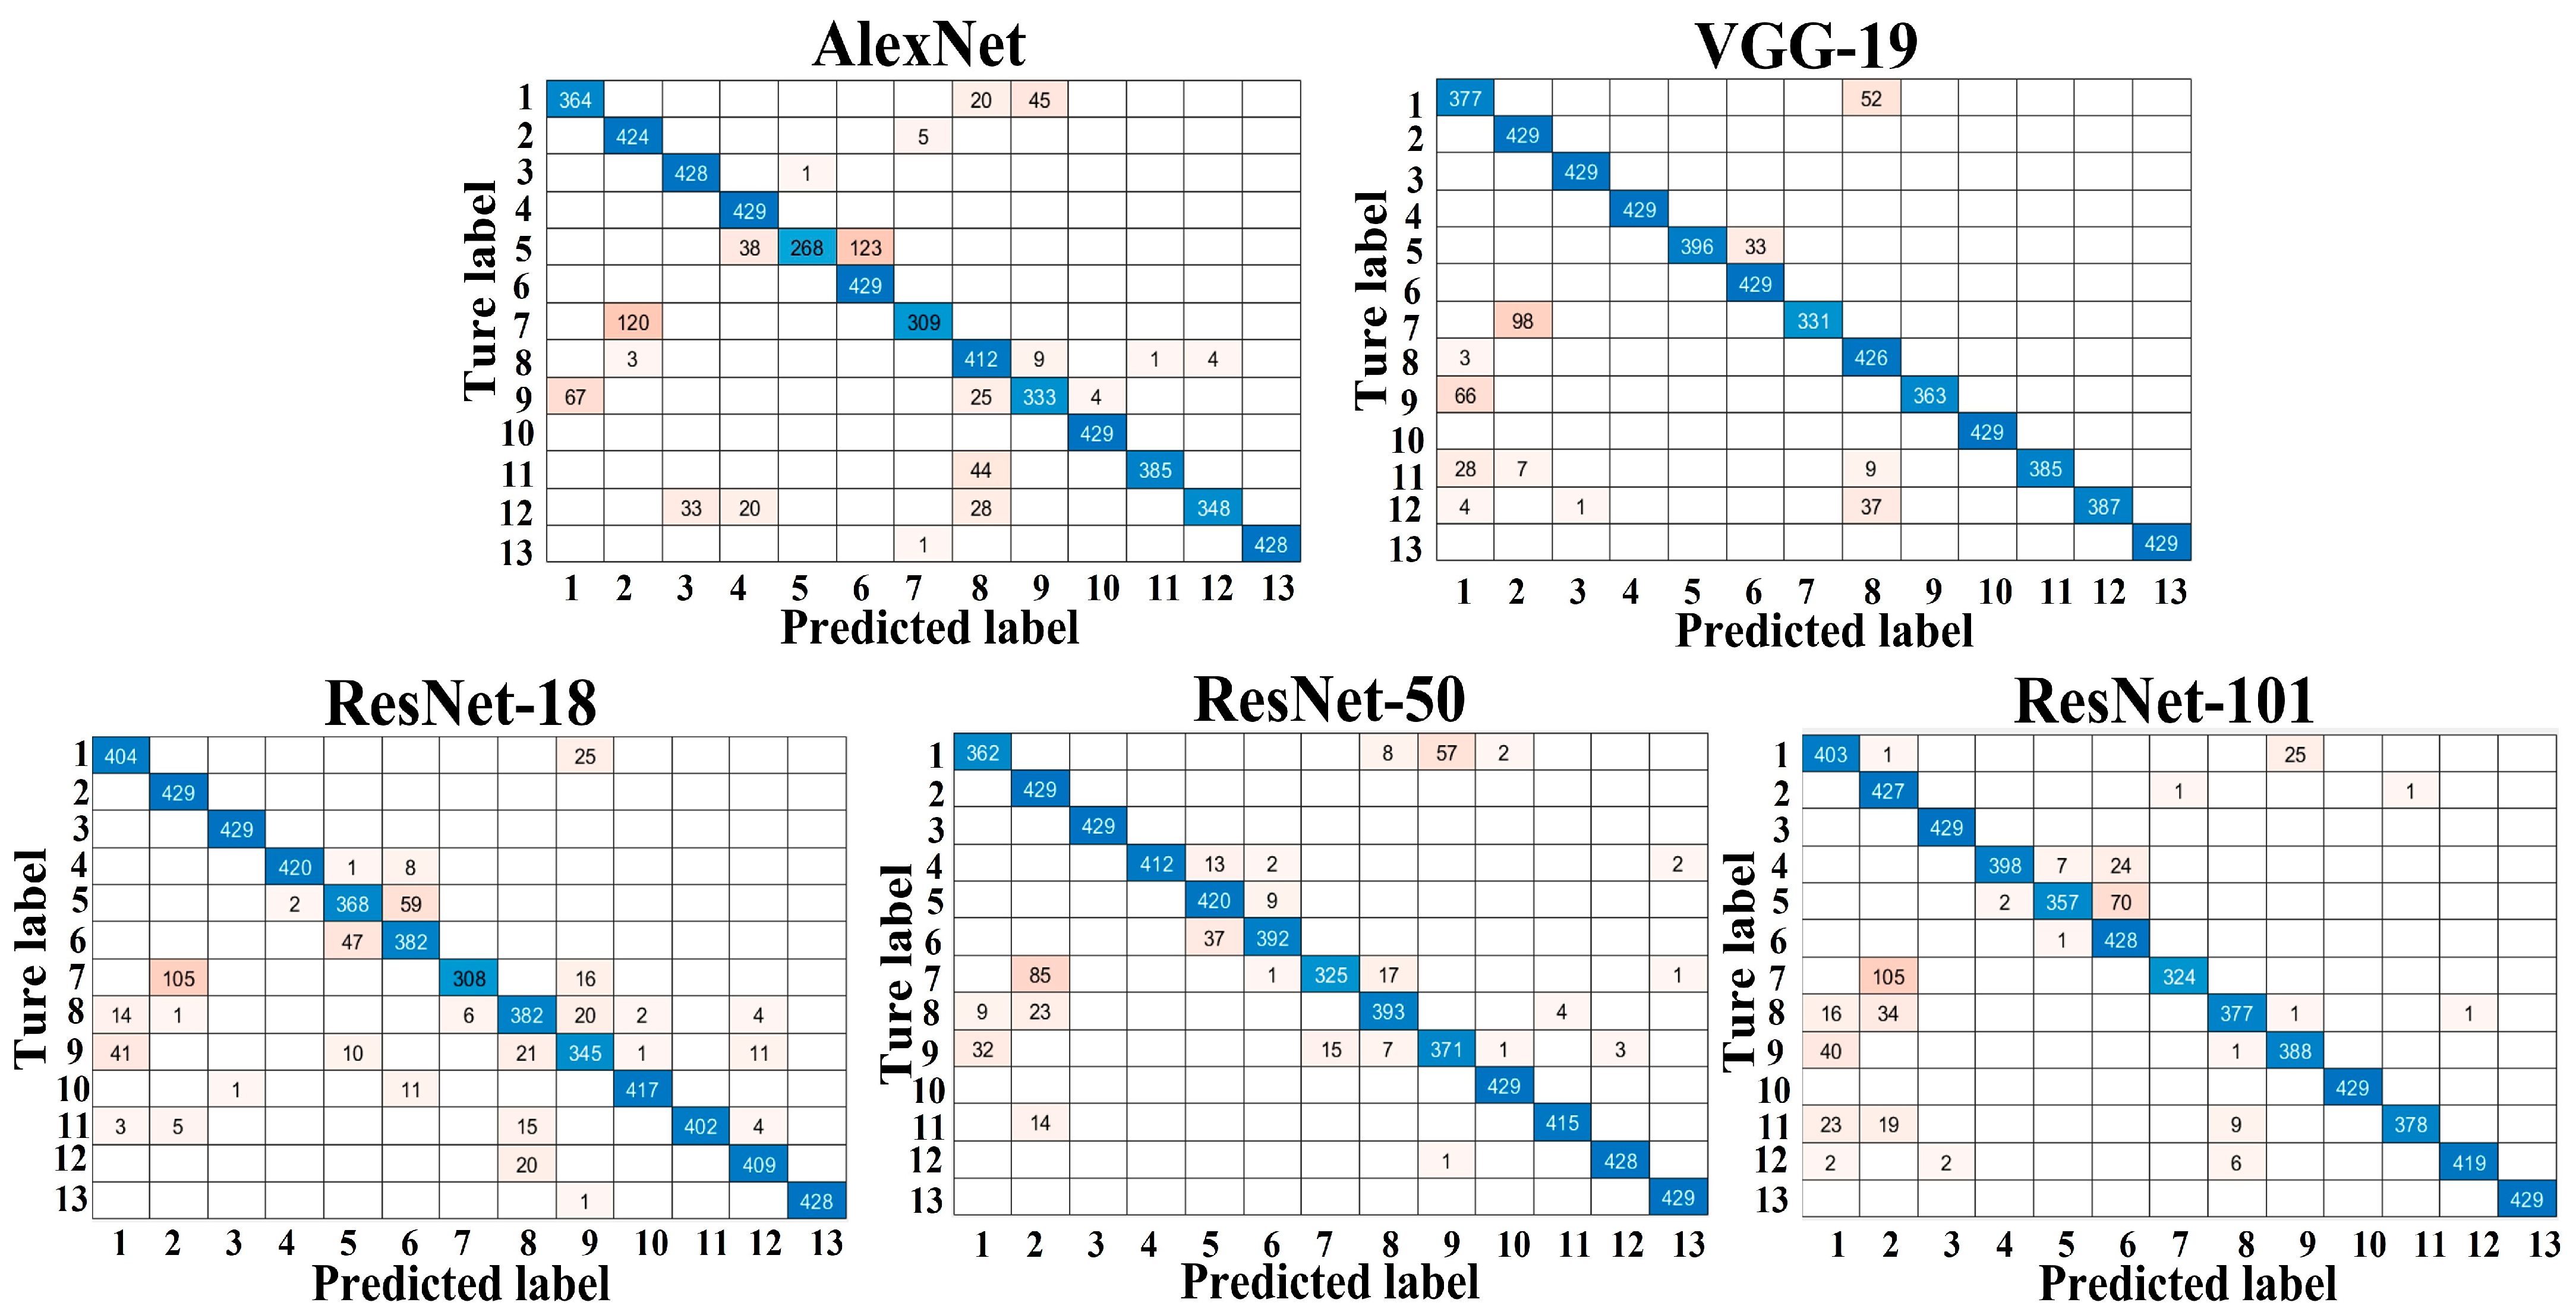
3.1. Performance of the Different Trained Models
3.2. Model Interpretability Analysis
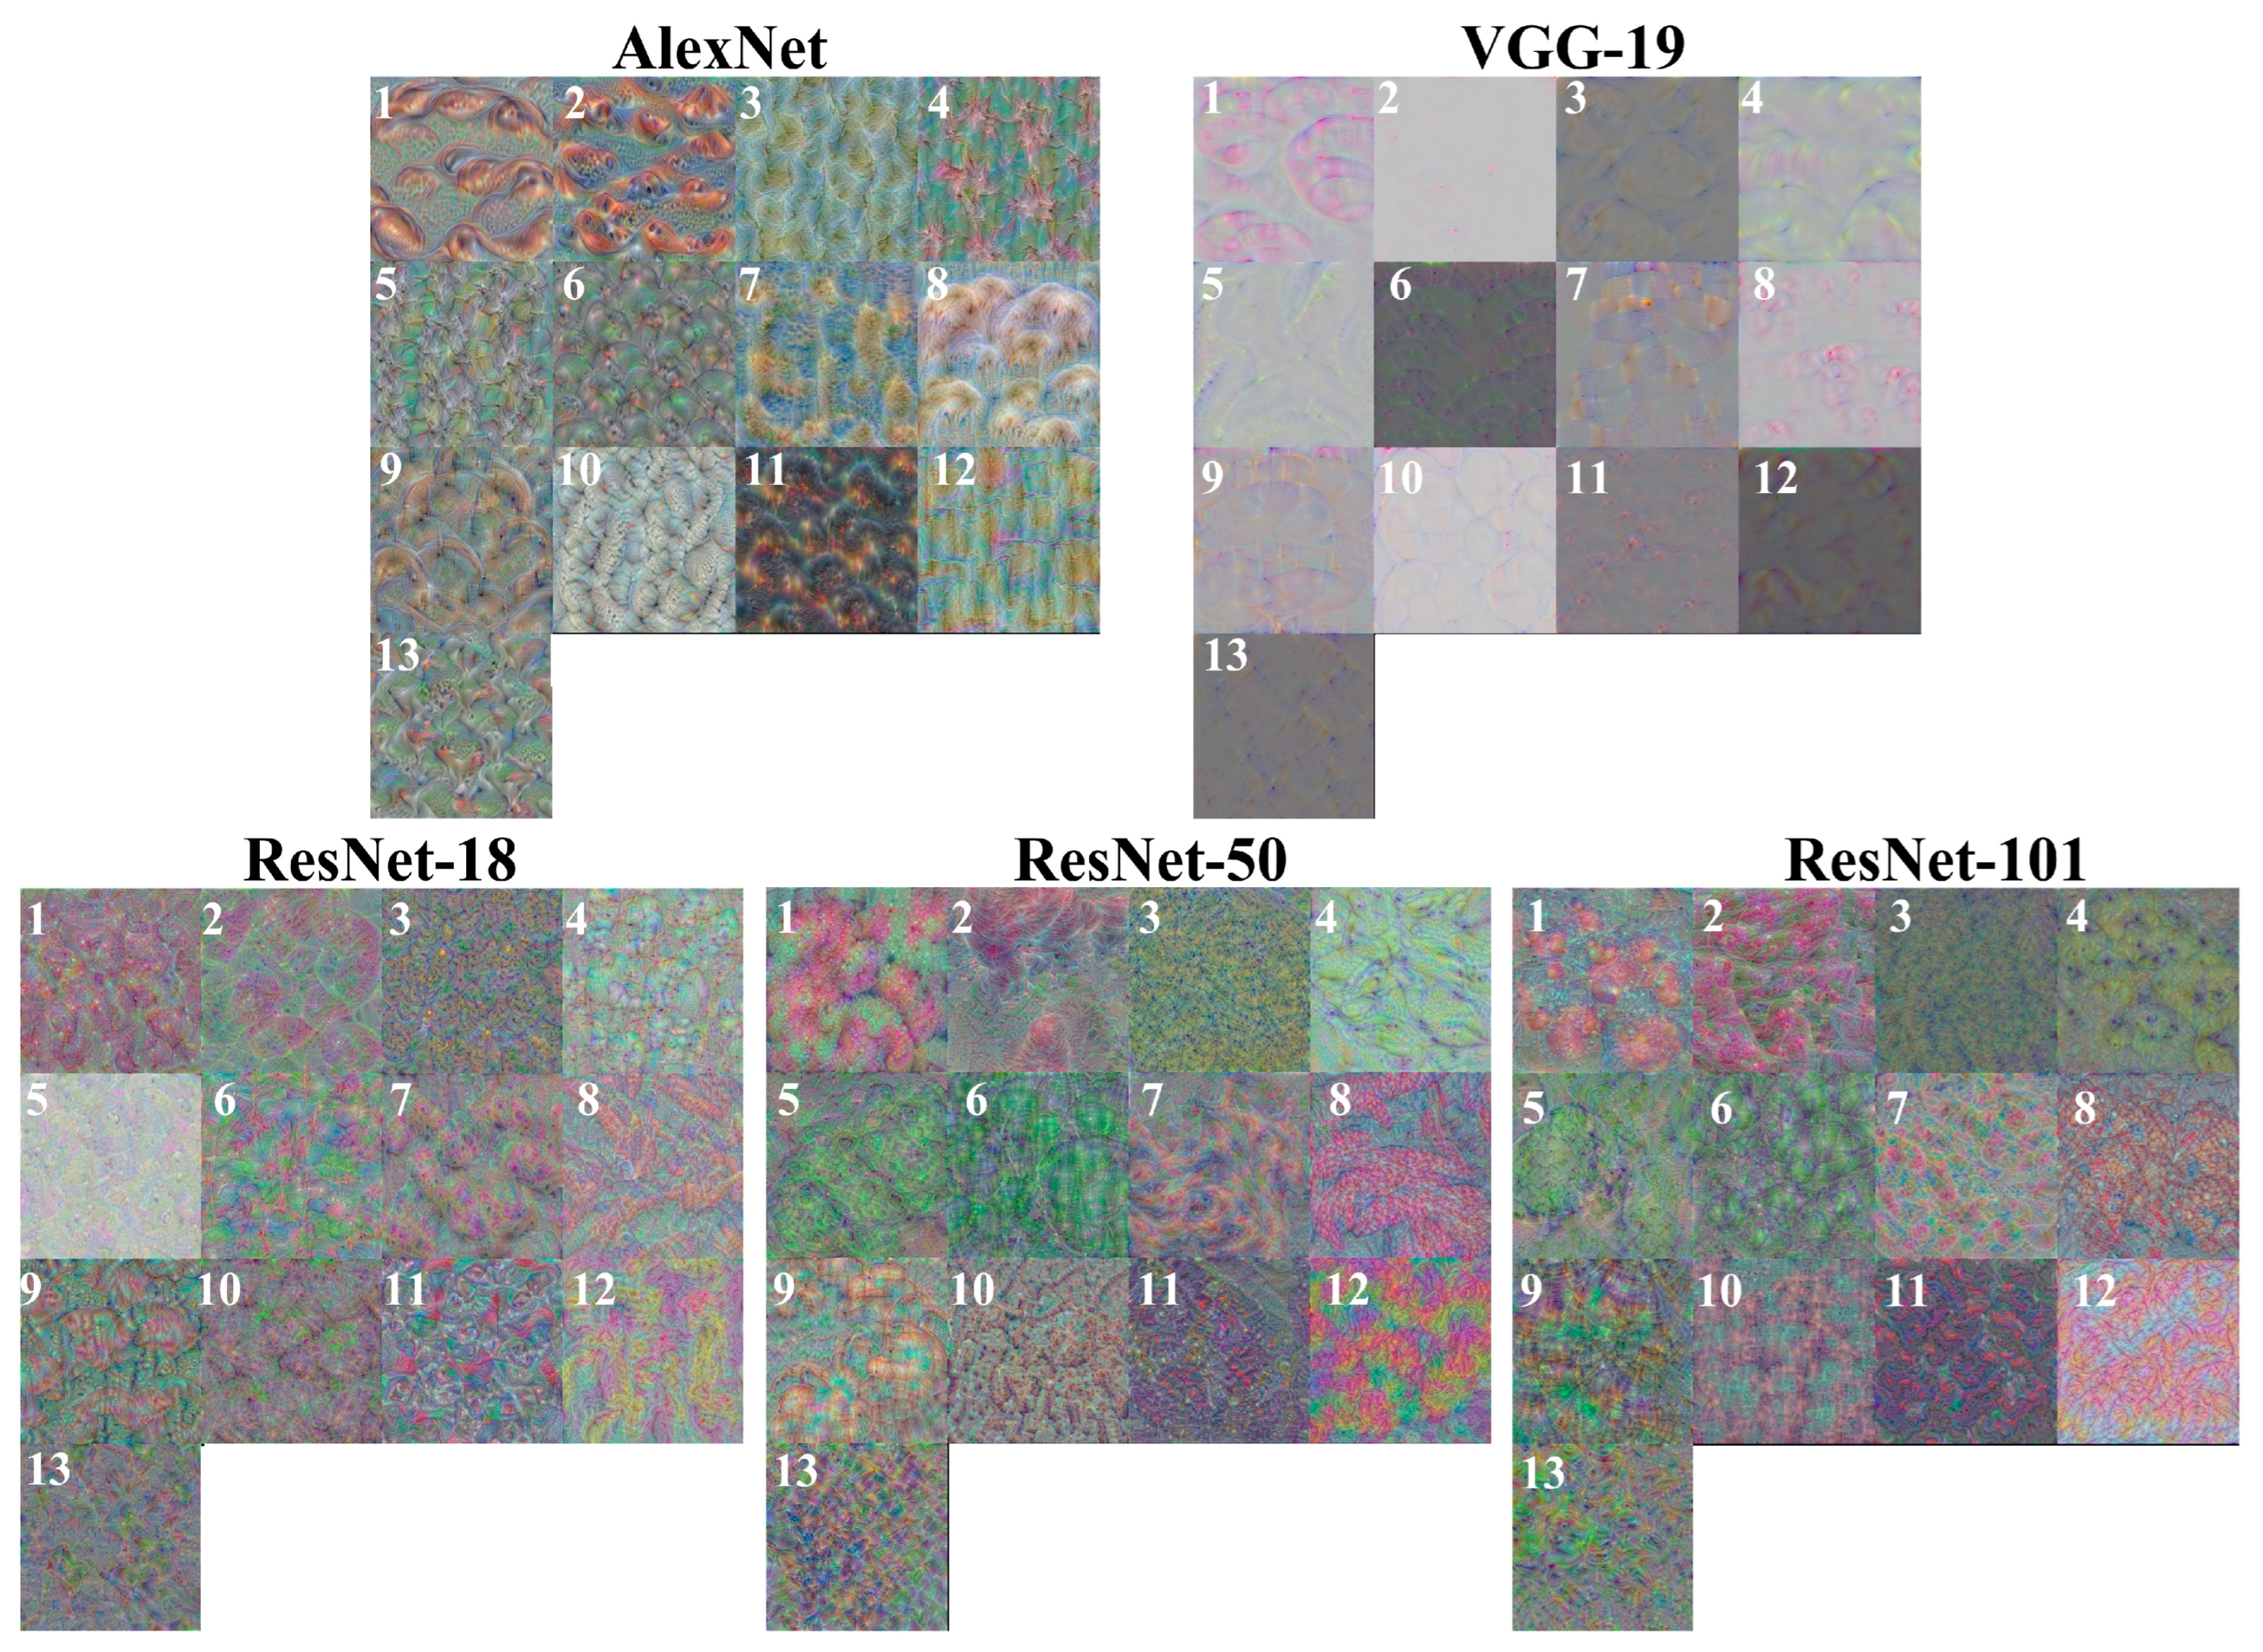
3.2.1. Feature Visualization
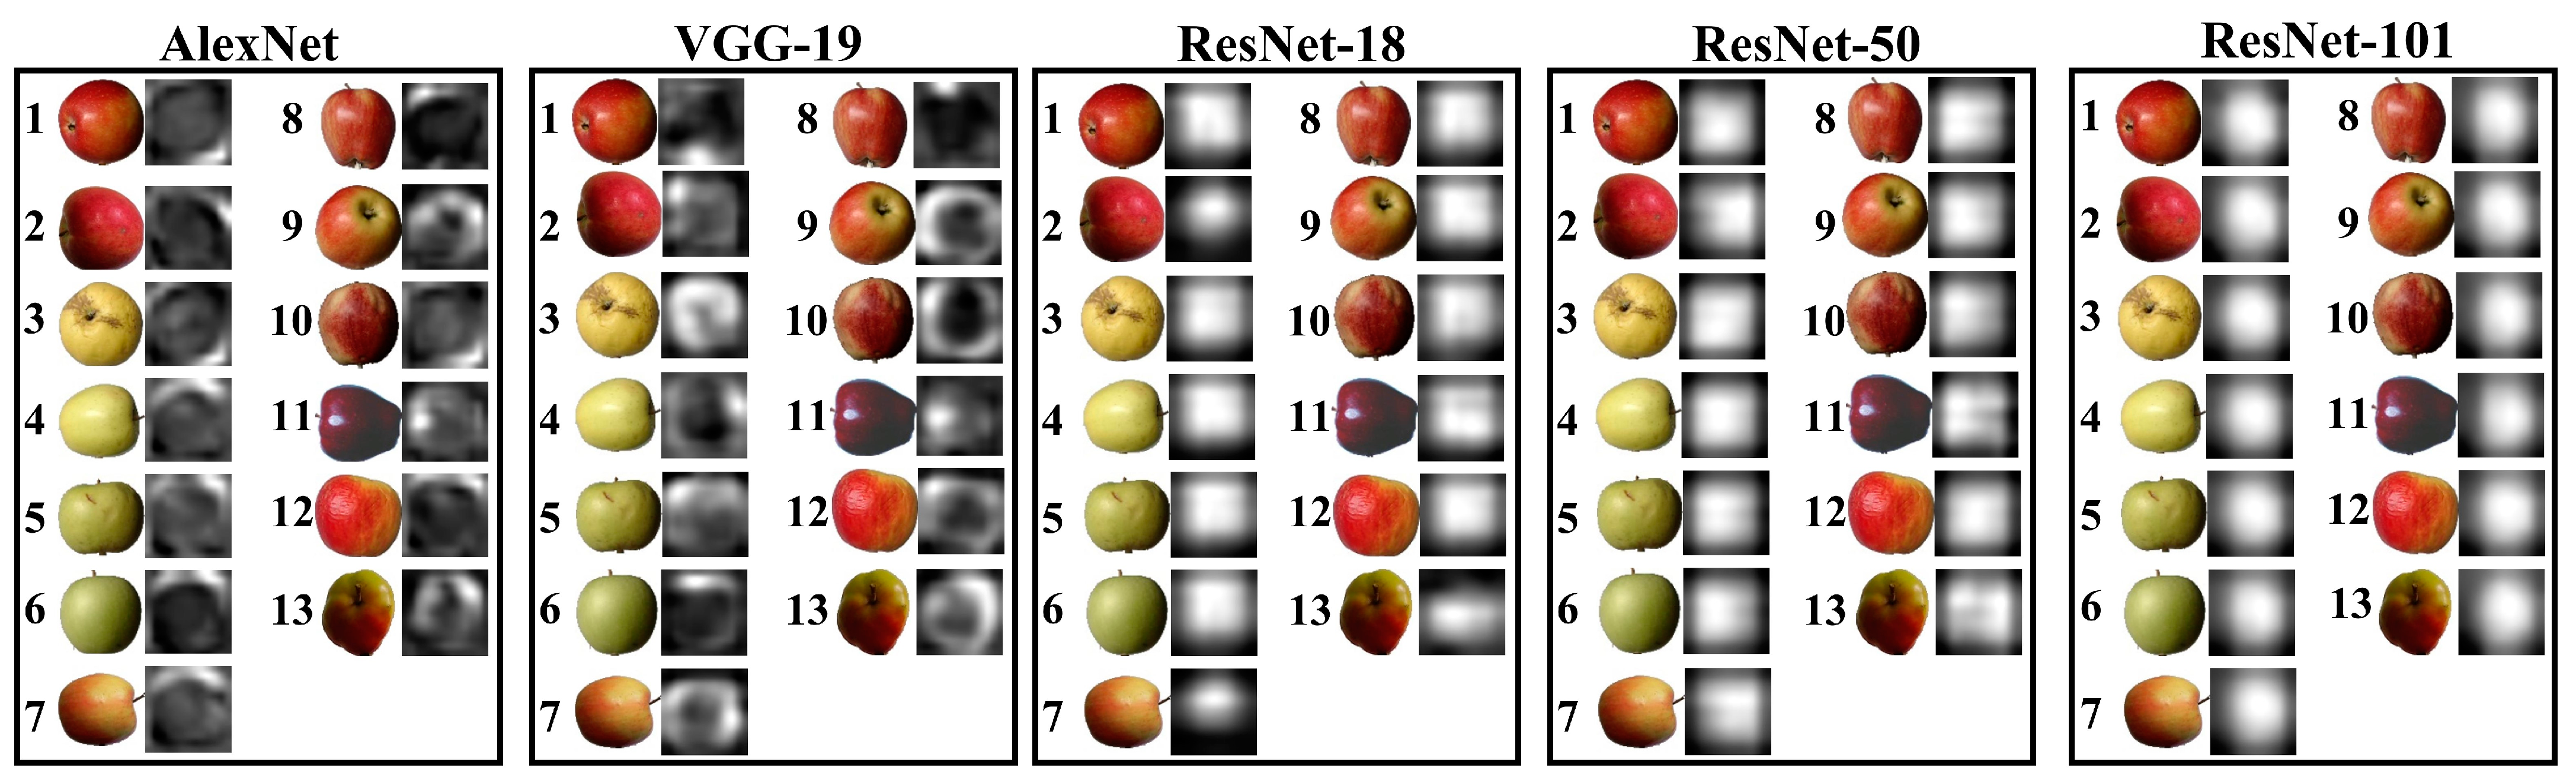
3.2.2. Strongest Activations
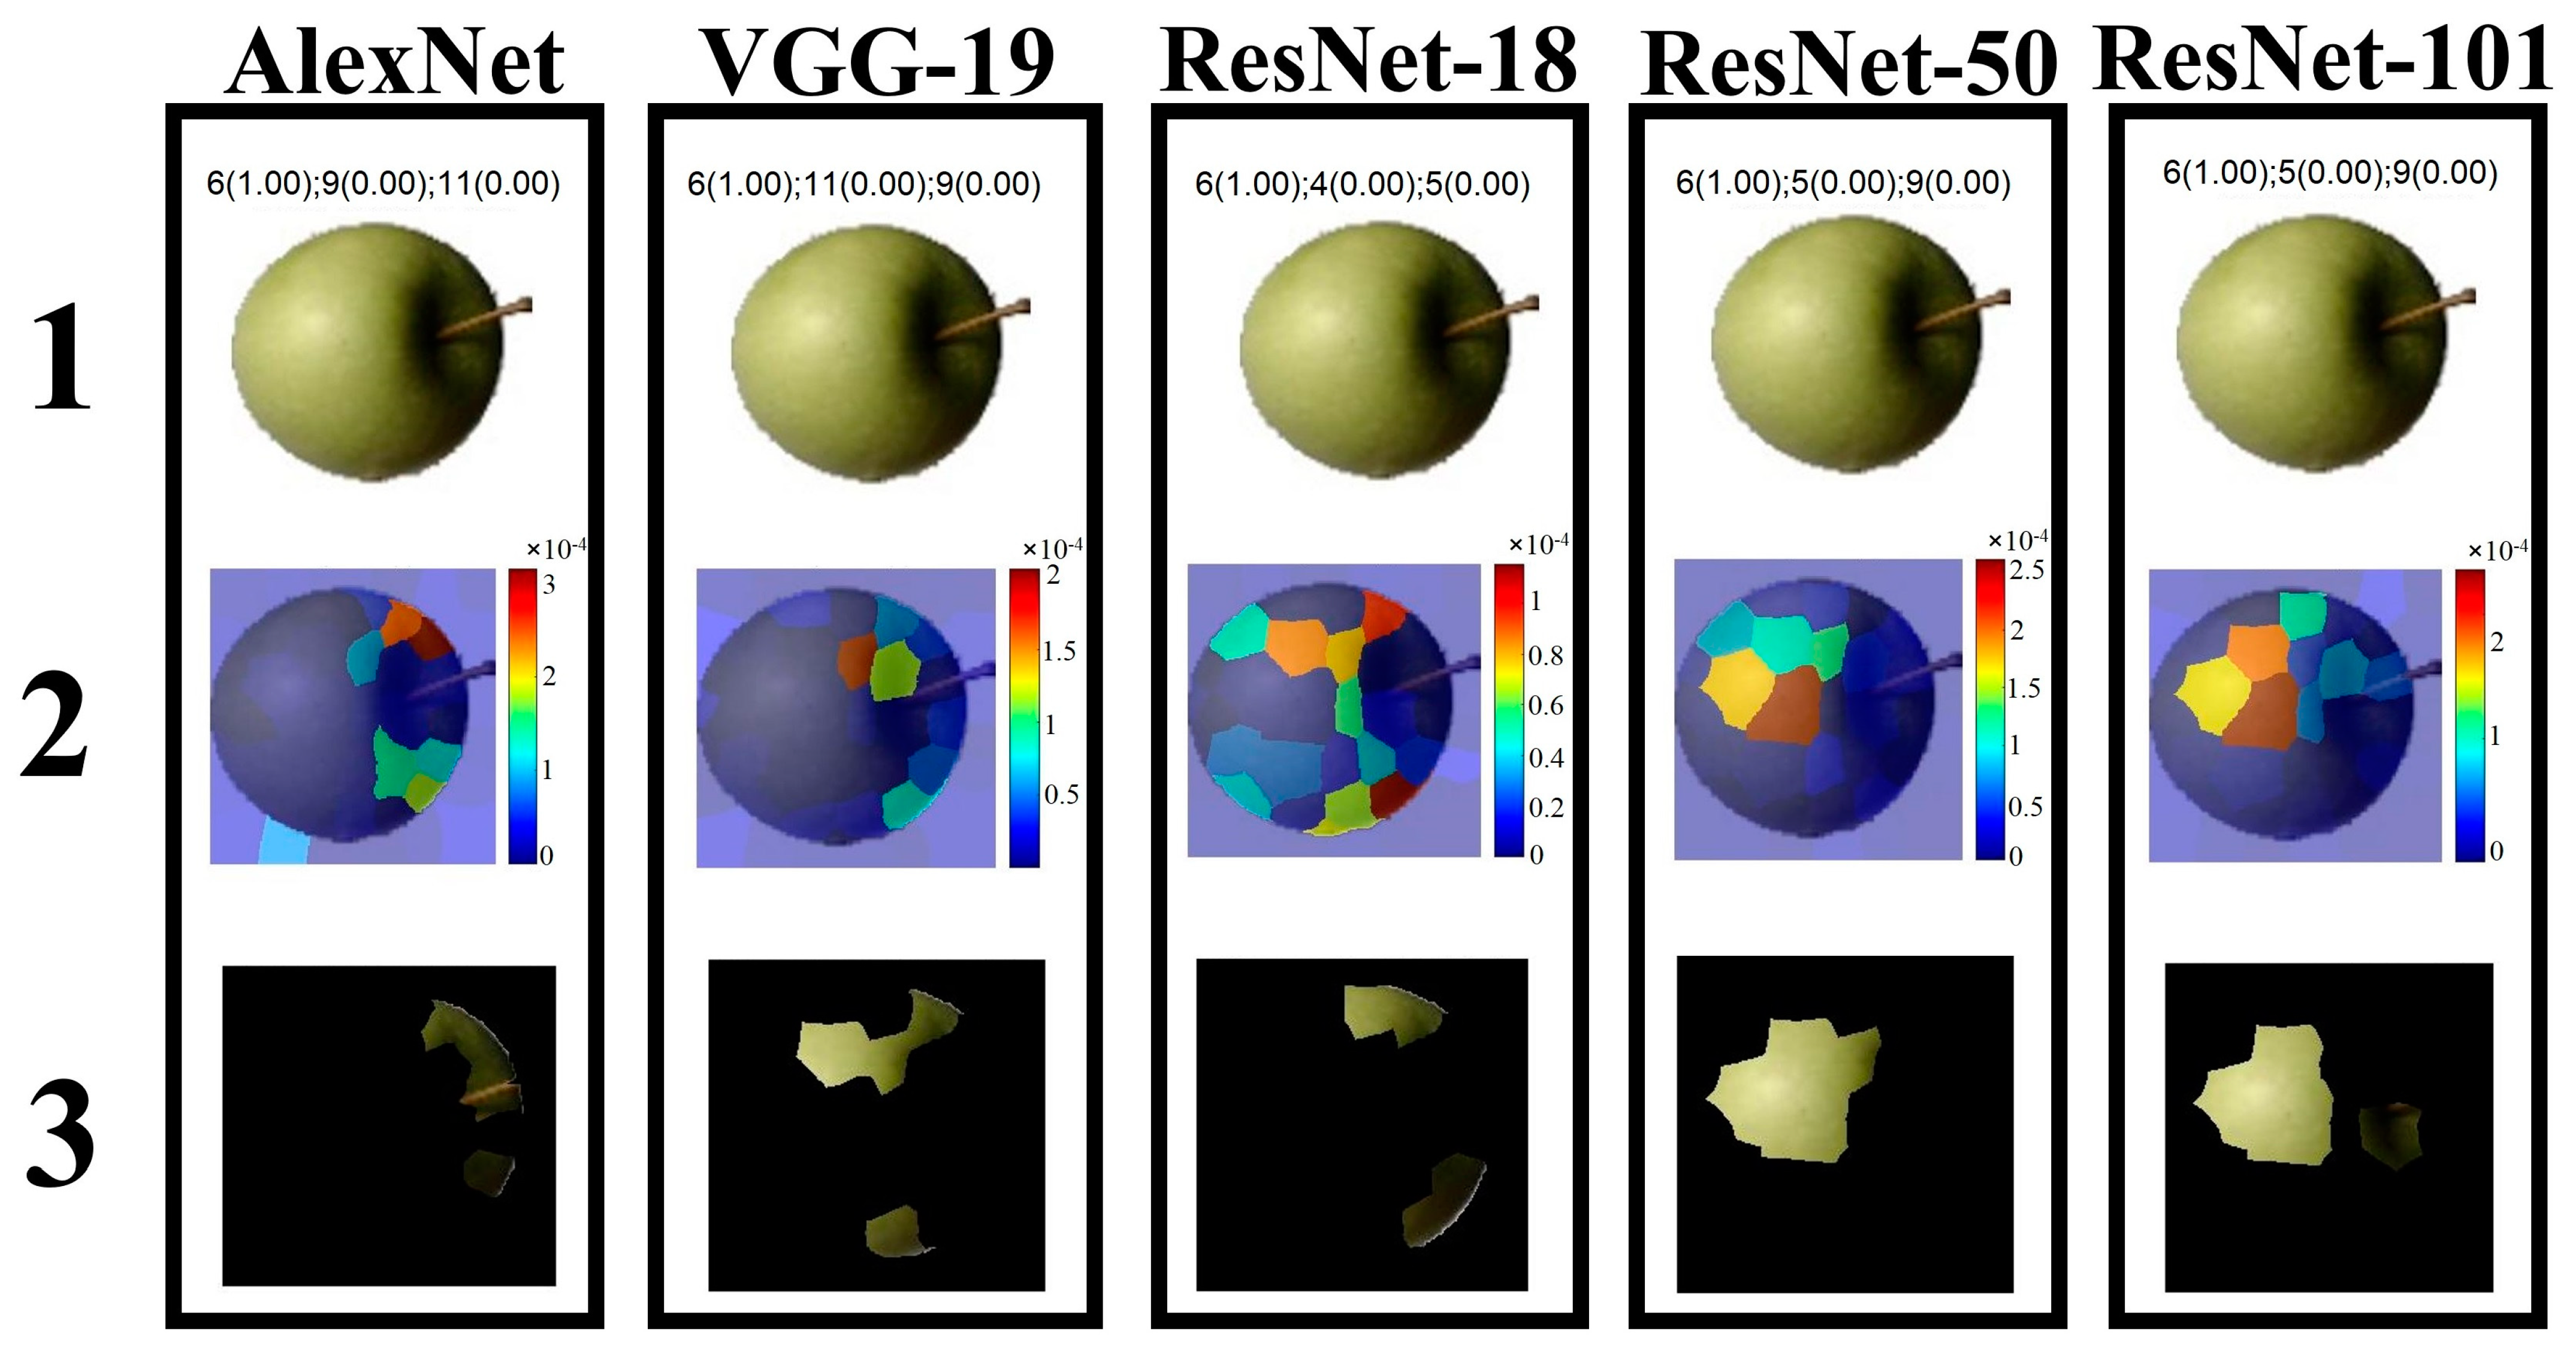
3.2.3. Local Interpretable Model-Agnostic Explanations
4. Conclusions
Supplementary Materials
Author Contributions
Funding
Institutional Review Board Statement
Informed Consent Statement
Data Availability Statement
Conflicts of Interest
References
- Wang, L.; Huo, X. Willingness-to-pay price premiums for certified fruits—A case of fresh apples in China. Food Control 2016, 64, 240–246. [Google Scholar] [CrossRef]
- Wu, X.; Wu, B.; Sun, J.; Yang, N. Classification of apple varieties using near infrared reflectance spectroscopy and fuzzy discriminant c-means clustering model. J. Food Process Eng. 2017, 40, e12355. [Google Scholar] [CrossRef]
- Cortés, V.; Cubero, S.; Blasco, J.; Aleixos, N.; Talens, P. In-line application of visible and near-infrared diffuse reflectance spectroscopy to identify apple varieties. Food Bioprocess Technol. 2019, 12, 1021–1030. [Google Scholar] [CrossRef]
- Biswas, B.; Ghosh, S.K.; Ghosh, A. A Robust Multi-Label Fruit Classification Based on Deep Convolution Neural Network. In Computational Intelligence in Pattern Recognition; Springer: Berlin/Heidelberg, Germany, 2020; pp. 105–115. [Google Scholar]
- Jakobek, L.; Ištuk, J.; Buljeta, I.; Voća, S.; Žlabur, J.Š.; Babojelić, M.S. Traditional, Indigenous apple varieties, a fruit with potential for beneficial effects: Their quality traits and bioactive polyphenol contents. Foods 2020, 9, 52. [Google Scholar] [CrossRef] [PubMed] [Green Version]
- Hossain, M.S.; Al-Hammadi, M.; Muhammad, G. Automatic fruit classification using deep learning for industrial applications. IEEE Trans. Ind. Inform. 2018, 15, 1027–1034. [Google Scholar] [CrossRef]
- Rudnitskaya, A.; Kirsanov, D.; Legin, A.; Beullens, K.; Lammertyn, J.; Nicolaï, B.M.; Irudayaraj, J. Analysis of apples varieties—Comparison of electronic tongue with different analytical techniques. Sens. Actuators B Chem. 2006, 116, 23–28. [Google Scholar] [CrossRef]
- Wu, X.; Zhou, H.; Wu, B.; Fu, H. Determination of apple varieties by near infrared reflectance spectroscopy coupled with improved possibilistic Gath–Geva clustering algorithm. J. Food Process. Preserv. 2020, 44, e14561. [Google Scholar] [CrossRef]
- Wu, X.; Wu, B.; Sun, J.; Li, M.; Du, H. Discrimination of apples using near infrared spectroscopy and sorting discriminant analysis. Int. J. Food Prop. 2016, 19, 1016–1028. [Google Scholar] [CrossRef] [Green Version]
- Marrazzo, W.; Heinemann, P.H.; Crassweller, R.; LeBlanc, E. Electronic nose chemical sensor feasibility study for the differentiation of apple cultivars. Trans. ASAE 2005, 48, 1995–2002. [Google Scholar] [CrossRef]
- Abasi, S.; Minaei, S.; Jamshidi, B.; Fathi, D. Dedicated non-destructive devices for food quality measurement: A review. Trends Food Sci. Technol. 2018, 78, 197–205. [Google Scholar] [CrossRef]
- Gikunda, P.K.; Jouandeau, N. State-of-the-art convolutional neural networks for smart farms: A review. In Proceedings of the Intelligent Computing-Computing Conference, London, UK, 16–17 July 2019; pp. 763–775. [Google Scholar]
- Hamid, Y.; Wani, S.; Soomro, A.B.; Alwan, A.A.; Gulzar, Y. Smart Seed Classification System based on MobileNetV2 Architecture. In Proceedings of the 2nd International Conference on Computing and Information Technology (ICCIT), Tabuk, Saudi Arabia, 25–27 January 2022; pp. 217–222. [Google Scholar]
- Unay, D. Deep learning based automatic grading of bi-colored apples using multispectral images. Multimed. Tools Appl. 2022, 81, 38237–38252. [Google Scholar] [CrossRef]
- Lu, S.; Chen, W.; Zhang, X.; Karkee, M. Canopy-attention-YOLOv4-based immature/mature apple fruit detection on dense-foliage tree architectures for early crop load estimation. Comput. Electron. Agric. 2022, 193, 106696. [Google Scholar] [CrossRef]
- Fan, S.; Li, J.; Zhang, Y.; Tian, X.; Wang, Q.; He, X.; Zhang, C.; Huang, W. On line detection of defective apples using computer vision system combined with deep learning methods. J. Food Eng. 2020, 286, 110102. [Google Scholar] [CrossRef]
- Hu, Z.; Tang, J.; Zhang, P.; Jiang, J. Deep learning for the identification of bruised apples by fusing 3D deep features for apple grading systems. Mech. Syst. Signal Process. 2020, 145, 106922. [Google Scholar] [CrossRef]
- Chu, P.; Li, Z.; Lammers, K.; Lu, R.; Liu, X. Deep learning-based apple detection using a suppression mask R-CNN. Pattern Recognit. Lett. 2021, 147, 206–211. [Google Scholar] [CrossRef]
- Xue, G.; Liu, S.; Ma, Y. A hybrid deep learning-based fruit classification using attention model and convolution autoencoder. Complex Intell. Syst. 2020. [Google Scholar] [CrossRef]
- Chen, J.; Han, J.; Liu, C.; Wang, Y.; Shen, H.; Li, L. A Deep-Learning Method for the Classification of Apple Varieties via Leaf Images from Different Growth Periods in Natural Environment. Symmetry 2022, 14, 1671. [Google Scholar] [CrossRef]
- Song, W.; Jiang, N.; Wang, H.; Guo, G. Evaluation of machine learning methods for organic apple authentication based on diffraction grating and image processing. J. Food Compos. Anal. 2020, 88, 103437. [Google Scholar] [CrossRef]
- Li, Y.; Feng, X.; Liu, Y.; Han, X. Apple quality identification and classification by image processing based on convolutional neural networks. Sci. Rep. 2021, 11, 16618. [Google Scholar] [CrossRef]
- Hameed, K.; Chai, D.; Rassau, A. A comprehensive review of fruit and vegetable classification techniques. Image Vis. Comput. 2018, 80, 24–44. [Google Scholar] [CrossRef]
- Chen, C.; Li, K.; Duan, M.; Li, K. Extreme Learning Machine and Its Applications in Big Data Processing. In Big Data Analytics for Sensor-Network Collected Intelligence; Elsevier: Amsterdam, The Netherlands, 2017; pp. 117–150. [Google Scholar]
- Lakkaraju, H.; Arsov, N.; Bastani, O. Robust and Stable Black Box Explanations. In Proceedings of the 37th International Conference on Machine Learning, Vienna, Austria, 13–18 July 2020; pp. 5628–5638. [Google Scholar]
- Mureşan, H.; Oltean, M. Fruit recognition from images using deep learning. Acta Univ. Sapientiae Inform. 2018, 10, 26–42. [Google Scholar] [CrossRef] [Green Version]
- Siddiqi, R. Effectiveness of transfer learning and fine tuning in automated fruit image classification. In Proceedings of the 2019 3rd International Conference on Deep Learning Technologies, Xiamen, China, 5–7 July 2019; pp. 91–100. [Google Scholar]
- Kodors, S.; Lacis, G.; Zhukov, V.; Bartulsons, T. Pear and apple recognition using deep learning and mobile. Eng. Rural Dev. 2020, 20, 1795–1800. [Google Scholar]
- Mathworks (R2020b). Available online: https://ww2.mathworks.cn/help/deeplearning (accessed on 19 December 2022).
- Xiao, J.; Wang, J.; Cao, S.; Li, B. Application of a Novel and Improved VGG-19 Network in the Detection of Workers Wearing Masks. J. Phys. Conf. Ser. 2020, 1518, 012041. [Google Scholar] [CrossRef] [PubMed]
- Lu, T.; Yu, F.; Xue, C.; Han, B. Identification, classification, and quantification of three physical mechanisms in oil-in-water emulsions using AlexNet with transfer learning. J. Food Eng. 2021, 288, 110220. [Google Scholar] [CrossRef]
- Chen, K.-H.; Deng, J.D.-C. An Optimized CNN Model for Pedestrian Implement on Development Boards. In Proceedings of the 2019 IEEE 8th Global Conference on Consumer Electronics (GCCE), Las Vegas, NV, USA, 15–18 October 2019; pp. 397–398. [Google Scholar]
- He, K.; Zhang, X.; Ren, S.; Sun, J. Deep residual learning for image recognition. In Proceedings of the IEEE Conference on Computer Vision and Pattern Recognition, Las Vegas, NV, USA, 27–30 June 2016; pp. 770–778. [Google Scholar]
- Fung, V. An Overview of Resnet and Its Variants. Towards Data Sci. 2017. Available online: https://towardsdatascience.com/an-overview-of-resnet-and-its-variants-5281e2f56035? (accessed on 19 December 2022).
- Zhang, L.; Schaeffer, H. Forward stability of resnet and its variants. J. Math. Imaging Vis. 2020, 62, 328–351. [Google Scholar] [CrossRef] [Green Version]
- Canziani, A.; Paszke, A.; Culurciello, E. An analysis of deep neural network models for practical applications. arXiv 2016, arXiv:1605.07678. [Google Scholar]
- Behera, S.K.; Rath, A.K.; Sethy, P.K. Maturity Status Classification of Papaya Fruits based on Machine Learning and Transfer Learning Approach. Inf. Process. Agric. 2020, 8, 244–250. [Google Scholar] [CrossRef]
- Lu, S.; Lu, Z.; Zhang, Y.-D. Pathological brain detection based on AlexNet and transfer learning. J. Comput. Sci. 2019, 30, 41–47. [Google Scholar] [CrossRef]
- Yu, F.; Lu, T.; Han, B.; Xue, C. A quantitative study of aggregation behaviour and integrity of spray-dried microcapsules using three deep convolutional neural networks with transfer learning. J. Food Eng. 2021, 300, 110515. [Google Scholar] [CrossRef]
- Haghighi, S.; Jasemi, M.; Hessabi, S.; Zolanvari, A. PyCM: Multiclass confusion matrix library in Python. J. Open Source Softw. 2018, 3, 729. [Google Scholar] [CrossRef] [Green Version]
- Gulzar, Y.; Hamid, Y.; Soomro, A.B.; Alwan, A.A.; Journaux, L. A Convolution Neural Network-Based Seed Classification System. Symmetry 2020, 12, 2018. [Google Scholar] [CrossRef]
- Nasiri, A.; Omid, M.; Taheri-Garavand, A. An automatic sorting system for unwashed eggs using deep learning. J. Food Eng. 2020, 283, 110036. [Google Scholar] [CrossRef]
- Lu, T.; Han, B.; Yu, F. Detection and classification of marine mammal sounds using AlexNet with transfer learning. Ecol. Inform. 2021, 62, 101277. [Google Scholar] [CrossRef]
- Lu, T.; Han, B.; Chen, L.; Yu, F.; Xue, C. A generic intelligent tomato classification system for practical applications using DenseNet-201 with transfer learning. Sci. Rep. 2021, 11, 15824. [Google Scholar] [CrossRef]
- Duong, L.T.; Nguyen, P.T.; Di Sipio, C.; Di Ruscio, D. Automated fruit recognition using EfficientNet and MixNet. Comput. Electron. Agric. 2020, 171, 105326. [Google Scholar] [CrossRef]
- Bhargava, A.; Bansal, A. Fruits and vegetables quality evaluation using computer vision: A review. J. King Saud Univ. Sci. 2018, 33, 243–257. [Google Scholar] [CrossRef]
- Koirala, A.; Walsh, K.B.; Wang, Z.; McCarthy, C. Deep learning–Method overview and review of use for fruit detection and yield estimation. Comput. Electron. Agric. 2019, 162, 219–234. [Google Scholar] [CrossRef]
- Kamilaris, A.; Prenafeta-Boldú, F.X. A review of the use of convolutional neural networks in agriculture. J. Agric. Sci. 2018, 156, 312–322. [Google Scholar] [CrossRef] [Green Version]
- Brahimi, M.; Boukhalfa, K.; Moussaoui, A. Deep Learning for Tomato Diseases: Classification and Symptoms Visualization. Appl. Artif. Intell. 2017, 31, 299–315. [Google Scholar] [CrossRef]
- Molnar, C. Interpretable Machine Learning. Available online: https://christophm.github.io/interpretable-ml-book/ (accessed on 19 January 2023).
- Zurowietz, M.; Nattkemper, T.W. An Interactive Visualization for Feature Localization in Deep Neural Networks. Front. Artif. Intell. 2020, 3, 49. [Google Scholar] [CrossRef] [PubMed]
- Sivaramakrishnan, R.; Antani, S.; Xue, Z.; Candemir, S.; Jaeger, S.; Thoma, G. Visualizing abnormalities in chest radiographs through salient network activations in deep learning. In Proceedings of the 2017 IEEE Life Sciences Conference (LSC), Sydney, Australia, 13–15 December 2017; pp. 71–74. [Google Scholar]
- Ribeiro, M.T.; Singh, S.; Guestrin, C. “Why Should I Trust You?”: Explaining the Predictions of Any Classifier. In Proceedings of the 22nd ACM SIGKDD International Conference on Knowledge Discovery and Data Mining, San Francisco, CA, USA, 13–17 August 2016; pp. 1135–1144. [Google Scholar]
- Buhrmester, V.; Münch, D.; Arens, M. Analysis of Explainers of Black Box Deep Neural Networks for Computer Vision: A Survey. Mach. Learn. Knowl. Extr. 2021, 3, 966–989. [Google Scholar] [CrossRef]


| Class | Dataset A | Dataset B | ||||
|---|---|---|---|---|---|---|
| Training Set | Validation Set | Testing Set | Training Set | Validation Set | Testing Set | |
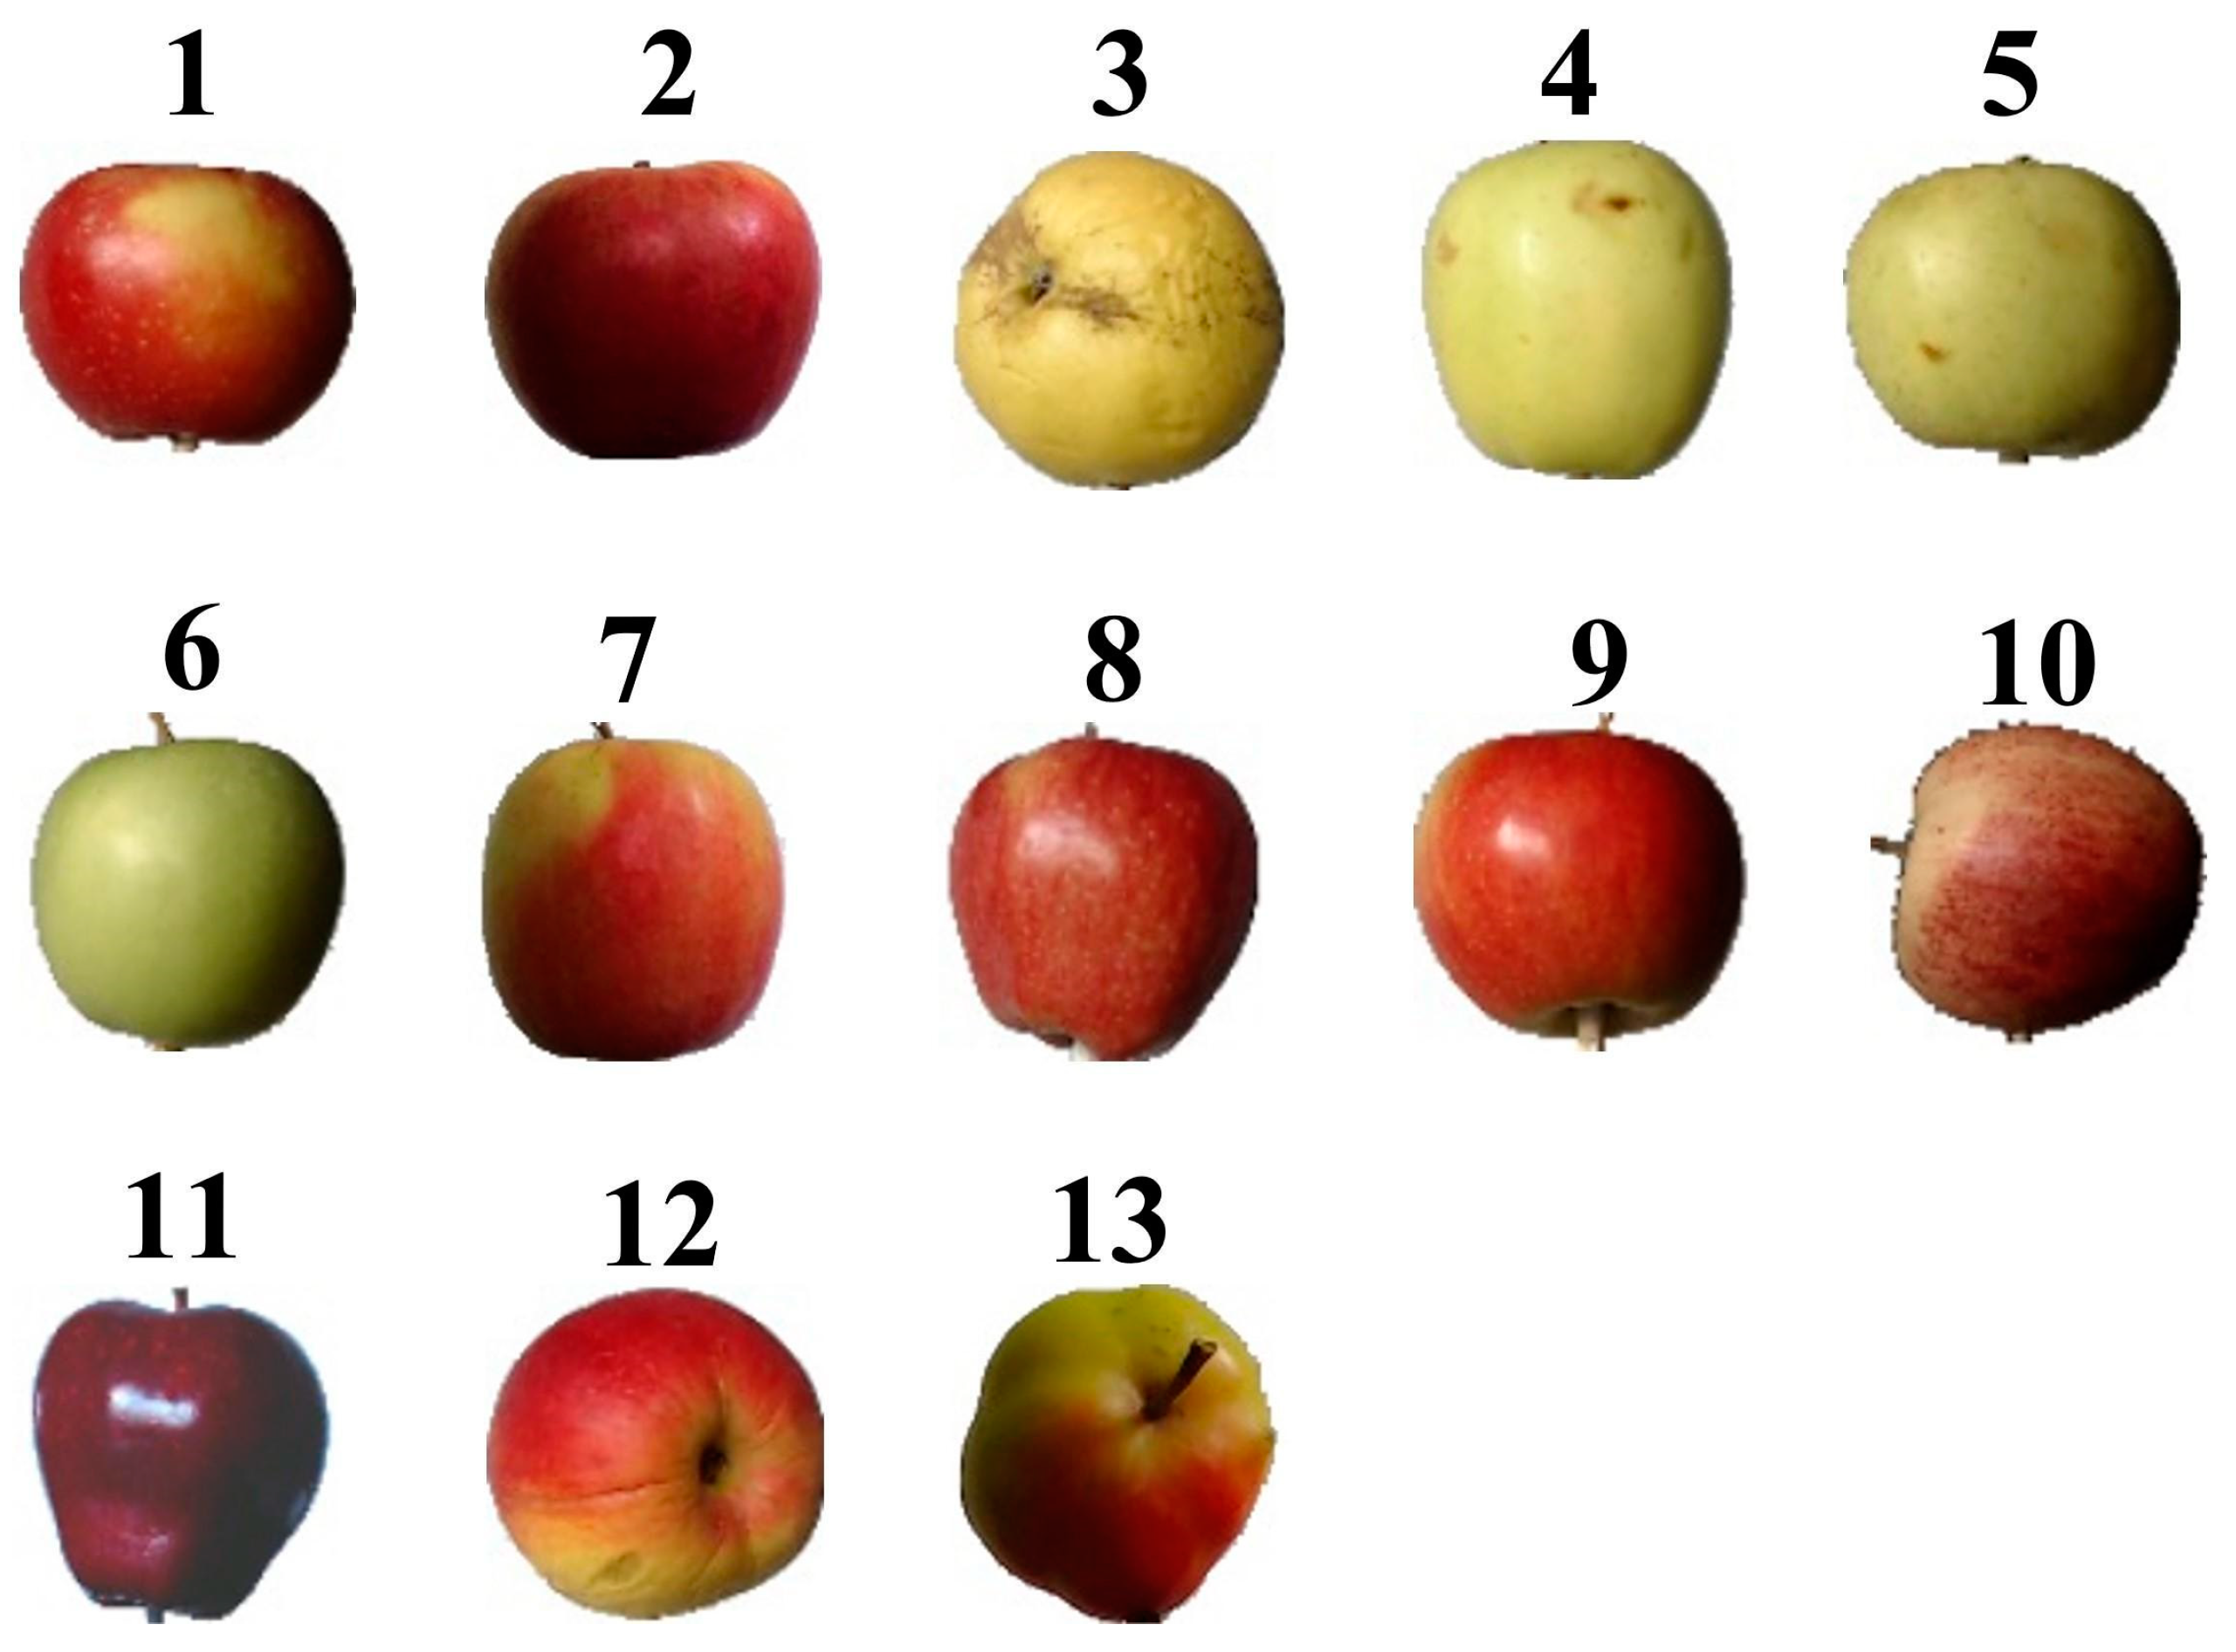
| 1 Braeburn | 344 | 85 | 144 | 116 | 28 | 429 |
| 2 Crimson Snow | 344 | 85 | 144 | 119 | 28 | 429 |
| 3 Golden 1 | 344 | 85 | 144 | 116 | 28 | 429 |
| 4 Golden 2 | 344 | 85 | 144 | 116 | 28 | 429 |
| 5 Golden 3 | 344 | 85 | 144 | 116 | 28 | 429 |
| 6 Granny Smith | 344 | 85 | 144 | 116 | 28 | 429 |
| 7 Pink Lady | 344 | 85 | 144 | 116 | 28 | 429 |
| 8 Red 1 | 344 | 85 | 144 | 116 | 28 | 429 |
| 9 Red 2 | 344 | 85 | 144 | 116 | 28 | 429 |
| 10 Red 3 | 344 | 85 | 144 | 116 | 28 | 429 |
| 11 Red Delicious | 344 | 85 | 144 | 116 | 28 | 429 |
| 12 Red Yellow 1 | 344 | 85 | 144 | 116 | 28 | 429 |
| 13 Red Yellow 2 | 344 | 85 | 144 | 116 | 28 | 429 |
| Total | 4472 | 1105 | 1872 | 1508 | 364 | 5577 |
| AlexNet | VGG-19 | ResNet-18 | ResNet-50 | ResNet-101 | |
|---|---|---|---|---|---|
| Type of network | Series | Series | DAG | DAG | DAG |
| Connections | none | none | 78 × 2 table | 192 × 2 table | 379 × 2 table |
| Running hardware | GPU | GPU | GPU | GPU | CPU |
| Layers | 25 | 47 | 71 | 177 | 347 |
| Model size (MB) | 204 | 495 | 40 | 84 | 151 |
| Dataset A (training-to-testing = 2.4:1.0) | |||||
| Training time (s) | 85.4 | 5716.6 | 231.3 | 952.0 | 20548.0 |
| Testing time (s) | 1.0 | 22.0 | 1.9 | 4.6 | 62.7 |
| Classification time for one image (ms) | 0.5 | 11.8 | 1.0 | 2.5 | 33.5 |
| Overall classification accuracy (%) | 96.1 | 100.0 | 99.0 | 99.3 | 99.2 |
| Dataset B (training-to-testing = 1.0:3.7) | |||||
| Training time (s) | 29.0 | 1707.6 | 74.6 | 295.6 | 6971.6 |
| Testing time (s) | 2.3 | 54.3 | 4.7 | 11.8 | 188.2 |
| Classification time for one image (ms) | 0.4 | 9.7 | 0.8 | 2.1 | 33.7 |
| Overall classification accuracy (%) | 89.4 | 93.9 | 91.9 | 93.9 | 93.0 |
| Dataset A | AlexNet | VGG-19 | ||||
|---|---|---|---|---|---|---|
| Class | Precision (%) | Recall (%) | F1-Score (%) | Precision (%) | Recall (%) | F1-Score (%) |
| 1 | 85.9 | 88.9 | 87.4 | 100.0 | 100.0 | 100.0 |
| 2 | 100.0 | 94.4 | 97.1 | 100.0 | 100.0 | 100.0 |
| 3 | 100.0 | 100.0 | 100.0 | 100.0 | 100.0 | 100.0 |
| 4 | 100.0 | 100.0 | 100.0 | 100.0 | 100.0 | 100.0 |
| 5 | 83.7 | 100.0 | 91.1 | 100.0 | 100.0 | 100.0 |
| 6 | 100.0 | 80.6 | 89.3 | 100.0 | 100.0 | 100.0 |
| 7 | 94.7 | 100.0 | 97.3 | 100.0 | 100.0 | 100.0 |
| 8 | 94.7 | 100.0 | 97.3 | 100.0 | 100.0 | 100.0 |
| 9 | 93.9 | 85.4 | 89.4 | 100.0 | 100.0 | 100.0 |
| 10 | 100.0 | 100.0 | 100.0 | 100.0 | 100.0 | 100.0 |
| 11 | 100.0 | 100.0 | 100.0 | 100.0 | 100.0 | 100.0 |
| 12 | 100.0 | 100.0 | 100.0 | 100.0 | 100.0 | 100.0 |
| 13 | 100.0 | 100.0 | 100.0 | 100.0 | 100.0 | 100.0 |
| macro- | 96.4 | 96.1 | 96.2 | 100.0 | 100.0 | 100.0 |
| Dataset B | ||||||
| Class | ||||||
| 1 | 84.5 | 84.8 | 84.6 | 78.9 | 87.9 | 83.2 |
| 2 | 77.5 | 98.8 | 86.9 | 80.3 | 100.0 | 89.1 |
| 3 | 92.8 | 99.8 | 96.2 | 99.8 | 100.0 | 99.9 |
| 4 | 88.1 | 100.0 | 93.7 | 100.0 | 100.0 | 100.0 |
| 5 | 99.6 | 62.5 | 76.8 | 100.0 | 92.3 | 96.0 |
| 6 | 77.7 | 100.0 | 87.5 | 92.9 | 100.0 | 96.3 |
| 7 | 98.1 | 72.0 | 83.0 | 100.0 | 77.2 | 87.1 |
| 8 | 77.9 | 96.0 | 86.0 | 81.3 | 99.3 | 89.4 |
| 9 | 86.0 | 77.6 | 81.6 | 100.0 | 84.6 | 91.7 |
| 10 | 99.1 | 100.0 | 99.5 | 100.0 | 100.0 | 100.0 |
| 11 | 99.7 | 89.7 | 94.4 | 100.0 | 89.7 | 94.6 |
| 12 | 98.9 | 81.1 | 89.1 | 100.0 | 90.2 | 94.8 |
| 13 | 100.0 | 99.8 | 99.9 | 100.0 | 100.0 | 100.0 |
| macro- | 90.8 | 89.4 | 90.1 | 94.9 | 93.9 | 94.4 |
| Dataset A | ResNet-18 | ResNet-50 | ResNet-101 | ||||||
|---|---|---|---|---|---|---|---|---|---|
| Class | Precision (%) | Recall(%) | F1-Score (%) | Precision (%) | Recall(%) | F1-Score (%) | Precision (%) | Recall(%) | F1-Score (%) |
| 1 | 88.9 | 100.0 | 94.1 | 92.8 | 97.9 | 95.3 | 90.6 | 100.0 | 95.1 |
| 2 | 100.0 | 100.0 | 100.0 | 100.0 | 100.0 | 100.0 | 100.0 | 100.0 | 100.0 |
| 3 | 100.0 | 100.0 | 100.0 | 100.0 | 100.0 | 100.0 | 100.0 | 100.0 | 100.0 |
| 4 | 100.0 | 100.0 | 100.0 | 100.0 | 100.0 | 100.0 | 100.0 | 100.0 | 100.0 |
| 5 | 100.0 | 100.0 | 100.0 | 100.0 | 100.0 | 100.0 | 99.3 | 100.0 | 99.6 |
| 6 | 100.0 | 100.0 | 100.0 | 100.0 | 100.0 | 100.0 | 100.0 | 99.3 | 99.6 |
| 7 | 100.0 | 100.0 | 100.0 | 100.0 | 100.0 | 100.0 | 100.0 | 100.0 | 100.0 |
| 8 | 100.0 | 100.0 | 100.0 | 100.0 | 100.0 | 100.0 | 100.0 | 100.0 | 100.0 |
| 9 | 100.0 | 87.5 | 93.3 | 97.8 | 92.4 | 95.0 | 100.0 | 89.6 | 94.5 |
| 10 | 100.0 | 100.0 | 100.0 | 100.0 | 100.0 | 100.0 | 100.0 | 100.0 | 100.0 |
| 11 | 100.0 | 100.0 | 100.0 | 100.0 | 100.0 | 100.0 | 100.0 | 100.0 | 100.0 |
| 12 | 100.0 | 100.0 | 100.0 | 100.0 | 100.0 | 100.0 | 100.0 | 100.0 | 100.0 |
| 13 | 100.0 | 100.0 | 100.0 | 100.0 | 100.0 | 100.0 | 100.0 | 100.0 | 100.0 |
| macro- | 99.1 | 99.0 | 99.1 | 99.3 | 99.3 | 99.3 | 99.2 | 99.1 | 99.2 |
| Dataset B | |||||||||
| Class | |||||||||
| 1 | 87.4 | 94.2 | 90.7 | 89.8 | 84.4 | 87.0 | 83.3 | 93.9 | 88.3 |
| 2 | 79.4 | 100.0 | 88.5 | 77.9 | 100.0 | 87.6 | 72.9 | 99.5 | 84.1 |
| 3 | 99.8 | 100.0 | 99.9 | 100.0 | 100.0 | 100.0 | 99.5 | 100.0 | 99.7 |
| 4 | 99.5 | 97.9 | 98.7 | 100.0 | 96.0 | 98.0 | 99.5 | 92.8 | 96.0 |
| 5 | 86.4 | 85.8 | 86.1 | 89.4 | 97.9 | 93.5 | 97.8 | 83.2 | 89.9 |
| 6 | 83.0 | 89.0 | 85.9 | 97.0 | 91.4 | 94.1 | 82.0 | 99.8 | 90.0 |
| 7 | 98.1 | 71.8 | 82.9 | 95.6 | 75.8 | 84.6 | 99.7 | 75.5 | 85.9 |
| 8 | 87.2 | 89.0 | 88.1 | 92.5 | 91.6 | 92.0 | 95.9 | 87.9 | 91.7 |
| 9 | 84.8 | 80.4 | 82.5 | 86.5 | 86.5 | 86.5 | 93.7 | 90.4 | 92.0 |
| 10 | 99.3 | 97.2 | 98.2 | 99.3 | 100.0 | 99.6 | 100.0 | 100.0 | 100.0 |
| 11 | 100.0 | 93.7 | 96.7 | 99.0 | 96.7 | 97.8 | 99.7 | 88.1 | 93.5 |
| 12 | 95.6 | 95.3 | 95.4 | 99.3 | 99.8 | 99.5 | 99.8 | 97.7 | 98.7 |
| 13 | 100.0 | 99.8 | 99.9 | 99.3 | 100.0 | 99.6 | 100.0 | 100.0 | 100.0 |
| macro- | 92.3 | 91.9 | 92.1 | 94.3 | 93.9 | 94.1 | 94.1 | 93.0 | 93.6 |
| Strengths | Weakness | |
|---|---|---|
| AlexNet | Fast training and classifying; good practicality | Low accuracy |
| VGG-19 | High accuracy | Slow training and classifying |
| ResNet-18 | Fast training and classifying; high accuracy and good practicality | |
| ResNet-50 | High accuracy, good practicality | |
| ResNet-101 | High accuracy | Dependence on high-performance computers; slow training and classifying |
Disclaimer/Publisher’s Note: The statements, opinions and data contained in all publications are solely those of the individual author(s) and contributor(s) and not of MDPI and/or the editor(s). MDPI and/or the editor(s) disclaim responsibility for any injury to people or property resulting from any ideas, methods, instructions or products referred to in the content. |
© 2023 by the authors. Licensee MDPI, Basel, Switzerland. This article is an open access article distributed under the terms and conditions of the Creative Commons Attribution (CC BY) license (https://creativecommons.org/licenses/by/4.0/).
Share and Cite
Yu, F.; Lu, T.; Xue, C. Deep Learning-Based Intelligent Apple Variety Classification System and Model Interpretability Analysis. Foods 2023, 12, 885. https://doi.org/10.3390/foods12040885
Yu F, Lu T, Xue C. Deep Learning-Based Intelligent Apple Variety Classification System and Model Interpretability Analysis. Foods. 2023; 12(4):885. https://doi.org/10.3390/foods12040885
Chicago/Turabian StyleYu, Fanqianhui, Tao Lu, and Changhu Xue. 2023. "Deep Learning-Based Intelligent Apple Variety Classification System and Model Interpretability Analysis" Foods 12, no. 4: 885. https://doi.org/10.3390/foods12040885