Article

Valorisation of Three Underutilised Native Australian Plants: Phenolic and Organic Acid Profiles and In Vitro Antimicrobial Activity

by
Maral Seididamyeh
1,2,
Anh Dao Thi Phan
1,2,
Dharini Sivakumar
1,3,
Michael E. Netzel
1,2,*,
Ram Mereddy
4 and
Yasmina Sultanbawa
1,2
1
Centre for Nutrition and Food Sciences, Queensland Alliance for Agriculture and Food Innovation, The University of Queensland, St Lucia, QLD 4072, Australia
2
ARC Industrial Transformation Training Centre for Uniquely Australian Foods, Queensland Alliance for Agriculture and Food Innovation, The University of Queensland, Indooroopilly, QLD 4068, Australia
3
Phytochemical Food Network Research Group, Department of Crop Sciences, Tshwane University of Technology, Pretoria West 0001, South Africa
4
Department of Agriculture and Fisheries, Queensland Government, Coopers Plains, QLD 4108, Australia
*
Author to whom correspondence should be addressed.
Foods 2023, 12(3), 623; https://doi.org/10.3390/foods12030623
Submission received: 26 December 2022 / Revised: 23 January 2023 / Accepted: 25 January 2023 / Published: 1 February 2023
(This article belongs to the Section Food Nutrition)

Abstract

:
Tasmannia lanceolata, Diploglottis bracteata and Syzygium aqueum are understudied native Australian plants. This study aimed to characterise the non-anthocyanin phenolic and organic acid profiles of the aqueous extracts obtained from the leaves of T. lanceolata and fruits of D. bracteata and S. aqueum by UHPLC-Q-Orbitrap-MS/MS and UHPLC-TQ-MS/MS. A total of 39, 22, and 27 non-anthocyanin polyphenols were tentatively identified in T. lanceolata, D. bracteata, and S. aqueum extracts, respectively. Furthermore, sugars and ascorbic acid contents as well as in vitro antioxidant and antimicrobial activities of the extracts were determined. Response surface methodology was applied to achieve an extract blend with a strong inhibitory effect against Pseudomonas viridiflava, the main cause of soft rot in vegetables, Bacillus subtilis, Rhodotorula diobovata and Alternaria alternata. The identified compounds including organic acids (e.g., quinic, citric and malic acids) and polyphenols (e.g., catechin, procyanidins, and ellagitannins) might contribute to the observed antimicrobial activity. Furthermore, this study provides the most comprehensive phenolic profiles of these three underutilised native Australian plants to date.

1. Introduction

Exploring native plants as potential sources of bioactive compounds for a range of applications in the food industry, such as preservatives (either antioxidants or antimicrobials), flavouring agents and functional ingredients, is currently of increasing interest. Australia is the native habitat for a diverse range of plant species—over 25,000—that most of them have evolved to suit the often-harsh growing conditions and have been long used by Indigenous communities for culinary or medicinal purposes. Several studies have reported the diverse phytochemical composition and health-enhancing effects of native Australian plants [1,2]. Many of them are still largely unknown, and most of them have not yet been studied for their chemical and nutritional composition as well as biological activities.
Analysis of native Australian plants may thus offer promising prospects for finding phytochemicals with strong bioactive properties. Therefore, three underutilised plants of the native Australian flora were investigated in the present study. Syzygium aqueum (Burm. F.) Alston (Myrtaceae), commonly known as the watery rose-apple or lillypilly, is native to a region ranging from tropical Asia to north Queensland (Australia), and its fruits and leaves have been traditionally used as an antibiotic agent [3]. Diploglottis bracteata (Sapindaceae), known as boonjee tamarind, is native to the tropical rainforest regions of northeast Queensland (Australia) that produces a three-segmented orange fruit on a large bushy tree [4]. A review of the literature revealed limited or no peer-reviewed information about this species. Tasmannia lanceolata Poir. (Winteraceae), commonly known as Tasmanian/mountain pepper, originates from Tasmania and the southeast regions of Australia, with reported inhibitory activity against a wide spectrum of microorganisms [1,5]. It is a shrub of 2–5 m height with dark green aromatic leaves and small fleshy black berries that have a pleasant spicy flavour and sharp aroma. Different parts of the plants such as bark, leaves and berries have been historically used as herb/spice in culinary preparations and as therapeutic agents by Indigenous communities [6].
Microbial food spoilage and food-borne outbreaks are still the issues of serious concern in the food industry, which cause major economic loss and affect the company’s reputation. Synthetic chemicals as antimicrobial agents (e.g., chlorine dioxide, potassium sorbate) have been extensively utilised in food industry to tackle spoilage and pathogenic microorganisms. However, their prolonged application raised several major concerns about the potentially harmful effects of chemical residues on/in food on consumer health and the environment, as well as their high variability in efficacy due to the emergence of microbial resistance [7]. The latter is a constantly shifting challenge that is also becoming a threat to human health. The raised awareness among consumers about chemical preservatives led to an increase in demand for natural alternatives, which has become the driving force behind the scientific effort to find effective natural antimicrobials to minimise the use of chemicals. There has been strong empirical evidence for the effective antimicrobial activity of several plant extracts such as Korean mint (Agastache rugosa) flower, stem, and leaves [8], as well as raspberry (Rubus idaeus) fruit [9].
Generally, different plant structures such as fruits and leaves are rich in various phytochemicals, including polyphenols, which are products of the plant’s secondary metabolism. These specialised metabolites perform important protective functions in plants against external stressors such as invading pathogens, drought, and ultraviolet radiation [10]. These interesting features of polyphenols have resulted in them being the focus of more detailed studies during the last decades, which revealed their wide range of bioactive properties such as antimicrobial and antioxidant activities [11,12]. The presence of various bioactive components in plants and in turn plant-derived extracts represents an invaluable potential for not only nutritional but also preservative purposes. Accordingly, the application of plant extracts as natural preservatives has recently become an area of growing interest for food manufacturers, which also contributes to clean-label food products. Examples launched by several ingredient manufacturers that are presently available for the food industry include GUARDIAN®® based on rosemary, green tea and acerola extracts (Danisco DuPont, Itasca, IL, USA), Berry Very®® based on moso bamboo extract (Takex Labo, Osaka, Japan), NJ, USA), and XtraBlend RN®® based on rosemary and spinach extracts (Naturex, Avignon, France).
The phytochemical composition, antioxidant, and antimicrobial properties of aqueous extracts of T. lanceolata leaves as well as S. aqueum and D. bracteata fruits were investigated in the present study. To the best of our knowledge, this is the first study reporting on the untargeted identification of non-anthocyanin polyphenolic compounds (by UHPLC-Q-Orbitrap-MS/MS), organic acids and sugars (by UHPC-TQ-MS/MS) in these three underutilised plants. Furthermore, extracts were screened for antimicrobial activity and antioxidant capacity, and an effective antimicrobial extract blend against common spoilage microorganisms in vegetables was optimised using an I-optimal design.

2. Materials and Methods

2.1. Chemicals

The analytical reagents and solvents (HPLC grade) used for analysis were purchased from Sigma-Aldrich (Castle Hill, NSW, Australia), Fisher Chemical (Loughborough, UK), BDH AnalaR (Kilsyth, VIC, Australia), Univar Ajax Chemicals (Sydney, NSW, Australia), and Chem-Supply (Gillman, SA, Australia). The sugar standards, including glucose, fructose, and sucrose; L-ascorbic acid; organic acids including citric acid, fumaric acid, isocitric acid, maleic acid, malic acid, quinic acid, shikimic acid, succinic acid and tartaric acid; phenolic standards, including caffeic acid, catechin, chlorogenic acid, p-coumaric acid, ellagic acid, epicatechin, gallic acid, kaempferol, luteolin, myricetin, quercetin, quercetin-3-glucoside and rutin, were purchased from Sigma-Aldrich. Microbial media were purchased from Thermo Fisher Scientific (Melbourne, VIC, Australia).

2.2. Plant Material and Extraction

Deseeded and frozen S. aqueum (Cape York lillypilly) and D. bracteata fruits collected in December 2017 and 2020 were purchased from Rainforest Bounty (Atherton, QLD, Australia). Air-dried T. lanceolata leaves collected in 2019 were donated by Diemen Pepper (Birchs Bay, TAS, Australia). Fruits were freeze-dried, and the dried fruits and leaves were separately ground, homogenised, and stored at −20 °C until extract preparations.
Water (Milli-Q, Millipore, Burlington, MA, USA) was brought to a boil, and then plant material was added with the ratio of 1:20 (plant:water; w/v) for S. aqueum and 1:10 for the other two. The extraction was performed under constant magnetic agitation (30 min, 70 °C), followed by centrifugation (4700 rpm, 10 min, 10 °C; Sorvall RC 12BP+, Thermo Scientific, Osterode am Harz, Germany). The pellet was re-extracted (2 h, 25 °C) and centrifuged. The two supernatants were mixed, vacuum-filtered through Whatman No. 1 filter paper, concentrated using a vacuum evaporator (DUC-23050-H00, miVac-Genevac, Ipswich, UK), freeze-dried (DynaVac, Lindner and May, Windsor, QLD, Australia), and kept at −20 °C until further use. The extraction yield (%) was calculated by dividing the weight of dried extract by the weight of plant material used and multiplying by 100. Thus, the extraction yields for water extracts of T. lanceolata leaves, D. bracteata fruits and S. aqueum fruits were 29.09 ± 0.41, 63.93 ± 0.83 and 56.17 ± 3.19%, respectively.
All experiments were carried out in triplicate. The details of the chromatographical separation and mass spectrometry are presented in Table 1.

2.3. Sugar Analysis

The extraction and analysis of soluble sugars were carried out according to the method described by Hong and colleagues [13]. External calibration curves of sugar standards (2.1–260 µg.mL−1) were used for quantification.

2.4. Vitamin C Analysis

The extraction and analysis of vitamin C (L-ascorbic acid (L-AA) and dehydroascorbic acid (DHAA)) were carried out as described by Phan and colleagues [14]. An external L-AA (1.5–76.3 mg.mL−1) calibration curve was used for quantification.

2.5. Organic Acid Analysis

Analysis of organic acids was conducted as reported by Moldoveanu and colleagues [15], with some modifications. Approximately 0.5 g of extract powder was mixed with 0.2 M HCl and vortexed for 1 min, followed by sonication (15 min, 25 °C). The mixture was then shaken by a reciprocating shaker for 1 h, followed by centrifugation (3900 rpm, 10 min). The supernatant was collected, and the pellet was re-extracted two more times as described above. The supernatants were then combined and filtered (0.22 µm, PTFE). External calibration curves using a mix of organic acid standards (0.2–1030 µg.mL−1) prepared in aqueous formic acid (1%; v/v) were used for quantification.

2.6. Total Phenolic Content (TPC)

The TPC of the extracts was determined using the Folin–Ciocalteu method as described by Singleton et al., 1999 [16]. The results were reported as mg gallic acid equivalents per g extract.

2.7. DPPH Radical Scavenging Capacity

The DPPH radical scavenging capacity assay was carried out according to the method described by Brand-Williams and co-workers [17] with slight modifications (equal aliquots of 0.1 mM DPPH and sample). The results were reported as IC50 (μg.mL−1).

2.8. HRAM Analysis and Tentative Identification of Non-Anthocyanin Phenolic Compounds

Approximately 0.5 g of extract powder was resuspended in 80% methanol containing 1% formic acid and passed through a 0.22-µm PTFE filter after centrifugation. Thirteen phenolic standards (Section 2.1) were prepared in methanol and injected into the UHPLC-MS/MS system either individually or in combination. A full MS scan in negative mode with the range of 100–1200 m/z followed by an all-ion fragmentation scan in the range of 80–1000 m/z was performed to acquire the MS and MS2 data. The MS characteristics of each peak detected in the UV spectra were determined based on the retention time, isotope distribution of neutral mass and the MS2 fragments spectra. Compound identification was carried out by manual comparison with injected standards (targeted identification) and matching with MS data reported in the literature and online database [18] to tentatively identify the unknown compounds (untargeted identification).

2.9. Antimicrobial Activity

2.9.1. Design of Experiments

Response surface methodology using Design Expert v.11.1.2.0 (Stat-Ease Inc., Minneapolis, MN, USA) was employed to study the effect of varying extract concentrations in the blend on the inhibitory activity against the selected spoilage microorganisms and subsequently to determine the optimal extract concentrations. A 17-run Box–Behnken design consisting of five replicate centre points was developed with T. lanceolata (A, 0–10% (% is equivalent to g per 100 mL)), D. bracteata (B, 0–10%) and S. aqueum (C, 0–10%) as independent variables (Table 2). This resulted in various extract content combinations, with 25% as the highest extract content in the blend. Moreover, a 14-run randomised Simplex–Lattice mixture design with one central point was developed, and the total concentration of the extracts “%T. lanceolata (component A) + %D. bracteata (component B) + %S. aqueum (component C)” was constrained to 10% with each extract ranging from 0 to 10% (Table 2). The effect of independent variables on the studied responses was determined through the model equations and visually expressed in 3D contour plots. A polynomial equation was used to fit the experimental data and establish the relations between the independent variables and the obtained responses. The lack-of-fit test, coefficient of determination (R2), and adjusted R2 were used to assess the validity and adequacy of the fitted model. The blend of extracts was optimised by the desirability function to maximise the inhibitory activity against the studied microorganisms.

2.9.2. Agar Well Diffusion Assay

Pseudomonas viridiflava, Bacillus subtilis, Rhodotorula diobovata and Alternaria alternata were taken from a culture collection of the University of Queensland (Coopers Plains, QLD, Australia), which were isolated and identified from fresh-cut capsicums (unpublished data) and stored at −80 °C. Briefly, the inoculums (106 CFU.mL−1) of overnight-grown bacteria and yeast, and 5-day-old mould were spread on Mueller Hinton (bacteria) and potato dextrose (fungi) agar plates. Three 8 mm wells were punched in the plate and filled with 100 μL of the sample. Plates were incubated at 25 °C for 48 h (fungi) and 30 °C for 24 h (bacteria). The inhibition zone diameter (mm) was measured by a digital calliper (±0.01 mm, Craftright, China) and subtracted from the well diameter. The sensitivity according to “diameter of inhibition zone” can be categorised as follows: <8 mm not sensitive, 9–14 mm sensitive, 15–19 mm very sensitive, and >20 mm extremely sensitive [19].

2.10. Statistical Analysis

All measurements were performed in triplicate, and the results were expressed as the mean value ± standard deviation. A one-way ANOVA was used to analyse the results using SPSS software (version 27; IBM Institute Inc., Armonk, NY, USA). Tukey’s HSD test with a 95% confidence interval was used to compare the differences between means.

3. Results and Discussion

3.1. Chemical Composition

Table 3 presents data on soluble sugars, vitamin C and organic acids of aqueous extracts derived from T. lanceolata leaves, D. bracteata fruits and S. aqueum fruits. As expected, more sugar and vitamin C was found in the fruit extracts than in leaves. The D. bracteata extract showed the highest total content of sugars (ca. 34 g. 100 g−1 dw) and vitamin C (2.43 mg. 100 g−1 dw), followed by S. aqueum and T. lanceolata. The variation in the sugar content is associated with differences in plant species (i.e., genetic), sun exposure due to the canopy, respiration, and ripening rates of fruits, as well as the presence and activity of specific enzymes that are involved in sugar metabolism [20]. Fructose was found to be the most abundant sugar in both fruit extracts, while sucrose was the major sugar found in T. lanceolata leaves extract. The low content of sucrose in fruit extracts can be attributed to the ripening phenomenon that causes sucrose conversion to fructose and glucose [21].
To the best of our knowledge, the organic acid profile was reported for the first time for the studied extracts. Roughly seven organic acids were identified in the extracts that exhibited very different profiles (Table 3). Quinic and citric acids were the most abundant (39.38 and 38.59% of total acids, respectively) in S. aqueum extract, while malic and shikimic acids were the most abundant (84.28% and 48.05% of total acids, respectively) in D. bracteata and T. lanceolata extracts, respectively. A considerably higher total content of organic acids was detected in S. aqueum extract (74.64 g. 100 g−1 dw) compared to 26.33 g. 100 g−1 dw in D. bracteata and 11.03 g. 100 g−1 dw in T. lanceolata extracts. The concentration of organic acids in fruits and leaves depends on sugar concentrations and their use for respiration. Several studies have shown the beneficial effects of organic acids not only as antibacterial agents but also on human health, including their involvement in iron absorption, reduction of levels of circulating glucose and cholesterol, and anxiolytic effects [22,23]. Quinic acid, for example, has exhibited anti-neuroinflammatory and radioprotection effects [24], as well as anti-HIV-1 activity [25].
Our results demonstrated that the antioxidant capacity of the extracts was directly related to the total phenolic content. The TPC value of 123.47 mg GAE.g−1 dw was found in T. lanceolata leaves extract, which showed a strong antioxidant capacity (DPPH IC50 value of 36.59 µg.mL−1). These results were in good agreement with those reported by Alderees and colleagues, who found 157.4 mg GAE.g−1 dw in an aqueous extract of Tasmanian pepper leaves [26]. On the other hand, the fruit extracts with low contents of TPC had a considerably low antioxidant capacity (Table 3). Unlike the fruits’ extracts, leaves extracts with strong antioxidant activity can be used to reduce oxidative stress and contribute to preventing damage by reactive species. Several studies have also shown low values of TPC in S. australe (2.14 mg GAE.g−1 dw) and S. luehmannii (2.23 mg GAE.g−1 dw) [27,28]. The accumulation of phenolic compounds in different plant tissues is influenced by environmental conditions such as temperature, sun exposure and other weather conditions, which may explain the observed differences in the studied extracts. For instance, the observed higher TPC in Tasmanian pepper leaves could be attributed to the increased expression of genes associated with flavonoid biosynthesis due to high sun exposure [29]. Generally, the biosynthesis of phenolic compounds in plants is the result of a collection of regulatory signals, including developmental (e.g., during anthocyanin production during fruit and flower development) and environmental (e.g., protection against abiotic and biotic stresses) signals [30].

3.2. Identification of Non-Anthocyanin Polyphenols

Table 4, Table 5 and Table 6 present the data on untargeted screening and tentative identification of non-anthocyanin polyphenols in the aqueous extracts of T. lanceolata leaves, D. bracteata fruits and S. aqueum fruits, using HRAM-UHPLC-Q/Orbitrap-MS/MS. The retention time and MS/MS fragmentation pattern were compared with the reported data in previous studies. A total of 39, 22, and 27 non-anthocyanin polyphenols were tentatively identified in T. lanceolata, D. bracteata, and S. aqueum aqueous extracts, respectively. The UHPLC-UV chromatograms, the mass spectra data of not-yet identified compounds (due to the unavailability of commercial standards and limited MS data in the literature), commercial standards used in this study, as well as representative full-scan and product ion mass spectra, are summarised in the Supplementary Materials (Figures S1–S7, Tables S1–S4).

3.2.1. Phenolic Acids

Hydroxycinnamic acids were the most abundant phenolic acids detected in the T. lanceolata extract. Compounds 1, 13, and 14 were tentatively identified as chlorogenic acid derivatives, including hydroxydihydrocaffeoylquinic acid [31], chlorogenic acid dimer, and its isomer [32]. Chlorogenic acid (compound 12) was identified and confirmed by a commercial standard, exhibiting m/z 191.0557 [quinic acid–H] and m/z 85.0284 as major fragment ions. Compound 8 was tentatively identified as a caffeoylquinic acid glucoside derivative, which showed product ions at m/z 515.1109 [caffeoylquinic acid glucoside–H] as well as at m/z 191.0559 [quinic acid–H] and m/z 323.0540 [caffeoyl glucosyl–H2O–H] that are correspondent to caffeoylquinic acid glucoside fragmentation [31]. Two coumaric acid derivatives were tentatively identified as compounds 6 and 16 with a diagnostic fragment ion at m/z 163.0394 [p-coumaric acid–H] [33]; however, compound 16 was characterised as 4-O-p-coumaroylquinic acid due to m/z 119.0495 [p-coumaric acid–H–CO2] as a further main fragment [34].
Hydroxycinnamic acid compounds were also tentatively identified in the D. bracteata extract. Compound 14 was tentatively assigned as a coumaric acid derivative, producing the main fragment at m/z 119.0496 [p-coumaric acid–H–CO2] [34]. Compound 17 was tentatively suggested as a caffeoyl glucose derivative that showed a product ion at m/z 341.607, most likely [caffeoyl glucose–H], and another at m/z 161.0609, which was reported as a caffeoyl glucose fragment [35]. Furthermore, compounds 16, 20, and 22 were tentatively assigned as cinnamic acid derivatives according to the main fragments produced at m/z 147.0445 [cinnamic acid–H] [35], m/z 245.1545 [heptyl cinnamate–H] and m/z 231.0989 [tetrahydrofurfuryl cinnamate–H] [18].
Three tentatively identified hydroxybenzoic acid compounds were also found in the T. lanceolata extract. Compounds 3 and 4 were tentatively assigned as protocatechuic acid-O-hexoside [36] and protocatechuic acid [37], respectively. Compound 10 may be a hydroxybenzoic acid derivative with the precursor ion at m/z 447.1867 [M–H] that dissociated to m/z 137.0238, which corresponds to a [hydroxybenzoic acid–H] adduct. One dihydroxybenzoic acid was tentatively identified in the D. bracteata extract as hypogallic acid (compound 4), producing m/z 108.0213 [M–H–COOH] as the main fragment [38]. Interestingly, the only phenolic acids found in the S. aqueum extract were compounds 3, 5 and 8, belonging to the benzoic acid group, and were identified as gallic acid (confirmed by commercial standard), bergenin [39] and theacitrin A (ester derivative) [40].

3.2.2. Flavonoids

Flavonoids were the most abundant compounds found in the three studied extracts (Table 4, Table 5 and Table 6). Six flavones were tentatively identified in the T. lanceolata extract. Compounds 26 and 27 with the main product ion at m/z 284.0324 [luteolin–H] were tentatively assigned as luteolin derivatives. Compound 33 produced m/z 343.1535 [M–hexose–H] and m/z 328.1302 [M–hexose–CH3–H] as the prominent fragments due to the loss of 162 Da hexose and a further 15 Da methyl group, and therefore was tentatively identified as luteolin-trimethyl ester-O-hexoside [41]. A potential luteolin derivative (compound 15) was also found in the D. bracteata extract, having the characteristic fragment ions at m/z 285.0397 as a luteolin adduct and m/z 107.0130 as a luteolin derivative.
Moreover, three O-methylated flavones were detected in the T. lanceolata extract. Compound 38 was tentatively identified as diosmetin (syn: 4-O-methylluteolin) that fragmented into luteolin at m/z 284.0321 [M–CH3–H], and the major luteolin fragments at m/z 133.0289 and m/z 107.0131 [42]. Compounds 35 and 36 with the two characteristic fragment ions at m/z 299.0552 [4-O-methylluteolin–H] and m/z 284.0319 [luteolin–H] were tentatively assigned as diosmetin derivatives. Furthermore, compound 22 in the D. bracteata extract was tentatively identified as a wogonin derivative (an O-methylated flavone), producing a fragment ion at m/z 283.1545 [43], most likely caused by a hexose loss.
Apigenin (compound 37) was tentatively identified as another flavone present in the T. lanceolata extract [42]. Compound 32 was tentatively assigned as an apigenin derivative due to the produced characteristic fragment at m/z 269.0450 [apigenin–H]. Compound 39 fragmented into m/z 268.0371 [M–CH3–H] as well as the characteristic apigenin fragments at m/z 117.0337 and m/z 151.0030, and was therefore tentatively identified as apigenin-7,4′-dimethyl ether [44].
The flavonol, quercetin, was identified in the T. lanceolata (compound 34) and S. aqueum (compound 27) extracts, which was confirmed by a commercial standard. Two more flavonols were identified in the S. aqueum extract. Compound 26 was confirmed as myricetin using a commercial standard, and compound 7 was tentatively identified as a kaempferol derivative, with the main fragment ion at m/z 284.0318 [kaempferol–H]. Catechin (compound 8) and epicatechin (compound 12), two flavanols, were identified in the D. bracteata extract and confirmed by commercial standards. Furthermore, compound 11 in the S. aqueum extract was tentatively assigned as gallocatechin gallate, producing the two characteristic fragment ions at m/z 125.0238 and m/z 169.0137. Compound 11 in the D. bracteata extract was tentatively identified as an eriodictyol derivative, a flavanone, with fragment ions at m/z 287.0552 as a deprotonated eriodictyol adduct and m/z 125.0239 as an eriodictyol fragment [45].

3.2.3. Flavonoid Glycosides

Flavonoid glycosides were also detected in the T. lanceolata extract. Compound 17 was tentatively identified as catechin rhamnoside, showing the main fragment ion at m/z 289.0709 by a 146 Da rhamnoside residue loss. Compounds 21 and 22 were identified as rutin (syn: quercetin-3-rutinoside) and quercetin-3-O-glucoside, respectively, and confirmed by commercial standards. The characteristic fragment ions at m/z 300.0275 and m/z 300.0266 were produced by a 308 Da rutinose and 162 Da glucose loss, respectively. Compounds 24 and 23 were tentatively identified as vitexin/isovitexin and vitexin/isovitexin dimer, respectively. The MS2 spectra showed the characteristic fragment ions at m/z 283.0606 [M–148–H] and m/z 311.0549 [M–120–H] [34], with the latter most likely produced by a neutral loss of a glucosyl residue. Compound 23 showed a further fragment ion at m/z 431.0974, corresponding to [M–vitexin/isovitexin–H]. Vitexin/isovitexin was also tentatively identified in the S. aqueum extract (compound 18). Compounds 25 and 28 were tentatively identified as glycosylated kaempferol, showing m/z 285.0392 and m/z 285.0397 as the main fragment ions that are typical of the kaempferol aglycone [32,46], and produced by a neutral loss of 308 Da (probably rhamnoglucose) and 278 Da (probably rhamnoxylose), respectively. Furthermore, compound 30 was tentatively identified as luteolin glycoside, showing luteolin aglycone as the main fragment ion at m/z 285.0402 [M–162–H] through the neutral loss of a hexose residue such as glucose or galactose [47]; however, glucose is more likely since it is the most common hexose in nature. Compound 31 was tentatively assigned as apigenin dihexoside [48], which produced apigenin as the main fragment (m/z 269.0451) through the neutral loss of two hexosyl groups.
Two flavonoid glycosides were also detected in the D. bracteata extract. Compound 18 was tentatively identified as isorhamnetin glycoside (a flavonol glycoside) by producing the two characteristic fragment ions at m/z 299.0194 and m/z 314.0470 [49], with the latter one resulting from a hexose loss. Compound 9 was tentatively identified as a catechin glycoside by producing m/z 289.0712 (catechin) as the main fragment ion through a 158-Da loss.
A total of 11 flavonoid glycosides were found in the S. aqueum extract (Table 6). Compound 6 was tentatively identified as luteolin-3-glucoside, showing m/z 285.0385 as the main fragment ion [50] through a 162-Da loss (glucoside moiety). Compounds 15 and 14 were tentatively identified as myricetin-3-O-β-D-galactopyranoside and its isomer producing major fragment ions at m/z 316.0220 (myricetin aglycone) after a 162-Da loss (galactose) and m/z 271.0250, which corresponds to 3-O-monoglycosides [51]. Compounds 17 and 22 were tentatively assigned as dihydrokaempferol-hexoside [52] and myricetin glycoside [53] due to the neutral hexose loss and the formation of the characteristic fragment ions at m/z 287.0185 [dihydrokaempferol–H] and m/z 317.0288 [myricetin–H], respectively. Compound 20 was tentatively identified as phloretin-diglucoside, a dihydrochalcone, producing the characteristic main fragment ions at m/z 357.0947 [M–H–(2 × 120)], m/z 387.1089 [M–H–120–90], and m/z 417.1104 [M–H–(2 × 90)] [54]. Compound 21 was identified as quercetin-3-O-glucoside and confirmed by a commercial standard. Compounds 23 and 25 were tentatively identified as quercetin glycosides, producing main fragments at m/z 300.0269 and m/z 301.0339 through a 132 Da pentose loss, and at m/z 271.0248 through a 162 Da hexose loss [55]. Compound 24 was identified as phloridzin, showing the characteristic fragment ions at m/z 167.0340 and m/z 273.0750 [39], with the latter resulting from a 162 Da loss.

3.2.4. Polyflavonoids

Procyanidins, also known as condensed tannins, are classified as polyflavonoids that were found in both T. lanceolata and D. bracteata extracts. Compounds 9 and 19 in the T. lanceolata extract as well as compounds 6, 7 and 10 in the D. bracteata extract were tentatively identified as B-type procyanidin dimers (or (epi)catechin-(epi)catechin) with a precursor ion at m/z 577.1331. The characteristic fragment ions included m/z 289.0710 [M–H–288] through interflavonoid C–C linkage cleavage, m/z 125.0237 [M–H–288–164] through heterocyclic ring fission (HRF) of the C-ring of the dimer, m/z 407.0778 [M–H–152–18] through Retro–Diels–Alder (RDA) fission of the heterocyclic ring followed by a water loss [56], and m/z 245.0814 [M–H–288–44] [32,47]. However, the difference in their fragmentation patterns can be attributed to the differences in monomeric flavan-3-ol unit linkages, leading to different isomers’ formation [57]. Compounds 18 and 20 in the T. lanceolata extract were tentatively assigned as procyanidin dimer monoglycoside, producing the diagnostic fragment ions at m/z 289.0714 (probably formed through quinone methide cleavage [58]), m/z 245.0814, m/z 587.1086 (152 Da loss through RDA fission) and m/z 569.0995 (152-Da loss with a further 18 Da loss through dehydration) [56]. Compound 2 in the T. lanceolata extract [59] and compound 13 in the D. bracteata extract [50] were tentatively identified as procyanidin trimers, showing the characteristic procyanidin fragmentation pathway. Furthermore, compound 5 (m/z 593.1262) in the D. bracteata extract was tentatively assigned as prodelphinidin A-type [50].

3.2.5. Tannins

Tannins, including one complex and seven hydrolysable tannins, were only detected in the S. aqueum extract. Compound 12 was tentatively identified as theasinesin A, a complex tannin, with the main fragment ions at m/z 741.0924 [M–H–152–18] and m/z 571.0792 [M–H–152–18–170] [39]. Compound 19 was identified as ellagic acid (m/z 300.9978) and confirmed by a commercial standard. This was detected as one of the characteristic fragment ions of five tentatively identified ellagitannins found in the S. aqueum extract. Compounds 4, 10 and 13 were tentatively assigned as castalagin [60], chebulagic acid [61] and casuarinin [62]. Compound 16 was tentatively identified as an ellagic acid derivative owing to the diagnostic fragment ions at m/z 299.9907 and m/z 300.9964. The presence of fragment ions at m/z 169 and m/z 301 reveals that the hydrolysable tannin molecule contains a simple galloyl ester and a hexahydroxy-diphenoyl (HHDP) moiety [63]. The observed fragmentation pattern of hydrolysable tannins was in agreement with those found in the literature [64], showing the characteristic loss of galloyl, HHDP, HHDP-glucose, and galloyl-HHDP-glucose. Compound 9 was tentatively identified as a galloylated tannin compound showing fragment ions at m/z 125.0237, m/z 169.0139 and m/z 633.0800.

3.2.6. Other Polyphenols

Other tentatively identified polyphenols detected in the T. lanceolata extract were compound 5 as a hydroxybenzaldehyde derivative [35], two stilbenes, including compound 7 as a piceatannol derivative [65] and compound 11 as pelargonidin-3-pentoside [66], producing the main fragment ions at m/z 121.0289 [hydroxybenzaldehyde acid–H], m/z 243.0567 [piceatannol–H] and m/z 271.0964 [pelargonidin–H]. Compound 29 was tentatively assigned as cinochonain l (m/z 451.1031), an alkaloid, showing the diagnostic fragment ions previously reported [36]. A coumarin derivative (compound 3) with the main fragment at m/z 147.0441 corresponding to coumaric acid was tentatively identified in the D. bracteata extract. Furthermore, compound 20 was tentatively assigned as a carnosic acid derivative, as the fragment ions at m/z 331.1887 and m/z 269.0455 correspond to carnosic acid and its fragment adducts. Moreover, organic acids, including malic acid [47] and citric acid [67], were tentatively identified in the D. bracteata (compound 1) and S. aqueum (compounds 1 and 2) extracts.

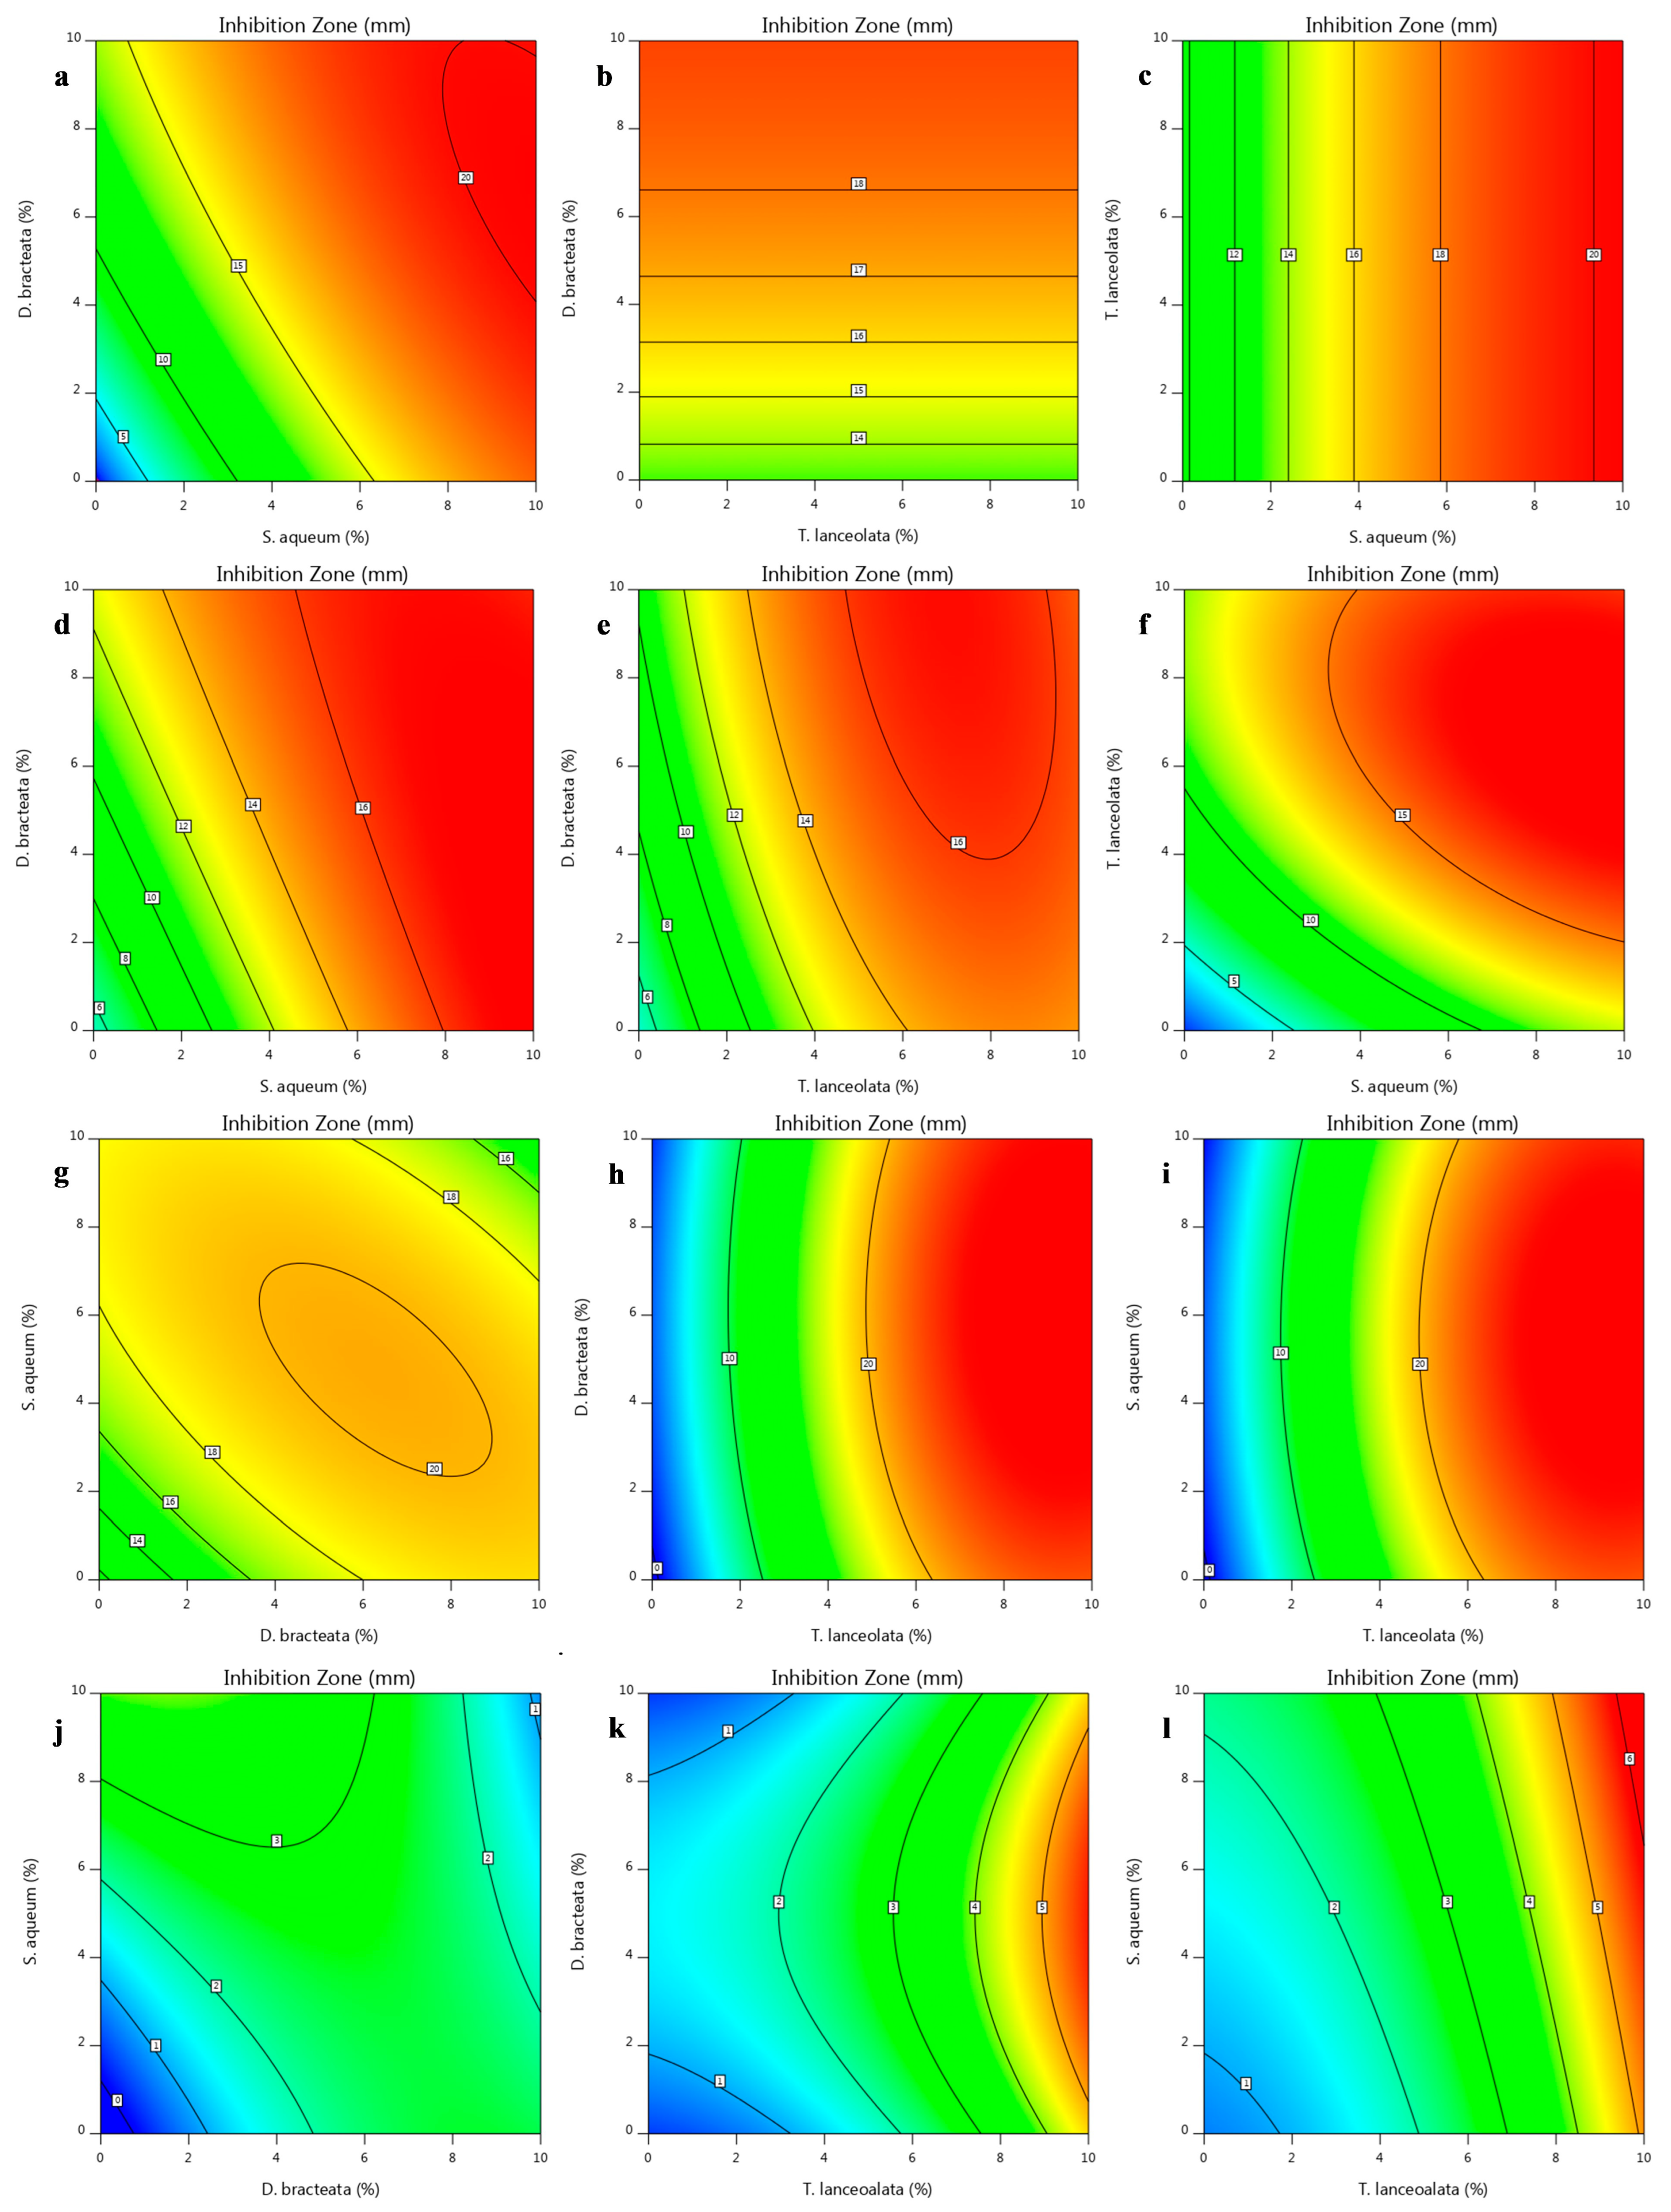
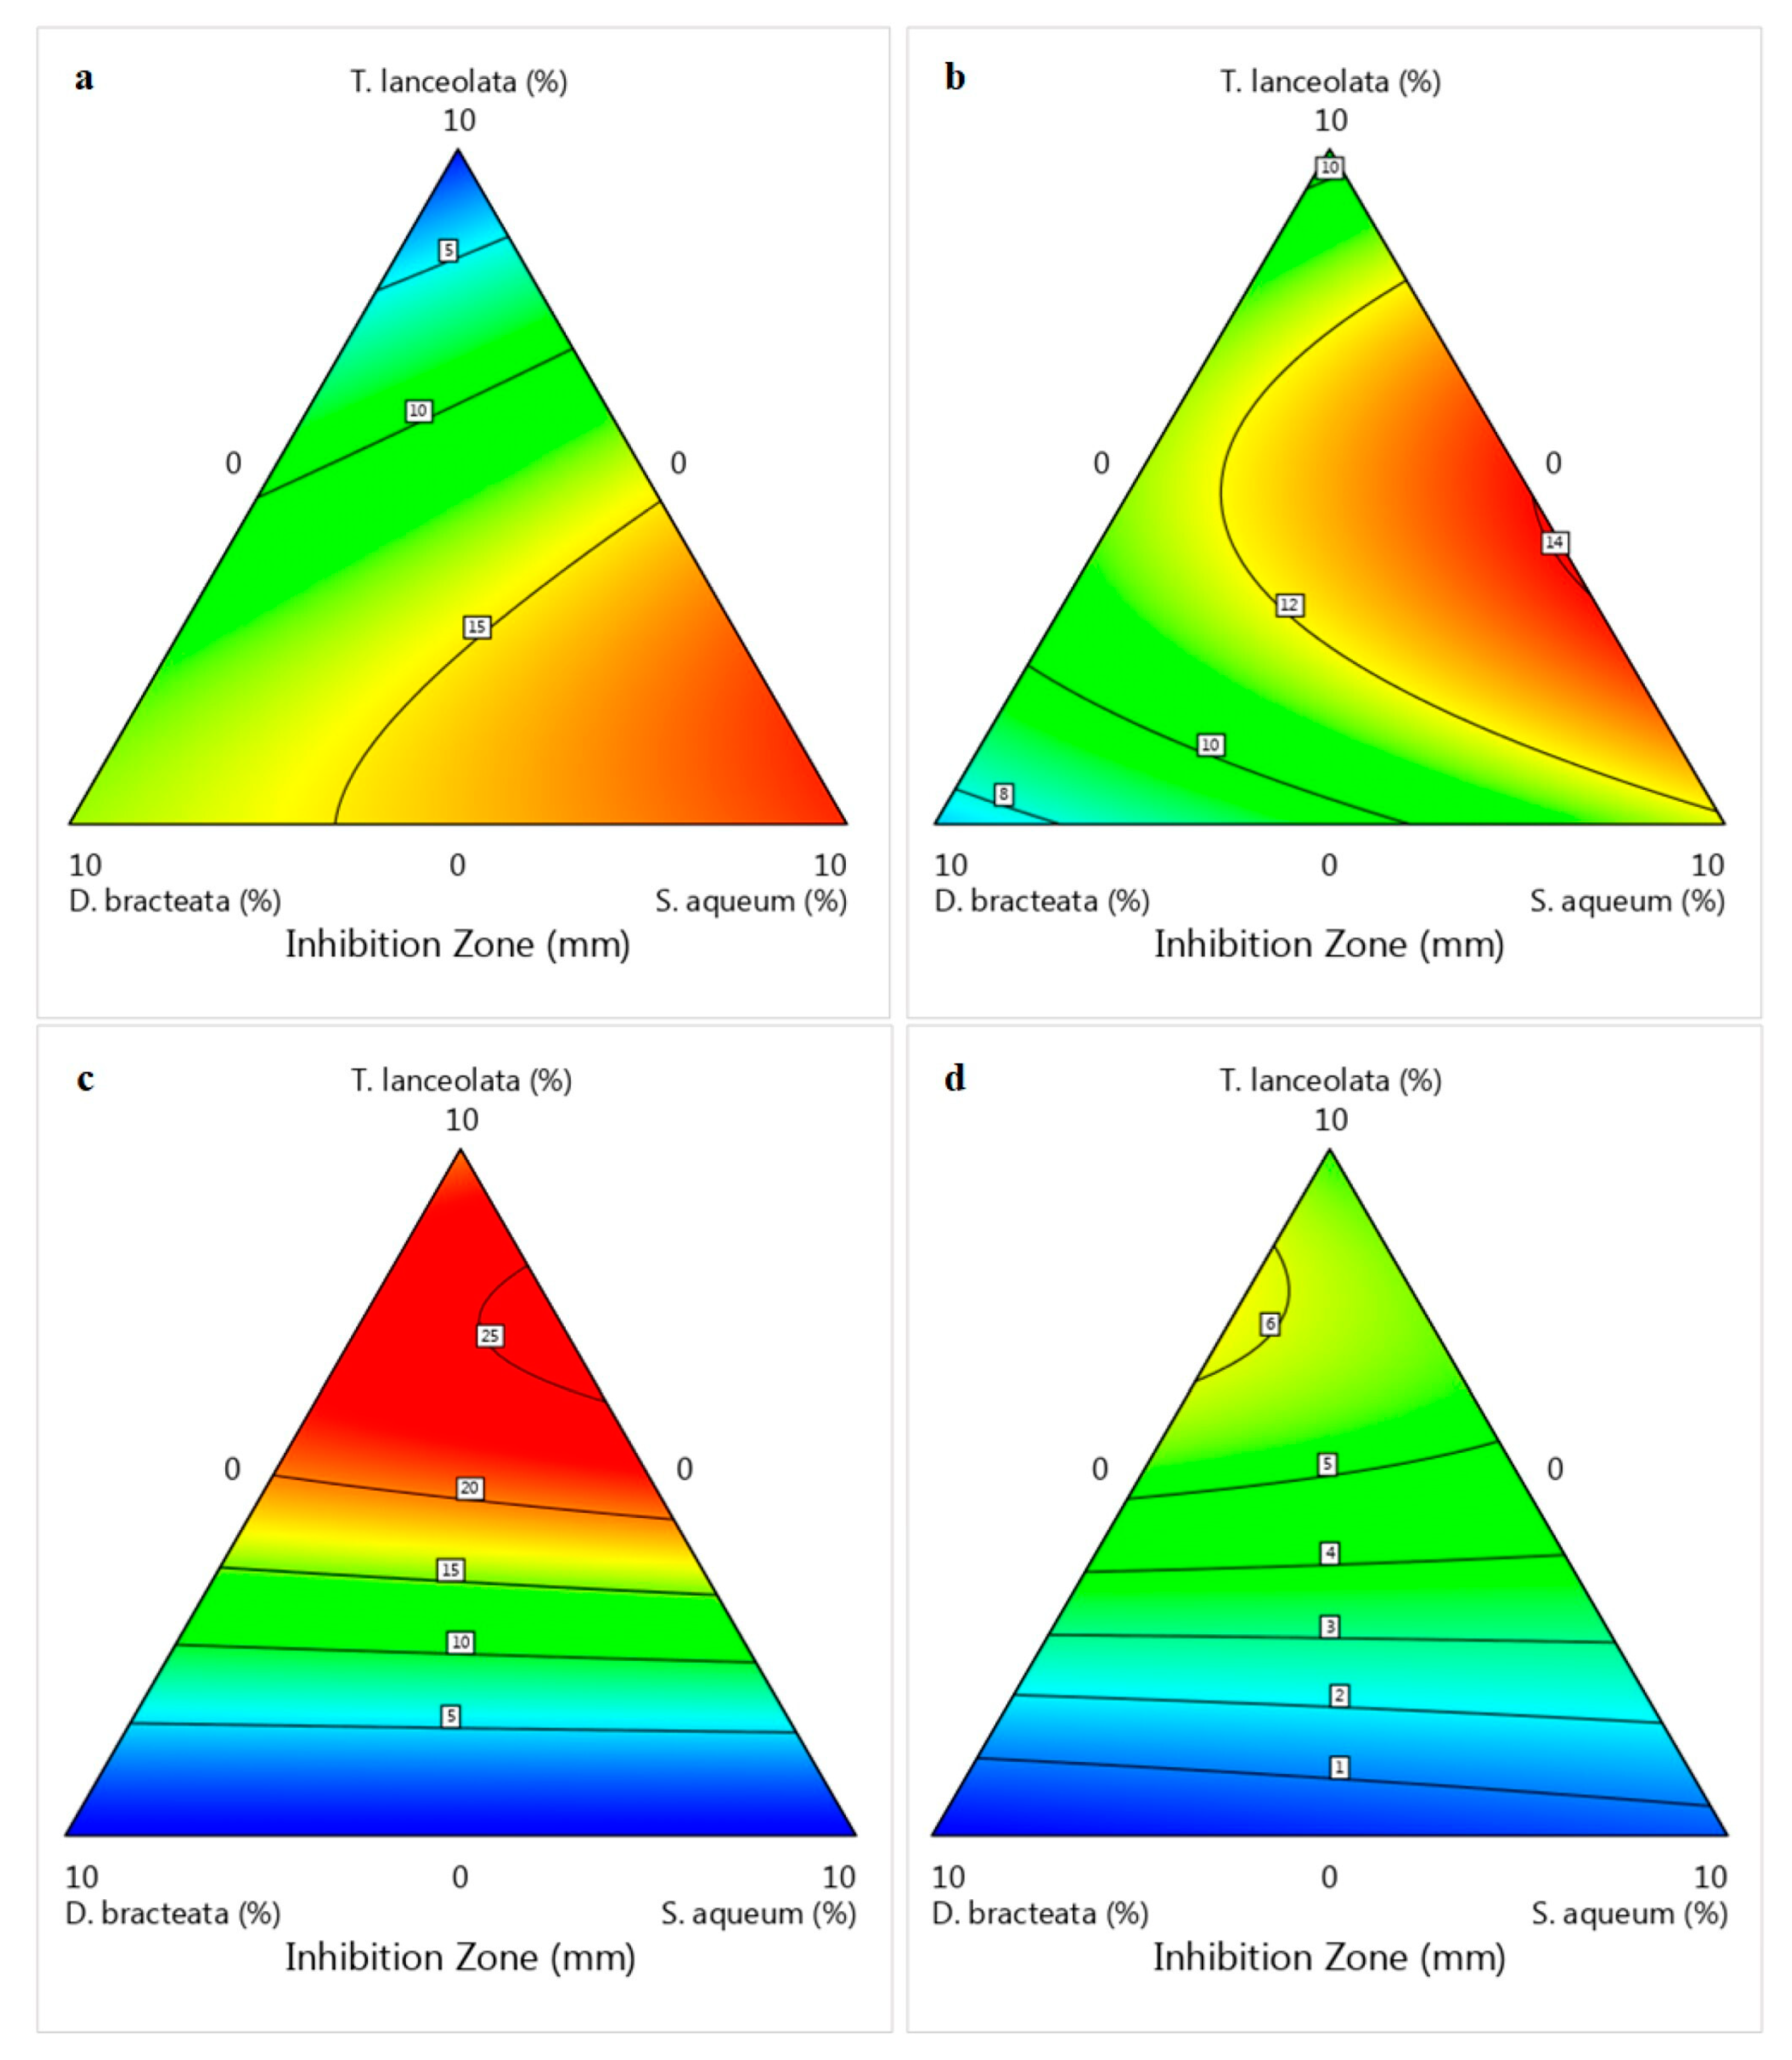
3.3. Antimicrobial Activity of Extract Blends

The aqueous extracts of plant tissues are rich in various phytochemicals that are readily soluble in water and influence their antimicrobial activity. However, the inhibitory activity can be improved by mixing two or more plant extracts through the synergistic interactions between their major and minor constituents. Hence, RSM optimization through Box–Behnken and Simplex–Lattice designs was performed for the first time on T. lanceolata, D. bracteata, and S. aqueum aqueous extracts as potential natural preservatives to find two optimised blends exhibiting the highest inhibitory activity against the growth of common spoilage microorganisms in vegetables. Table 2 shows the experimental matrix designs and results using Box–Behnken and Simplex–Lattice. Quadratic polynomial equations for predicting the inhibitory activity of extract blends against P. viridiflava, B. subtilis, R. diobovata and A. alternata were determined by multiple regression analysis of the experimental data obtained from Box–Behnken (Equations (1)–(4)) and Simplex–Lattice (Equations (5)–(8)) designs. In order to fit the data to the respective models, Box–Cox transformation and stepwise model reduction were performed, if needed. The resulting equations, including the hierarchy required for insignificant (p > 0.05) and significant (p < 0.05) terms, are given below:
(R1)1.35 = 46.59−0.07A + 10.30B + 18.16C−7.42BC−3.87B2−7.02C2
R2 = 15.22 + 3.66A + 1.53B + 3.94C−1.04AB−1.65AC−1.99BC−3.31A2−0.58B2−1.78C2
R3 = 20.22 + 11.51A + 0.89B + 0.49C−2.82BC−6.53A2−2.00B2−2.39C2
R4 = 2.74 + 2.17A−0.01B + 0.69C−1.50BC + 0.87A2−1.09B2
R5 = 0.32A + 13.39B + 18.69C + 11.74AB + 20.46AC−0.91BC
R6 = 9.45A + 7.28B + 11.80C + 12.24AB + 13.38AC
R 7   +   0.5 = 4.54 A + 0.72 B + 0.71 C + 7.20 A B + 8.25 A C
R 8   +   0.5 = 2.38 A + 0.67 B + 1.05 C + 3.28 A B + 2.11 A C
Table 7 summarises the statistical parameters obtained by performing ANOVA to check the reliability and adequacy of the developed models (details are given in Supplementary Materials, Tables S5–S12). The R2 values were in the range of 0.89–0.99 for the Box–Behnken design and 0.77–0.99 for the Simplex–Lattice design, showing sufficient model accuracy. This indicates that not only can the fitted models explain (p < 0.05) most of the variability in the experimental data, but there is also a strong correlation between the experimental and predicted values. In addition, the low reliability of the developed models for A. alternata in the Box–Behnken design and for B. subtilis and A. alternata in the Simplex–Lattice design was indicated by low R2 values, although they can be used to generate adequate desirability models. The insignificant p-values (p > 0.05) of the lack-of-fit test indicated that the models fit the inhibitory activity of extract blends and confirmed the reliability of the predicted models. However, the significant p-values (p < 0.05) of the lack-of-fit test for the inhibitory activity against R. diobovata demonstrated that the obtained quadratic models did not fit well in these experimental designs, even after Box–Cox transformation and stepwise model reduction, and therefore, these models cannot be used for predictions.
The growth inhibitory zone of Gram-negative P. viridiflava, the major cause of soft rot in vegetables such as capsicum, was in the range of 0–20.33 mm (Box–Behnken) and 0–19.52 mm (Simplex–Lattice) (Table 2). The most potent antibacterial extract was S. aqueum, followed by D. bracteate. In the presence of 5% S. aqueum and D. bracteata extracts, inhibition zones of 13.20 and 9.02 mm were observed, respectively, while T. lanceolata extract did not exhibit any inhibitory effect against P. viridiflava (Table 2). Increasing the concentration of extracts to 10% gave rise to an increase in the inhibitory activity against P. viridiflava by 2 and 1.5 times (S. aqueum and D. bracteata, respectively), but did not improve T. lanceolata activity. Blending the S. aqueum extract with the other two did not improve its ability to inhibit P. viridiflava growth, although it assisted in improving the antifungal activity. However, lower inhibition of P. viridiflava was observed using blends containing <5% S. aqueum (Simplex–Lattice). The linear terms in both designs were shown to affect (p < 0.05) the bacterial inhibitory activity, except for T. lanceolata extract, which had an insignificant (p > 0.05) inhibitory influence on P. viridiflava growth (Box–Behnken design). The interactions and quadratic terms of aqueous extracts indicated an inverse relationship with the bacterial inhibitory activity of the blend according to the Box–Behnken design (Equations (2) and (3)). However, the interaction terms in the Simplex–Lattice design led to a significant (p < 0.05) increase in antibacterial activity (Equations (6) and (7)). This was further illustrated in two-dimensional contour plots developed from the fitted model equations (Figure 1a–f). Both designs demonstrated the greatest impact of T. lanceolata content on the fungal inhibitory activity, with yeast being more sensitive than mould (Figure 1g–l and Figure 2c,d). No antifungal activity was observed by S. aqueum and D. bracteata extracts alone, whereas 5% T. lanceolata extract showed an inhibitory zone of 9.17 mm against R. diobovata which was doubled by increasing the concentration to 10%, and a 5.34 mm inhibitory zone was observed against A. alternata. The highest inhibitory zones against A. alternata were 8.29 and 5.96 mm using experimental runs 3 (Simplex–Lattice) and 4 (Box–Behnken), respectively, with different extracts’ combinations. This indicates the potential of the Simplex–Lattice mixture design, unlike Box–Behnken, to unfold the synergistic effect of the extracts on the blend’s antifungal activity at the ratio of 2/3 T. lanceolata, 1/6 D. bracteata, and 1/6 S. aqueum. This was also confirmed by ANOVA and the interaction terms of the developed models.
The observed antimicrobial activity is mainly attributed to the synergistic effect of organic acids and phenolic compounds, which has been well demonstrated [68] and is considered an added benefit of using fruit extracts as preservatives. Partially hydrophobic biphenols can bind with the microbial outer membrane and cause structural changes leading to enhanced membrane permeability, leakage of vital intracellular constituents, and disruption of metabolism [69]. The antimicrobial properties of different phenolic compounds have been extensively studied, such as catechin [70], gallic acid [71], chlorogenic acid [72], and hydrolysable tannins [73], which were identified as major phenolic compounds in the studied extracts. Procyanidin, a tentative major phenolic compound in D. bracteata and T. lanceolata extracts, has been shown to affect the strength of the lipopolysaccharide outer barrier in Gram-negative bacteria as observed by cranberry polyphenols [74]. Moreover, phenolic compounds with antioxidant activity can bind the essential growth nutrient “iron” and therefore inhibit microbial growth. Guo and colleagues observed a considerable iron binding capacity by quercetin in low pH environments [75], which is one of the major phenolics in the studied extracts, including S. aqueum, which also contains high amounts of organic acids such as quinic acid. The presence of organic acids, on the other hand, enhances the bacteria’s susceptibility to phenolic sublethal damage by reducing pH in the extra/intracellular environment, causing chemical gradient collapse, and interrupting metabolic pathways [76]. In addition, several studies have reported the wide-spectrum antibacterial activity of quinic acid, citric acid, and malic acid, and their combinations, which were identified as major organic acids in S. aqueum and D. bracteata extracts (Table 3). The presence of sugars in the extracts can also contribute to the observed antimicrobial activity, as was suggested by Lacombe and co-authors. The authors reported the effect of sugar fractions of cranberry juice on its antimicrobial activity [74], which can be attributed to the osmotic effect of sugar compounds on microbial cells. However, this needs to be further investigated. The lower antimicrobial activity against A. alternata can be attributed to the mould’s phenylacrylic acid decarboxylase system for degrading high concentrations of organic acids for their spores to survive and outgrow [76]. However, the presence of chlorogenic acid, a major compound in T. lanceolata extract, can contribute to its antifungal activity. Several studies have shown the fungicidal activity of chlorogenic acid and its derivatives, which occurs through fungal cell lysis and permeabilization of the spore membrane [77]. Nevertheless, further studies are needed to understand the antimicrobial mechanism of these extracts and the role of sugars, organic acids, and phenolic compounds, as well as major and minor compounds.
The RSM desirability function was used to optimise the blends and maximise the antimicrobial activity. The two extract blends containing “9.35% T. lanceolata, 5.00% D. bracteata and 5.00% S. aqueum” and “4.72% T. lanceolata and 5.28% S. aqueum”, respectively, presented the best combinations based on the models developed through Box–Behnken and Simplex–Lattice designs. The d-values for the optimised combinations were 0.927 and 0.822 (Box–Behnken and Simplex–Lattice, respectively), indicating that about 93% and 82% of desirability in statistical optimisation were satisfied. The RSM models were tested by performing an external validation using the optimised extract blends (Table 8). The experimental values for inhibitory activity were within the ±95% prediction limits proposed by the regression models, which confirms the reliability and predictivity of the developed models.

4. Conclusions

To the best of our knowledge, this study provides, for the first time, information about organic acids and non-anthocyanin polyphenols in the aqueous extracts from T. lanceolata leaves, D. bracteata and S. aqueum fruits. The potential of aqueous extracts containing various phytochemicals such as organic acids and non-anthocyanin polyphenols to inhibit the growth of spoilage microorganisms, in particular P. viridiflava, which causes soft rot in a wide range of vegetables, was also demonstrated. The results obtained in this study could suggest various value-added applications for these plant materials and their extracts. Indeed, being a high source of bioactive compounds with antioxidant and antimicrobial properties such as polyphenols, these plants could be valorised as an industrial source of bioactive compounds, which will find application as effective alternatives to conventional chemical preservatives in the food, pharmaceutical, and cosmetic sectors. However, further studies are needed to confirm the identity of the tentatively identified compounds, to assess the impact of harvest time and storage conditions on the polyphenol/phytochemical composition, and to find stronger antifungal plant extracts.

Supplementary Materials

The following supporting information can be downloaded at: https://www.mdpi.com/article/10.3390/foods12030623/s1, Representative UHPLC-UV chromatograms (Figure S1), mass spectral data of non-identified compounds in the extracts (Tables S1–S3) and of commercial standards (Table S4), full-MS scan and product ion mass spectra of selected identified compounds (Figures S2–S7), ANOVA (Tables S5–S12) and normal plot of residuals and predicted versus actual plot (Figures S8–S15) for the activity against studied microorganisms are summarized in the Supplementary Materials.

Author Contributions

Conceptualization, M.S.; methodology, M.S. and A.D.T.P.; software, M.S.; validation, Y.S., M.E.N. and R.M.; formal analysis, M.S.; investigation, M.S.; resources, Y.S.; writing—original draft preparation, M.S.; writing—review and editing, A.D.T.P., M.E.N., R.M., D.S. and Y.S.; visualization, M.S.; supervision, M.E.N., R.M. and Y.S.; project administration, Y.S.; funding acquisition, Y.S. All authors have read and agreed to the published version of the manuscript.

Funding

This research was funded by Horticulture Innovation Australia Ltd. through the Naturally Nutritious project (HN15001) and the Australian Research Council’s (ARC) Industrial Transformation Training Centre (ITTC) for Uniquely Australian Foods (grant number: IC180100045).

Data Availability Statement

The data presented in this study are available on request from the corresponding author.

Acknowledgments

The authors acknowledge the Traditional Owners of the lands on which the Tasmannia lanceolata, Diploglottis bracteata, and Syzygium aqueum were harvested and respect the knowledge and experience the Traditional Owners hold regarding the care, harvest, and use of these plants. Maral Seididamyeh acknowledges the support from Australian Government by the Research Training Program Scholarship for her doctorate studies at the University of Queensland (Brisbane, Australia).

Conflicts of Interest

The authors declare no conflict of interest. The funders had no role in the design of the study; in the collection, analyses, or interpretation of data; in the writing of the manuscript; or in the decision to publish the results.

References

  1. Alderees, F.; Akter, S.; Mereddy, R.; Sultanbawa, Y. Antimicrobial activity of nanoencapsulated essential oils of Tasmannia lanceolata, Backhousia citriodora and Syzygium anisatum against weak-acid resistant Zygosaccharomyces bailii in clear apple juice. Beverages 2021, 7, 67. [Google Scholar] [CrossRef]
  2. Bobasa, E.M.; Phan, A.D.T.; Netzel, M.E.; Cozzolino, D.; Sultanbawa, Y. Hydrolysable tannins in Terminalia ferdinandiana Exell fruit powder and comparison of their functional properties from different solvent extracts. Food Chem. 2021, 358, 129833. [Google Scholar] [CrossRef] [PubMed]
  3. Lim, T.K. Syzygium aqueum. In Edible Medicinal and Non Medicinal Plants: Fruits; Springer: Dordrecht, The Netherlands, 2012; Volume 3, pp. 738–742. [Google Scholar]
  4. Kupsch, K. Diploglottis. Australian Bushfoods Magazine. Available online: https://www.ausbushfoods.com/bushfoodsonline/backissues/Issue15/Issue_15_2.htm (accessed on 17 November 2021).
  5. Winnett, V.; Boyer, H.; Sirdaarta, J.; Cock, I. The potential of tasmannia lanceolata as a natural preservative and medicinal agent: Antimicrobial activity and toxicity. Pharmacogn. Commun. 2014, 4, 42–52. [Google Scholar] [CrossRef]
  6. Cock, I. Medicinal and aromatic plants—Australia. In Ethnopharmacology, Encyclopedia of Life Support Systems (EOLSS); UNESCO: Oxford, UK, 2011. [Google Scholar]
  7. Bouarab Chibane, L.; Degraeve, P.; Ferhout, H.; Bouajila, J.; Oulahal, N. Plant antimicrobial polyphenols as potential natural food preservatives. J. Sci. Food Agric. 2019, 99, 1457–1474. [Google Scholar] [CrossRef]
  8. Park, C.H.; Yeo, H.J.; Baskar, T.B.; Park, Y.E.; Park, J.S.; Lee, S.Y.; Park, S.U. In Vitro Antioxidant and Antimicrobial Properties of Flower, Leaf, and Stem Extracts of Korean Mint. Antioxidants 2019, 8, 75. [Google Scholar] [CrossRef]
  9. Bobinaitė, R.; Viškelis, P.; Sarkinas, A.; Venskutonis, P. Phytochemical composition, antioxidant and antimicrobial properties of raspberry fruit, pulp, and marc extracts. CyTA—J. Food 2013, 11, 334–342. [Google Scholar] [CrossRef]
  10. Boudet, A.-M. Evolution and current status of research in phenolic compounds. Phytochemistry 2007, 68, 2722–2735. [Google Scholar] [CrossRef]
  11. Deng, Y.; Zhao, Y.; Padilla-Zakour, O.; Yang, G. Polyphenols, antioxidant and antimicrobial activties of leaf and bark extracts of Solidago canadensis L. Ind. Crops Prod. 2015, 74, 803–809. [Google Scholar] [CrossRef]
  12. Yang, D.; Chen, Y.; Guo, F.; Huang, B.; Okyere, S.A.; Wang, H. Comparative analysis of chemical composition, antioxidant and antimicrobial activties of leaves, leaf tea and root from Codonopsis pilosula. Ind. Crops Prod. 2019, 142, 111844. [Google Scholar] [CrossRef]
  13. Hong, H.T.; Phan, A.D.T.; O’Hare, T.J. Temperature and Maturity Stages Affect Anthocyanin Development and Phenolic and Sugar Content of Purple-Pericarp Supersweet Sweetcorn during Storage. J. Agric. Food Chem. 2021, 69, 922–931. [Google Scholar] [CrossRef]
  14. Phan, A.D.T.; Chaliha, M.; Sultanbawa, Y.; Netzel, M.E. Nutritional Characteristics and Antimicrobial Activity of Australian Grown Feijoa (Acca sellowiana). Foods 2019, 8, 376. [Google Scholar] [CrossRef]
  15. Moldoveanu, S.C.; Poole, T.; Scott, W.A. An LC-MS Method for the Analysis of Some Organic Acids in Tobacco Leaf, Snus, and Wet Snuff. Contrib. Tob. Res. 2018, 28, 30–41. [Google Scholar] [CrossRef]
  16. Singleton, V.L.; Orthofer, R.; Lamuela-Raventós, R.M. Analysis of total phenols and other oxidation substrates and antioxidants by means of folin-ciocalteu reagent. Method Enzymol. 1999, 299, 152–178. [Google Scholar]
  17. Brand-Williams, W.; Cuvelier, M.E.; Berset, C. Use of a free radical method to evaluate antioxidant activity. LWT Food Sci. Technol. 1995, 28, 25–30. [Google Scholar] [CrossRef]
  18. Hmdb-Database. The Human Metabolome Database. Available online: https://hmdb.ca/ (accessed on 21 November 2021).
  19. Djenane, D.; Yangüela, J.; Montañés, L.; Djerbal, M.; Roncalés, P. Antimicrobial activity of Pistacia lentiscus and Satureja montana essential oils against Listeria monocytogenes CECT 935 using laboratory media: Efficacy and synergistic potential in minced beef. Food Control 2011, 22, 1046–1053. [Google Scholar] [CrossRef]
  20. Shezi, S.; Magwaza, L.S.; Tesfay, S.Z.; Mditshwa, A. Biochemical changes in response to canopy position of avocado fruit (cv. ‘Carmen’ and ‘Hass’) during growth and development and relationship with maturity. Sci. Hortic. 2020, 265, 109227. [Google Scholar] [CrossRef]
  21. Blakey, R.J.; Tesfay, S.Z.; Bower, J.P. Changes in sugars, total protein, and oil in ‘Hass’ avocado (Parsea americana Mill.) fruit during ripening. J. Hortic. Sci. Biotechnol. 2012, 87, 381–387. [Google Scholar] [CrossRef]
  22. Sheng, X.; Jung, T.; Wesson, J.A.; Ward, M.D. Adhesion at calcium oxalate crystal surfaces and the effect of urinary constituents. Proc. Natl. Acad. Sci. USA 2004, 102, 267–272. [Google Scholar] [CrossRef]
  23. Ramos-Aguilar, A.L.; Ornelas-Paz, J.; Tapia-Vargas, L.M.; Ruiz-Cruz, S.; Gardea-Béjar, A.A.; Yahia, E.M.; Ornelas-Paz, J.D.J.; Pérez-Martínez, J.D.; Rios-Velasco, C.; Ibarra-Junquera, V. The importance of the bioactive compounds of avocado fruit (Persea americana Mill.) on human health. Biotecnia 2019, 21, 154–162. [Google Scholar] [CrossRef]
  24. Jang, S.-A.; Park, D.W.; Kwon, J.E.; Song, H.S.; Park, B.; Jeon, H.; Sohn, E.-H.; Koo, H.J.; Kang, S.C. Quinic acid inhibits vascular inflammation in TNF-α-stimulated vascular smooth muscle cells. Biomed. Pharmacother. 2017, 96, 563–571. [Google Scholar] [CrossRef]
  25. Yazdi, S.E.; Prinsloo, G.; Heyman, H.M.; Oosthuizen, C.B.; Klimkait, T.; Meyer, J.J.M. Anti-HIV-1 activity of quinic acid isolated from Helichrysum mimetes using NMR-based metabolomics and comutational analysis. S. Afr. J. Bot. 2019, 126, 328–339. [Google Scholar] [CrossRef]
  26. Alderees, F.; Mereddy, R.; Webber, D.; Nirmal, N.; Sultanbawa, Y. Mechanism of action against food spoilage yeasts and bioactivity of Tasmannia lanceloata, Backhousia citriodora and Syzygium anisatum plant solvent extracts. Foods 2018, 7, 179. [Google Scholar] [CrossRef] [PubMed]
  27. Netzel, M.; Netzel, G.; Tian, Q.; Schwartz, S.; Konczak, I. Native Australian fruits—A novel source of antioxidants for food. Innov. Food Sci. Emerg. Technol. 2007, 8, 339–346. [Google Scholar] [CrossRef]
  28. Konczak, I.; Zabaras, D.; Dunstan, M.; Aguas, P. Antioxidant capacity and hydrophilic phytochemicals in commercially grown native Australian fruits. Food Chem. 2010, 123, 1048–1054. [Google Scholar] [CrossRef]
  29. Jaakola, L.; Määttä-Riihinen, K.; Kärenlampi, S.; Hohtola, A. Activation of flavonoid biosynthesis by solar radiation in bilberry (Vaccinium myrtillus L.) leaves. Planta. 2004, 218, 721–728. [Google Scholar] [PubMed]
  30. Cheynier, V.; Comte, G.; Davies, K.M.; Lattanzio, V.; Martens, S. Plant phenolics: Recent advances on their biosynthesis, genetics, and ecophysiology. Plant Physiol. Biochem. 2013, 72, 1–20. [Google Scholar] [CrossRef]
  31. Jaiswal, R.; Müller, H.; Müller, A.; Karar, M.G.E.; Kuhnert, N. Identification and characterization of chlorogenic acids, chlorogenic acid glycosides and flavonoids from Lonicera henryi L. (Caprifoliaceae) leaves by LC–MS. Phytochemistry 2014, 108, 252–263. [Google Scholar] [CrossRef]
  32. Trujillo-Mayol, I.; Casas-Forero, N.; Pastene-Navarrete, E.; Silva, F.L.; Alarcón-Enos, J. Fractionation and Hydrolyzation of Avocado Peel Extract: Improvement of Antibacterial Activity. Antibiotics 2020, 10, 23. [Google Scholar] [CrossRef]
  33. Liu, S.; Marsol-Vall, A.; Laaksonen, O.; Kortesniemi, M.; Yang, B. Characterization and Quantification of Nonanthocyanin Phenolic Compounds in White and Blue Bilberry (Vaccinium myrtillus) Juices and Wines Using UHPLC-DAD−ESI-QTOF-MS and UHPLC-DAD. J. Agric. Food Chem. 2020, 68, 7734–7744. [Google Scholar] [CrossRef]
  34. Qian, W.; Wu, W.; Kang, Y.; Wang, Y.; Yang, P.; Deng, Y.; Ni, C.; Huang, J. Comprehensive identification of minor components and bioassay-guided isolation of an unusual antioxidant from Azolla imbricata using ultra-high performance liquid chromatography—Quadrupole time-of-flight mass spectrometry combined with multicomponent knockout and bioactivity evaluation. J. Chromatogr. A 2019, 1609, 460435. [Google Scholar] [CrossRef]
  35. Hong, Y.; Wang, Z.; Barrow, C.; Dunshea, F.; Suleria, H. High-Throughput Screening and Characterization of Phenolic Compounds in Stone Fruits Waste by LC-ESI-QTOF-MS/MS and Their Potential Antioxidant Activities. Antioxidants 2021, 10, 234. [Google Scholar] [CrossRef]
  36. Wang, H.; Ye, Y.h.; Wang, H.h.; Liu, J.; Liu, Y.j.; Jiang, B.W. HPLC-QTOF-MS/MS profiling, antioxidant, and α-glucosidase inhibitory activities of Pyracantha fortuneana fruit extracts. J. Food Biochem. 2019, 43, e12821. [Google Scholar] [CrossRef] [PubMed]
  37. Mallmann, L.P.; Tischer, B.; Vizzotto, M.; Rodrigues, E.; Manfroi, V. Comprehensive identification and quantification of unexploited phenolic compounds from red and yellow araçá (Psidium cattleianum Sabine) by LC-DAD-ESI-MS/MS. Food Res. Int. 2020, 131, 108978. [Google Scholar] [CrossRef]
  38. Li, H.; Zhang, D.; Tan, L.-H.; Yu, B.; Zhao, S.-P.; Cao, W.-G. Comparison of the antioxidant properties of various solvent extracts from Dipsacus asperoides and identification of phenolic compounds by LC-ESI-QTOF-MS–MS. South Afr. J. Bot. 2017, 109, 1–8. [Google Scholar] [CrossRef]
  39. Singh, D.; Siew, Y.-Y.; Chong, T.-I.; Yew, H.-C.; Ho, S.S.-W.; Lim, C.S.E.-S.; Tan, W.-X.; Neo, S.-Y.; Koh, H.-L. Identification of Phytoconstituents in Leea indica (Burm. F.) Merr. Leaves by High Performance Liquid Chromatography Micro Time-of-Flight Mass Spectrometry. Molecules 2019, 24, 714. [Google Scholar] [CrossRef] [PubMed]
  40. Cheng, L.; Yang, Q.-Q.; Chen, Z.; Zhang, J.-R.; Chen, Q.; Wang, Y.; Wei, X. Distinct Changes of Metabolic Profile and Sensory Quality during Qingzhuan Tea Processing Revealed by LC-MS-Based Metabolomics. J. Agric. Food Chem. 2020, 68, 4955–4965. [Google Scholar] [CrossRef] [PubMed]
  41. Olennikov, D.N.; Chirikova, N.K.; Kashchenko, N.I.; Nikolaev, V.M.; Kim, S.-W.; Vennos, C. Bioactive Phenolics of the Genus Artemisia (Asteraceae): HPLC-DAD-ESI-TQ-MS/MS Profile of the Siberian Species and Their Inhibitory Potential Against α-Amylase and α-Glucosidase. Front. Pharmacol. 2018, 9, 756. [Google Scholar] [CrossRef]
  42. Yapıcı, İ.; Altay, A.; Öztürk Sarıkaya, B.; Korkmaz, M.; Atila, A.; Gülçin, İ.; Köksal, E. In vitro antioxidant and cytotoxic activities of extracts of endemic Tanacetum erzincanense together with phenolic content by LC-ESI-QTOF-MS. Chem. Biodivers. 2021, 18, e2000812. [Google Scholar] [CrossRef]
  43. Li, J.; Wang, Y.-H.; Smillie, T.J.; Khan, I.A. Identification of phenolic compounds from Scutellaria lateriflora by liquid chromatography with ultraviolet photodiode array and electrospray ionization tandem mass spectrometry. J. Pharm. Biomed. Anal. 2012, 63, 120–127. [Google Scholar] [CrossRef]
  44. Koprivica, M.R.; Trifković, J.; Dramićanin, A.M.; Gašić, U.M.; Akšić, M.M.F.; Milojković-Opsenica, D.M. Determination of the phenolic profile of peach (Prunus persica L.) kernels using UHPLC–LTQ OrbiTrap MS/MS technique. Eur. Food Res. Technol. 2018, 244, 2051–2064. [Google Scholar] [CrossRef]
  45. Kečkeš, S.; Gašić, U.; Veličković, T.Ć.; Milojković-Opsenica, D.; Natić, M.; Tešić, Ž. The determination of phenolic profiles of Serbian unifloral honeys using ultra-high-performance liquid chromatography/high resolution accurate mass spectrometry. Food Chem. 2013, 138, 32–40. [Google Scholar] [CrossRef] [PubMed]
  46. Jaiswal, R.; Karar, M.G.E.; Gadir, H.A.; Kuhnert, N. Identification and characterisation of phenolics from Ixora coccinea L. (Rubiaceae) by liquid chromatography multi-stage mass spectrometry. Phytochem. Anal. 2014, 25, 567–576. [Google Scholar] [CrossRef]
  47. Karar, M.G.E.; Kuhnert, N. UPLC-ESI-Q-TOF-MS/MS Characterization of Phenolics from Crataegus monogyna and Crataegus laevigata (Hawthorn) Leaves, Fruits and their Herbal Derived Drops (Crataegutt Tropfen). J. Chem. Biol. Ther. 2016, 1, 102. [Google Scholar] [CrossRef]
  48. Silva, N.A.d.; Rodrigues, E.; Mercadante, A.Z.; de Rosso, V.V. Phenolic compounds and carotenoids from four fruits native from the Brazilian Atlantic forest. J. Agric. Food Chem. 2014, 62, 5072–5084. [Google Scholar] [CrossRef]
  49. Olate-Gallegos, C.; Barriga, A.; Vergara, C.; Fredes, C.; García, P.; Giménez, B.; Robert, P. Identification of Polyphenols from Chilean Brown Seaweeds Extracts by LC-DAD-ESI-MS/MS. J. Aquat. Food Prod. Technol. 2019, 28, 375–391. [Google Scholar] [CrossRef]
  50. Goufo, P.; Singh, R.K.; Cortez, I. A Reference List of Phenolic Compounds (Including Stilbenes) in Grapevine (Vitis vinifera L.) Roots, Woods, Canes, Stems, and Leaves. Antioxidants 2020, 9, 398. [Google Scholar] [CrossRef]
  51. Ablajan, K.; Abliz, Z.; Shang, X.Y.; He, J.M.; Zhang, R.P.; Shi, J.G. Structural characterization of flavonol 3,7-di-O-glycosides and determination of the glycosylation position by using negative ion electrospray ionization tandem mass spectrometry. J. Mass Spectrom. 2006, 41, 352–360. [Google Scholar] [CrossRef] [PubMed]
  52. Kang, J.; Price, W.E.; Ashton, J.; Tapsell, L.C.; Johnson, S. Identification and characterization of phenolic compounds in hydromethanolic extracts of sorghum wholegrains by LC-ESI-MSn. Food Chem. 2016, 211, 215–226. [Google Scholar] [CrossRef]
  53. Yasir, M.; Sultana, B.; Nigam, P.S.; Owusu-Apenten, R. Antioxidant and genoprotective activity of selected cucurbitaceae seed extracts and LC–ESIMS/MS identification of phenolic components. Food Chem. 2016, 199, 307–313. [Google Scholar] [CrossRef]
  54. De Beer, D.; Schulze, A.E.; Joubert, E.; De Villiers, A.; Malherbe, C.J.; Stander, M.A. Food Ingredient Extracts of Cyclopia subternata (Honeybush): Variation in Phenolic Composition and Antioxidant Capacity. Molecules 2012, 17, 14602–14624. [Google Scholar] [CrossRef]
  55. Lhuillier, A.; Fabre, N.; Moyano, F.; Martins, N.; Claparols, C.; Fourasté, I.; Moulis, C. Comparison of flavonoid profiles of Agauria salicifolia (Ericaceae) by liquid chromatography-UV diode array detection–electrospray ionisation mass spectrometry. J. Chromatogr. A 2007, 1160, 13–20. [Google Scholar] [CrossRef]
  56. Ojwang, L.O.; Yang, L.; Dykes, L.; Awika, J. Proanthocyanidin profile of cowpea (Vigna unguiculata) reveals catechin-O-glucoside as the dominant compound. Food Chem. 2013, 139, 35–43. [Google Scholar] [CrossRef]
  57. Maier, V.; Metzler, D.M.; Huber, A. 3-0-Caffeoylshikimic acid (dactylifric acid) and its isomers, a new class of enzymic browning substrates. Biochem. Biophys. Res. Commun. 1964, 14, 124–128. [Google Scholar] [CrossRef] [PubMed]
  58. Zerbib, M.; Mazauric, J.-P.; Meudec, E.; Le Guernevé, C.; Lepak, A.; Nidetzky, B.; Cheynier, V.; Terrier, N.; Saucier, C. New flavanol O-glycosides in grape and wine. Food Chem. 2018, 266, 441–448. [Google Scholar] [CrossRef] [PubMed]
  59. Escobar-Avello, D.; Olmo-Cunillera, A.; Lozano-Castellón, J.; Marhuenda-Muñoz, M.; Vallverdú-Queralt, A. A Targeted Approach by High Resolution Mass Spectrometry to Reveal New Compounds in Raisins. Molecules 2020, 25, 1281. [Google Scholar] [CrossRef] [PubMed]
  60. García-Villalba, R.; Espín, J.C.; Tomás-Barberán, F.A.; Rocha-Guzmán, N.E. Comprehensive characterization by LC-DAD-MS/MS of the phenolic composition of seven Quercus leaf teas. J. Food Compos. Anal. 2017, 63, 38–46. [Google Scholar] [CrossRef]
  61. Li, D.; Zhao, J.; Xie, J.; Li, S. A novel sample preparation and on-line HPLC–DAD–MS/MS–BCD analysis for rapid screening and characterization of specific enzyme inhibitors in herbal extracts: Case study of α-glucosidase. J. Pharm. Biomed. Anal. 2014, 88, 130–135. [Google Scholar] [CrossRef]
  62. Bijttebier, S.; Van der Auwera, A.; Voorspoels, S.; Noten, B.; Hermans, N.; Pieters, L.; Apers, S. A First Step in the Quest for the Active Constituents in Filipendula ulmaria (Meadowsweet): Comprehensive Phytochemical Identification by Liquid Chromatography Coupled to Quadrupole-Orbitrap Mass Spectrometry. Planta Medica 2016, 82, 559–572. [Google Scholar] [CrossRef]
  63. Arapitsas, P.; Menichetti, S.; Vincieri, F.F.; Romani, A. Hydrolyzable Tannins with the Hexahydroxydiphenoyl Unit and the m-Depsidic Link: HPLC-DAD-MS Identification and Model Synthesis. J. Agric. Food Chem. 2007, 55, 48–55. [Google Scholar] [CrossRef]
  64. Arapitsas, P. Hydrolyzable tannin analysis in food. Food Chem. 2012, 135, 1708–1717. [Google Scholar] [CrossRef]
  65. Escobar-Avello, D.; Lozano-Castellón, J.; Mardones, C.; Pérez, A.J.; Saéz, V.; Riquelme, S.; von Baer, D.; Vallverdú-Queralt, A. Phenolic profile of grape canes: Novel compounds identified by LC-ESI-LTQ-Orbitrap-MS. Molecules 2019, 24, 3763. [Google Scholar]
  66. Abid, M.; Yaich, H.; Cheikhrouhou, S.; Khemakhem, I.; Bouaziz, M.; Attia, H.; Ayadi, M.A. Antioxidant properties and phenolic profile characterization by LC–MS/MS of selected Tunisian pomegranate peels. J. Food Sci. Technol. 2017, 54, 2890–2901. [Google Scholar] [CrossRef]
  67. Mata, A.; Ferreira, J.; Semedo, C.; Serra, T.; Duarte, C.; Bronze, M. Contribution to the characterization of Opuntia spp. juices by LC–DAD–ESI-MS/MS. Food Chem. 2016, 210, 558–565. [Google Scholar] [CrossRef] [PubMed]
  68. de Oliveira, C.E.V.; Stamford, T.L.M.; Neto, N.J.G.; de Souza, E.L. Inhibition of Staphylococcus aureus in broth and meat broth using synergies of phenolics and organic acids. Int. J. Food Microbiol. 2010, 137, 312–316. [Google Scholar] [CrossRef] [PubMed]
  69. Kwon, Y.-I.; Apostolidis, E.; Labbe, R.; Shetty, K. Inhibition of Staphylococcus aureus by phenolic phytochemicals of selected clonal herbs species of Lamiaceae family and likely mode of action through proline oxidation. Food Biotechnol. 2007, 21, 71–89. [Google Scholar] [CrossRef]
  70. Ma, Y.; Ding, S.; Fei, Y.; Liu, G.; Jang, H.; Fang, J. Antimicrobial activity of anthocyanins and catechins agianst foodborne pathogens Escherichia coli and Salmonella. Food Control 2019, 106, 106712. [Google Scholar] [CrossRef]
  71. Sorrentino, E.; Succi, M.; Tipaldi, L.; Pannella, G.; Maiuro, L.; Sturchio, M.; Coppola, R.; Tremonte, P. Antimicrobial activity of gallic acid against food-related Pseudomonas strains and its use as biocontrol tool to improve the shelf life of fresh black truffles. Int. J. Food Microbiol. 2018, 266, 183–189. [Google Scholar] [CrossRef]
  72. Lou, Z.; Wang, H.; Zhu, S.; Ma, C.; Wang, Z. Antibacterial Activity and Mechanism of Action of Chlorogenic Acid. J. Food Sci. 2011, 76, M398–M403. [Google Scholar] [CrossRef]
  73. Nile, S.H.; Park, S.W. Edible berries: Bioactive components and their effect on human health. Nutrition 2014, 30, 134–144. [Google Scholar] [CrossRef] [PubMed]
  74. Lacombe, A.; Wu, V.C.; Tyler, S.; Edwards, K. Antimicrobial action of the American cranberry constituents; phenolics, anthocyanins, and organic acids, against Escherichia coli O157:H7. Int. J. Food Microbiol. 2010, 139, 102–107. [Google Scholar] [CrossRef] [PubMed]
  75. Guo, M.; Perez, C.; Wei, Y.; Rapoza, E.; Su, G.; Bou-Abdallah, F.; Chasteen, N. Iron-binding properties of plant phenolics and cranberry’s bio-effects. Dalton Trans. 2007, 4951–4961. [Google Scholar] [CrossRef] [PubMed]
  76. Stratford, M.; Nebe-Von-Caron, G.; Steels, H.; Novodvorska, M.; Ueckert, J.; Archer, D.B. Weak-acid preservatives: pH and proton movements in the yeast Saccharomyces cerevisiae. Int. J. Food Microbiol. 2013, 161, 164–171. [Google Scholar] [CrossRef] [PubMed]
  77. Martínez, G.; Regente, M.; Jacobi, S.; Del Rio, M.; Pinedo, M.; de la Canal, L. Chlorogenic acid is a fungicide active against phytopathogenic fungi. Pestic. Biochem. Physiol. 2017, 140, 30–35. [Google Scholar] [CrossRef] [PubMed]
Figure 1. Contour plots for the inhibition zone of extract blends against Pseudomonas viridiflava (ac), Bacillus subtilis (df), Rhodotorula diobovata (gi) and Alternaria alternata (jl) as a function of independent factors (Box–Behnken design). Foods 12 00623 i001
Foods 12 00623 g001
Figure 2. Contour plots for the inhibition zone of extract blends against Pseudomonas viridiflava ((a); Foods 12 00623 i002), Bacillus subtilis ((b); Foods 12 00623 i003), Rhodotorula diobovata ((c); Foods 12 00623 i004) and Alternaria alternata ((d); Foods 12 00623 i005) as a function of independent factors (Simplex–Lattice design).
Foods 12 00623 g002
Table 1. Details of chromatographical and mass spectrometry analysis of soluble sugars, vitamin C, organic acids, and non-anthocyanin phenolics.
AnalysisAnalytical InstrumentElectrospray IonizationMultiple Reaction Monitoring (MRM) Transition *Stationary PhaseMobile PhaseGradient ProgramReference
SugarsShimadzu Nexara X2 UHPLC, (Kyoto, Japan) equipped with a triple quadrupole mass spectrometer (MS-8045, Shimadzu).
Data collection and processing were performed by Lab Solutions Insight LC-MC software (v.3.2, Shimadzu).
Negative mode.
Nebulizer gas flow 3 L.min−1, drying gas flow of 10 L.min−1, desolvation line temperature of 250 °C, heat block temperature of 400 °C.
Fructose (179.2 → 113.1/89.0),
Glucose (179.2 → 113.1/89.0),
Sucrose (341.2 → 179.2/161.2/119.1)
Acquity UPLC BEH Amide column (100 × 2.1 mm i.d.; 1.7 µm particle size; Waters, Dublin, Ireland) at 40 °C.Mobile phase A: 80% aqueous acetonitrile containing 0.1% NH4OH.
Mobile phase B: 0.1% aqueous NH4OH.
0% B, 1 min; linear increase to 40% B, 7 min; conditioning, 1 min; re-equilibration, 3 min.
Flow rate of 0.2 mL.min−1.
[13]
Vitamin CWaters UPLC-PDA system.
Detection was carried out at 245 nm.
--Waters HSS-T3 column (100 × 2.1 mm i.d.; 1.8 µm particle size) at 25 °C.Mobile phase: 0.1% aqueous formic acid.Flow rate of 0.3 mL.min−1.[14]
Organic AcidsShimadzu Nexera X2 UHPLC system, equipped with a MS-8045-TQ-mass spectrometer (0.2 µL injection).
Data collection and processing were performed using Lab Solutions Insight LC-MS software (v.3.2, Shimadzu).
Negative mode.
Nebulizer gas flow 3 L.min−1, drying gas flow of 10 L.min−1, desolvation line temperature of 250 °C, heat block temperature of 400 °C.
Succinic acid (117.00 → 73.00/99.10),
Malic acid (133.00 → 114.95/70.95),
Tartaric acid (149.00 → 87.00/72.85),
Fumaric acid (115.00 → 71.05/26.95),
Maleic acid (115.00 → 70.95/27.00),
Isocitric acid (191.00 → 110.95/173.00),
Citric acid (191.00 → 110.95/86.90),
Shikimic acid (173.15 → 92.90/111.00),
Quinic acid (191.00 → 84.95/92.90).
Waters HSS-T3 column (150 × 2.1 mm i.d.; 1.8 µm particle size) maintained at 40 °C. Mobile phase A: 0.1% aqueous formic acid.
Mobile phase B: 0.1% methanolic formic acid.
0% B, 1 min; 5% B, 7 min; 50% B, 8 min; 50% B, 9 min; 0% B, 9.10 min; 0% B, 12 min.
Flow rate of 0.2 mL.min−1.
[15]
Non-anthocyanin Phenolic CompoundsHRAM Thermo Q Exactive Orbitrap spectrometer (Thermo Fisher Scientific, Melbourne, VIC, Australia) equipped with an Ultimate Dionex 3000 RS UHPLC-UV/Vis detector (Thermo Fisher Scientific).
UHPLC-UV chromatograms were recorded at 280 and 360 nm.
Data processing was performed with Xcalibur software (v.4.1, Thermo).
Negative mode.
Collision energy of 25 V, resolving power of 70,000 FWHM, 3 × 10⁶ AGC (automatic gain control) target, injection time of 200 ms (for peak identification).
-Waters HSS-T3 column (150 × 2.1 mm i.d.; 1.8 µm) at 40 °C.Mobile phase A: 0.1% aqueous formic acid,
Mobile phase B: 0.1% formic acid in acetonitrile.
5% B, 1 min; 20% B, 5 min; 20% B, 7 min; 45% B, 12 min; 100% B, 19 min; 100% B, 22 min; 5% B, 22.1 min; 5% B, 26 min.
Flow rate of 0.3 mL.min−1.
-
UHPLC, ultra-high-performance liquid chromatography; HRAM, high-resolution accurate mass. * MRM scan mode with optimized collision energy was employed for the targeted analysis and quantification of sugars and organic acids. Two multiple reaction monitoring transitions were used to quantify each sugar/acid and to confirm their identities according to their specific mass fragmentation pattern ([M-H] → quantifier/qualifier (m/z)).
Table 2. Experimental matrix for Box–Be hnken and Simplex–Lattice mixture designs and mean values of responses (n = 3) for inhibition zone (mm) of extract blends against the studied microorganisms.
RunA/Component1
(TL, %)
B/Component2
(DB, %)
C/Component3
(SA, %)
Pseudomonas viridiflavaBacillus subtilisRhodotorula diobovataAlternaria alternata
Box–Behnken
1010519.0610.510.000.00
200513.205.630.000.00
3510014.3713.0519.292.34
41010518.4014.9622.485.96
5051020.3312.140.003.57
61051020.1316.9821.395.46
755517.7515.2519.563.52
85000.005.769.170.00
955517.2515.6919.682.78
10501018.1916.6618.023.65
11100513.2914.2424.334.73
120509.020.000.000.00
1310509.8411.4223.864.82
1455517.1615.8920.782.47
1555517.0815.0720.823.04
1655517.0814.2020.292.51
175101020.0015.9916.880.00
Simplex–Lattice Mixture
15.005.000.0010.0510.0419.053.71
20.000.0010.0019.5210.870.000.00
36.671.671.6711.1412.3722.748.29
45.005.000.009.1512.2918.425.24
51.676.671.6713.5812.555.181.76
61.671.676.6716.4812.865.051.69
70.0010.000.0014.177.580.000.00
80.005.005.0016.3610.420.000.00
93.333.333.3313.6010.9916.293.28
1010.000.000.000.009.2619.504.47
1110.000.000.000.009.8021.265.34
120.000.0010.0018.1512.000.001.76
135.000.005.0014.3914.1320.933.67
140.0010.000.0012.755.580.000.00
Positive/Negative Controls
Streptomycin (20 µg.mL−1)17.16 ± 0.0520.22 ± 0.05--
Voriconazole (200 µg.mL−1)--27.82 ± 0.3041.14 ± 0.64
Sterile water0.000.000.000.00
TL, Tasmannia lanceolata; DB, Diploglottis bracteata; SA, Syzygium aqueum.
Table 3. Soluble sugars, vitamin C, organic acids, and antioxidant capacity of aqueous extracts from Tasmannia lanceolata leaves, Diploglottis bracteata fruits, and Syzygium aqueum fruits.
T. lanceolataD. bracteataS. aqueum
Sugars (g. 100 g−1 dw)Fructose 2.08 ± 0.07 c17.15 ± 0.51 a10.52 ± 0.44 b
Glucose 1.79 ± 0.06 c15.12 ± 0.64 a6.33 ± 0.25 b
Sucrose 5.69 ± 0.08 a1.41 ± 0.07 b0.02 ± 0.00 c
Vitamin C (mg. 100 g−1 dw)L-AA 0.62 ± 0.01 b1.75 ± 0.02 a0.59 ± 0.01 b
Total AA 0.89 ± 0.02 c2.43 ± 0.03 a1.20 ± 0.10 b
Organic acids (g. 100 g−1 dw)Citric acid 1.43 ± 0.11 b1.75 ± 0.07 b28.81 ± 0.34 a
Fumaric acid 0.00 ± 0.00 b0.01 ± 0.00 a0.01 ± 0.00 a
Isocitric acid0.36 ± 0.03 b0.37 ± 0.02 b0.49 ± 0.02 a
Malic acid 2.44 ± 0.21 c22.19 ± 0.11 a15.95 ± 0.43 b
Quinic acid 1.50 ± 0.11 b1.92 ± 0.08 b29.39 ± 0.28 a
Shikimic acid5.30 ± 0.30 a0.01 ± 0.00 b0.09 ± 0.00 b
Succinic acid 0.02 ± 0.00 c0.10 ± 0.00 a0.06 ± 0.00 b
TPC (mg GAE.g−1 dw) 123.47 ± 1.29 a6.07 ± 0.77 b6.45 ± 0.19 b
DPPH IC50 (μg.mL−1) 36.59 ± 0.41 c353.60 ± 9.23 a299.89 ± 3.11 b
Data are mean ± standard deviation (n = 3); data with different letters in the same row are significantly different (p < 0.05). GAE, gallic acid equivalents; dw, dry weight.
Table 4. Non-anthocyanin phenolic compounds (tentatively) identified in the aqueous extracts from Tasmannia lanceolata leaves.
Compound No.RT (min)[M-H] (m/z)Molecular FormulaΔM (ppm)MS2 Fragmentation (m/z)Tentative Identification
Phenolic Acids
12.75371.0984C16H20O10 0.0808371.0959; 191.0557; 135.0444; 85.0284Hydroxydihydrocaffeoylquinic acid
33.87315.0714C13H16O9 −2.3994315.0708; 108.0209; 152.0109; 207.9458Protocatechuic acid O-hexoside
45.19153.0189C7H6O4−2.8231153.0189; 109.0286; 123.0445; 91.0173Protocatechuic acid
66.40371.0979--119.0496; 163.0394; 359.1305p-coumaric acid derivative
86.64707.1789--707.1731; 191.0559; 243.0657; 173.0452; 323.0540; 463.1036; 515.1109Unknown, perhaps caffeoylquinic acid glucoside derivative
106.87447.1867--153.0916; 137.0238; 271.0969; 359.0724Unknown, perhaps hydroxybenzoic acid derivative
127.30353.0864C16H18O9−3.9820353.0857; 191.0556; 85.0284; 127.0392Chlorogenic acid (syn: 5-caffeoylquinic acid) **
137.36707.1799C32H36O18−4.2252191.0556; 85.0284; 353.0851Chlorogenic acid dimer
148.13707.1787C32H36O18−5.9220191.0556; 85.0284; 353.0832; 593.1383Chlorogenic acid dimer isomer
168.40337.0920C16H18O8 −2.6431337.0886; 93.0336; 119.0495; 173.0450; 163.0393; 87.0077; 255.10104-O-p-coumaroylquinic acid
Flavonoids and derivatives
158.27461.1658--101.0235; 113.0236; 289.0708; 153.0913; 161.0447; 329.1339Unknown, perhaps tricin derivative
2611.47417.0824--417.0818; 284.0324; 315.0487; 133.0288Unknown, luteolin derivative
2711.47547.1651--285.0395; 284.0325; 192.0422; 89.0233; 493.1665Unknown, luteolin derivative
3212.97331.1208--331.1208; 96.9592; 219.1385; 263.1286; 269.0450Unknown, perhaps apigenin derivative
3313.07505.2056--343.1535; 328.1302; 251.1653; 427.1900Unknown, perhaps luteolin-trimethyl ester-O-hexoside
3413.88301.0349C15H10O7−1.5812301.0337; 133.0290; 151.0033; 121.0290; 83.0128Quercetin **
3514.11483.2434--299.0552; 284.0319; 209.0805; 165.0910Unknown, perhaps diosmetin derivative
3614.23459.2218--96.9592; 331.1207; 299.0551; 284.0317Unknown, perhaps diosmetin derivative
3714.94269.0449C15H10O5−2.4047269.0453; 117.0339; 83.0128; 151.0030Apigenin
3816.27299.0550C16H12O6 −3.7183299.0552; 284.0321; 133.0289; 203.1437; 107.0131; 168.9887; 256.0364; 265.1436; 83.0128Diosmetin
3917.29283.0603C16H12O5 −3.1689283.0602; 117.0337; 268.0371; 237.1491; 211.0395; 107.0130; 151.0030; 239.0344; 191.1434; 83.0127Apigenin 7,4′-dimethyl ether (syn: Genkwanin, Acacetin)
Flavonoid glycosides
178.57435.2226--289.0709; 177.0189; 339.0463; 245.0815Unknown, perhaps catechin rhamnoside
219.94609.1442C27H30O16 −3.1322609.1413; 300.0275; 447.0931; 151.0030Rutin **
2210.57463.0879C21H20O12 −0.6478463.0865; 271.0243; 300.0266; 255.0293; 151.0029; 243.0294; 178.9978Quercetin-3-O-glucoside **
2311.05863.1996--431.0974; 283.0605; 311.0549; 96.9591; 151.0030; 345.0993; 131.0495Unknown, perhaps vitexin/isovitexin dimer
2411.05431.0981C21H20O10 −0.6263431.0975; 283.0606; 311.0549; 96.9591; 151.0030; 345.0996Vitexin/isovitexin
2511.25593.1490C27H30O15−3.6988593.1443; 285.0392; 255.0295; 361.1616; 165.0547; 523.2097Kaempferol glycoside (perhaps Kaempferol O-hexosyl-deoxyhexose)
2811.54563.1383C26H28O14 −4.1357563.1362; 285.0397; 192.0423; 89.0232Kaempferol glycoside (perhaps Kaempferol 3-O-rhamnoside-7-O-xyloside)
3012.33447.0929C21H20O11 −0.8611447.0861; 285.0402Luteolin glycoside (perhaps Luteolin 8-C-glucoside)
3112.43593.1477C27H30O15−5.8905269.0451; 547.1425Apigenin dihexoside
Biflavonoids & polyflavonoids
23.37865.1781--140.0110; 287.0547; 407.0700; 543.0834; 451.0955Perhaps procyanidin trimer (B-type)
96.77577.1331C30H26O12 −3.5520577.1282; 125.0237; 289.0710; 161.0239; 245.0814; 407.0778; 205.0498(epi)catechin-(epi)catechin OR procyanidin dimer (B type)
188.66739.1623C39H32O15 −6.1474739.1487; 289.0714; 177.0191; 339.0488; 245.0814; 459.0654; 587.1086; 117.0551Procyanidin dimer monoglycoside
198.75577.1325C30H26O12−4.5916125.0239; 289.0712; 245.0814; 491.01842; 203.0705Procyanidin dimer (B type)
208.99739.1622C39H32O15−6.2827739.1502; 289.0712; 177.0190; 339.0489; 245.0813; 459.0662; 137.0239; 569.0995Procyanidin dimer monoglycoside
Other polyphenols
56.27356.0976--121.0289; 237.403; 149.0603; 219.0293; 293.0631Unknown, perhaps hydroxybenzaldehyde derivative
76.56371.1336--243.0657; 323.0540; 289.0556; 173.0454Unknown, perhaps piceatannol derivative
117.05401.1434--401.1385; 96.9592; 361.0948; 134.0367; 239.0919; 271.0964Unknown, perhaps pelargonidin-3-pentoside derivative
2911.67451.1031C24H20O9 −0.7891451.1018; 189.0189; 217.0136; 341.0650; 177.0188; 109.0287; 123.0444; 151.0395; 255.0294; 402.1244; 447.0855Cinochonain l
RT, retention time. ** Commercial standard was used for identification.
Table 5. Non-anthocyanin phenolic compounds (tentatively) identified in the aqueous extracts from Diploglottis bracteata fruits.
Compound No.RT (min)[M-H] (m/z)Molecular FormulaΔM (ppm)MS2 Fragmentation (m/z)Tentative Identification
Organic acids
11.39133.0136C4H6O5 −4.8641133.0136; 115.0029; 89.0230; 111.0195; 124.0143Malic acid
21.96117.0185--117.0185; 100.0394Unknown, perhaps succinic acid
Phenolic acids
149.96319.0790--119.0496Unknown, perhaps coumaric acid derivative
1611.14355.1027--147.0445; 168.9885; 216.9797; 273.9771; 114.9481Unknown, perhaps cinnamic acid derivative
1711.80415.1964--341.0607; 161.0609Unknown, perhaps caffeoyl glucose derivative
2012.51631.2519--245.1545; 201.1647; 523.1197Unknown, perhaps heptyl cinnamate derivative
2214.62509.2578--101.0235; 85.0284; 113.0239; 231.0989Unknown, perhaps tetrahydrofurfuryl cinnamate derivative
Flavonoids and derivatives
87.38289.0713C15H14O6−1.5982289.0710; 109.0287; 123.0444; 191.0556; 97.0286Catechin **
118.15417.1319--125.0239; 177.0190; 151.0396; 287.0552; 243.0294Unknown, perhaps eriodictyol derivative
128.27289.0707C15H14O6−3.6738289.0710; 109.0286; 123.0444; 245.0814; 83.0127Epicatechin **
1510.91495.1125--151.0034; 285.0397; 125.0236; 107.0130; 178.9980; 83.0128; 340.9699; 303.0478; 449.1015Unknown, perhaps luteolin derivative
2112.67445.2071--445.1998; 165.1280; 209.1180; 283.1545; 337.0700; 87.0441Unknown, perhaps wogonin derivative
Flavonoid glycosides
97.82447.1497--125.0236; 289.0712; 161.0238; 407.0796Unknown, perhaps catechin glycoside
1811.90477.0980--477.0980; 299.0194; 119.0496; 314.0470Perhaps isorhamnetin-3-O-hexoside
Biflavonoids and polyflavonoids
56.30593.1262C30H26O13−6.5145177.0191; 339.0832; 273.0395Prodelphinidin A-type
66.77577.1323C30H26O12−4.9381577.1257; 125.0238; 289.0714; 161.0240; 245.0814; 407.0787Procyanidin dimer B-type
77.15577.1317C30H26O12−5.9778161.0241; 289.0709; 407.0772; 339.0813Procyanidin dimer B-type
107.82577.1317C30H26O12−5.9778577.1245; 125.0236; 289.0712; 407.0786; 161.0238; 245.0813; 137.0237; 339.0815; 425.0938Procyanidin dimer B-type
138.43865.1772--165.0916; 287.0553; 543.0829; 577.1254Perhaps procyanidin trimer/epicatechin-epicatechin-epicatechin
Other polyphenols
33.16344.1282--147.0441; 164.0703Unknown, perhaps coumarin derivative
43.89154.0505--82.0288; 108.0213Unknown, perhaps hypogallic acid
1912.43489.2277--269.0455; 167.0343; 331.1887Unknown, perhaps carnosic acid derivative
RT, retention time. ** Commercial standard was used for identification.
Table 6. Non-anthocyanin phenolic compounds (tentatively) identified in the aqueous extracts from Syzygium aqueum fruits.
Compound No.RT (min)[M-H] (m/z)Molecular FormulaΔM (ppm)MS2 Fragmentation (m/z)Tentative Identification
Organic acid
11.46133.0135C4H6O5−5.6159133.0130; 111.0078; 115.0028; 96.9590; 107.2179Malic acid
21.61191.0189C6H8O7 −4.3241111.0078; 87.0076; 155.9504; 170.0026Citric acid
Phenolic acids
32.52169.0132C7H6O5 −6.1947125.0236Gallic acid **
56.87327.0709C14H16O9 −3.8401312.045; 206.0210; 207.0290; 193.0130; 205.0137; 234.0162; 327.0663; 192.0060; 164.0109; 136.0159Bergenin
87.53759.1153C37H28O18 −6.5707759.1153; 175.0032; 289.0333; 301.0338; 423.0757; 345.0189; 481.0681; 468.0614Theacitrin A
Flavonoids and derivatives
77.30511.1069--447.0876; 284.0318; 166.0265; 109.0288; 329.0816Unknown, perhaps kaempferol derivative
118.12305.0691--96.9592; 125.0238; 169.0137; 177.0188; 243.0294; 305.0660Unknown, perhaps gallocatechin gallate
2612.39317.0290C15H10O8 −4.0721301.0347; 151.0031; 109.0287; 137.0238; 178.9981; 227.343 Myricetin **
2713.88301.0342C15H10O7 −3.9065151.0031; 107.0130; 121.0288; 93.0036; 83.0128Quercetin **
Flavonoid glycosides
67.30447.0927C21H20O11 −1.3084447.0082; 285.0385; 241.0499; 147.0081; 199.0394; 329.0816Luteolin-3-glucoside
149.00479.0811C21H20O13 −4.2038479.0776; 316.0215; 271.0242; 287.0191; 372.9598; 214.0260Myricetin-3-O-β-D-galactopyranoside isomer
159.11479.0807C21H20O13−5.0387479.0750; 316.0220; 271.0250; 287.0190; 109.0290Myricetin-3-O-β-D-galactopyranoside
1710.03449.0719--449.0633; 316.0214; 271.0246; 287.0185; 283.0604; 242.0224; 405.9114; 214.0263Kamepferol derivative; perhaps dihydrokaempferol-hexoside
1810.20431.0970C21H20O10 −3.1779283.0605; 311.0553; 341.0697; 323.0517; 239.0716; 211.0756Vitexin or isovitexin
2010.41597.1743- -597.1736; 357.0947; 387.1089; 209.0447; 239.0576; 417.1104Perhaps phloretin-di-glucoside
2110.55463.0862C21H20O12 −4.3188463.0862; 300.0268; 271.0245; 255.0295; 151.0031; 356.9632; 390.9250Quercetin-3-O-glucoside **
2210.83479.0798C21H20O13 −6.9173479.0728; 178.9982; 317.0288; 406.9325Myricetin-glycoside
2311.10433.0806C20H18O11 6.8463433.0674; 300.0269; 301.0339; 271.0248; 255.0287; 243.0299; 390.9264; 356.9643Quercetin-glycoside
2411.33435.1340C21H24O10 9.9487125.0240; 167.0340; 273.0750; 315.0840; 369.0010Phloridzin
2511.53433.0766C20H18O11−2.3898433.0691; 271.0246; 300.0246; 315.0123; 163.0029; 299.9917Quercetin-glycoside
Tannins
43.67933.0374- -933.0371; 300.9981; 275.0193; 125.0238; 229.0140; 314.0032; 421.0121; 467.0170; 492.9950; 569.0468; 613.0347; 871.0412Perhaps castalagin
97.611139.3467--177.0189; 125.0237; 169.0139; 243.0297; 759.1021; 633.0806Unknown, perhaps galloylated tannin
107.68953.0593- -953.0590; 125.0240; 177.0190; 169.0140; 165.0190; 137.0240; 151.0400; 243.0300; 275.0180; 301.0320; 299.0160; 423.0650; 759.1010; 935.0510; 633.0800Perhaps chebulagic acid
128.52911.1115--911.1061; 125.0239; 169.0137; 96.9592; 177.0188; 137.0238; 285.0399; 571.0787; 741.0919; 423.0636; 615.0666; 305.0635Perhaps theasinesin A
138.66935.0502- -935.0495; 300.9984; 125.0238; 169.0138; 275.0186; 633.0611Perhaps casuarinin
169.43895.1121--895.1100; 299.9907; 447.0488; 361.1577; 300.9964; 555.0822Unknown, ellagic acid derivative
1910.33300.9978C14H6O8 −3.9568300.9978; 145.0287; 169.0133; 117.0338; 245.0082; 283.9944; 228.0052; 200.0106Ellagic acid **
RT, retention time. ** Commercial standard was used for identification.
Table 7. ANOVA for the determination of model fitting (inhibition zone of extract blends).
ParametersBox–Behnken DesignSimplex–Lattice Design
PVBSRDAAPVBSRDAA
Modeldf69765444
F-value428.3353.7459.8813.0685.697.43431.8319.38
p-value<0.0001<0.0001<0.0001<0.0003<0.0001<0.0063<0.0001<0.0002
Residualdf1079108999
msq1.550.71693.190.74551.031.710.02460.0836
ssq15.545.0228.707.458.2515.390.22120.7527
Lack of fitdf63564555
F-value1.812.5115.495.952.511.517.630.7315
p-value0.29370.19800.01000.05310.19710.35580.03570.6365
Pure errordf44444444
msq1.040.43570.35240.18790.58721.330.00520.0983
ssq4.181.741.410.75162.355.340.02100.3932
R2 0.99610.98570.97900.88690.98170.76750.99480.8960
Ra2 0.99380.96740.96260.81900.97020.66410.99250.8497
PV, Pseudomonas viridiflava; BS, Bacillus subtilis; RD, Rhodotorula diobovata; AA, Alternaria alternate; df, degrees of freedom; p-values < 0.05 were significant; msq, mean square; ssq, sum of squares; R2, coefficient of determination; Ra2, adjusted coefficient of determination.
Table 8. Validation of predicted and experimental values for the inhibitory activity (mm) of the two optimised extract blends (n = 5).
ResponsePredicted Mean ValueExperimental Value−95% Prediction+95% Prediction
Box–Behnken
Pseudomonas viridiflava17.2116.7816.7817.64
Bacillus subtilis15.9014.5414.5217.29
Rhodotorula diobovata25.2926.3422.4928.09
Alternaria alternata5.296.314.036.55
Simplex–Lattice
Pseudomonas viridiflava15.1214.5312.9317.32
Bacillus subtilis14.0312.9511.3316.72
Rhodotorula diobovata20.4122.8417.5323.44
Alternaria alternata4.426.962.077.31
Disclaimer/Publisher’s Note: The statements, opinions and data contained in all publications are solely those of the individual author(s) and contributor(s) and not of MDPI and/or the editor(s). MDPI and/or the editor(s) disclaim responsibility for any injury to people or property resulting from any ideas, methods, instructions or products referred to in the content.

