
‘Nutritional Footprint’ in the Food, Meals and HoReCa Sectors: A Review
 , , ,
, , , 
Abstract
:
1. Introduction
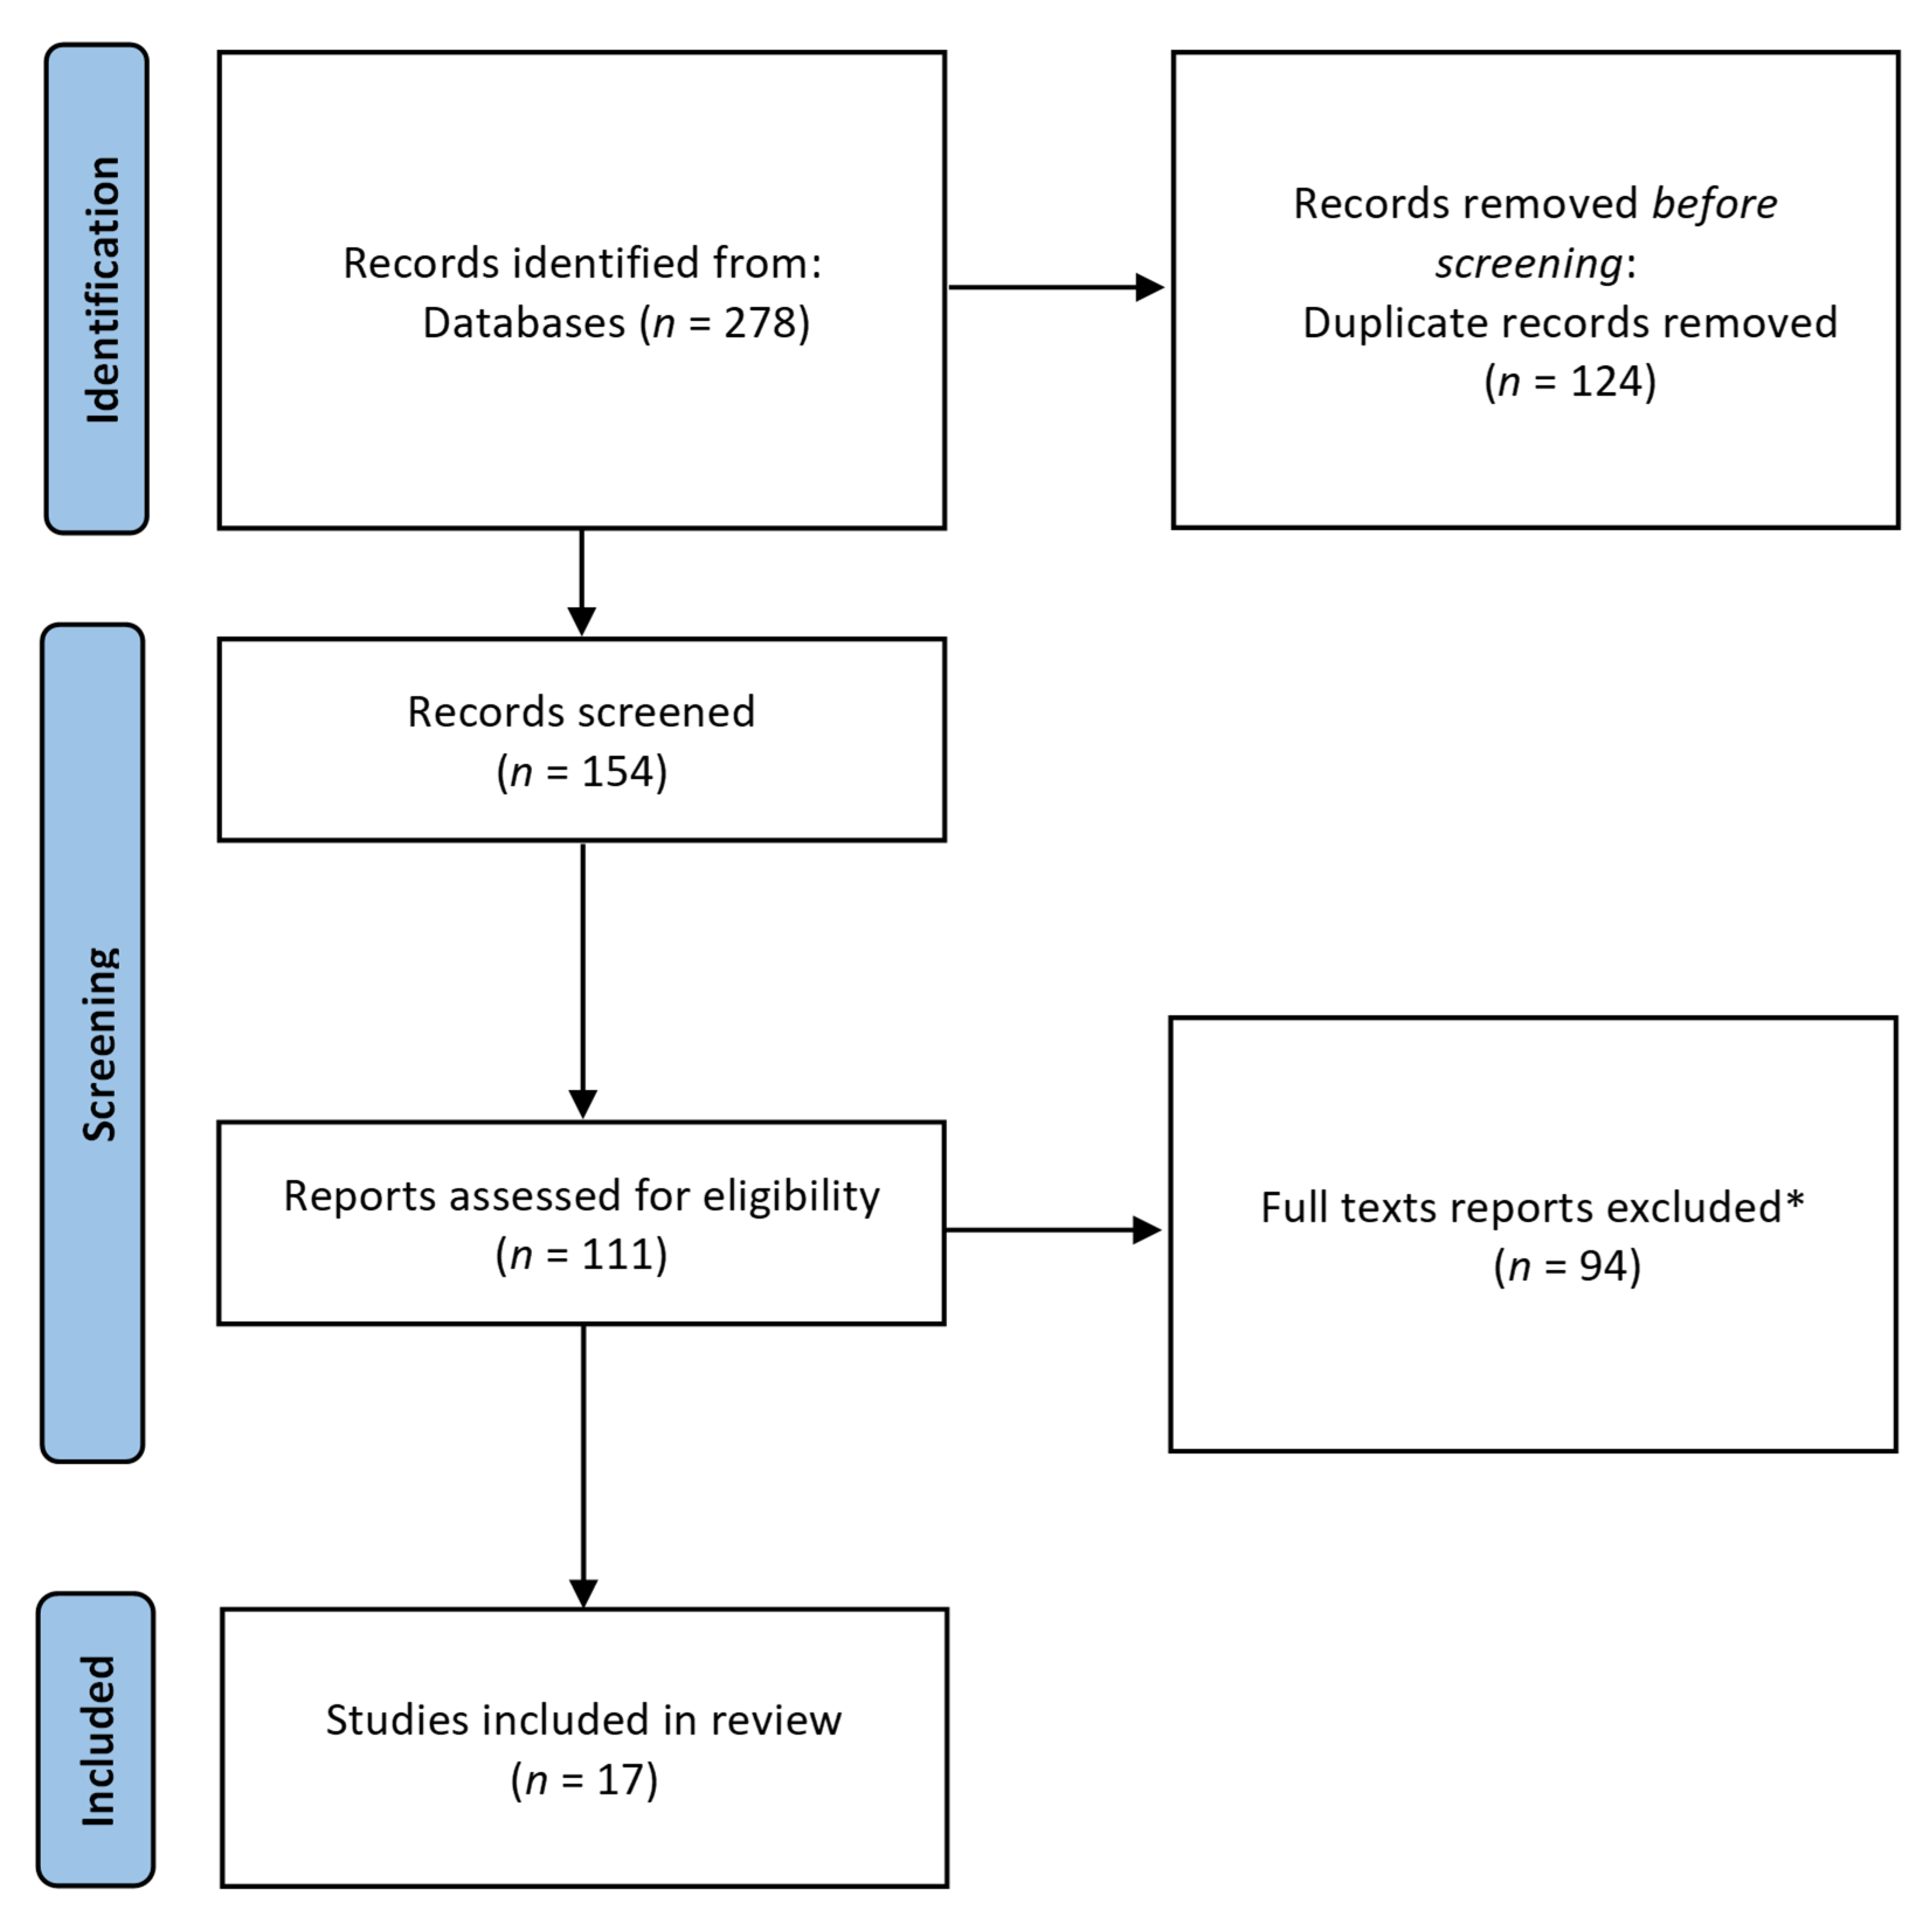
2. Review Method
3. ‘Nutritional Footprint’
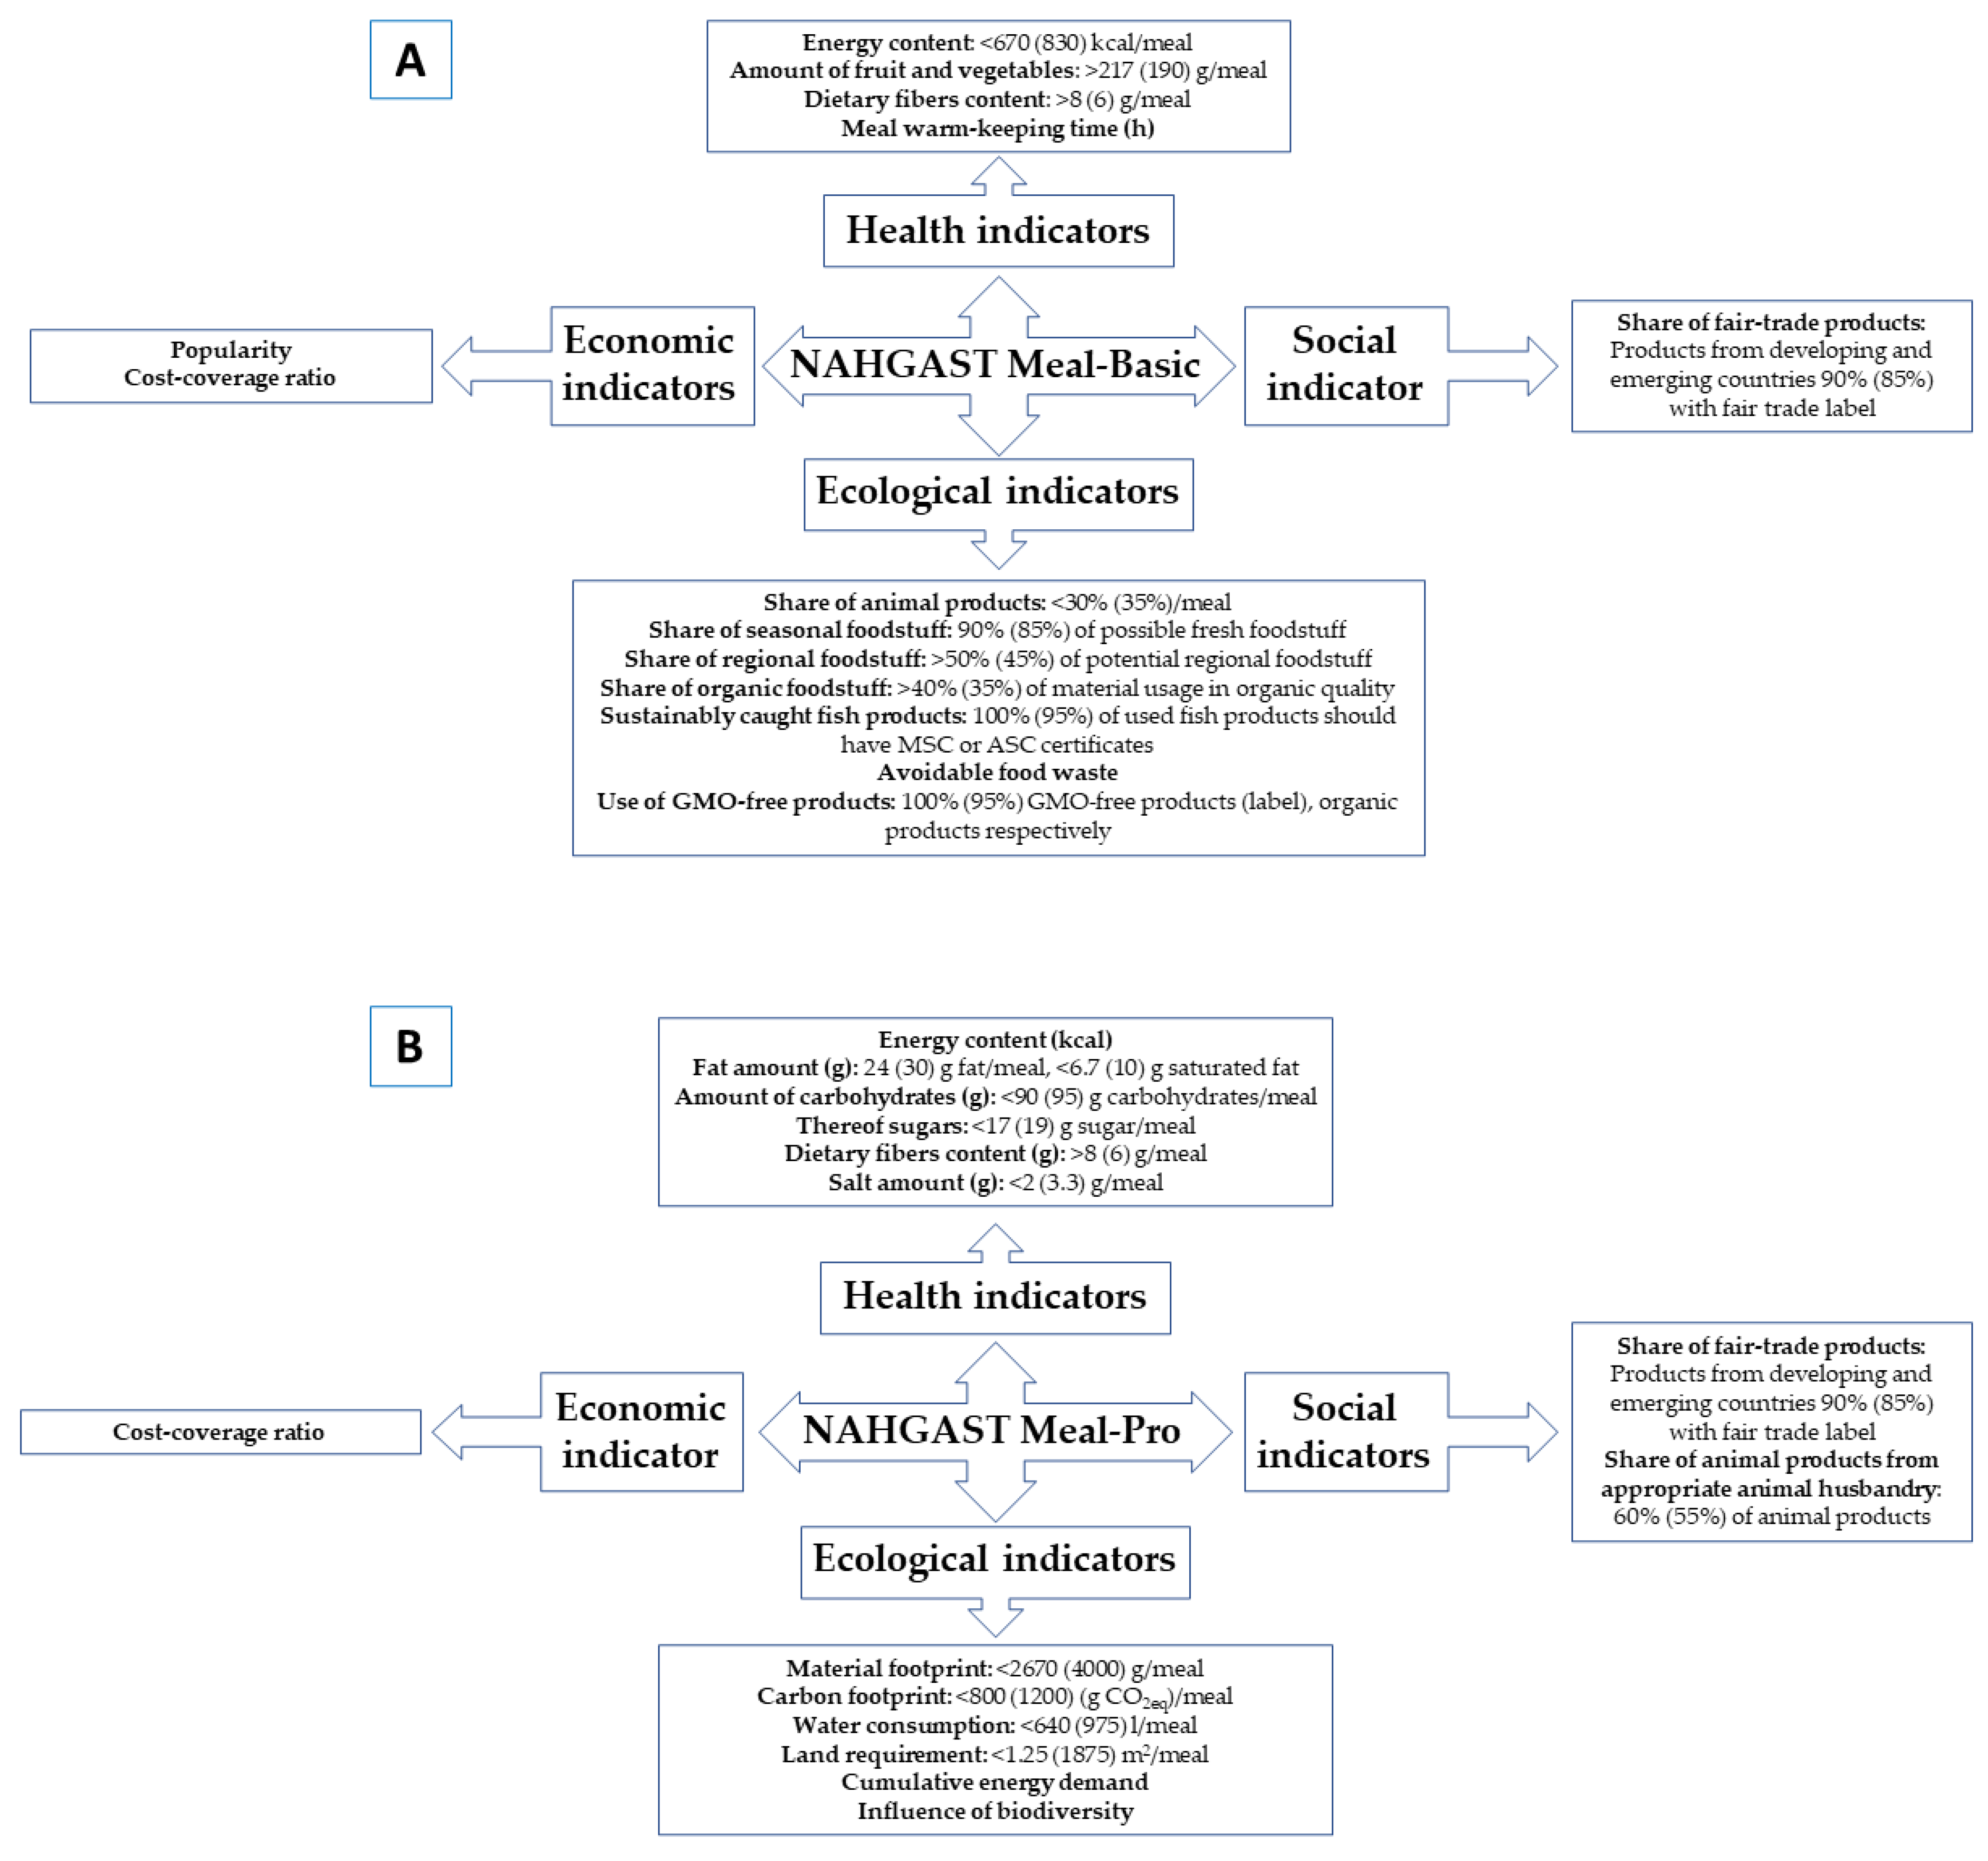
4. ‘Development, Testing and the Distribution of Concepts for Sustainable Production and Consumption in the Field of Out-of-Home Catering (NAHGAST)’
5. Conclusions and Future Directions
Author Contributions
Funding
Data Availability Statement
Acknowledgments
Conflicts of Interest
References
- Esposito, B.; Sessa, M.R.; Sica, D.; Malandrino, O. Towards circular economy in the agri-food sector. A systematic literature review. Sustainability 2020, 12, 7401. [Google Scholar] [CrossRef]
- Buczacki, A.; Gładysz, B.; Palmer, E. HoReCa food waste and sustainable development goals—A systemic view. Sustainability 2021, 13, 5510. [Google Scholar] [CrossRef]
- Rosi, A.; Biasini, B.; Monica, E.; Rapetti, V.; Deon, V.; Scazzina, F. Nutritional composition and environmental impact of meals selected in workplace canteens before and after an intervention promoting the adherence to the Mediterranean diet. Nutrients 2022, 14, 4456. [Google Scholar] [CrossRef] [PubMed]
- Lăcătușu, C.M.; Grigorescu, E.D.; Floria, M.; Onofriescu, A.; Mihai, B.M. The Mediterranean diet: From an environment-driven food culture to an emerging medical prescription. Int. J. Environ. Res. Public Health 2019, 16, 942. [Google Scholar] [CrossRef] [PubMed] [Green Version]
- Maynard, D.D.C.; Vidigal, M.D.; Farage, P.; Zandonadi, R.P.; Nakano, E.Y.; Botelho, R.B.A. Environmental, social and economic sustainability indicators applied to food services: A systematic review. Sustainability 2020, 12, 1804. [Google Scholar] [CrossRef] [Green Version]
- Henchion, M.; Hayes, M.; Mullen, A.M.; Fenelon, M.; Tiwari, B. Future protein supply and demand: Strategies and factors influencing a sustainable equilibrium. Foods 2017, 6, 53. [Google Scholar] [CrossRef] [Green Version]
- Dudziak, A.; Stoma, M.; Derkacz, A.J. Circular economy in the context of food losses and waste. Sustainability 2022, 14, 10116. [Google Scholar] [CrossRef]
- FAO. Dietary Guidelines and Sustainability. Available online: http://www.fao.org/nutrition/education/food-dietary-guidelines/background/sustainable-dietary-guidelines/en/ (accessed on 28 December 2022).
- Grigoriadis, V.; Nugent, A.; Brereton, P. Working towards a combined measure for describing environmental impact and nutritive value of foods: A review. Trends Food Sci. Technol. 2021, 112, 298–311. [Google Scholar] [CrossRef]
- Müller, C.; Stucki, M.; Zehnder, P.; Ebker, J.; Wohlleben, M.; Baumer, B. The “Menu Sustainability Index”. Assessment of the environmental and health impact of foods offered in commercial catering. Ernahr. Umsch. 2016, 63, 198–205. [Google Scholar]
- ZFV. Bewusst Geniessen! Available online: https://zfv.ch/documents/download/4133/zfv_bewusst-geniessen_080519.pdf (accessed on 28 December 2022).
- Lassen, A.D.; Biltoft-Jensen, A.; Hansen, G.L.; Hels, O.; Tetens, I. Development and validation of a new simple Healthy Meal Index for canteen meals. Public Health Nutr. 2009, 13, 1559–1565. [Google Scholar] [CrossRef] [Green Version]
- WHO Europa. WHO Regional Office for Europe Nutrient Profile Model. Available online: https://www.euro.who.int/__data/assets/pdf_file/0005/270716/Nutrient-children_web-new.pdf (accessed on 28 December 2022).
- Eaternity. Available online: www.eaternity.org/appetite-for-change (accessed on 28 December 2022).
- Ecole Hôtelière de Lausanne. Beelong, the Eco-Score for All Your Food Products. Available online: https://beelong.ch/en/ (accessed on 28 December 2022).
- Zürcher Hochschule für Angewandte Wissenschaften (ZHAW). Menu Sustainability Index (MSI). Available online: https://zfv.ch/en/group/sustainability/mni (accessed on 28 December 2022).
- Meier, T.; Gärtner, C.; Christen, O. Bilanzierungsmethode susDISH: Nachhaltigkeit in der Gastronomie-Gesundheits-und Umweltaspekte in der Rezepturplanung gleichermaßen berücksichtigen; DLG-Lebensmittel: Halle-Wittenberg, Germany, 2015. [Google Scholar]
- Lukas, M.; Rohn, H.; Lettenmeier, M.; Liedtke, C.; Wirges, M.; Wiesen, K.; Wiesen, K.; SchweiBinger, J.; von Lenthe, C. Assessing indicators and limits for a sustainable everyday nutrition. Proceedings in food system dynamics. Int. J. Food Syst. Dyn. 2016, 299–313. [Google Scholar] [CrossRef]
- Engelmann, T.; Speck, M.; Rohn, H.; Bienge, K.; Langen, N.; Howell, E.; Göbel, C.; Friedrich, S.; Teitscheid, P.; Bowry, J.; et al. Sustainability assessment of out-of-home meals: Potentials and challenges of applying the indicator sets NAHGAST meal-basic and NAHGAST meal-pro. Sustainability 2018, 10, 562. [Google Scholar] [CrossRef] [Green Version]
- Abbade, E.B. Estimating the nutritional loss and the feeding potential derived from food losses worldwide. World Dev. 2020, 134, 105038. [Google Scholar] [CrossRef]
- Wuppertal Institut. Mahlzeiten mit Fußabdruck. Available online: https://wupperinst.org/a/wi/a/s/ad/2938 (accessed on 28 December 2022).
- Joensuu, K.; Pulkkinen, H.; Kurppa, S.; Ypyä, J.; Virtanen, Y. Applying the nutrient footprint method to the beef production and consumption chain. Int. J. Life Cycle Assess. 2019, 24, 26–36. [Google Scholar] [CrossRef] [Green Version]
- Moher, D.; Liberati, A.; Tetzlaff, J.; Altman, D.G.; PRISMA Group. Preferred reporting items for systematic reviews and meta-analyses: The PRISMA statement. Ann. Intern. Med. 2009, 151, 264–269. [Google Scholar] [CrossRef] [Green Version]
- Makower, J. Timberland Reveals Its ‘Nutritional’ Footprint. 2006. Available online: https://www.futurelab.net/blog/2006/01/timberland-reveals-its-nutritional-footprint (accessed on 28 December 2022).
- Sanhueza, J.; Valenzuela, A. Nutrigenomics: Revealing molecular aspects of a personalized nutrition. Rev. Chil. Nutr. 2012, 39, 71–85. [Google Scholar] [CrossRef] [Green Version]
- Gluckman, P.D.; Hanson, M.A. Living with the past: Evolution, development, and patterns of disease. Science 2004, 305, 1733–1736. [Google Scholar] [CrossRef] [PubMed] [Green Version]
- Lukas, M.; Palzkill, A.; Rohn, H.; Liedtke, C. The nutritional footprint: An innovative management approach for the food sector. WIT Trans. Ecol. Environ. 2013, 170, 3–13. [Google Scholar]
- Liedtke, C.; Baedeker, C.; Kolberg, S.; Lettenmeier, M. Resource intensity in global food chains: The Hot Spot Analysis. Br. Food J. 2010, 112, 1138–1159. [Google Scholar] [CrossRef] [Green Version]
- Lukas, M.; Liedtke, C.; Rohn, H. The Nutritional Footprint—Assessing environmental and health impacts of foodstuffs. In World Resources Forum; World Resources Forum: Davos, Switzerland, 2013; pp. 6–9. [Google Scholar]
- Deutsche Gesellschaft für Ernährung e. V. (DGE). DGE-Qualitätsstandards—Kriterien für eine Gesundheitsfördernde und Nachhaltige Verpflegung in Gemeinschaftseinrichtungen. Deutsche Gesellschaft für Ernährung. Available online: https://www.dge.de/gv/dge-qualitaetsstandards/?L=0 (accessed on 28 December 2022).
- WHO. Sodium Intake for Adults and Children. Available online: http://apps.who.int/iris/bitstream/10665/77985/1/9789241504836_eng.pdf (accessed on 28 December 2022).
- Bringezu, S.; Schütz, H.; Arnolda, K.; Merten, F.; Kabasci, S.; Borelbach, P.; Michels, C.; Reinhardt, G.A.; Rettenmaier, N. Global implications of biomass and biofuel use in Germany—Recent trends and future scenarios for domestic and foreign agricultural land use and resulting GHG emissions. J. Clean. Prod. 2009, 17, S57–S68. [Google Scholar] [CrossRef]
- Giljum, S.; Burger, E.; Hinterberger, F.; Lutter, S.; Bruckner, M. A comprehensive set of resource use indicators from the micro to the macro level. Resour. Conserv. Recycl. 2011, 55, 300–308. [Google Scholar] [CrossRef]
- Mekonnen, M.M.; Hoekstra, A.Y. The Green, Blue and Grey Water Footprint of Farm Animals and Animal Products. Volume 1: Main Report. Available online: http://www.waterfootprint.org/Reports/Report-48-WaterFootprint-AnimalProducts-Vol1.pdf (accessed on 28 December 2022).
- Lukas, M.; Scheiper, M.L.; Ansorge, J.; Rohn, H.; Liedtke, C.; Teitscheid, P. The nutritional footprint—An assessment tool for health and environmental effects of nutrition. Ernahr. Umsch. 2014, 61, 164–170. [Google Scholar]
- Lukas, M.; Scheiper, M.L.; Ansorge, J.; Rohn, H.; Liedtke, C.; Teitscheid, P. Der Nutritional Footprint: Ein Instrument zur Bewertung von Gesundheits-und Umweltwirkungen der Ernährung. Available online: https://epub.wupperinst.org/frontdoor/deliver/index/docId/5680/file/5680_Lukas.pdf (accessed on 28 December 2022).
- Lukas, M.; Rohn, H.; Teitscheid, P.; Langen, N. Assessing Sustainable Limits for Meals–First Results from the Project NAH_Gast: Developing, Testing and Dissemination of Concepts for Sustainable Production and Consumption in the Food Service Sector. Available online: https://www.hb.fh-muenster.de/opus4/frontdoor/index/index/docId/8285 (accessed on 28 December 2022).
- Lukas, M.; Rohn, H.; Lettenmeier, M.; Liedtke, C.; Wiesen, K. The nutritional footprint—Integrated methodology using environmental and health indicators to indicate potential for absolute reduction of natural resource use in the field of food and nutrition. J. Clean. Prod. 2016, 132, 161–170. [Google Scholar] [CrossRef]
- Speck, M.; Bienge, K.; Wagner, L.; Engelmann, T.; Schuster, S.; Teitscheid, P.; Langen, N. Creating sustainable meals supported by the NAHGAST online tool—Approach and effects on GHG emissions and use of natural resources. Sustainability 2020, 12, 1136. [Google Scholar] [CrossRef] [Green Version]
- Lettenmeier, M.; Liedtke, C.; Rohn, H. Eight tons of material footprint—Suggestion for a resource cap for household consumption in Finland. Resources 2014, 3, 488–515. [Google Scholar] [CrossRef] [Green Version]
- Grönman, K.; Ypyä, J.; Virtanen, Y.; Kurppa, S.; Soukka, R.; Seuri, P.; Finér, A.; Linnanen, L. Nutrient footprint as a tool to evaluate the nutrient balance of a food chain. J. Clean. Prod. 2016, 112, 2429–2440. [Google Scholar] [CrossRef]
- Speck, M.; Rohn, H.; Engelmann, T.; Schweißinger, J.; Neundorf, D.; Teitscheid, P.; Langen, N.; Bienge, K. Entwicklung von integrierten Methoden zur Messung und Bewertung von Speisenangeboten in den Dimensionen Ökologie, Soziales, Ökonomie und Gesundheit—Working Paper 2; NAHGAST Project: Wuppertal, Germany, 2017. [Google Scholar]
- Bienge, K.; Engelmann, T.; Speck, M.; Monetti, S.; Langen, N.; Göbel, C.; Friedrich, S.; Holger, R.; Teitscheid, P. Sustainability assessment of meals in the out-of-home catering sector: Links between the NAHGAST indicator sets and the SDGs. In Proceedings of the SustEcon Conference—The Contribution of a Sustainable Economy to Achieving the Sustainable Development Goals, Freie Universität, Berlin, Germany, 25–26 September 2017. [Google Scholar]
- Ohlhausen, P.; Langen, N.; Friedrich, S.; Speck, M.; Bienge, K.; Engelmann, T.; Rohn, H.; Teitscheid, P. Auf der Suche nach dem wirksamsten Nudge zur Absatzsteigerung nachhaltiger Speisen in der Außer-HausGastronomie. Vierteljahrsh. Zur Wirtsch. 2018, 87, 95–108. [Google Scholar] [CrossRef] [Green Version]
- Ohlhausen, P.; Langen, N. When a combination of nudges decreases sustainable food choices out-of-home—The example of food decoys and descriptive name labels. Foods 2020, 9, 557. [Google Scholar] [CrossRef]
- Langen, N.; Ohlhausen, P.; Steinmeier, F.; Friedrich, S.; Engelmann, T.; Speck, M.; Damerau, K.; Bienge, K.; Rohn, H.; Teitscheid, P. Nudges for more sustainable food choices in the out-of-home catering sector applied in real-world labs. Resour. Conserv. Recycl. 2022, 180, 106167. [Google Scholar] [CrossRef]
- Lorenz, B.A.; Langen, N.; Göbel, C.; Engelmann, T.; Bienge, K.; Bacon, M.; Teitscheid, P. What makes people leave LESS food? Testing effects of smaller portions and information in a behavioral model. Appetite 2019, 139, 127–144. [Google Scholar] [CrossRef]
- Engelmann, T.; Speck, M.; Rohn, H.; Bienge, K.; Langen, N.; Howell, E.; Göbel, C.; Friedrich, S.; Teitscheid, P.; Liedtke, C. Sustainability assessment of out of-of-home meals: Potentials and obstacles applying indicator sets NAHGAST Meal-Basis and NAHGAST Meal-Pro. Proceedings in System Dynamics and Innovation in Food Networks 2017. Int. J. Food Syst. Dyn. 2017, 329–338. [Google Scholar] [CrossRef]
- Engelmann, T.; Rohn, H. Bewertung von Ausgewählten Verpflegungsangeboten—Working Paper 4; NAHGAST Project: Friedberg, Germany, 2017. [Google Scholar]
- Speck, M.; Wagner, L.; Buchborn, F.; Steinmeier, F.; Friedrich, S.; Langen, N. How public catering accelerates sustainability: A German case study. Sustain. Sci. 2022, 17, 2287–2299. [Google Scholar] [CrossRef] [PubMed]
- Speck, M.; Bienge, K.; El Mourabit, X.; Schuster, S.; Engelmann, T.; Langen, N.; Teitscheid, P. Healthy, environmentally friendly and socially responsible: How an online tool helps to cook more sustainably. Ernahr. Umsch. 2020, 67, 125–131. [Google Scholar]
- Deutsche Gesellschaft für Ernährung. Vollwertige Ernährung nach den Empfehlungen der DGE ist auch Ökologisch Nachhaltig. Available online: https://www.dge.de/fileadmin/public/doc/fm/dgeinfo/DGEinfo-06-2019-Vollwertige-Ernaehrung.pdf (accessed on 28 December 2022).
- Willett, W.; Rockström, J.; Loken, B.; Springmann, M.; Lang, T.; Vermeulen, S.; Garnett, T.; Tilman, D.; DeClerck, F.; Wood, A.; et al. Food in the Anthropocene: The EAT–Lancet Commission on healthy diets from sustainable food systems. Lancet 2019, 393, 447–492. [Google Scholar] [CrossRef] [PubMed]
- Wuppetal Institute. BiTe. Biodiversität über den Tellerrand: Vorhaben zur Steigerung der Biodiversität in Angebot und Nachfrage der Außer-Haus-Gastronomie. Available online: https://wupperinst.org/p/wi/p/s/pd/923 (accessed on 28 December 2022).
- King, T.; Cole, M.; Farber, J.M.; Eisenbrand, G.; Zabaras, D.; Fox, E.M.; Hill, J.P. Food safety for food security: Relationship between global megatrends and developments in food safety. Trends Food Sci. Technol. 2017, 68, 160–175. [Google Scholar] [CrossRef]
- San Onofre, N.; Soler, C.; Merino-Torres, J.F.; Soriano, J.M. “Five Keys to Safer Food” and COVID-19. Nutrients 2021, 13, 4491. [Google Scholar] [CrossRef]
- Madanaguli, A.; Dhir, A.; Kaur, P.; Srivastava, S.; Singh, G. Environmental sustainability in restaurants. A systematic review and future research agenda on restaurant adoption of green practices. Scand. J. Hosp. Tour. 2022, 22, 303–330. [Google Scholar] [CrossRef]
- Nomura, S.; Miyata, H. Digitization of the approach to food and nutrition respecting individual health values. Nutr. Rev. 2020, 78 (Suppl. S3), 46–48. [Google Scholar] [CrossRef]
- Gupta, A.; Alston, L.; Needham, C.; Robinson, E.; Marshall, J.; Boelsen-Robinson, T.; Blake, M.R.; Huggins, C.E.; Peeters, A. Factors influencing implementation, sustainability and scalability of healthy food retail interventions: A systematic review of reviews. Nutrients 2022, 14, 294. [Google Scholar] [CrossRef]
- Li, F.; Zhang, K.; Yang, P.; Jiao, J.; Yin, Y.; Zhang, Y.; Yin, C. Information exposure incentivizes consumers to pay a premium for emerging pro-environmental food: Evidence from China. J. Clean. Prod. 2022, 363, 132412. [Google Scholar] [CrossRef]
- de Boer, J.; Aiking, H. Do EU consumers think about meat reduction when considering to eat a healthy, sustainable diet and to have a role in food system change? Appetite 2022, 170, 105880. [Google Scholar] [CrossRef] [PubMed]
- Barbour, L.; Bicknell, E.; Brimblecombe, J.; Carino, S.; Fairweather, M.; Lawrence, M.; Slattery, J.; Woods, J.; World, E. Dietitians Australia position statement on healthy and sustainable diets. Nutr. Diet. 2022, 79, 6–27. [Google Scholar] [CrossRef] [PubMed]
- Grummon, A.H.; Goodman, D.; Jaacks, L.M.; Taillie, L.S.; Chauvenet, C.A.; Salvia, M.G.; Rimm, E.B. Awareness of and reactions to health and environmental harms of red meat among parents in the United States. Public Health Nutr. 2022, 25, 893–903. [Google Scholar] [CrossRef] [PubMed]
- Arrieta, E.M.; González, A.D. Energy and carbon footprints of food: Investigating the effect of cooking. Sustain. Prod. Consum. 2019, 19, 44–52. [Google Scholar] [CrossRef]
- FAO. Walking the Talk: Assessing the Water-Energy-Food Nexus. Available online: https://www.fao.org/3/i3959e/i3959e.pdf (accessed on 28 December 2022).
- Laso, J.; Margallo, M.; García-Herrero, I.; Fullana, P.; Bala, A.; Gazulla, C.; Polettini, A.; Kahhat, R.; Vázquez-Rowe, I.; Irabien, A.; et al. Combined application of Life Cycle Assessment and linear programming to evaluate food waste-to-food strategies: Seeking for answers in the nexus approach. Waste Manag. 2018, 80, 186–197. [Google Scholar] [CrossRef]
- Laso, J.; Ruiz-Salmón, I.; Margallo, M.; Villanueva-Rey, P.; Poceiro, L.; Quinteiro, P.; Dias, A.C.; Almeida, C.; Marques, A.; Entrena-Barbero, E.; et al. Achieving Sustainability of the Seafood Sector in the European Atlantic Area by Addressing Eco-Social Challenges: The NEPTUNUS Project. Sustainability 2022, 14, 3054. [Google Scholar] [CrossRef]


| Sample | Health Indicators | Environmental Indicators | Year | Country | Value/range of Nutritional Footprint | Ref. |
|---|---|---|---|---|---|---|
| Lettuce and beef | Nutrient density and calorie content | Abiotic and biotic material, erosion and earth movement, water consumption, energy consumption, land use and yield, biodiversity and CO2-equivalents | 2013 | Germany | 2.3 and 4.9 | [27] |
| Two menus | Calorie intake (kcal), sodium (g), dietary fiber (g) and saturates (g) | Material a (g) and carbon (g) footprints, water use (L) and land use (m2) | 2013 | Germany | 1.58 and 2.34 | [29] |
| Five menus | Calorie intake (kcal), sodium (g), dietary fiber (g) and saturates (g) | Material a (g) and carbon (g) footprints, water use (L) and land use (m2) | 2014 | Germany | 1.125–2.625 | [35,36] |
| Beef roll menu | Calorie intake (kcal), sodium (g), dietary fiber (g) and saturates (g) | Material a (g) and carbon (g) footprints, water use (L) and land use (m2) | 2015 | Germany | 2.5 | [37] |
| Eight German lunch meals | Calorie intake (kcal), sodium (g), dietary fiber (g) and saturates (g) | Material a (g) and carbon (g) footprints, water use (L) and land use (m2) | 2016 | Germany | 1.125–2.5 | [38] |
| Beef goulash b | Energy content (kcal), amount of fruit and vegetables (g), dietary fibers content (g) and time keeping meal warm (h) | Ecological (share of animal, seasonal, regional, organic, and sustainably caught fish products, avoidable food waste and use of GMO-free products), social (share of fair-trade products), economic (popularity and cost-coverage ratio) indicators | 2018 | Germany | 1.6 | [19] |
| Beef goulash c | Energy content (kcal), fat amount (g), amount of carbohydrates (g) thereof sugars, dietary fibers content (g) and salt amount (g) | Ecological (material and carbon footprints, water consumption, land requirement, cumulative energy demand and influence of biodiversity), social (share of fair-trade products and share of animal products from appropriate animal husbandry), economic (cost-coverage ratio) indicators | 2018 | Germany | 1.8 | [19] |
| 1509 meals | Energy content (kcal), fat (g), carbohydrates (g), sugar (g) and fibers (g) | Environment (material and carbon footprints, water use and land use) and social (share of fair-trade ingredients and of animal-based food that fosters animal welfare) | 2020 | Germany | 3.86–4.71 | [39] |
Disclaimer/Publisher’s Note: The statements, opinions and data contained in all publications are solely those of the individual author(s) and contributor(s) and not of MDPI and/or the editor(s). MDPI and/or the editor(s) disclaim responsibility for any injury to people or property resulting from any ideas, methods, instructions or products referred to in the content. |
© 2023 by the authors. Licensee MDPI, Basel, Switzerland. This article is an open access article distributed under the terms and conditions of the Creative Commons Attribution (CC BY) license (https://creativecommons.org/licenses/by/4.0/).
Share and Cite
Zarzo, I.; Soler, C.; Fernandez-Zamudio, M.-A.; Pina, T.; Barco, H.; Soriano, J.M. ‘Nutritional Footprint’ in the Food, Meals and HoReCa Sectors: A Review. Foods 2023, 12, 409. https://doi.org/10.3390/foods12020409
Zarzo I, Soler C, Fernandez-Zamudio M-A, Pina T, Barco H, Soriano JM. ‘Nutritional Footprint’ in the Food, Meals and HoReCa Sectors: A Review. Foods. 2023; 12(2):409. https://doi.org/10.3390/foods12020409
Chicago/Turabian StyleZarzo, Inmaculada, Carla Soler, Maria-Angeles Fernandez-Zamudio, Tatiana Pina, Héctor Barco, and Jose M. Soriano. 2023. "‘Nutritional Footprint’ in the Food, Meals and HoReCa Sectors: A Review" Foods 12, no. 2: 409. https://doi.org/10.3390/foods12020409