


Aquaphotomics Monitoring of Lettuce Freshness during Cold Storage
 ,
,  , ,
, ,  and
and
Abstract
:
1. Introduction
2. Materials and Methods
2.1. Materials and Experimental Conditions
2.2. Methods
2.2.1. Weight Measurements
2.2.2. Water Activity Measurements
2.2.3. Evaluation of Color Changes
2.2.4. NIR Spectral Acquisition
2.3. Data Analysis
2.3.1. Statistical Analysis of Weight, Water Activity and Pigment Changes
2.3.2. Aquaphotomics Multivariate Data Analysis
3. Results and Discussion
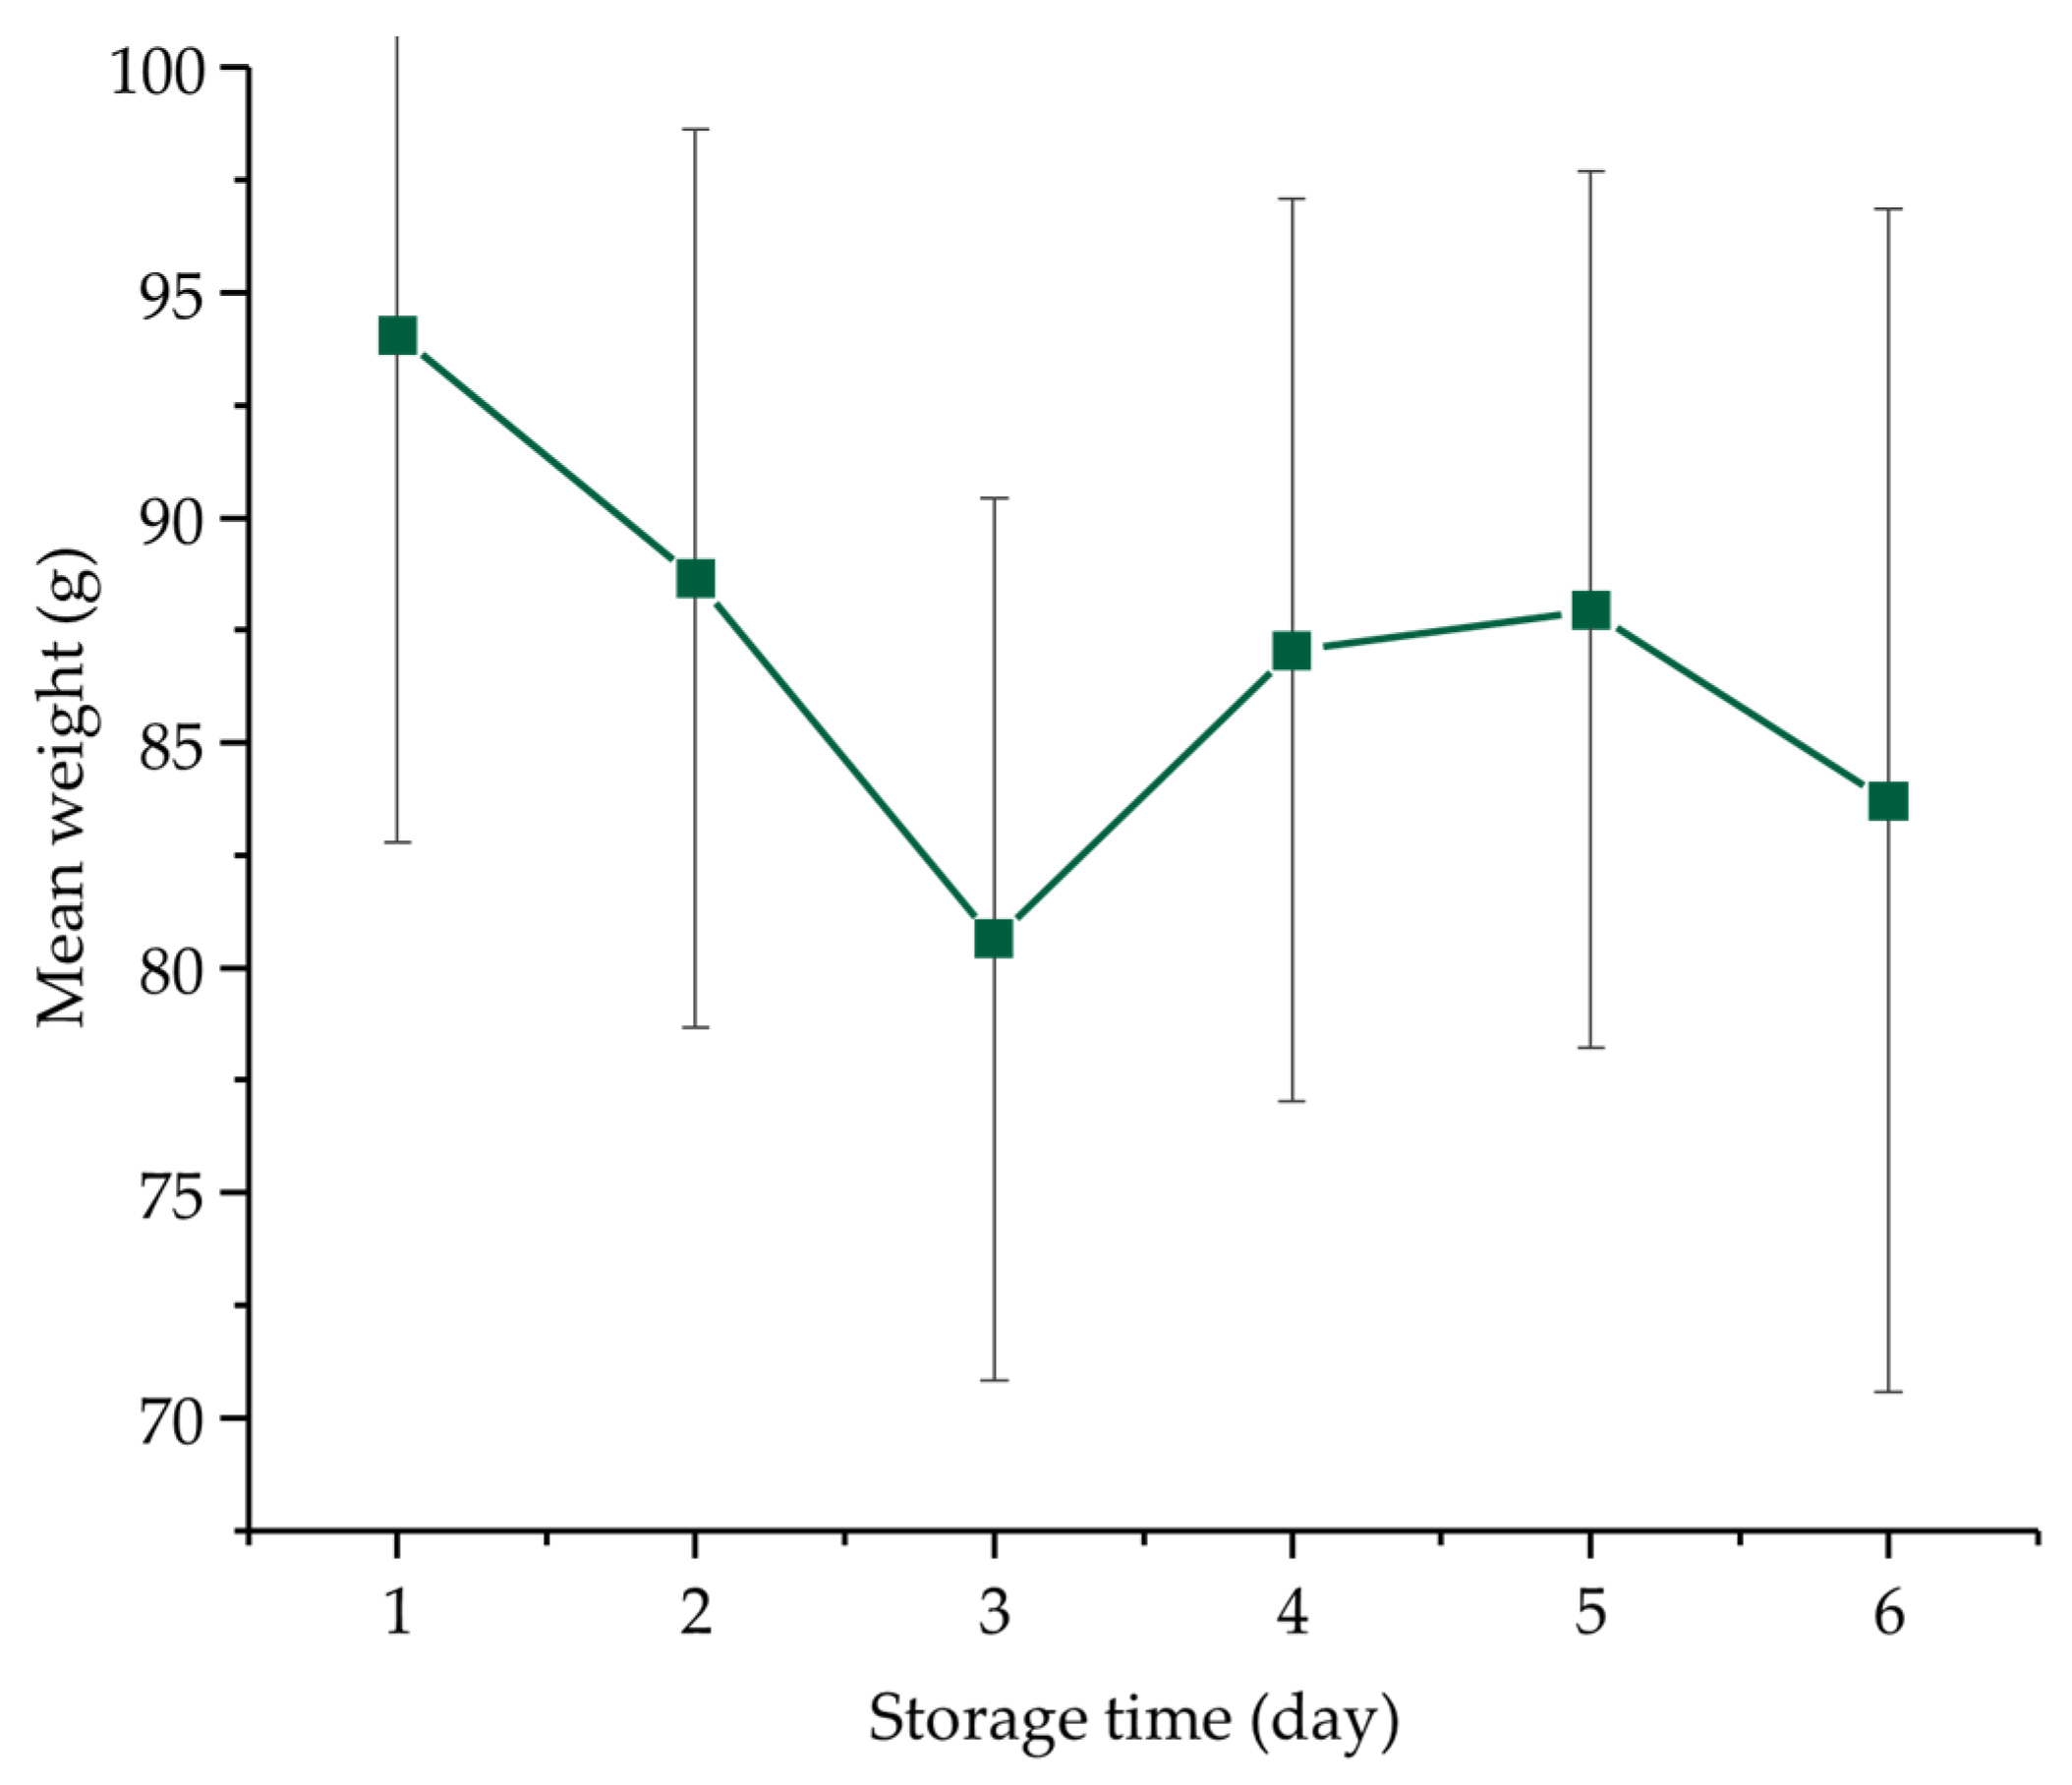
3.1. Weight Change
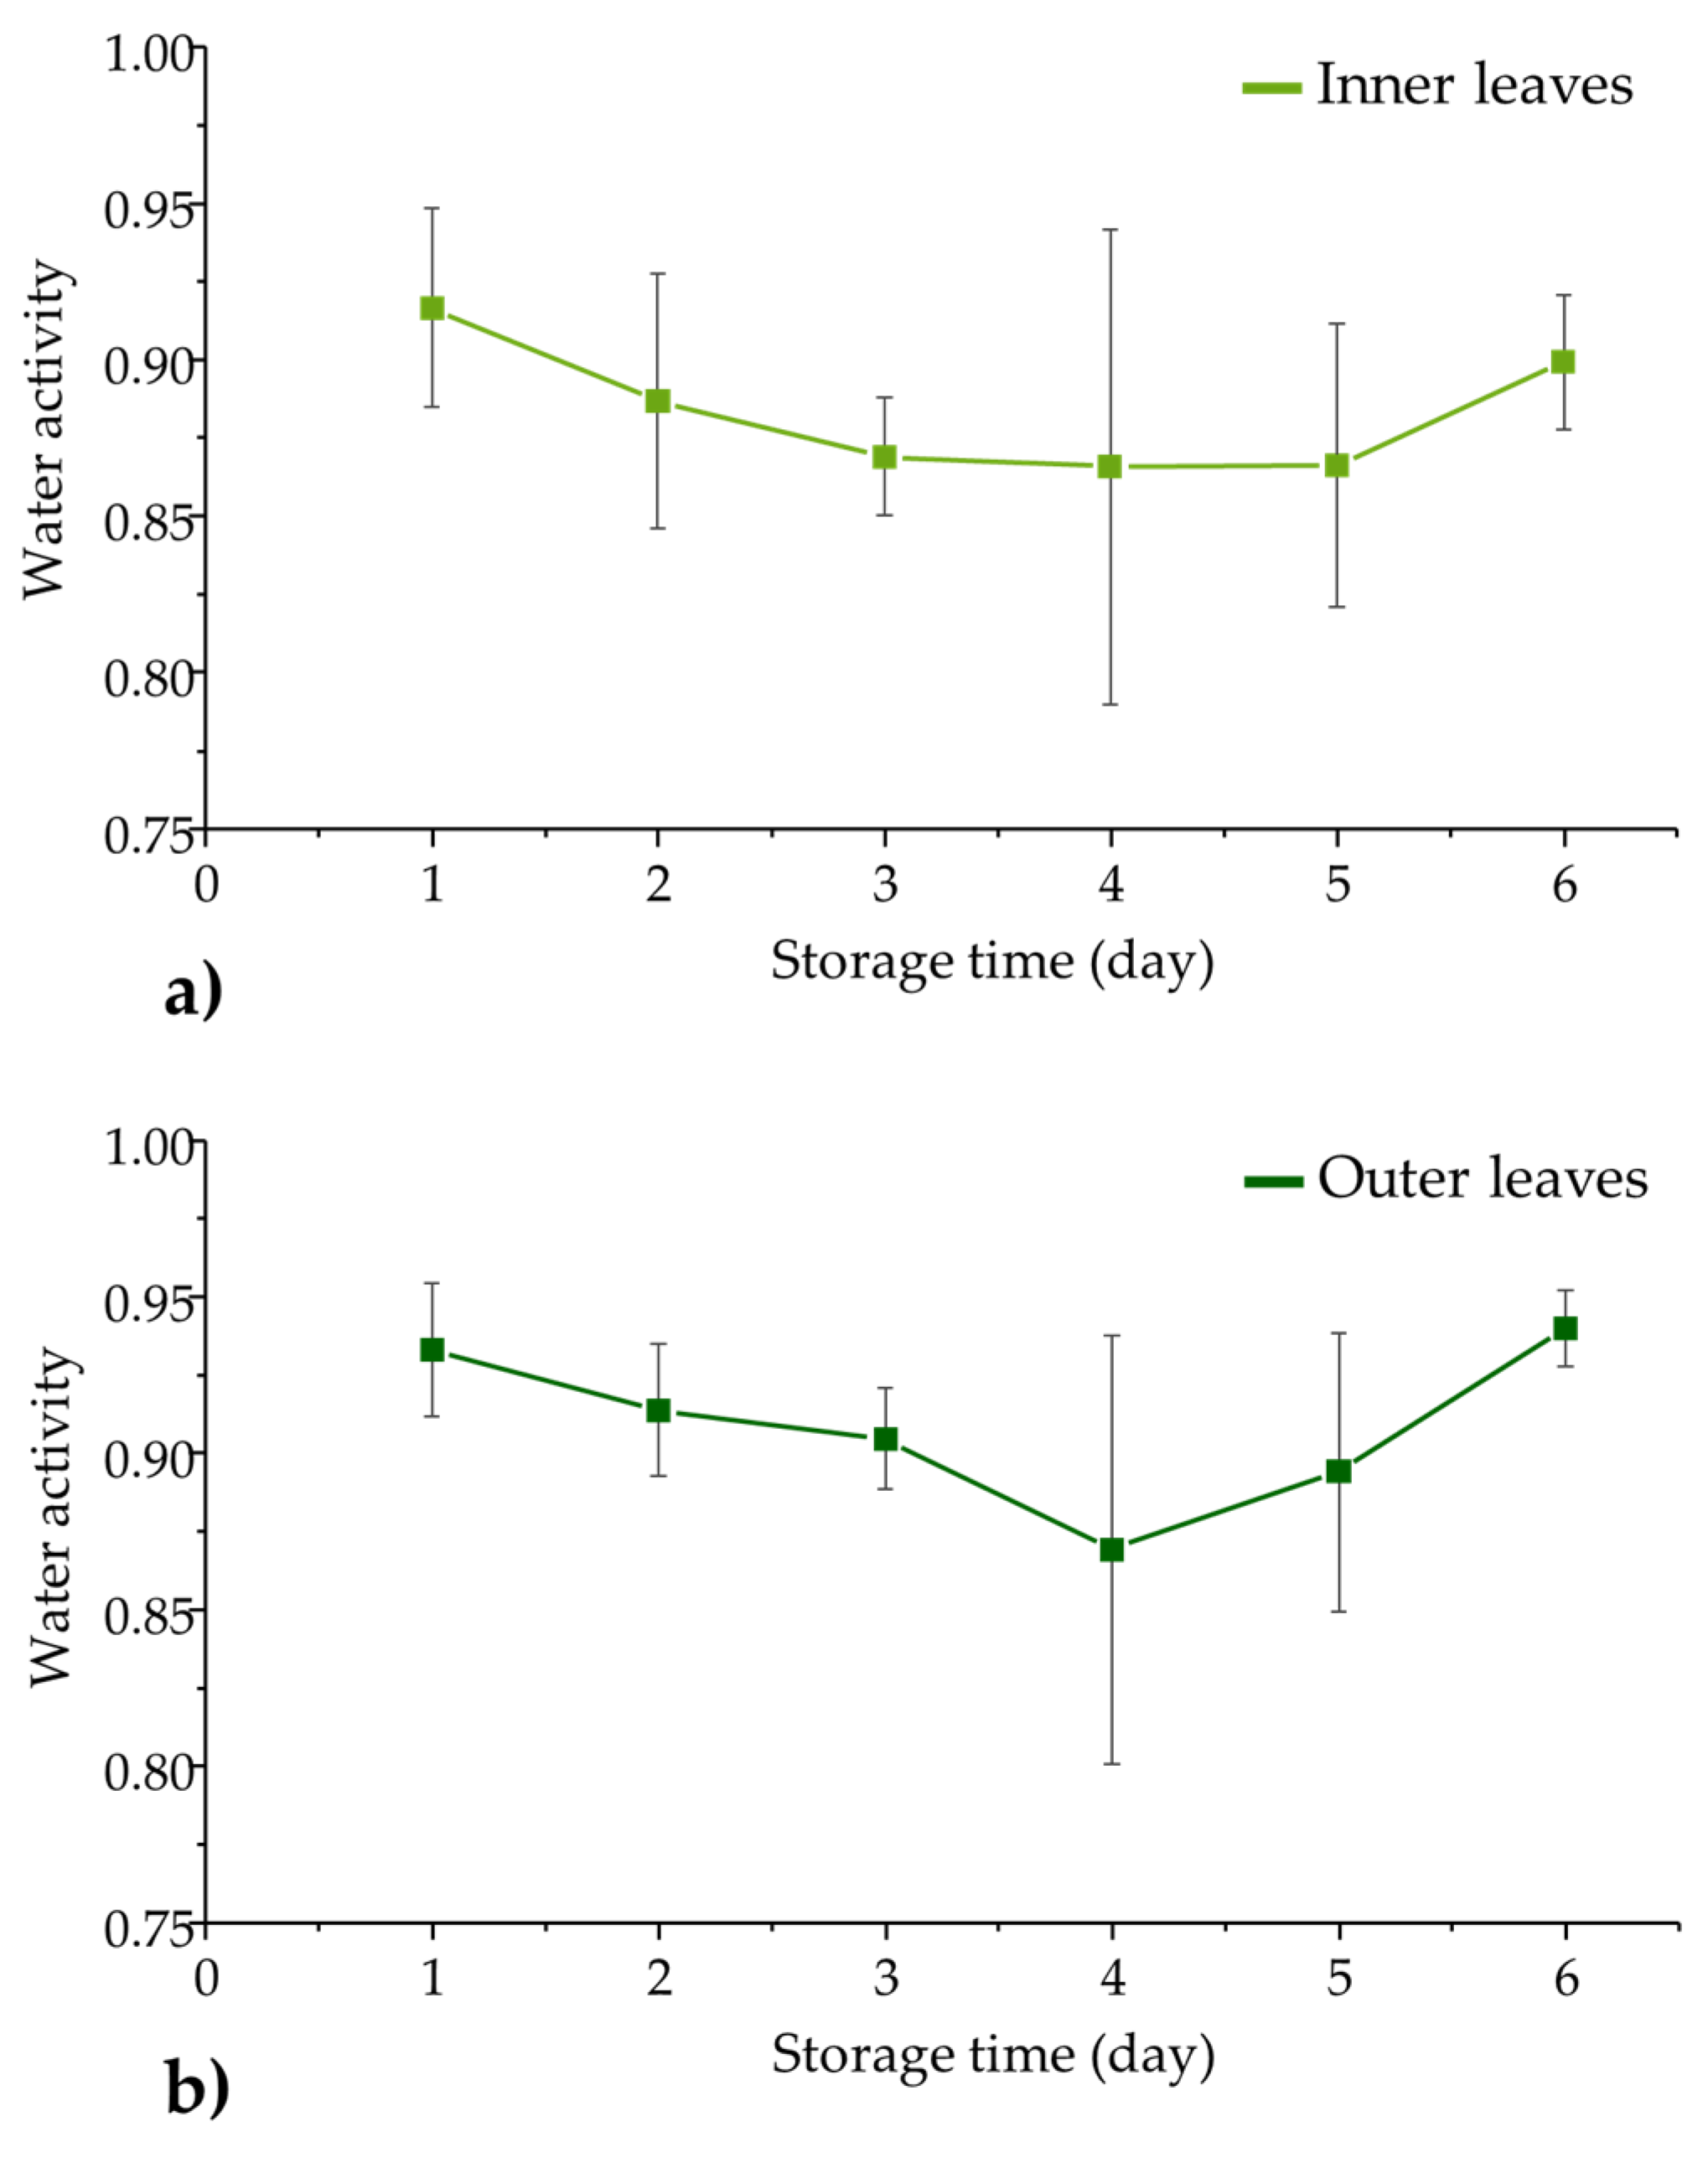
3.2. Water Activity
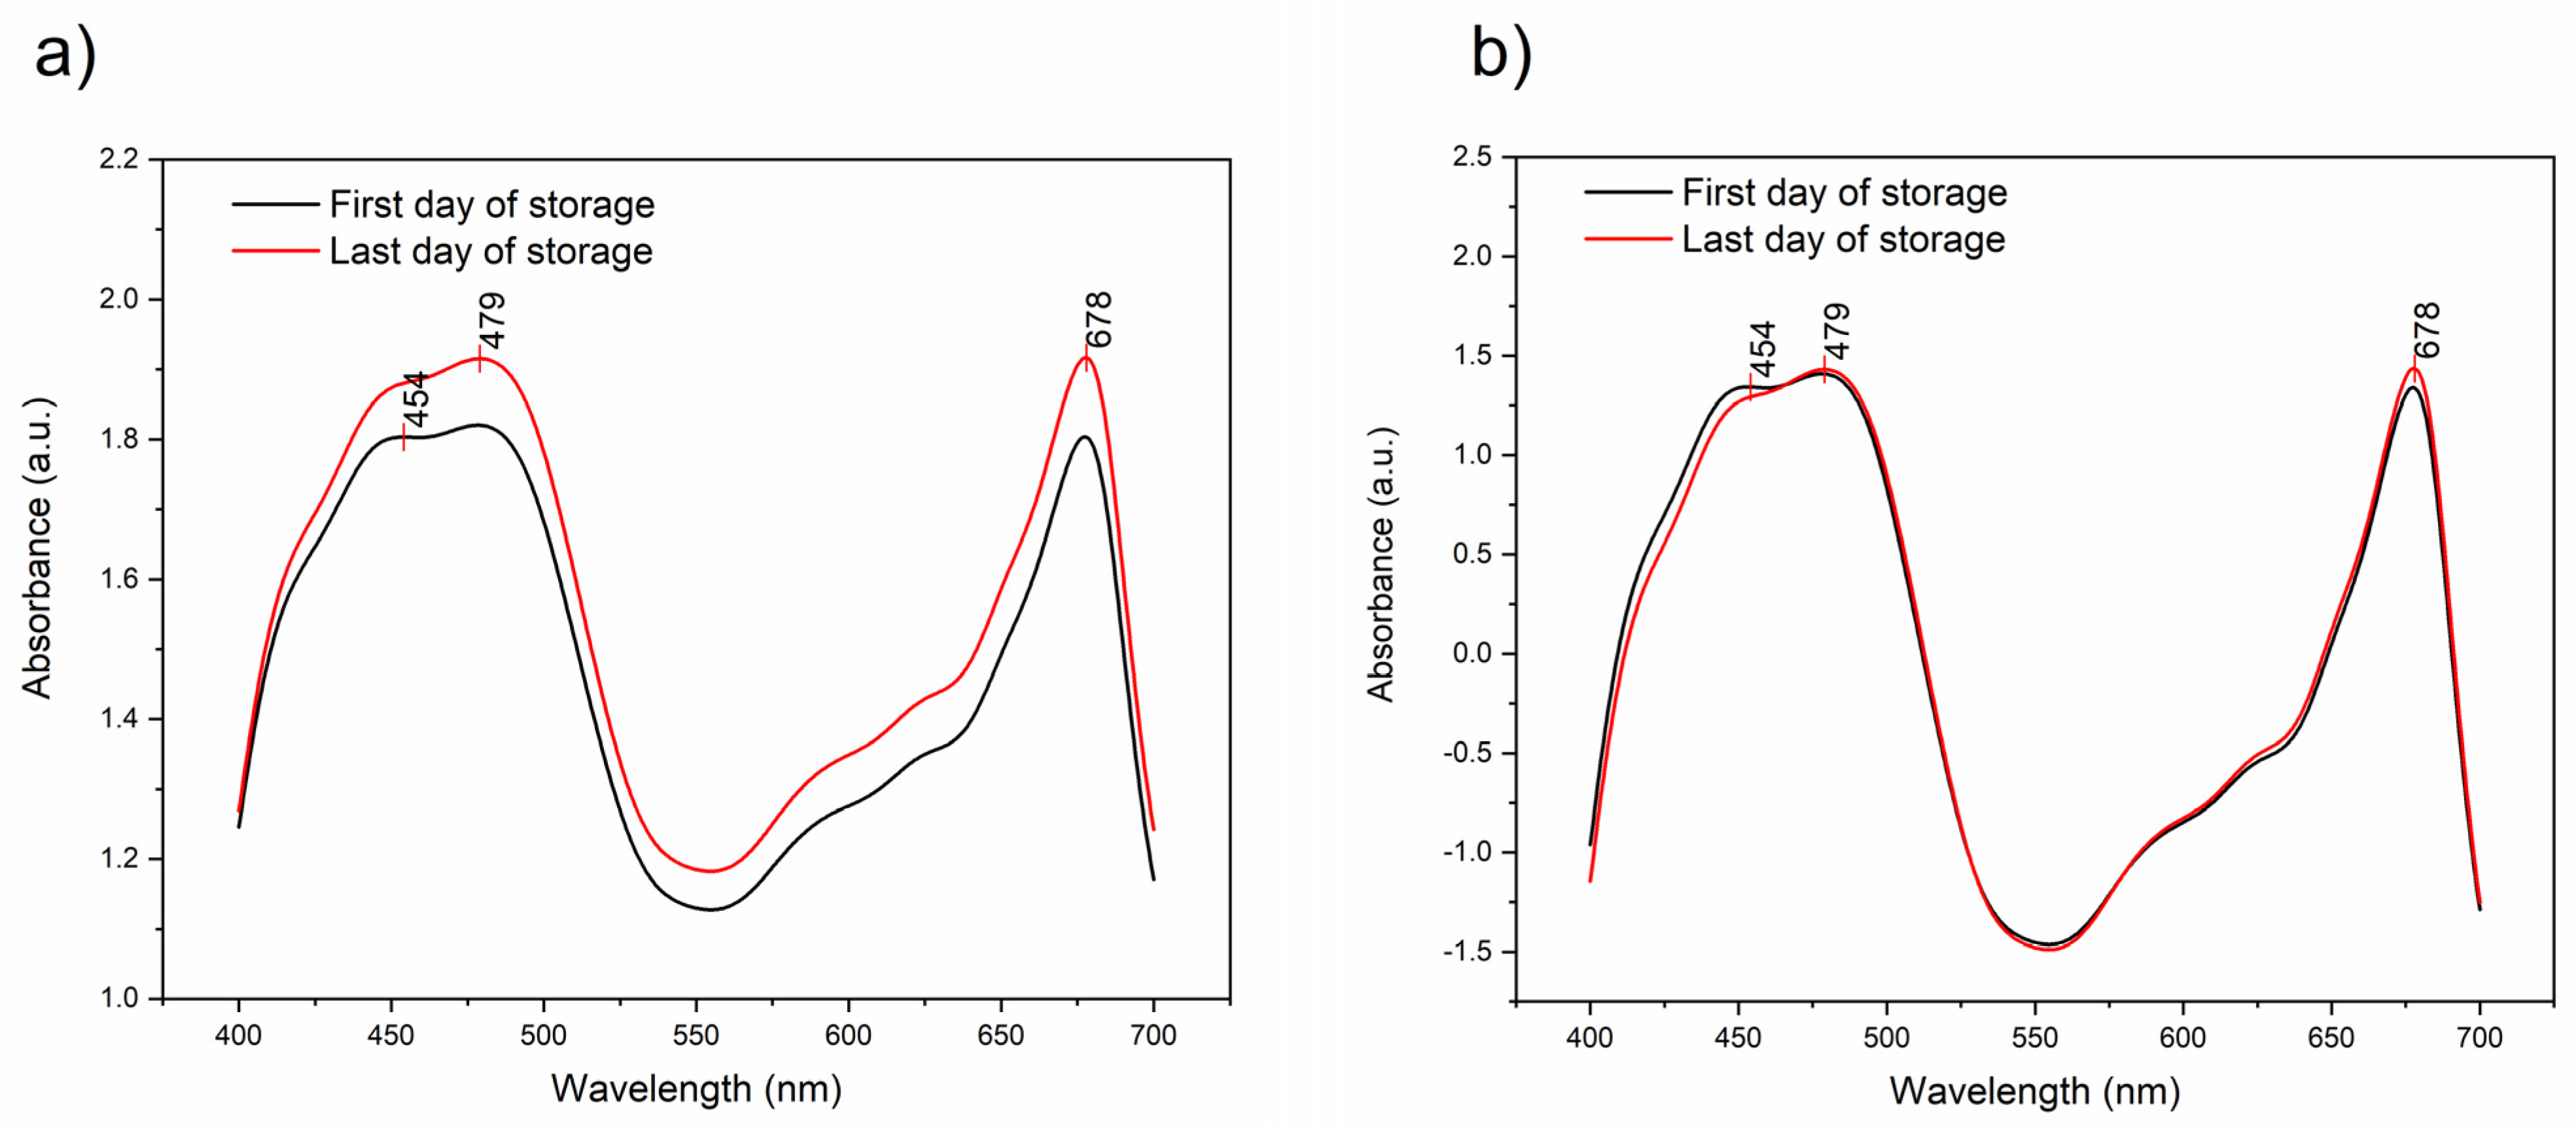
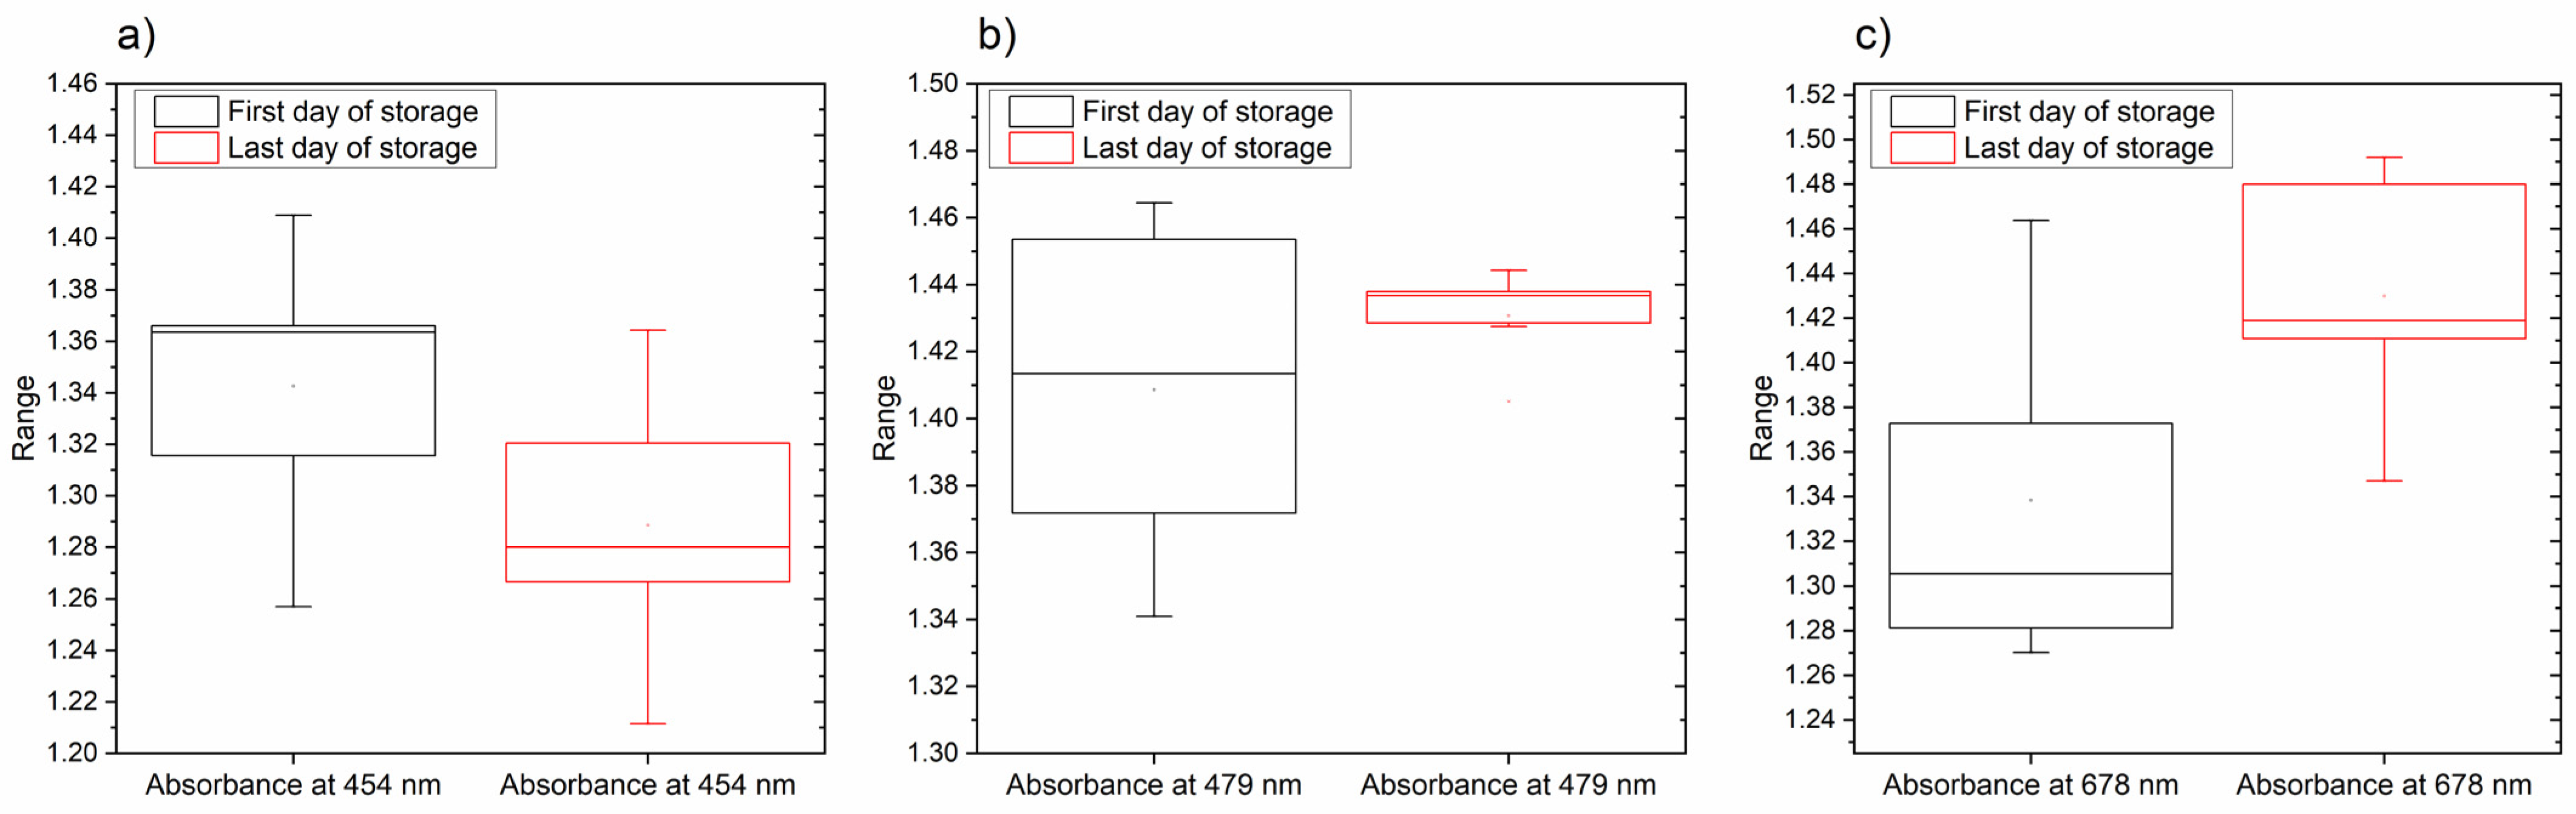
3.3. The Changes in Pigments
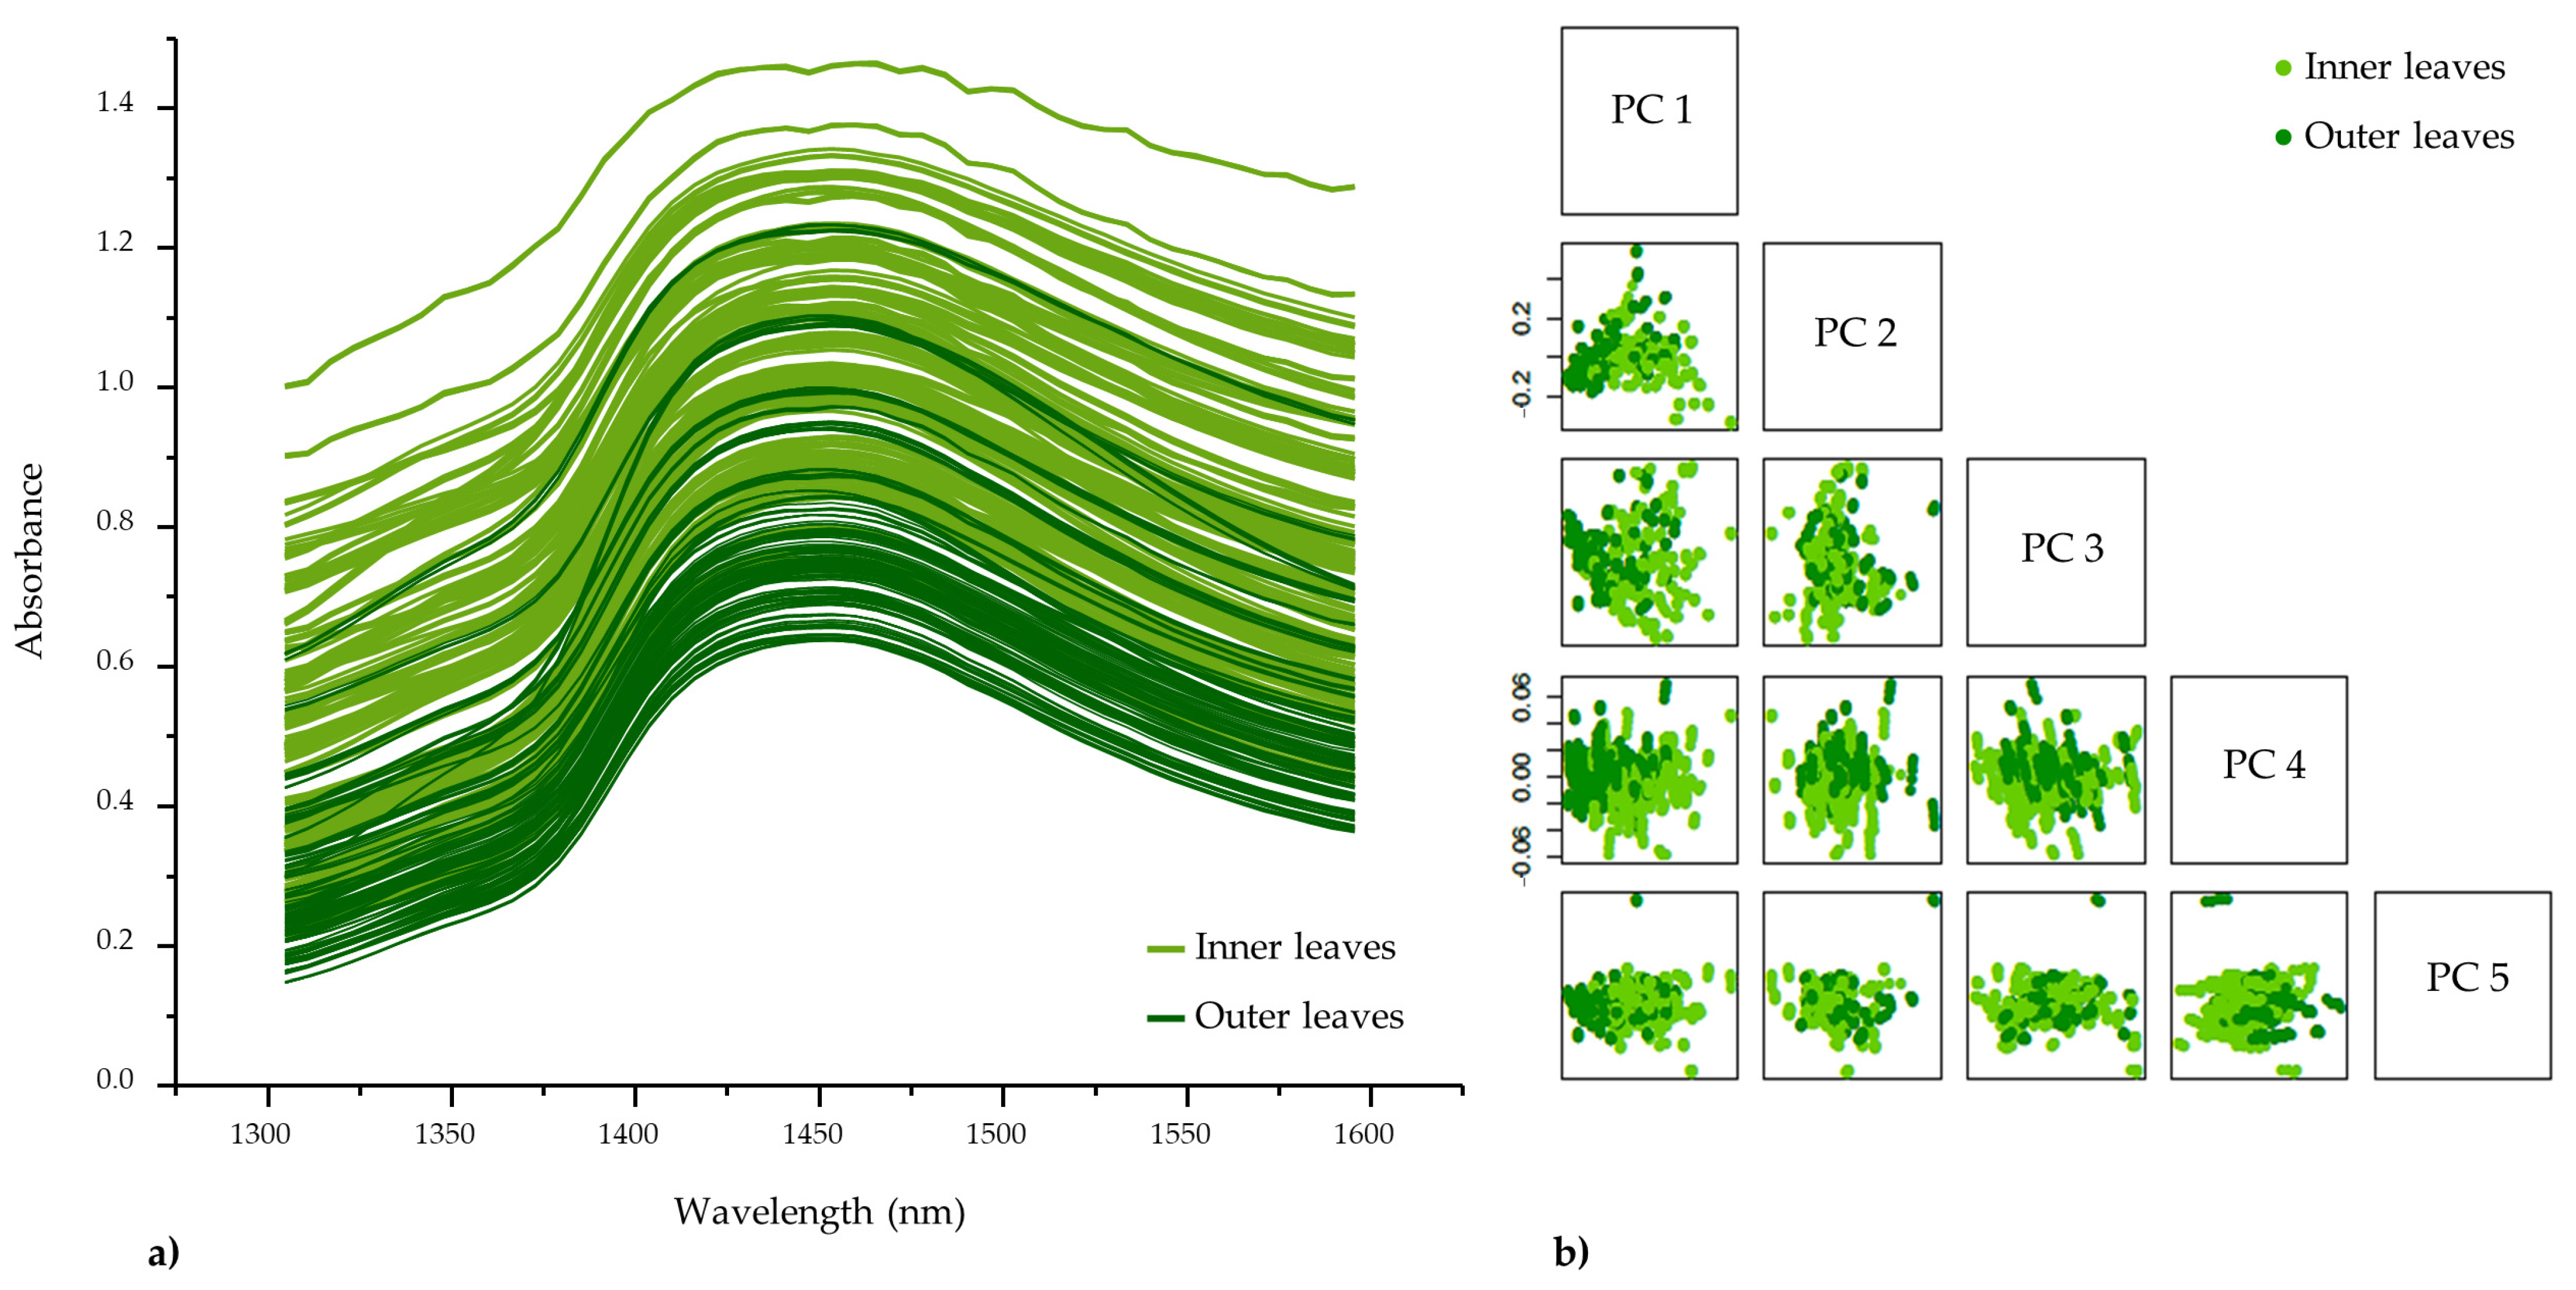
3.4. Aquaphotomic Multivariate Data Analysis
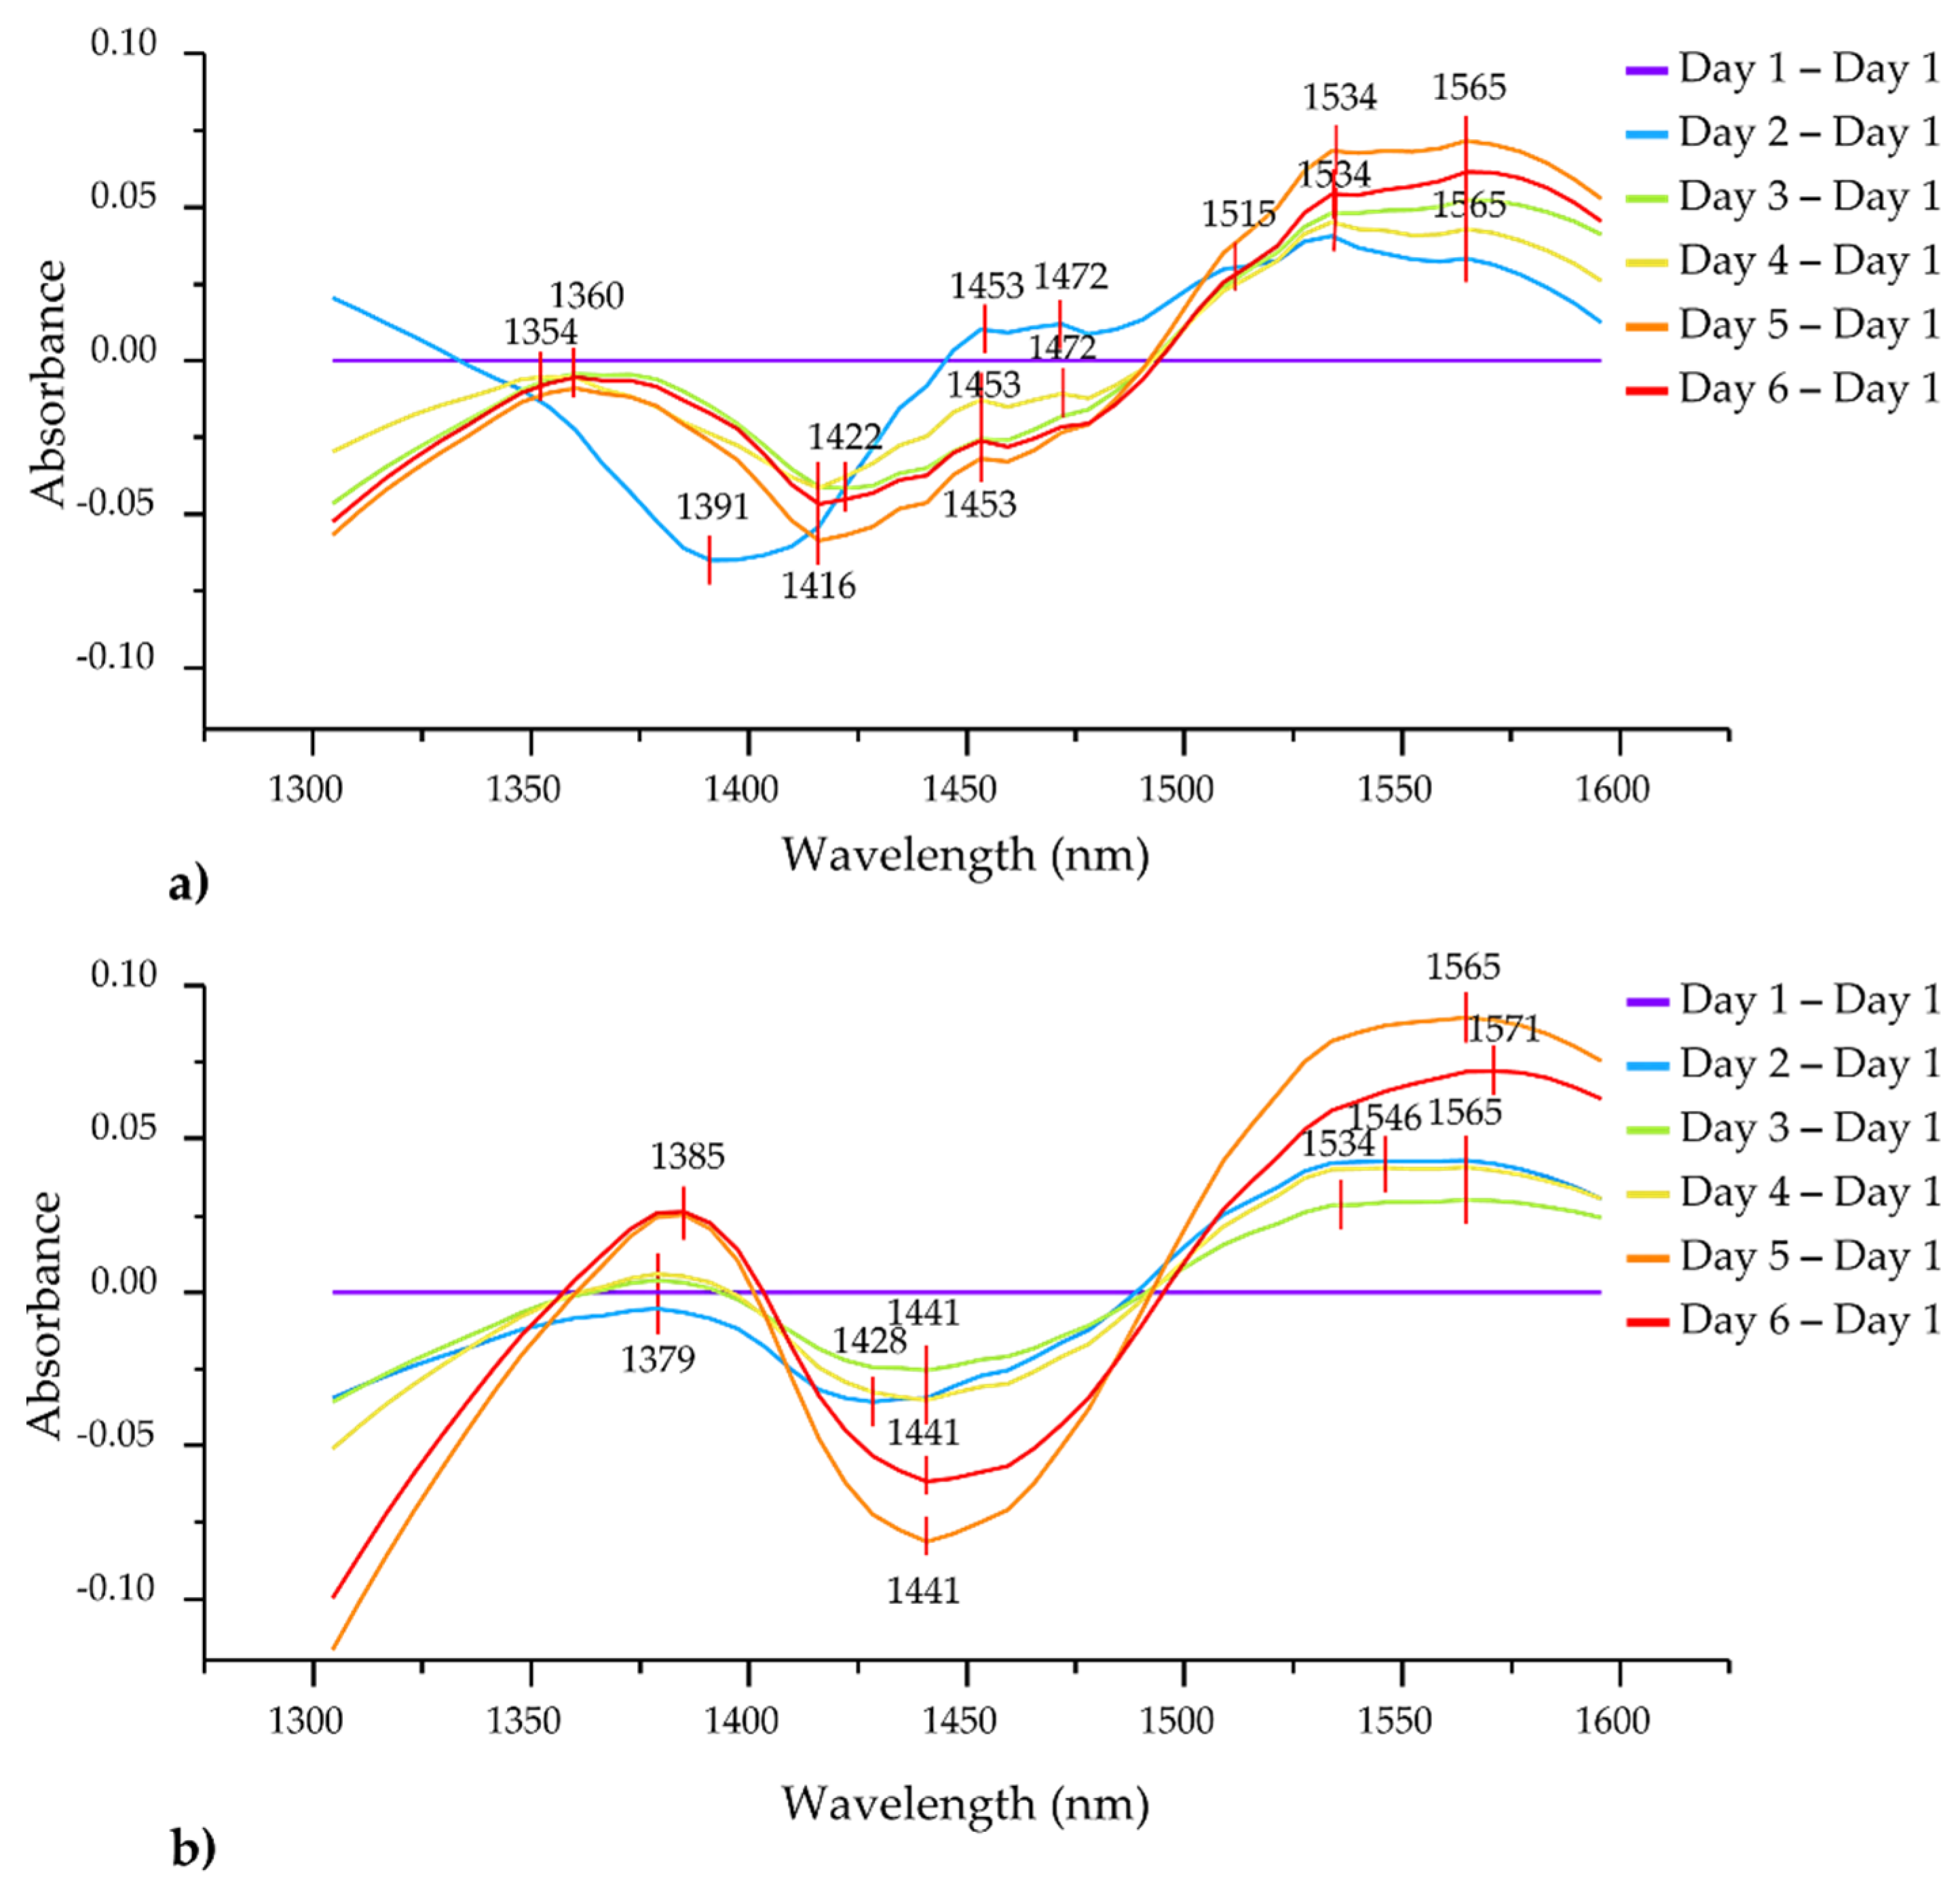
3.4.1. Preliminary Analysis of NIR Spectral Data Difference Spectra
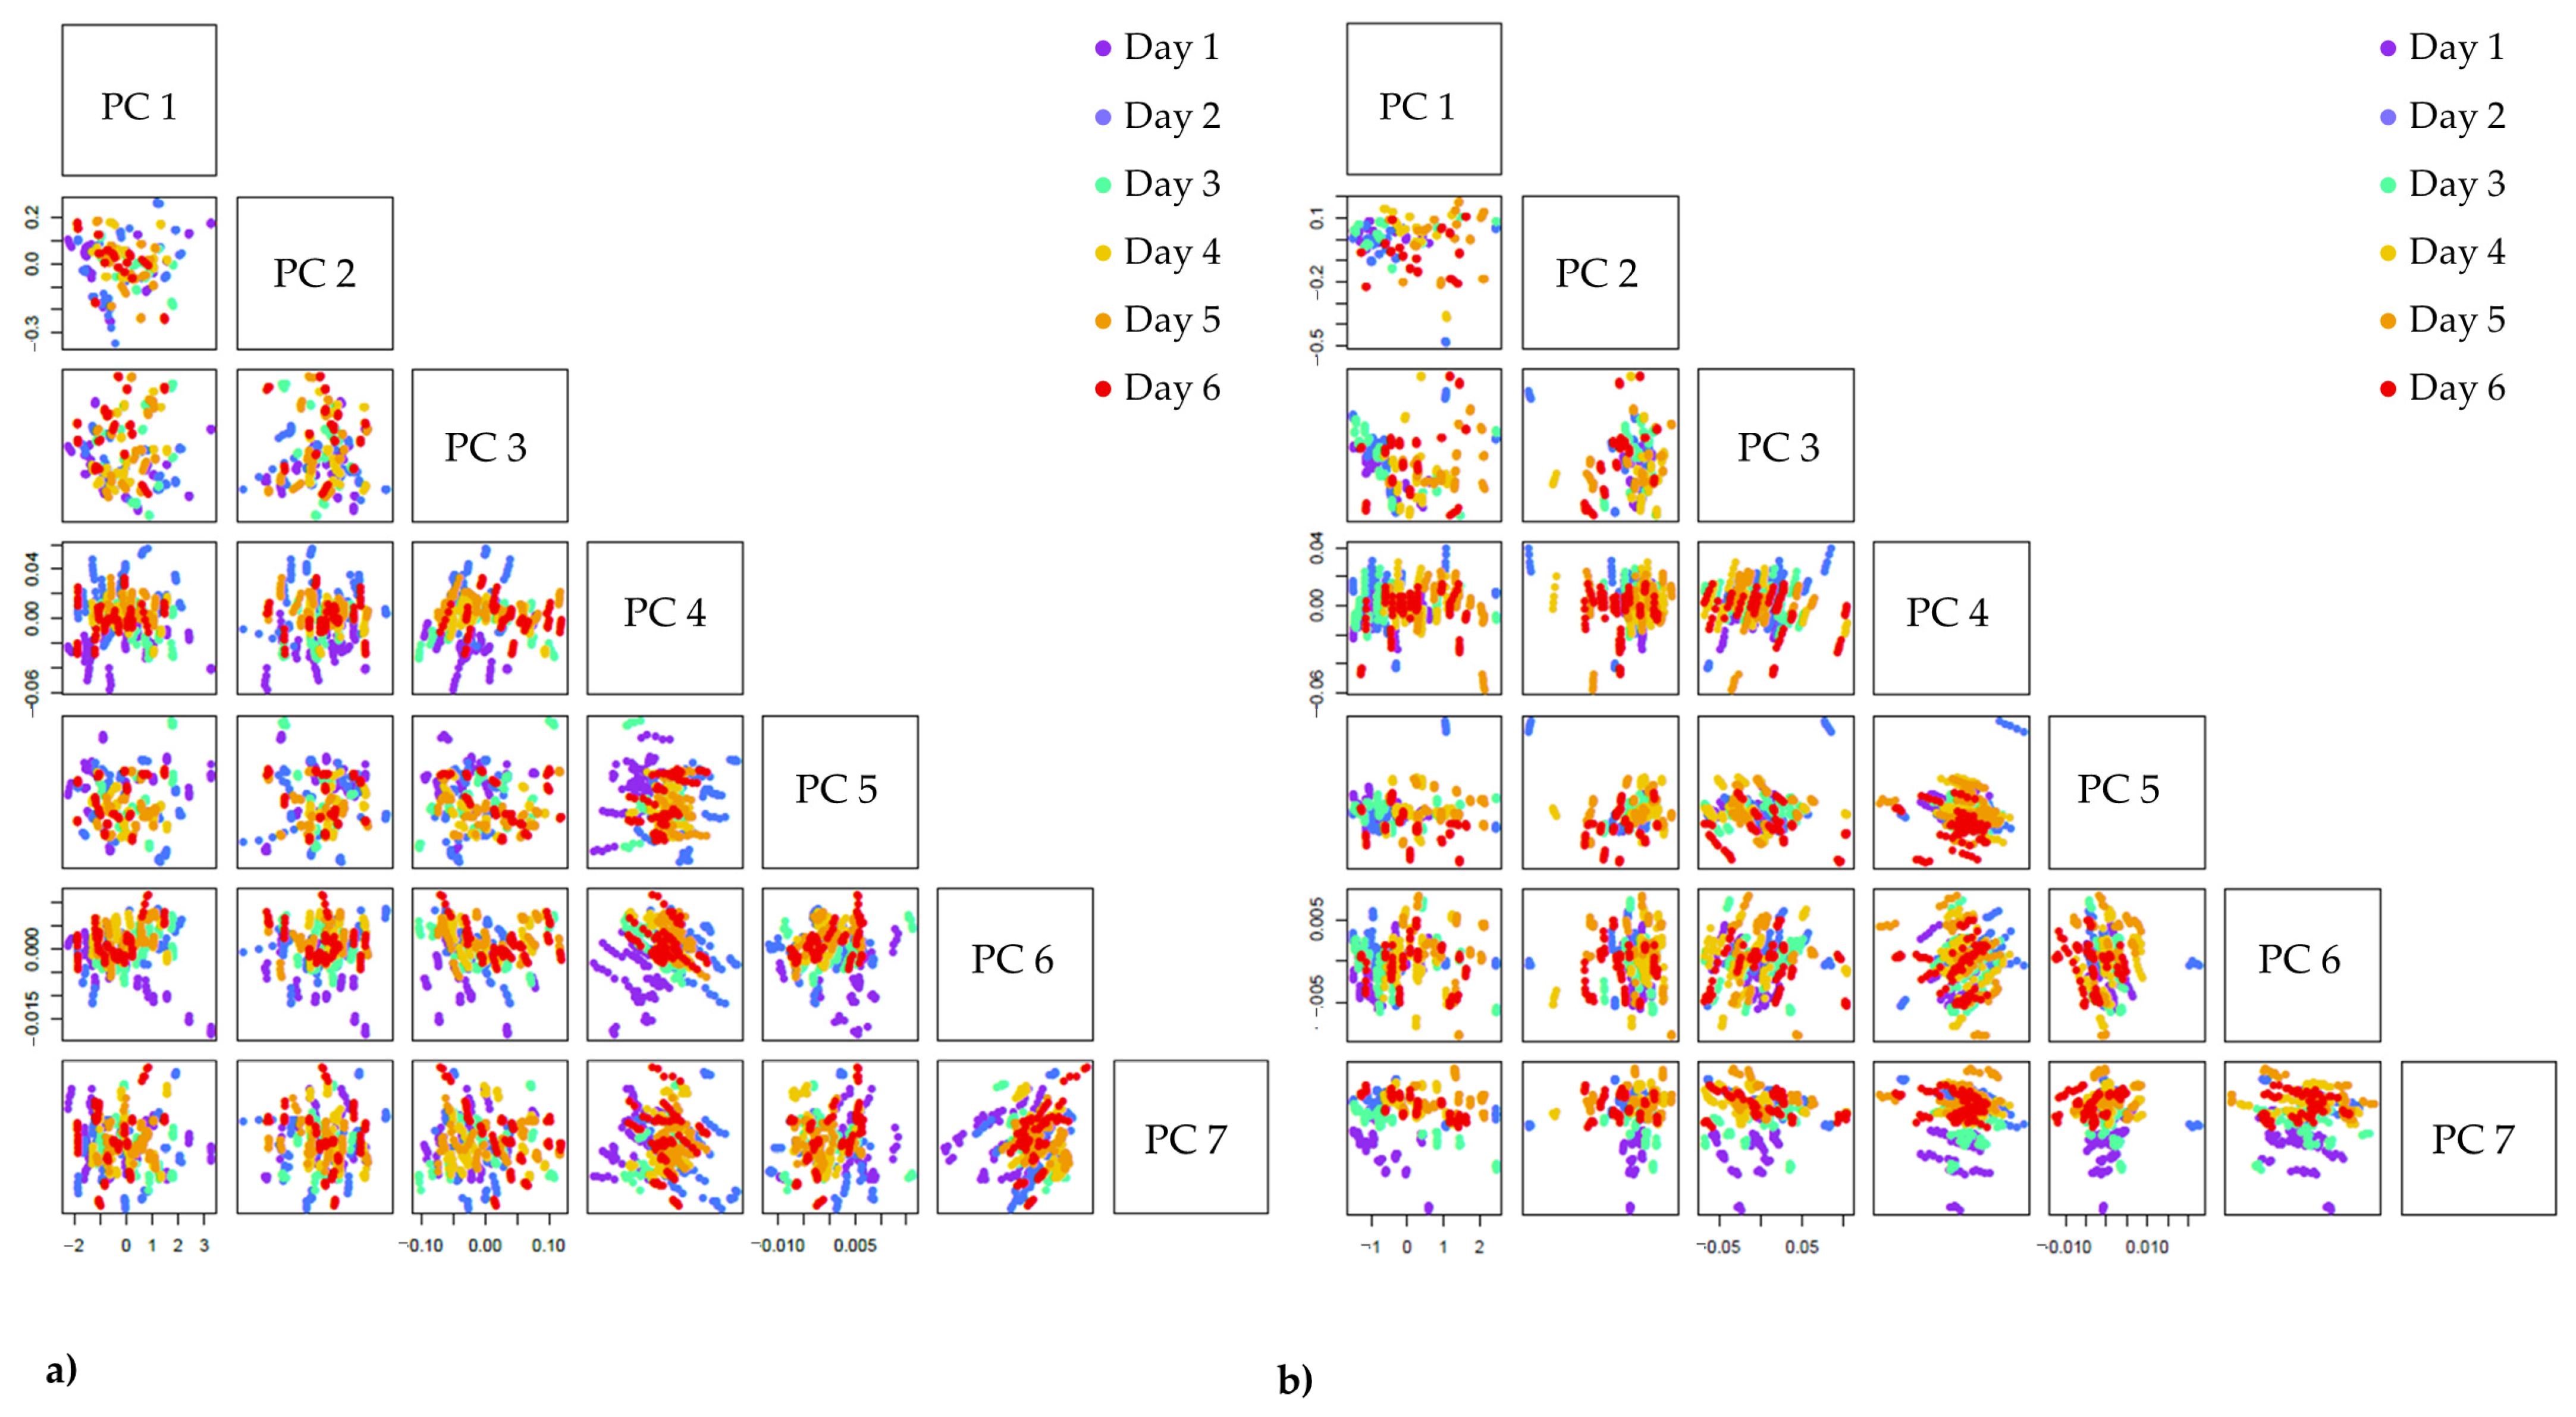
3.4.2. Exploratory Spectral Analysis–Principal Component Analysis (PCA)
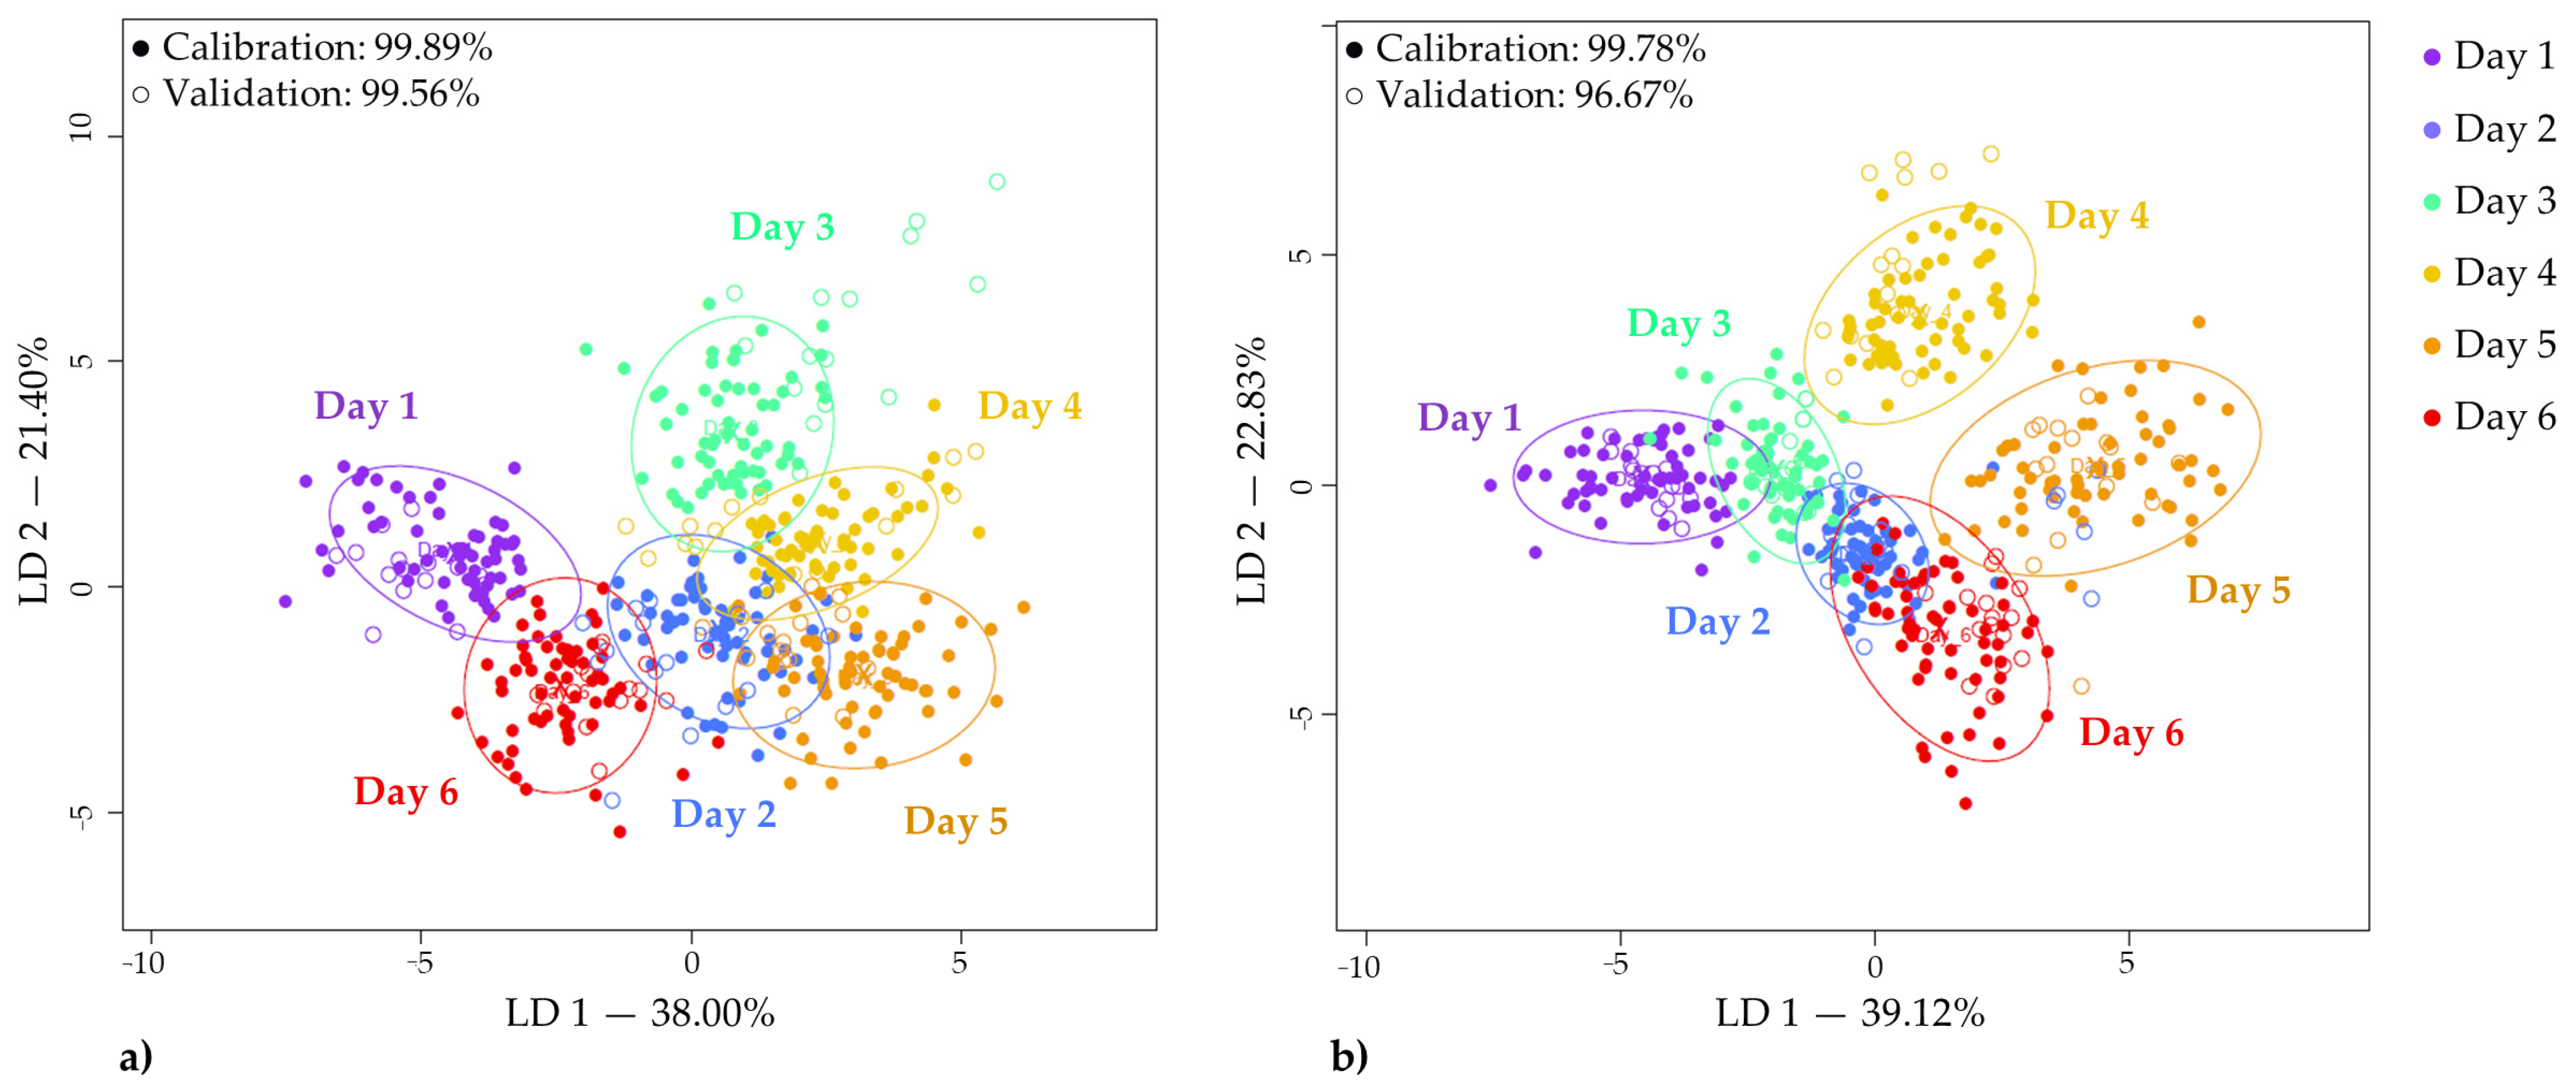
3.4.3. Linear Discriminant Analysis of the Storage Time
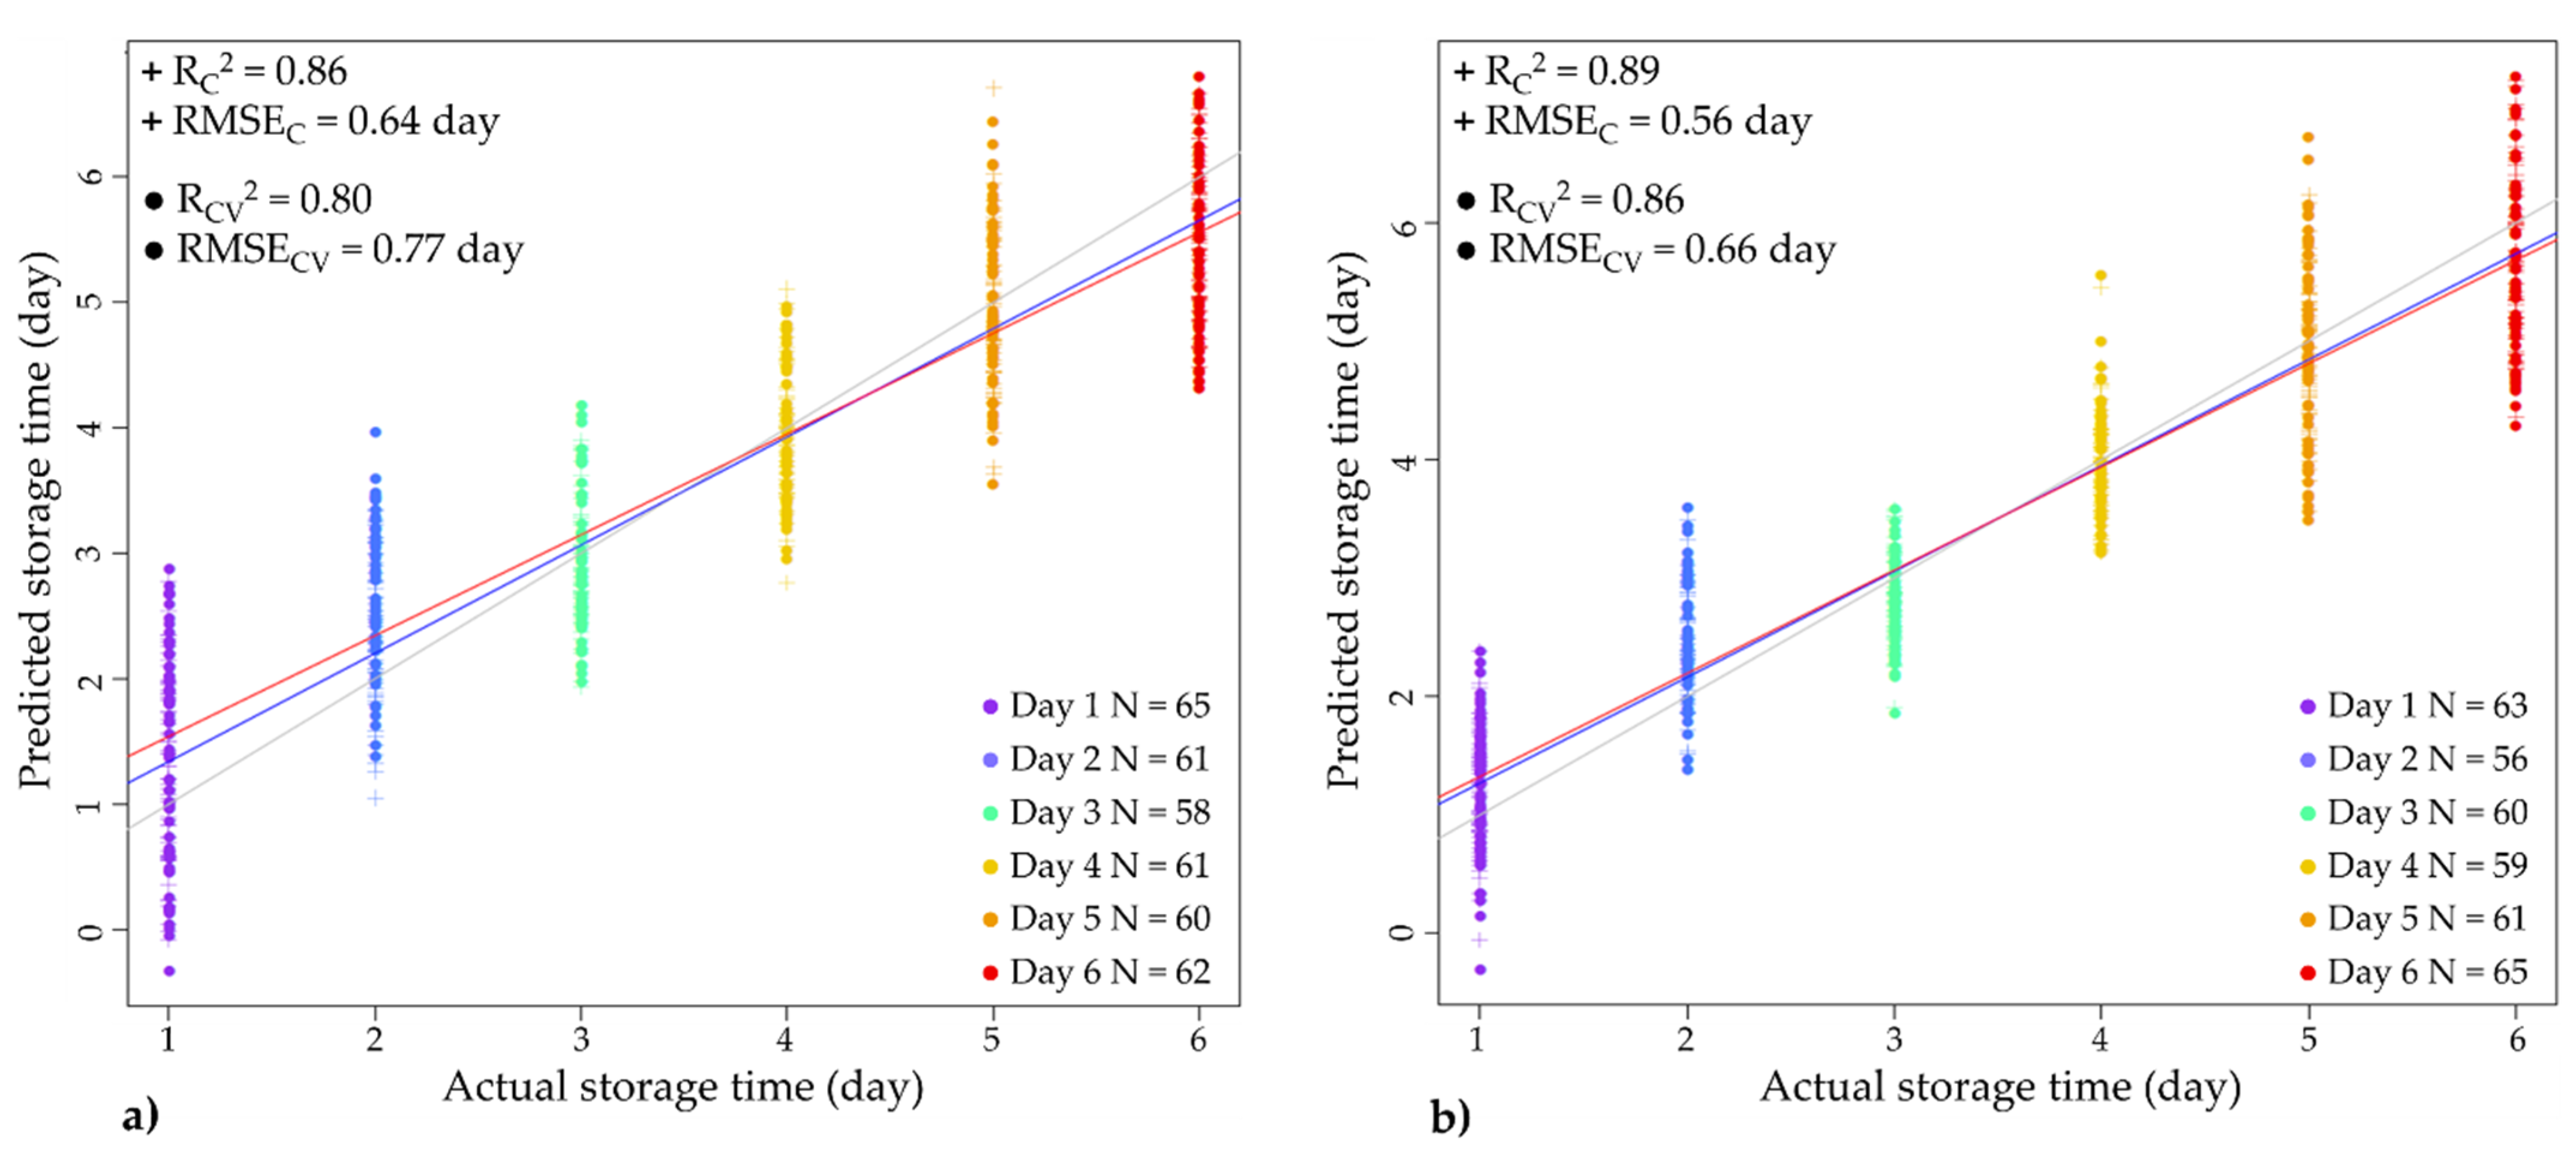
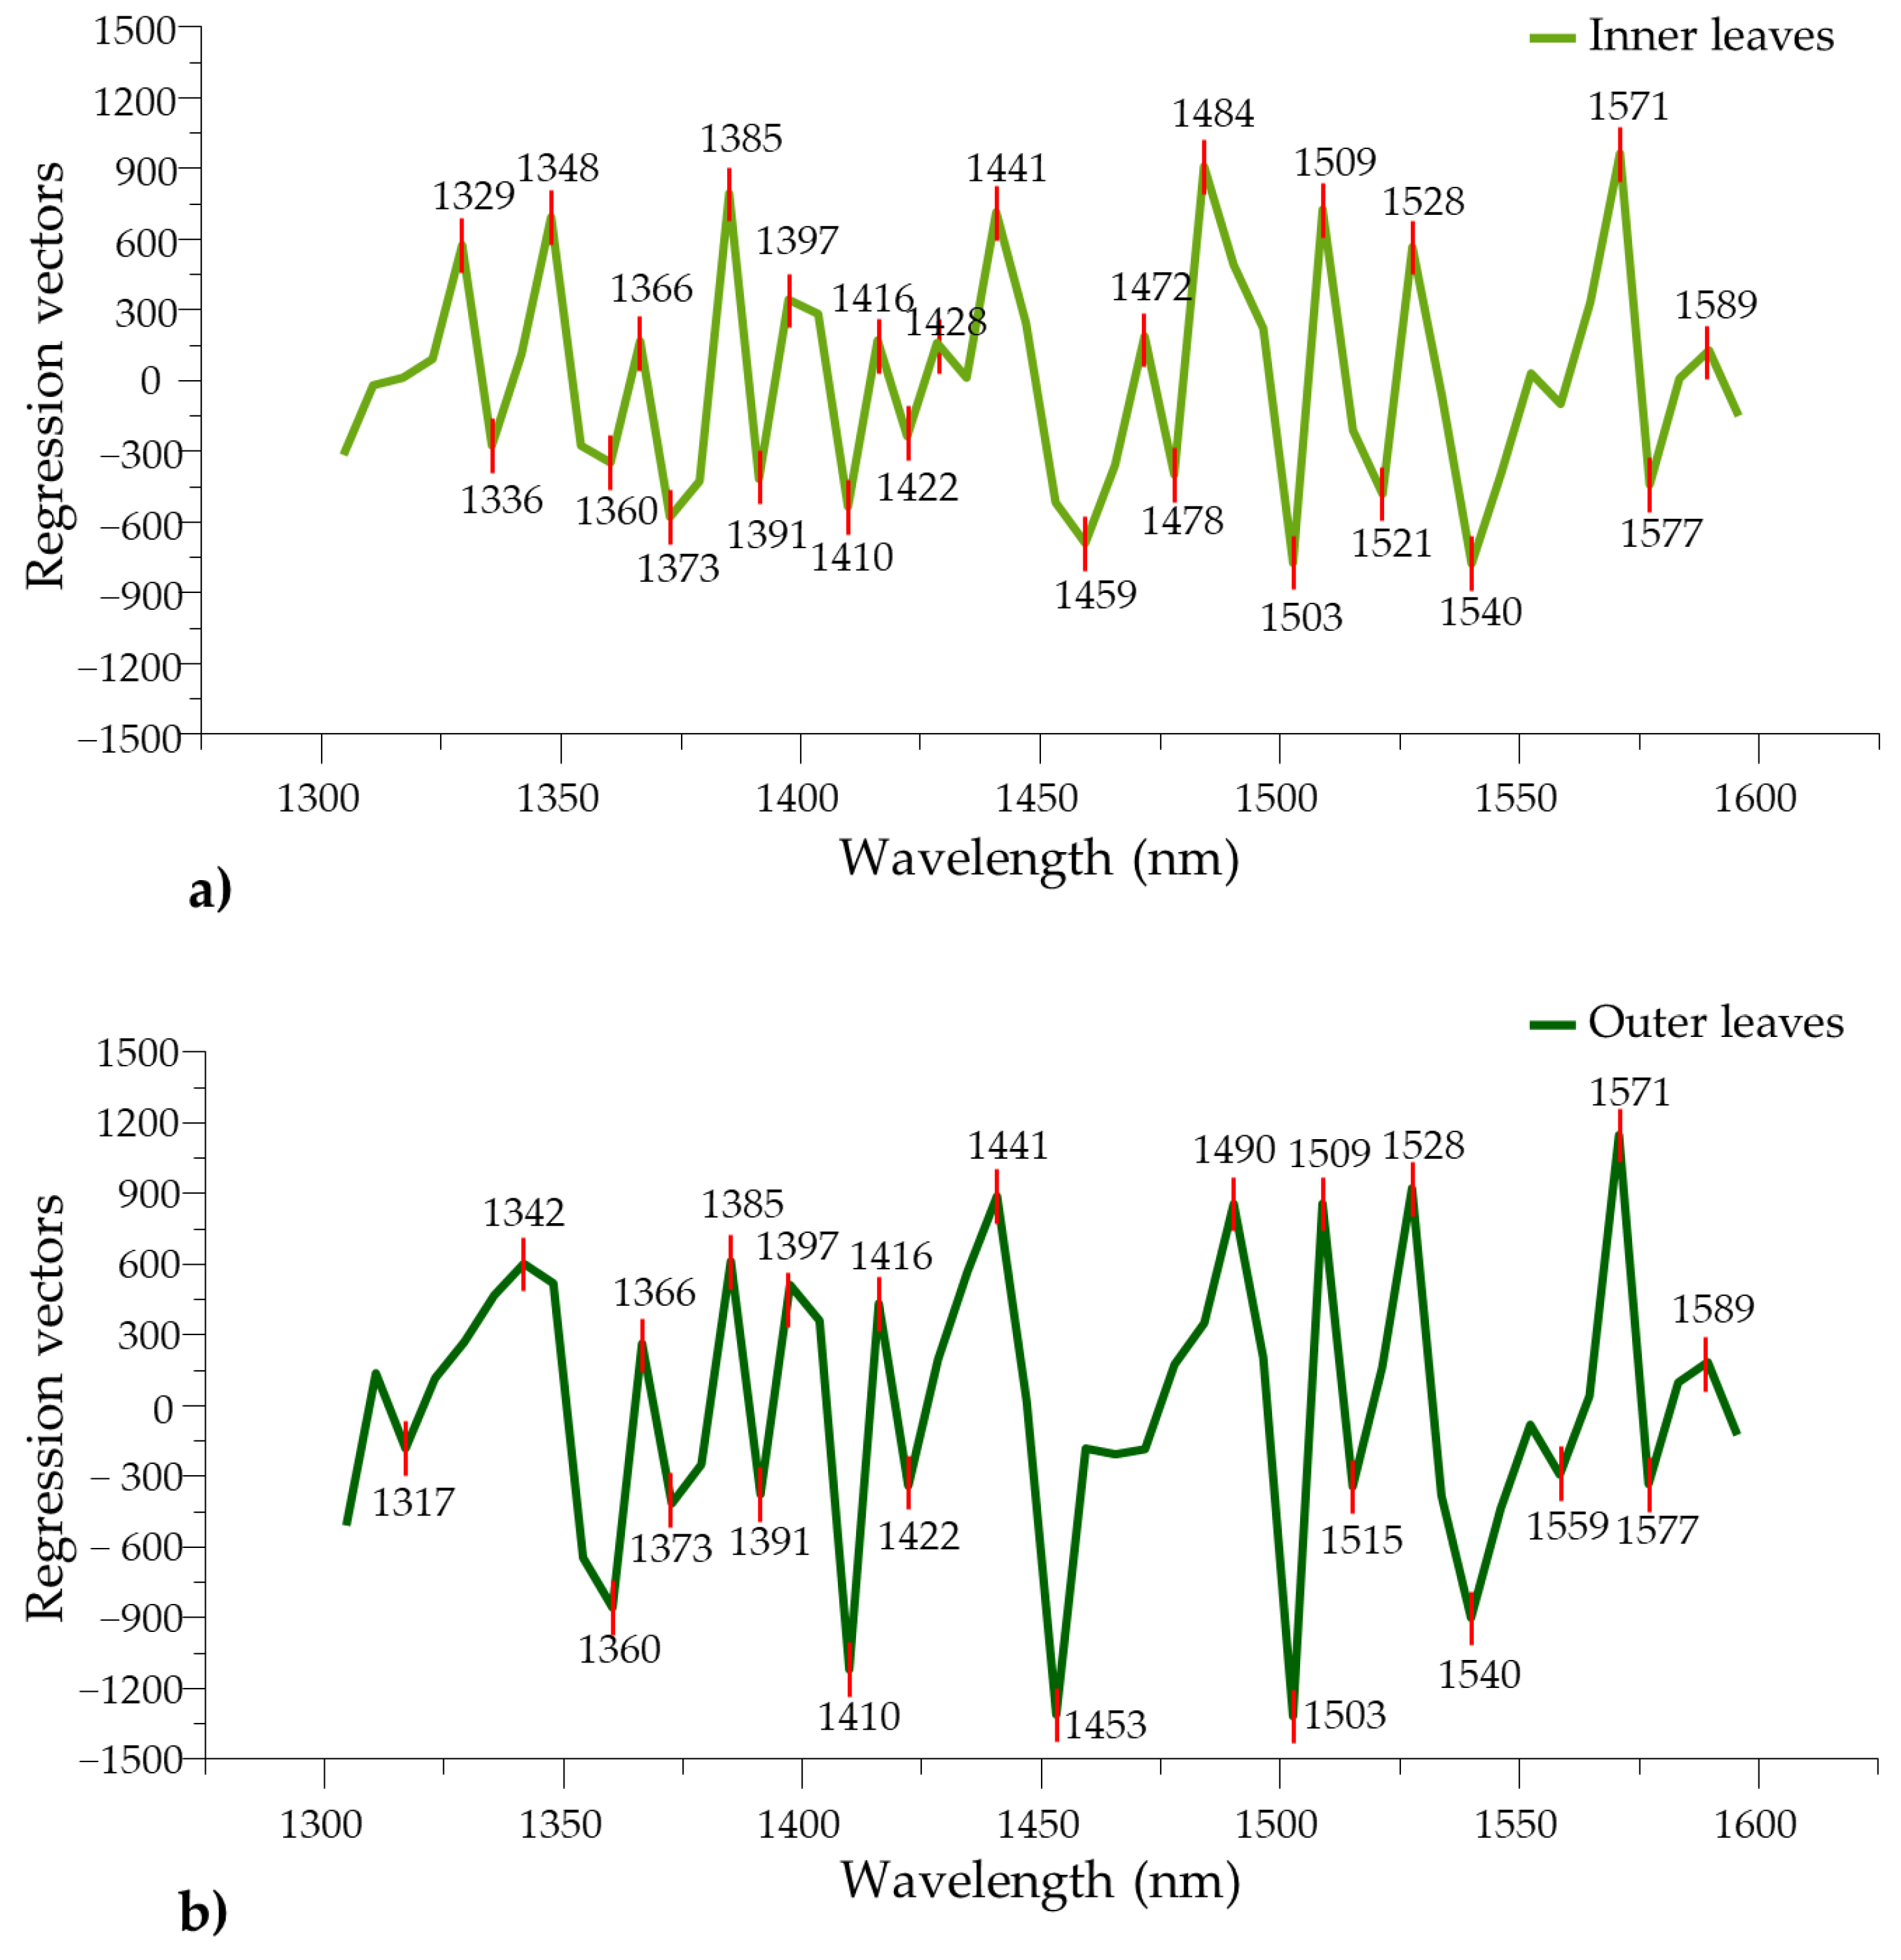
3.4.4. Partial Least Squares (PLS) Regression Modeling of Storage Time
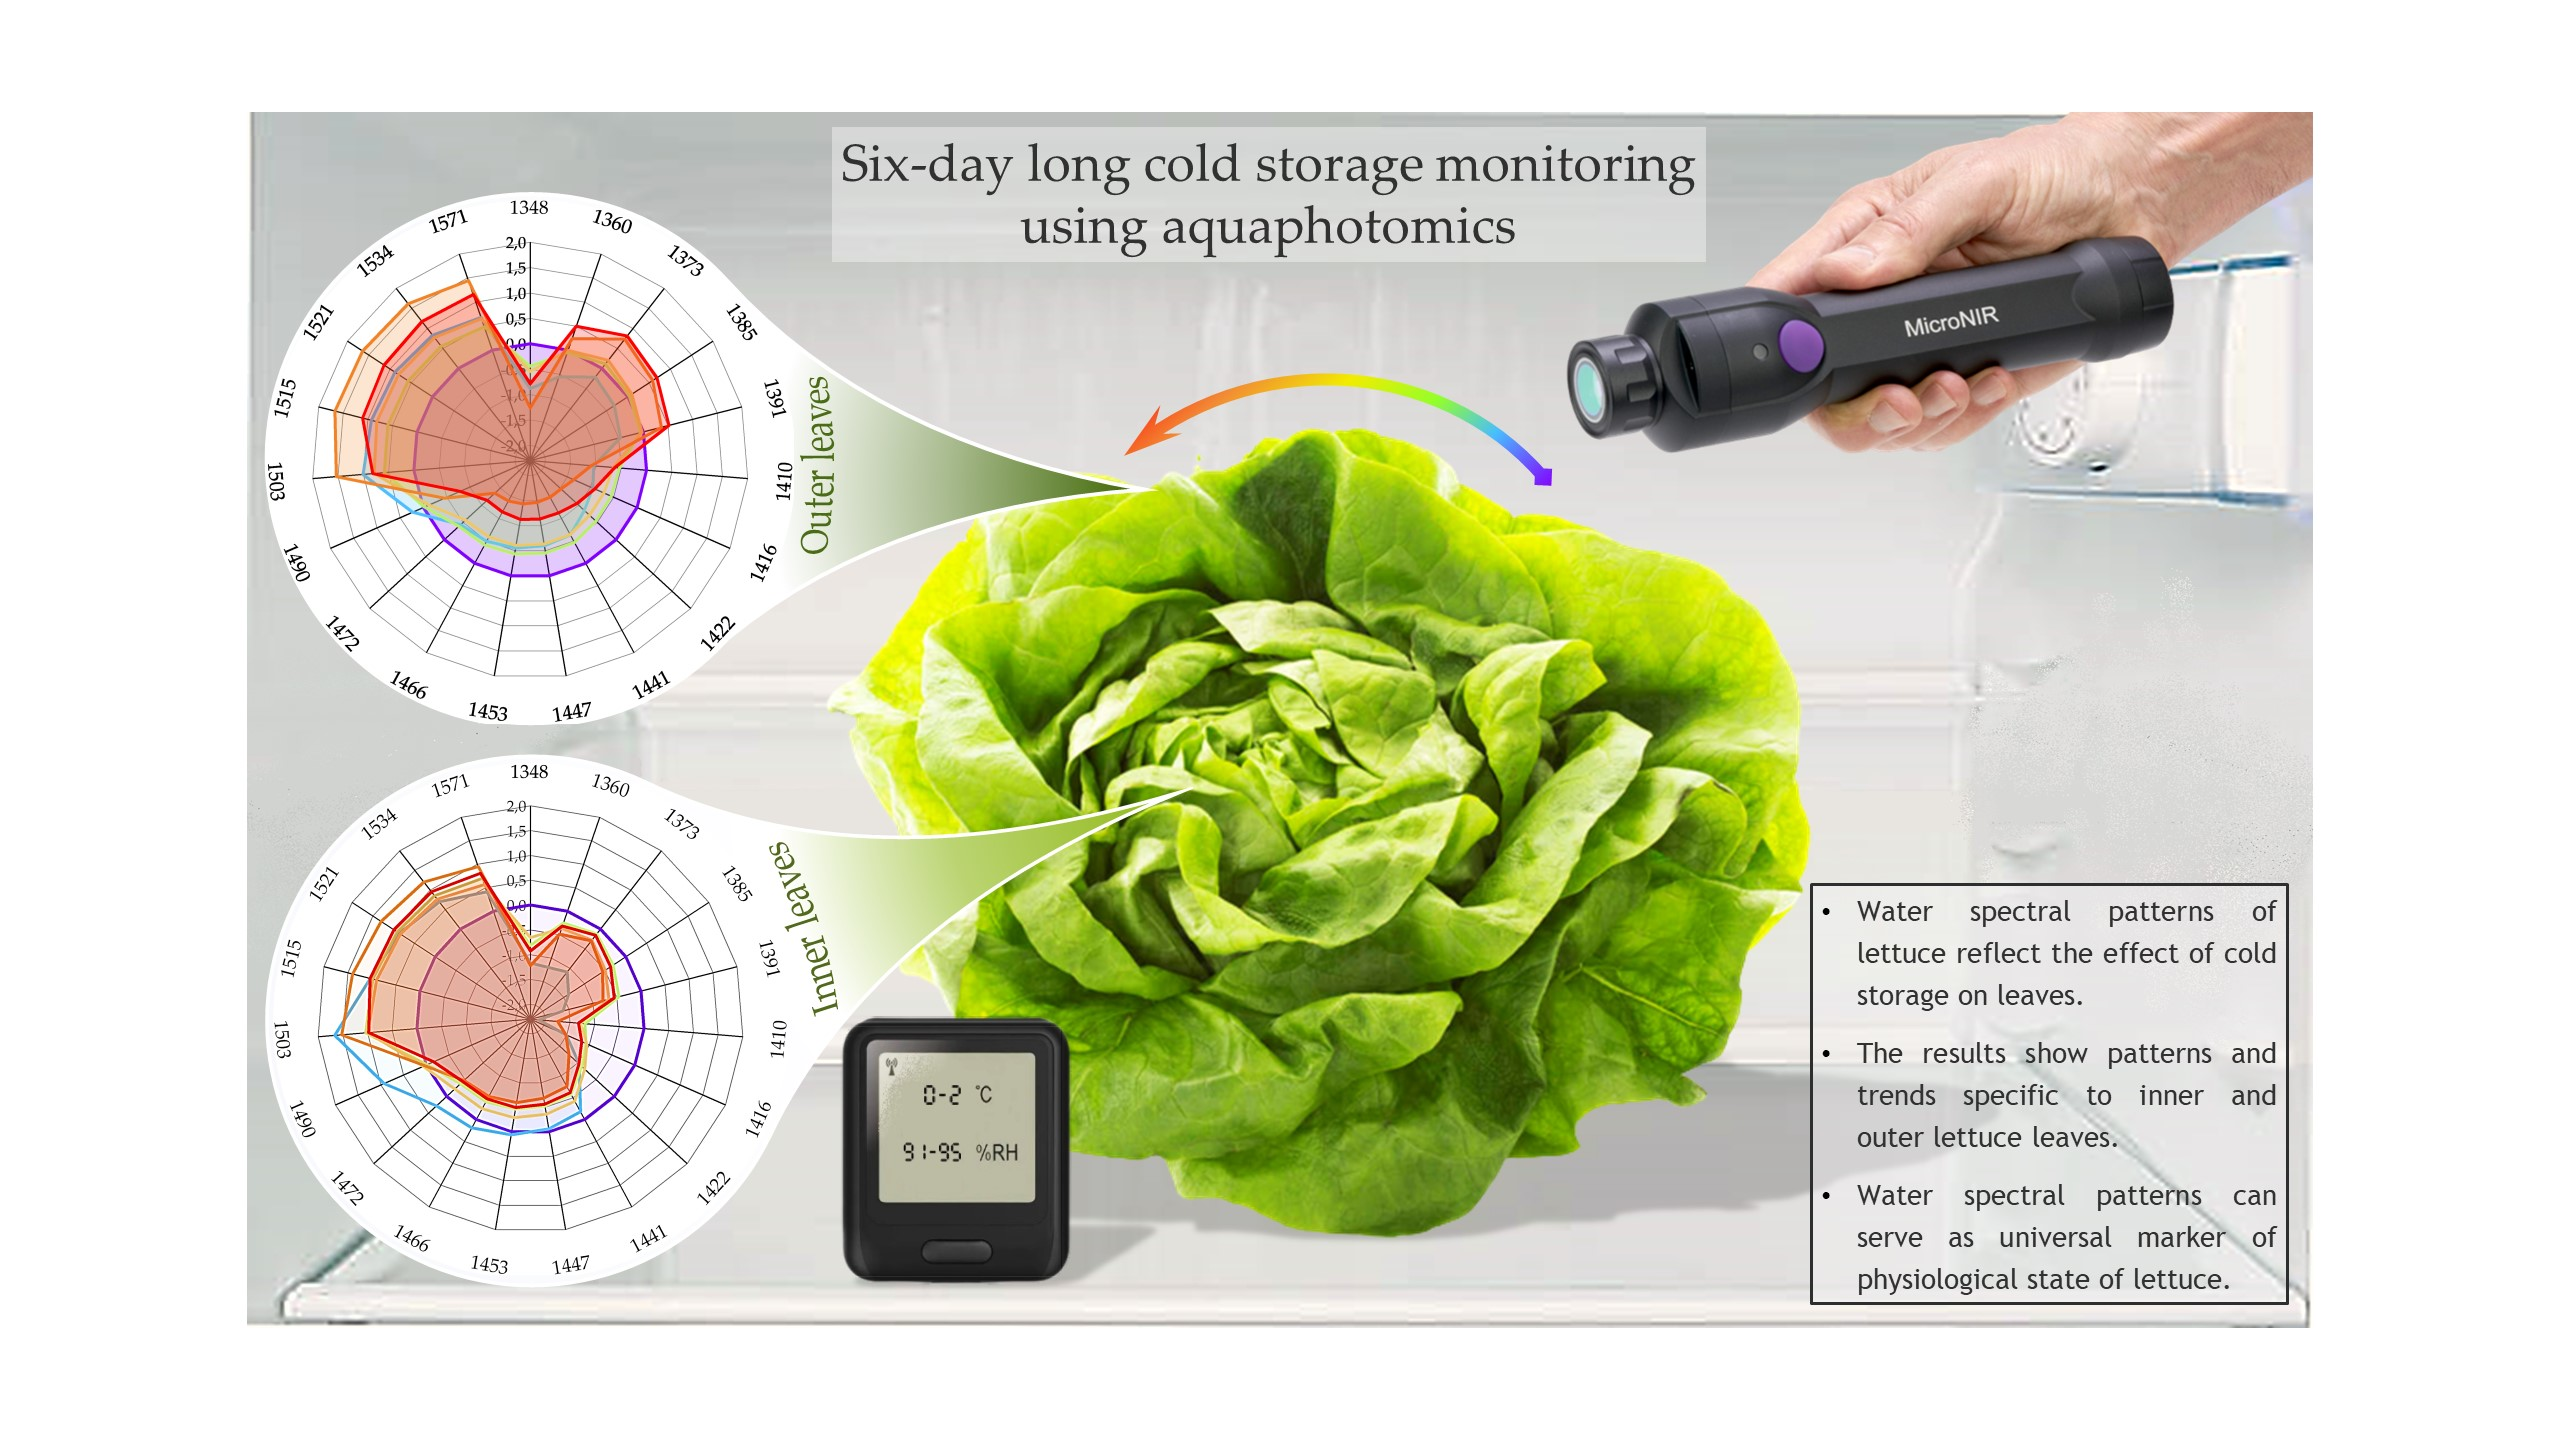
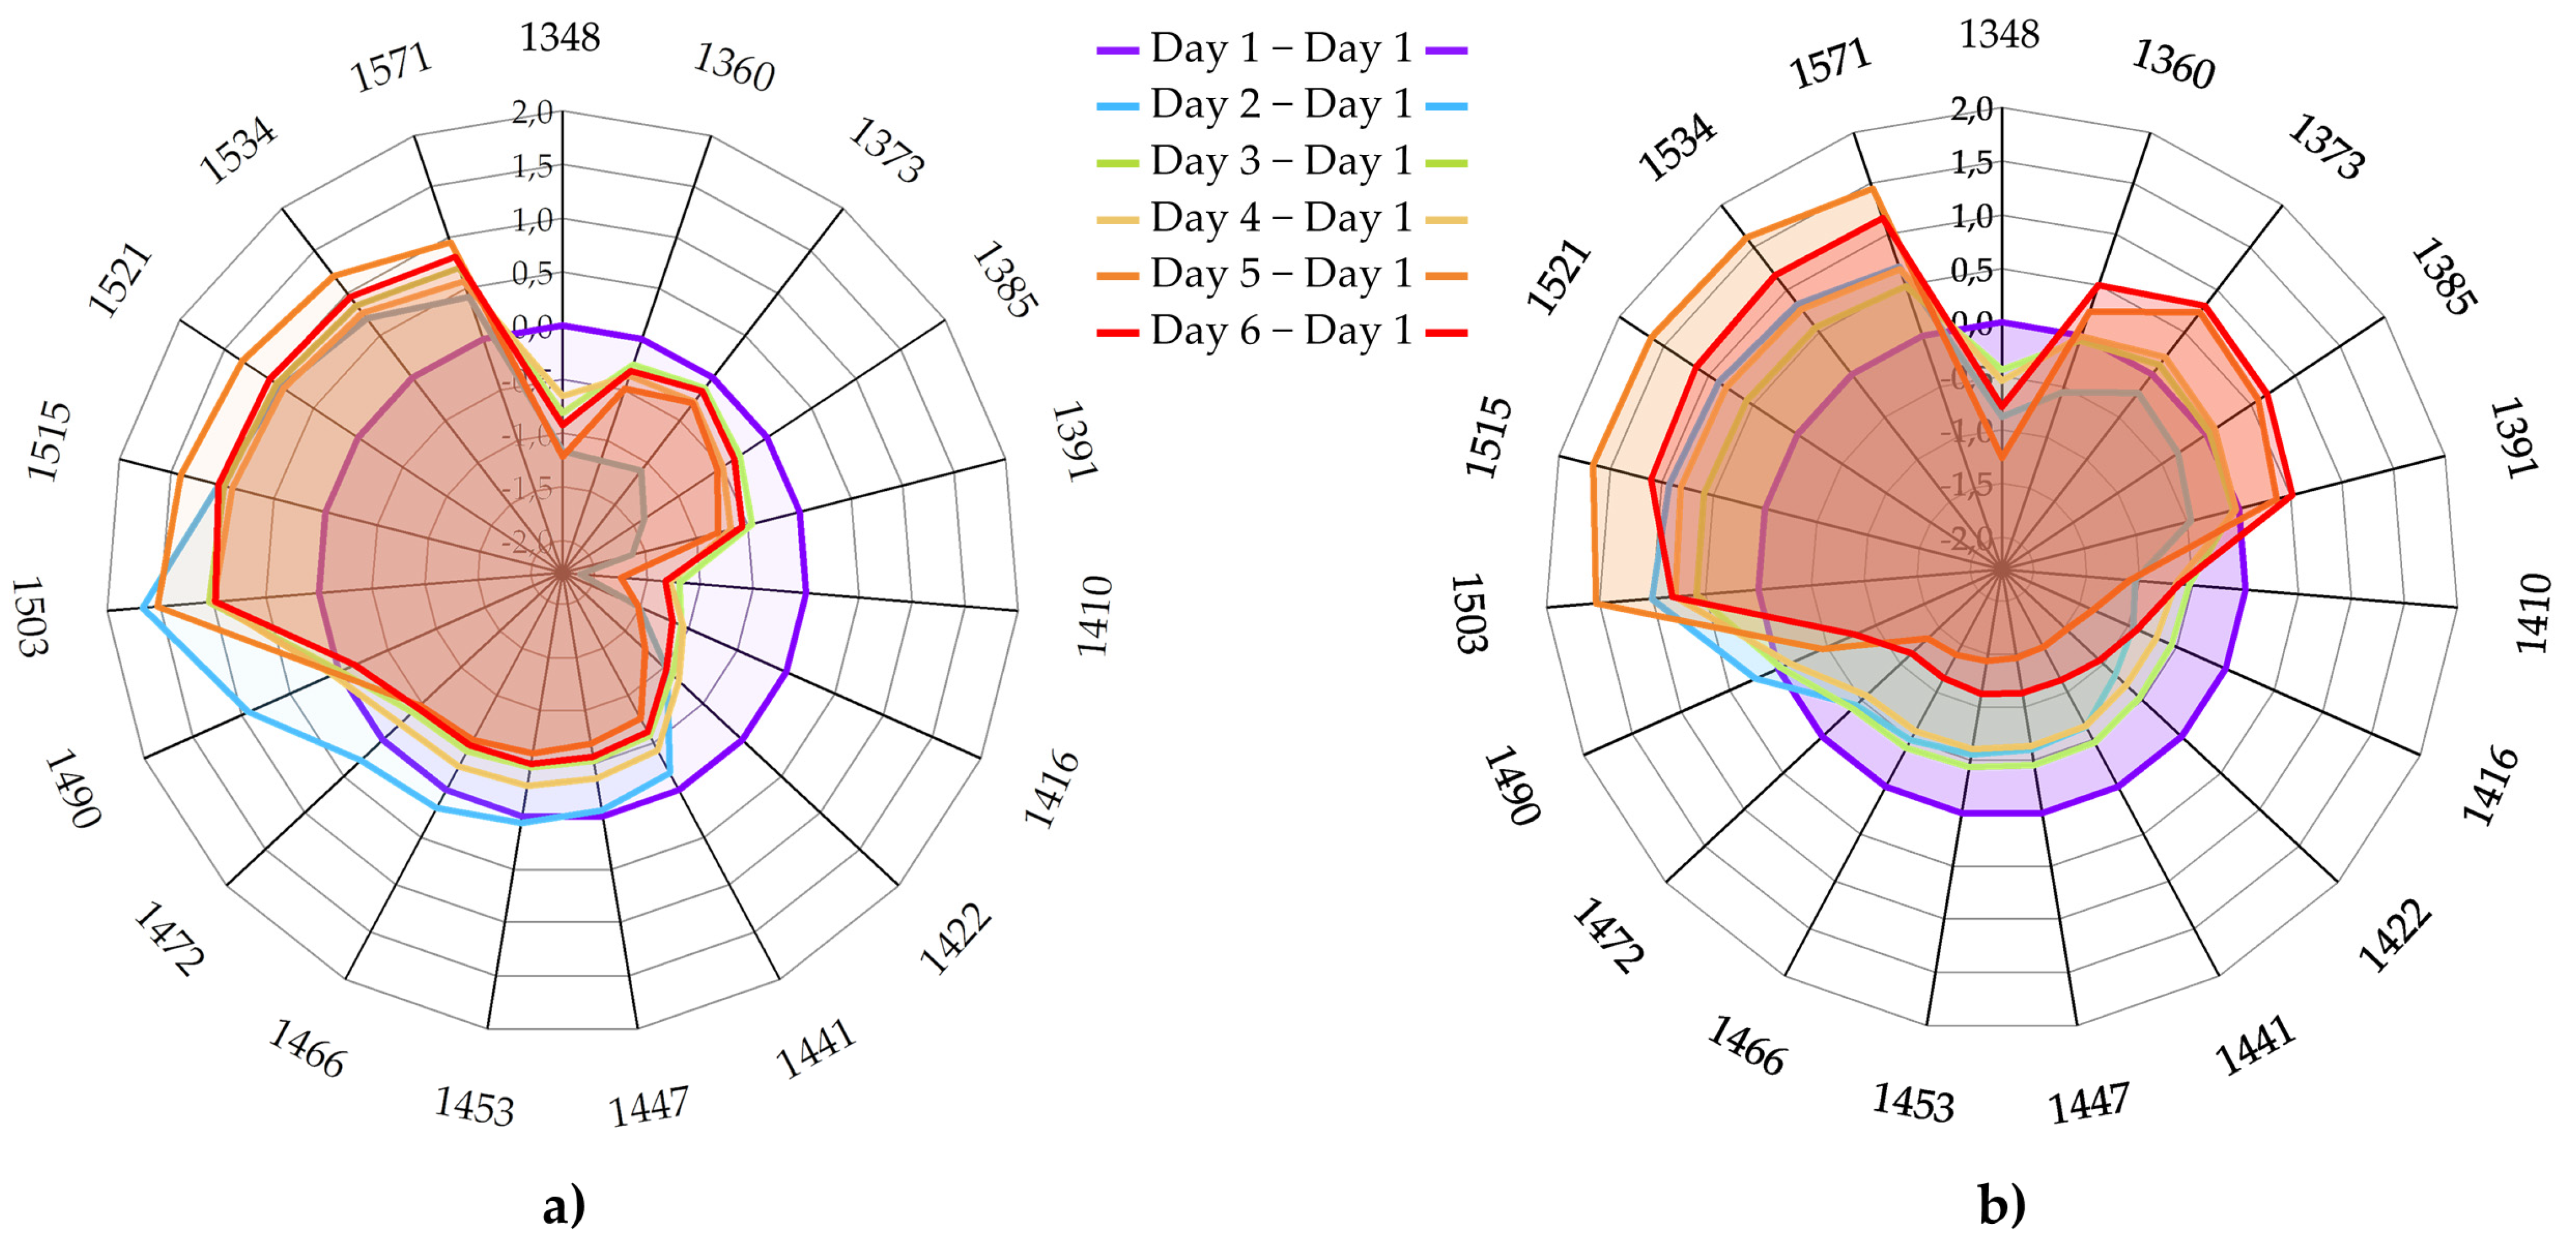
3.4.5. Aquagrams
4. Conclusions
Author Contributions
Funding
Data Availability Statement
Acknowledgments
Conflicts of Interest
References
- Kim, M.J.; Moon, Y.; Tou, J.C.; Mou, B.; Waterland, N.L. Nutritional value, bioactive compounds and health benefits of lettuce (Lactuca sativa L.). J. Food Compos. Anal. 2016, 49, 19–34. [Google Scholar] [CrossRef]
- Mou, B. Nutritional quality of lettuce. Curr. Nutr. Food Sci. 2012, 8, 177–187. [Google Scholar] [CrossRef]
- Kashiwagi, A. Japanese Fresh-Cut Vegetable Market–Recent Changes and Implications; Global Agricultural Information Network: Osaka, Japan, 2014. [Google Scholar]
- Gunes, G.; Dogu, E. Green Leafy Vegetables: Spinach and Lettuce. In Handbook of Vegetables and Vegetable Processing; Sinha, N.K., Hui, Y.H., Evranuz, E.O., Siddiq, M., Ahmed, J., Eds.; Blackwell Publishing Ltd.: Singapore, Singapore, 2011; pp. 705–717. ISBN 9780470958346. [Google Scholar]
- Ismail, H.; Mirza, B. Evaluation of analgesic, anti-inflammatory, anti-depressant and anti-coagulant properties of Lactuca sativa (CV. Grand Rapids) plant tissues and cell suspension in rats. BMC Complement. Altern. Med. 2015, 15, 1–7. [Google Scholar] [CrossRef] [PubMed] [Green Version]
- Vargas-Arcila, M.; Cartagena-Valenzuela, J.R.; Franco, G.; Correa-Londoño, G.A.; Quintero-Vásquez, L.M.; Gaviria-Montoya, C.A. Changes in the physico-chemical properties of four lettuce (Lactuca sativa L.) varieties during storage. Corpoica Cienc. Tecnol. Agropecu. 2017, 18, 257–273. [Google Scholar] [CrossRef] [Green Version]
- Varoquaux, P.; Mazollier, J.; Albagnac, G. The influence of raw material characteristics on the storage life of fresh-cut butterhead lettuce. Postharvest Biol. Technol. 1996, 9, 127–139. [Google Scholar] [CrossRef]
- Aguero, M.V.; Ponce, A.; Bevilacqua, A.; Roura, S.I. Postharvest quality losses of butter lettuce as affected by leaf age and temperature. Fresh Prod. 2011, 5, 20–25. [Google Scholar]
- Baslam, M.; Morales, F.; Garmendia, I.; Goicoechea, N. Nutritional quality of outer and inner leaves of green and red pigmented lettuces (Lactuca sativa L.) consumed as salads. Sci. Hortic. 2013, 151, 103–111. [Google Scholar] [CrossRef]
- Ozaki, Y.; McClure, W.; Christy, A. Near-Infrared Spectroscopy in Food Science and Technology; John Wiley & Sons: Hoboken, NJ, USA, 2006; ISBN 978-0-471-67201-2. [Google Scholar]
- Nicolaï, B.M.; Beullens, K.; Bobelyn, E.; Peirs, A.; Saeys, W.; Theron, K.I.; Lammertyn, J. Nondestructive measurement of fruit and vegetable quality by means of NIR spectroscopy: A review. Postharvest Biol. Technol. 2007, 46, 99–118. [Google Scholar] [CrossRef]
- Kawano, S. Past, present and future near infrared spectroscopy applications for fruit and vegetables. NIR News 2016, 27, 7–9. [Google Scholar] [CrossRef]
- Walsh, K.B.; McGlone, V.A.; Han, D.H. The uses of near infra-red spectroscopy in postharvest decision support: A review. Postharvest Biol. Technol. 2020, 163, 111139. [Google Scholar] [CrossRef]
- Wu, X.; Pan, M.; Wu, B.; Ji, G.; Sun, J. Discrimination of Lettuce Storage Time Using Near Infrared Spectroscopy Based on Generalized Fuzzy K-Harmonic Means Clustering. Spectrosc. Spectr. Anal. 2016, 36, 1721–1725. [Google Scholar] [CrossRef]
- Jacobs, B.A.J.G.; Verlinden, B.E.; Bobelyn, E.; Decombel, A.; Bleyaert, P.; Saeys, W.; Nicolai, B.M. Determining stored period of lamb’s lettuce using VIS/NIR reflectance spectroscopy. Acta Hortic. 2015, 1091, 187–194. [Google Scholar] [CrossRef]
- Jacobs, B.A.J.G.; Verlinden, B.E.; Bobelyn, E.; Decombel, A.; Bleyaert, P.; Van Lommel, J.; Vandevelde, I.; Saeys, W.; Nicolai, B.M. Determining lamb’s lettuce postharvest age based on visible/near-infrared reflectance spectroscopy. Acta Hortic. 2017, 1154, 9–16. [Google Scholar] [CrossRef]
- Jun, S.; XiaMing, J.; HanPing, M.; XiaoHong, W. Identification of lettuce storage time based on spectral preprocessing technology and PCA+SVM. J. Pure Appl. Microbiol. 2013, 7, 747–752. [Google Scholar]
- Jacobs, B.A.J.G.; Verlinden, B.E.; Bobelyn, E.; Decombel, A.; Bleyaert, P.; Van Lommel, J.; Vandevelde, I.; Saeys, W.; Nicolai, B.M. Estimation of the prior storage period of lamb’s lettuce based on visible/near infrared reflectance spectroscopy. Postharvest Biol. Technol. 2016, 113, 95–105. [Google Scholar] [CrossRef]
- Kozuki, A.; Ishida, Y.; Kakibuchi, K.; Mishima, T.; Sakurai, N.; Murata, Y.; Nakano, R.; Ushijima, K.; Kubo, Y. Effect of postharvest short-term radiation of near infrared light on transpiration of lettuce leaf. Postharvest Biol. Technol. 2015, 108, 78–85. [Google Scholar] [CrossRef]
- Nakajima, S.; Genkawa, T.; Miyamoto, A.; Ikehata, A. Useful tissues in cabbage head for freshness evaluation with visible and near infrared spectroscopy. Food Chem. 2021, 339, 128058. [Google Scholar] [CrossRef]
- Vanoli, M.; Lovati, F.; Grassi, M.; Buccheri, M.; Zanella, A.; Cattaneo, T.M.; Rizzolo, A. Water spectral pattern as a marker for studying apple sensory texture. Adv. Hortic. Sci. 2018, 32, 343–351. [Google Scholar] [CrossRef]
- Marinoni, L.; Buccheri, M.; Bianchi, G.; Cattaneo, T.M.P.P. Aquaphotomic, E-Nose and Electrolyte Leakage to Monitor Quality Changes during the Storage of Ready-to-Eat Rocket. Molecules 2022, 27, 2252. [Google Scholar] [CrossRef]
- Kovacs, Z.; Zaukuu, J.-L.Z.; Bodor, Z.; Aouadi, B.; Vitalis, F.; Gillay, Z.; Cao, T.; Németh, D.; Oshima, M.; Tsenkova, R.; et al. Aquaphotomics and its recent applications in the field of food science. In Proceedings of the Second Aquaphotomics European Conference, Budapest, Hungary, 2–3 December 2019; p. 12. [Google Scholar]
- Malegori, C.; Muncan, J.; Mustorgi, E.; Tsenkova, R.; Oliveri, P. Analysing the water spectral pattern by near-infrared spectroscopy and chemometrics as a dynamic multidimensional biomarker in preservation: Rice germ storage monitoring. Spectrochim. Acta Part A Mol. Biomol. Spectrosc. 2022, 265, 120396. [Google Scholar] [CrossRef]
- Kaur, H. Investigating Aquaphotomics for Fruit Quality Assessment. Ph.D. Thesis, The University of Waikato, Hamilton, New Zealand, 2020. [Google Scholar]
- Tsenkova, R. Aquaphotomics: Dynamic spectroscopy of aqueous and biological systems describes peculiarities of water. J. Near Infrared Spectrosc. 2009, 17, 303–313. [Google Scholar] [CrossRef]
- Tsukahara, A.; Kameoka, S.; Ito, R.; Hashimoto, A.; Kameoka, T. Evaluation of freshness of lettuce using multi-spectroscopic sensing and machine learning. J. Appl. Bot. Food Qual. 2020, 93, 136–148. [Google Scholar] [CrossRef]
- Tsenkova, R.; Munćan, J.; Pollner, B.; Kovacs, Z. Essentials of Aquaphotomics and Its Chemometrics Approaches. Front. Chem. 2018, 6, 363. [Google Scholar] [CrossRef] [PubMed]
- Ferrante, A.; Incrocci, L.; Serra, G. Colour changes of fresh-cut leafy vegetables during storage. J. Food, Agric. Environ. 2004, 2, 40–44. [Google Scholar]
- Labuza, T.P. The effect of water activity on reaction kinetics of food deterioration. Food Technol. 1980, 34, 36–59. [Google Scholar]
- Labuza, T.P.; Rahman, M.S. Water Activity and Food Preservation. In Handbook of Food Preservation; Rahman, M.S., Ed.; CRC Press: Boca Raton, FL, USA, 2007; pp. 465–494. ISBN 9780429191084. [Google Scholar]
- Labuza, T.P.; Acott, K.; Tatini, S.R.; Lee, R.Y.; Flink, J.; McCall, W. Water activity determination: A collaborative study of different methods. J. Food Sci. 1976, 41, 910–917. [Google Scholar] [CrossRef]
- Walsh, K.B.; Blasco, J.; Zude-Sasse, M.; Sun, X. Visible-NIR ‘point’ spectroscopy in postharvest fruit and vegetable assessment: The science behind three decades of commercial use. Postharvest Biol. Technol. 2020, 168, 111246. [Google Scholar] [CrossRef]
- Barnes, R.J.; Dhanoa, M.S.; Lister, S.J. Standard Normal Variate Transformation and De-trending of Near-Infrared Diffuse Reflectance Spectra. Appl. Spectrosc. 1989, 43, 772–777. [Google Scholar] [CrossRef]
- Pollner, B.; Kovacs, Z. Multivariate Data Analysis Tools for R including Aquaphotomics Methods. R package version 0.4.2. Available online: https://www.aquaphotomics.com/aquap2/ (accessed on 21 December 2022).
- Savitzky, A.; Golay, M.J.E. Smoothing and Differentiation of Data by Simplified Least Squares Procedures. Anal. Chem. 1951, 36, 1627–1639. [Google Scholar] [CrossRef]
- Wold, S.; Esbensen, K.; Geladi, P. Principal component analysis. Chemom. Intell. Lab. Syst. 1987, 2, 37–52. [Google Scholar] [CrossRef]
- Xanthopoulos, P.; Pardalos, P.M.; Trafalis, T.B. Linear discriminant analysis. In Robust Data Mining; Xanthopoulos, P., Pardalos, P.M., Trafalis, T.B., Eds.; Springer: New York, NY, USA, 2013; pp. 27–33. ISBN 978-1-4419-9878-1. [Google Scholar]
- Roessner, U.; Nahid, A.; Chapman, B.; Hunter, A.; Bellgard, M. Metabolomics–The Combination of Analytical Biochemistry, Biology, and Informatics. Compr. Biotechnol. Second Ed. 2011, 1, 447–459. [Google Scholar] [CrossRef]
- Wold, S.; Sjöström, M.; Eriksson, L. PLS-regression: A basic tool of chemometrics. Chemom. Intell. Lab. Syst. 2001, 58, 109–130. [Google Scholar] [CrossRef]
- Abdi, H. Partial least square regression (PLS-Regression). In Encyclopedia for Research Methods for the Social Sciences; Salkind, N.J., Ed.; Sage Publications, Inc.: Thousand Oaks, CA, USA, 2007; pp. 792–795. [Google Scholar]
- Williams, P.C.; Sobering, D.C. Attempts at standardization of hardness testing of wheat. II. The near-infrared reflectance method. Cereal Foods World 1986, 31, 417–420. [Google Scholar]
- Kovacs, Z.; Muncan, J.; Veleva, P.; Oshima, M.; Shigeoka, S.; Tsenkova, R. Aquaphotomics for monitoring of groundwater using short-wavelength near-infrared spectroscopy. Spectrochim. Acta Part A Mol. Biomol. Spectrosc. 2022, 279, 121378. [Google Scholar] [CrossRef] [PubMed]
- Tsenkova, R. Aquaphotomics: Water in the biological and aqueous world scrutinised with invisible light. Spectrosc. Eur. 2010, 22, 6–10. [Google Scholar]
- Xychryz, A.; Gonzales, J.Y.C.; Hilario, C.A.N.; Lopez, J.M.M.; Rulona, B.L.E.; Valencia, I.J.C.; Billones, R.K.; Loresco, P.J.; Valenzuela, I.C.; Dadios, E.P. Vision-based Canopy Area Measurements. In Proceedings of the 2018 IEEE 10th International Conference on Humanoid, Nanotechnology, Information Technology, Communication and Control, Environment and Management (HNICEM), Baguio City, Philippines, 29 November–2 December 2018; pp. 1–4. [Google Scholar]
- Takele, E. Loose-Leaf Lettuce Production: Sample Costs and Profitability Analysis, University of California, Agriculture and Natural Resources. Available online: https://anrcatalog.ucanr.edu/Details.aspx?itemNo=8031#FullDescription (accessed on 21 December 2022).
- Lee, J.-S.; Chandra, D. Effects of different packaging materials and methods on the physical, biochemical and sensory qualities of lettuce. J. Food Sci. Technol. 2018, 55, 1685–1694. [Google Scholar] [CrossRef]
- Tucci, P.; Centorotola, G.; Salini, R.; Iannetti, L.; Sperandii, A.F.; D’Alterio, N.; Migliorati, G.; Pomilio, F. Challenge test studies on Listeria monocytogenes in ready-to-eat iceberg lettuce. Food Sci. Nutr. 2019, 7, 3845–3852. [Google Scholar] [CrossRef]
- Kopsell, D.A.; Sams, C.E. Increases in Shoot Tissue Pigments, Glucosinolates, and Mineral Elements in Sprouting Broccoli after Exposure to Short-duration Blue Light from Light Emitting Diodes. J. Am. Soc. Hortic. Sci. 2013, 138, 31–37. [Google Scholar] [CrossRef] [Green Version]
- Meléndez-Martínez, A.J.; Britton, G.; Vicario, I.M.; Heredia, F.J. Relationship between the colour and the chemical structure of carotenoid pigments. Food Chem. 2007, 101, 1145–1150. [Google Scholar] [CrossRef]
- Hu, Z.-H.; Xu, Y.-N.; Gong, Y.-D.; Kuang, T.-Y. Effects of heat treatment on the protein secondary structure and pigment microenvironment in photosystem 1 complex. Photosynthetica 2005, 43, 529–534. [Google Scholar] [CrossRef]
- Grossman, A.R.; Bhaya, D.; Apt, K.E.; Kehoe, D.M. Light-harvesting complexes in oxygenic photosynthesis: Diversity, Control, and Evolution. Annu. Rev. Genet. 1995, 29, 231–288. [Google Scholar] [CrossRef] [PubMed]
- Gradinaru, C.C.; Özdemir, S.; Gülen, D.; Van Stokkum, I.H.M.; Van Grondelle, R.; Van Amerongen, H. The Flow of Excitation Energy in LHCII Monomers: Implications for the Structural Model of the Major Plant Antenna. Biophys. J. 1998, 75, 3064–3077. [Google Scholar] [CrossRef] [PubMed] [Green Version]
- Merzlyak, M.N.; Solovchenko, A.E. Photostability of pigments in ripening apple fruit: A possible photoprotective role of carotenoids during plant senescence. Plant Sci. 2002, 163, 881–888. [Google Scholar] [CrossRef]
- Merzlyak, M.N.; Gitelson, A.A.; Pogosyan, S.I.; Lekhimena, L.; Chivkunova, O.B. Light-induced pigment degradation in leaves and ripening fruits studied in situ with reflectance spectroscopy. Physiol. Plant. 1998, 104, 661–667. [Google Scholar] [CrossRef]
- Pénicaud, C.; Achir, N.; Dhuique-mayer, C.; Dornier, M.; Bohuon, P. Degradation of β -carotene during fruit and vegetable processing or storage: Reaction mechanisms and kinetic aspects: A review. Fruits 2018, 66, 417–440. [Google Scholar] [CrossRef] [Green Version]
- Liu, L.H.; Zabaras, D.; Bennett, L.E.; Aguas, P.; Woonton, B.W. Effects of UV-C, red light and sun light on the carotenoid content and physical qualities of tomatoes during post-harvest storage. Food Chem. 2009, 115, 495–500. [Google Scholar] [CrossRef]
- Bechoff, A.; Dhuique-Mayer, C.; Dornier, M.; Tomlins, K.I.; Boulanger, R.; Dufour, D.; Westby, A. Relationship between the kinetics of β-carotene degradation and formation of norisoprenoids in the storage of dried sweet potato chips. Food Chem. 2010, 121, 348–357. [Google Scholar] [CrossRef]
- Giancarla, V.; Cretescu, I.; Caprita, R.; Velicevici, G.; Dorin, C.; Buzamat, G.; Ropciuc, S. Researches Regarding the Influence of Cold Storage on the Chlorophyll Content in Lettuce. Sci Pap Anim Sci Biotechnol 2014, 47, 162–166. [Google Scholar]
- Ferreres, F.; Gil, M.I.; Castaner, M.; Tomas-Barberan, F.A. Phenolic metabolites in red pigmented lettuce (Lactuca sativa). Changes with minimal processing and cold storage. J. Agric.Food Chem 1997, 45, 4249–4254. [Google Scholar] [CrossRef]
- Spinardi, A.; Ferrante, A. Effect of storage temperature on quality changes of minimally processed baby lettuce. J. Food, Agric. Environ. 2012, 10, 38–42. [Google Scholar]
- Monreal, M.; De Ancos, B.; Pilar Cano, M. Influence of Critical Storage Temperatures on Degradative Pathways of Pigments in Green Beans (Phaseolus vulgaris Cvs. Perona and Boby). J. Agric. Food Chem. 1999, 47, 19–24. [Google Scholar] [CrossRef] [PubMed]
- Büning-Pfaue, H. Analysis of water in food by near infrared spectroscopy. Food Chem. 2003, 82, 107–115. [Google Scholar] [CrossRef]
- Agüero, M.V.; Barg, M.V.; Yommi, A.; Camelo, A.; Roura, S.I. Postharvest changes in water status and chlorophyll content of lettuce (Lactuca sativa L.) and their relationship with overall visual quality. J. Food Sci. 2008, 73, S47–S55. [Google Scholar] [CrossRef] [PubMed]
- Jones, H.G.; Tardieu, F. Modelling water relations of horticultural crops: A review. Sci. Hortic. 1998, 74, 21–46. [Google Scholar] [CrossRef]
- Seyer, J.J.; Luner, P.E.; Kemper, M.S. Application of diffuse reflectance near-infrared spectroscopy for determination of crystallinity. J. Pharm. Sci. 2000, 89, 1305–1316. [Google Scholar] [CrossRef] [PubMed]
- Sagawa, N.; Shikata, T. Hydration Behavior of Poly(ethylene oxide)s in Aqueous Solution As Studied by Near-Infrared Spectroscopic Techniques. J. Phys. Chem. B 2013, 117, 10883–10888. [Google Scholar] [CrossRef]
- Awatani, T.; Midorikawa, H.; Kojima, N.; Ye, J.; Marcott, C. Morphology of water transport channels and hydrophobic clusters in Nafion from high spatial resolution AFM-IR spectroscopy and imaging. Electrochem. Commun. 2013, 30, 5–8. [Google Scholar] [CrossRef]
- Bázár, G.; Kovacs, Z.; Tanaka, M.; Furukawa, A.; Nagai, A.; Osawa, M.; Itakura, Y.; Sugiyama, H.; Tsenkova, R. Water revealed as molecular mirror when measuring low concentrations of sugar with near infrared light. Anal. Chim. Acta 2015, 896, 52–62. [Google Scholar] [CrossRef]
- Dopfer, O.; Roth, D.; Maier, J.P. Microsolvation of the water cation in neon: Infrared spectra and potential energy surface of the H2O+-Ne open-shell ionic complex. J. Chem. Phys. 2001, 114, 7081–7093. [Google Scholar] [CrossRef]
- Musto, P.; Galizia, M.; Pannico, M.; Scherillo, G.; Mensitieri, G. Time-resolved Fourier transform infrared spectroscopy, gravimetry, and thermodynamic modeling for a molecular level description of water sorption in poly(ε-caprolactone). J. Phys. Chem. B 2014, 118, 7414–7429. [Google Scholar] [CrossRef] [Green Version]
- Schwanninger, M.; Rodrigues, J.C.; Fackler, K. A Review of Band Assignments in near Infrared Spectra of Wood and Wood Components. J. Near Infrared Spectrosc. 2011, 19, 287–308. [Google Scholar] [CrossRef]
- Kakuda, H.; Okada, T.; Hasegawa, T. Temperature-Induced Molecular Structural Changes of Linear Poly(ethylene imine) in Water Studied by Mid-Infrared and Near-Infrared Spectroscopies. J. Phys. Chem. B 2009, 113, 13910–13916. [Google Scholar] [CrossRef]
- Wenz, J.J. Influence of steroids on hydrogen bonds in membranes assessed by near infrared spectroscopy. Biochim. Biophys. Acta -Biomembr. 2021, 1863, 183553. [Google Scholar] [CrossRef] [PubMed]
- Mastrapa, R.M.E.; Moore, M.H.; Hudson, R.L.; Ferrante, R.L.; Brown, R.H.; Mastrapa, R.M.E.; Moore, M.H.; Hudson, R.L.; Ferrante, R.L.; Brown, R.H. Proton Irradiation of Crystalline Water Ice: Timescales for Amorphization in the Kuiper Belt. DPS 2005, 37, 10. [Google Scholar]
- Hu, Y.; Macfhionnghaile, P.; Caron, V.; Tajber, L.; Healy, A.M.; Erxleben, A.; Mcardle, P. Formation, Physical Stability, and Quantification of Process-Induced Disorder in Cryomilled Samples of a Model Polymorphic Drug. J. Pharm. Sci. 2013, 102, 93–103. [Google Scholar] [CrossRef] [PubMed]
- Hassanzadeh, A.; Murphy, S.P.; Pethybridge, S.J.; van Aardt, J. Growth Stage Classification and Harvest Scheduling of Snap Bean Using Hyperspectral Sensing: A Greenhouse Study. Remote Sens. 2020, 12, 3809. [Google Scholar] [CrossRef]
- Fujimoto, T.; Yamamoto, H.; Tsuchikawa, S. Estimation of wood stiffness and strength properties of hybrid larch by near-infrared spectroscopy. Appl. Spectrosc. 2007, 61, 882–888. [Google Scholar] [CrossRef]
- Tsuchikawa, S.; Hirashima, Y.; Sasaki, Y.; Ando, K. Near-infrared spectroscopic study of the physical and mechanical properties of wood with meso- and micro-scale anatomical observation. Appl. Spectrosc. 2005, 59, 86–93. [Google Scholar] [CrossRef]
- Headrick, J.M.; Diken, E.G.; Walters, R.S.; Hammer, N.I.; Christie, R.A.; Cui, J.; Myshakin, E.M.; Duncan, M.A.; Johnson, M.A.; Jordan, K.D. Spectral signatures of hydrated proton vibrations in water clusters. Science 2005, 308, 1765–1769. [Google Scholar] [CrossRef]
- Mizuse, K.; Fujii, A. Tuning of the Internal Energy and Isomer Distribution in Small Protonated Water Clusters H + (H 2 O) 4–8: An Application of the Inert Gas Messenger Technique. J. Phys. Chem. A 2012, 116, 4868–4877. [Google Scholar] [CrossRef]
- Bázár, G.; Romvári, R.; Szabó, A.; Somogyi, T.; Éles, V.; Tsenkova, R. NIR detection of honey adulteration reveals differences in water spectral pattern. Food Chem. 2016, 194, 873–880. [Google Scholar] [CrossRef] [PubMed]
- Kojić, D.; Tsenkova, R.; Tomobe, K.; Yasuoka, K.; Yasui, M. Water confined in the local field of ions. Chem. Phys. Chem. 2014, 15, 4077–4086. [Google Scholar] [CrossRef] [PubMed]
- Sun, P.; Grignetti, A.; Liu, S.; Casacchia, R.; Salvatori, R.; Pietrini, F.; Loreto, F.; Centritto, M. Associated changes in physiological parameters and spectral reflectance indices in olive (Olea europaea L.) leaves in response to different levels of water stress. Int. J. Remote Sens. 2008, 29, 1725–1743. [Google Scholar] [CrossRef]
- Gowen, A.A.; Tsenkova, R.; Esquerre, C.; Downey, G.; O’Donnell, C.P. Use of near infrared hyperspectral imaging to identify water matrix co-ordinates in mushrooms (Agaricus bisporus) subjected to mechanical vibration. J. Near Infrared Spectrosc. 2009, 17, 363–371. [Google Scholar] [CrossRef]
- Williams, P. Influence of water on prediction of composition and quality factors: The Aquaphotomics of low moisture agricultural materials. J. Near Infrared Spectrosc. 2009, 17, 315–328. [Google Scholar] [CrossRef]
- Fujimoto, T.; Kobori, H.; Tsuchikawa, S. Prediction of wood density independently of moisture conditions using near infrared spectroscopy. J. Near Infrared Spectrosc. 2012, 20, 353–359. [Google Scholar] [CrossRef]
- Rambo, M.K.D.; Ferreira, M.M.C. Determination of cellulose crystallinity of banana residues using near infrared spectroscopy and multivariate analysis. J. Braz. Chem. Soc. 2015, 26, 1491–1499. [Google Scholar] [CrossRef]
- Tsuchikawa, S.; Murata, A.; Kohara, M.; Mitsui, K. Spectroscopic monitoring of biomass modification by light-irradiation and heat treatment. J. Near Infrared Spectrosc. 2003, 11, 401–405. [Google Scholar] [CrossRef]
- Wu, Y.Q.; Tsuchikawa, S.; Hayashi, K. Application of near infrared spectroscopy to assessments of colour change in plantation-grown Eucalyptus grandis wood subjected to heat and steaming treatments. J. Near Infrared Spectrosc. 2005, 13, 371–376. [Google Scholar] [CrossRef]
- Kuroki, S.; Tsenkova, R.; Moyankova, D.P.; Muncan, J.; Morita, H.; Atanassova, S.; Djilianov, D. Water molecular structure underpins extreme desiccation tolerance of the resurrection plant Haberlea rhodopensis. Sci. Rep. 2019, 9, 3049. [Google Scholar] [CrossRef] [Green Version]
- Malegori, C.; Buratti, S.; Benedetti, S.; Oliveri, P.; Ratti, S.; Cappa, C.; Lucisano, M. A modified mid-level data fusion approach on electronic nose and FT-NIR data for evaluating the effect of different storage conditions on rice germ shelf life. Talanta 2020, 206, 120208. [Google Scholar] [CrossRef]
- Jiang, J.-C.; Wang, Y.-S.; Chang, H.-C.; Lin, S.H.; Lee, Y.T.; Niedner-Schatteburg, G.; Chang, H.-C. Infrared spectra of H+ (H2O) 5-8 clusters: Evidence for symmetric proton hydration. J. Am. Chem. Soc. 2000, 122, 1398–1410. [Google Scholar] [CrossRef]
- Douberly, G.E.; Walters, R.S.; Cui, J.; Jordan, K.D.; Duncan, M.A. Infrared spectroscopy of small protonated water clusters, H +(H2O)n (n = 2-5): Isomers, argon tagging, and deuteration. J. Phys. Chem. A 2010, 114, 4570–4579. [Google Scholar] [CrossRef] [PubMed]
- Czarnecki, M.A.; Morisawa, Y.; Katsumoto, Y.; Takaya, T.; Singh, S.; Sato, H.; Ozaki, Y. Solvent effect on the competition between weak and strong interactions in phenol solutions studied by near-infrared spectroscopy and DFT calculations. Phys. Chem. Chem. Phys. 2021, 23, 19188–19194. [Google Scholar] [CrossRef]
- Gotić, M.; Musić, S. Mössbauer, FT-IR and FE SEM investigation of iron oxides precipitated from FeSO4 solutions. J. Mol. Struct. 2007, 834–836, 445–453. [Google Scholar] [CrossRef]
- Arefi, A.; Sturm, B.; von Gersdorff, G.; Nasirahmadi, A.; Hensel, O. Vis-NIR hyperspectral imaging along with Gaussian process regression to monitor quality attributes of apple slices during drying. LWT 2021, 152, 112297. [Google Scholar] [CrossRef]
- Moscetti, R.; Raponi, F.; Ferri, S.; Colantoni, A.; Monarca, D.; Massantini, R. Real-time monitoring of organic apple (var. Gala) during hot-air drying using near-infrared spectroscopy. J. Food Eng. 2018, 222, 139–150. [Google Scholar] [CrossRef]
- Muncan, J.; Tsenkova, R. Aquaphotomics-From Innovative Knowledge to Integrative Platform in Science and Technology. Molecules 2019, 24, 2742. [Google Scholar] [CrossRef] [Green Version]
- Tham, V.T.H.; Inagaki, T.; Tsuchikawa, S. A novel combined application of capacitive method and near-infrared spectroscopy for predicting the density and moisture content of solid wood. Wood Sci. Technol. 2018, 52, 115–129. [Google Scholar] [CrossRef]
- Hong, B.H.; Rubenthaler, G.L.; Allan, R.E. Wheat pentosans. II. Estimating kernel hardness and pentosans in water extracts by near-infrared reflectance. Cereal Chem. 1989, 66, 374–377. [Google Scholar]
- Gao, M.; Guo, W.; Huang, X.; Du, R.; Zhu, X. Effect of pressing and impacting bruises on optical properties of kiwifruit flesh. Postharvest Biol. Technol. 2021, 172, 111385. [Google Scholar] [CrossRef]
- Cheng, J.; Guo, W.; Du, R.; Zhou, Y. Optical properties of different kiwifruit cultivars (Actinidia deliciosa and Actinidia chinensis) and their correlation with internal quality. Infrared Phys. Technol. 2022, 123, 104113. [Google Scholar] [CrossRef]
- Esquerre, C.; Gowen, A.; Tsenkova, R.; O’Donnell, C.P.; Downey, G. Identification of water matrix coefficients in mushrooms (Agaricus bisporus) using robust ensemble of Monte Carlo uninformative variable eliminarion. In Proceedings of the Near Infrared Spectroscopy: Proceedings of the 14th International Conference, Bangkok, Thailand, November 7-16, 2009; pp. 163–164.
- Cho, J.S.; Bae, H.J.; Cho, B.K.; Moon, K.D. Qualitative properties of roasting defect beans and development of its classification methods by hyperspectral imaging technology. Food Chem. 2017, 220, 505–509. [Google Scholar] [CrossRef] [PubMed]
- Hayati, R.; Munawar, A.A.; Marliah, A. Rapid quantification of rice (Oryza sativa) qualities based on adaptive near infrared spectroscopy. IOP Conf. Ser. Earth Environ. Sci. 2021, 922, 1–8. [Google Scholar] [CrossRef]
- Ma, L.; Cui, X.; Cai, W.; Shao, X. Understanding the function of water during the gelation of globular proteins by temperature-dependent near infrared spectroscopy. Phys. Chem. Chem. Phys. 2018, 20, 20132–20140. [Google Scholar] [CrossRef]
- Tsenkova, R.N.; Iordanova, I.K.; Toyoda, K.; Brown, D.R. Prion protein fate governed by metal binding. Biochem. Biophys. Res. Commun. 2004, 325, 1005–1012. [Google Scholar] [CrossRef]
- Pastori, G.M.; Kiddle, G.; Antoniw, J.; Bernard, S.; Veljovic-Jovanovic, S.; Verrier, P.J.; Noctor, G.; Foyer, C.H. Leaf Vitamin C Contents Modulate Plant Defense Transcripts and Regulate Genes That Control Development through Hormone Signaling. Plant Cell 2003, 15, 939. [Google Scholar] [CrossRef] [Green Version]
- Robertson, W.H.; Diken, E.G.; Price, E.A.; Shin, J.-W.; Johnson, M.A. Spectroscopic determination of the OH− solvation shell in the OH−·(H2O) n clusters. Science 2003, 299, 1367–1372. [Google Scholar] [CrossRef]
- Xing, J.; De Baerdemaeker, J. Fresh bruise detection by predicting softening index of apple tissue using VIS/NIR spectroscopy. Postharvest Biol. Technol. 2007, 45, 176–183. [Google Scholar] [CrossRef]
- Pu, Y.; Ragauskas, A.J.; Lucia, L.A.; Naithani, V.; Jameel, H. Near-Infrared Spectroscopy and Chemometric Analysis for Determining Oxygen Delignification Yield. J. Wood Chem. Technol. 2008, 28, 122–136. [Google Scholar] [CrossRef]
- Awais, M.; Altgen, M.; Mäkelä, M.; Altgen, D.; Rautkari, L. Hyperspectral Near-Infrared Image Assessment of Surface-Acetylated Solid Wood. ACS Appl. Bio Mater. 2020, 3, 5223–5232. [Google Scholar] [CrossRef]
- Kandpal, L.M.; Lohumi, S.; Kim, M.S.; Kang, J.S.; Cho, B.K. Near-infrared hyperspectral imaging system coupled with multivariate methods to predict viability and vigor in muskmelon seeds. Sensors Actuators B Chem. 2016, 229, 534–544. [Google Scholar] [CrossRef]
- Tigabu, M.; Odén, P.C. Discrimination of viable and empty seeds of Pinus patula Schiede & Deppe with near-infrared spectroscopy. New For. 2003, 25, 163–176. [Google Scholar] [CrossRef]
- Šakota Rosić, J.; Munćan, J.; Mileusnić, I.; Kosić, B.; Matija, L. Detection of protein deposits using NIR spectroscopy. Soft Mater. 2016, 14, 264–271. [Google Scholar] [CrossRef]
- Munćan, J.; Rosić, J.; Mileusnić, I.; Matović, V.; Matija, L.; Tsenkova, R. The structure of water in soft contact lenses: Near infrared spectroscopy and Aquaphotomics study. In Proceedings of the 18th International Conference on Near Infrared Spectroscopy, Copenhagen, Denmark, 11–15 June 2017; Engelsen, S.B., Sorensen, K.M., van den Berg, F., Eds.; IM Publications Open: Chichester, UK, 2019; pp. 99–104. [Google Scholar]
- Cattaneo, T.M.P.; Cutini, M.; Cammerata, A.; Stellari, A.; Marinoni, L.; Bisaglia, C.; Brambilla, M. Near infrared spectroscopic and aquaphotomic evaluation of the efficiency of solar dehydration processes in pineapple slices. J. Near Infrared Spectrosc. 2021, 29, 352–358. [Google Scholar] [CrossRef]
- Barzaghi, S.; Gobbi, S.; Torreggiani, D.; Tornielli, C.; Giangiacomo, R. Near infrared spectroscopy for the control of osmo-air dehydrated apple rings. J. Near Infrared Spectrosc. 2008, 16, 143–149. [Google Scholar] [CrossRef]
- Sugiyama, J.; Persson, J.; Chanzy, H. Combined Infrared and Electron Diffraction Study of the Polymorphism of Native Celluloses. Macromolecules 1991, 24, 2461–2466. [Google Scholar] [CrossRef]
- Popescu, C.M.; Popescu, M.C.; Vasile, C. Structural analysis of photodegraded lime wood by means of FT-IR and 2D IR correlation spectroscopy. Int. J. Biol. Macromol. 2011, 48, 667–675. [Google Scholar] [CrossRef]
- Poletto, M.; Zattera, A.J.; Santana, R.M.C. Structural differences between wood species: Evidence from chemical composition, FTIR spectroscopy, and thermogravimetric analysis. J. Appl. Polym. Sci. 2012, 126, E337–E344. [Google Scholar] [CrossRef]
- Osborne, B.G. Near infrared spectroscopic studies of starch and water in some processed cereal foods. J. Near Infrared Spectrosc. 1996, 4, 195–200. [Google Scholar] [CrossRef]
- Via, B.K.; Jiang, W. Nonlinear multivariate modeling of strand mechanical properties with near-infrared spectroscopy. For. Chron. 2013, 89, 621–630. [Google Scholar] [CrossRef] [Green Version]
- Muncan, J.; Aouadi, B.; Tsenkova, R. Potential of Aquaphotomics for Determination of Quality of Natural Foods. In Sustainable and Functional Foods from Plants; Goyal, M.R., Kovacs, Z., Nath, A., Eds.; Taylor and Francis: Abingdon, UK, 2023; p. 470. ISBN 9781774914540. [Google Scholar]
- Nugraha, D.T.; Zaukuu, J.L.Z.; Bósquez, J.P.A.; Bodor, Z.; Vitalis, F.; Kovacs, Z. Near-Infrared Spectroscopy and Aquaphotomics for Monitoring Mung Bean (Vigna radiata) Sprout Growth and Validation of Ascorbic Acid Content. Sensors 2021, 21, 611. [Google Scholar] [CrossRef]
- Cattaneo, T.M.P.; Vanoli, M.; Grassi, M.; Rizzolo, A.; Barzaghi, S. The aquaphotomics approach as a tool for studying the influence of food coating materials on cheese and winter melon samples. J. Near Infrared Spectrosc. 2016, 24, 381–390. [Google Scholar] [CrossRef]


| Accuracy | (%) | Day 1 | Day 2 | Day 3 | Day 4 | Day 5 | Day 6 | Correct Classification |
|---|---|---|---|---|---|---|---|---|
| Calibration | Day 1 | 100 | 0 | 0 | 0 | 0 | 0 | 99.89% |
| Day 2 | 0 | 99.33 | 0 | 0 | 0 | 0 | ||
| Day 3 | 0 | 0 | 100 | 0 | 0 | 0 | ||
| Day 4 | 0 | 0 | 0 | 100 | 0 | 0 | ||
| Day 5 | 0 | 0 | 0 | 0 | 100 | 0 | ||
| Day 6 | 0 | 0.67 | 0 | 0 | 0 | 100 | ||
| Validation | Day 1 | 100 | 0 | 0 | 1.33 | 0 | 0 | 99.56% |
| Day 2 | 0 | 93.33 | 0 | 0 | 2.67 | 2.67 | ||
| Day 3 | 0 | 0 | 100 | 0 | 0 | 0 | ||
| Day 4 | 0 | 1.33 | 0 | 98.67 | 0 | 0 | ||
| Day 5 | 0 | 0 | 0 | 0 | 97.33 | 1.33 | ||
| Day 6 | 0 | 5.33 | 0 | 0 | 0 | 96 |
| Accuracy | (%) | Day 1 | Day 2 | Day 3 | Day 4 | Day 5 | Day 6 | Correct Classification |
|---|---|---|---|---|---|---|---|---|
| Calibration | Day 1 | 98.67 | 0 | 0 | 0 | 0 | 0 | 99.78% |
| Day 2 | 0 | 100 | 0 | 0 | 0 | 0 | ||
| Day 3 | 1.33 | 0 | 100 | 0 | 0 | 0 | ||
| Day 4 | 0 | 0 | 0 | 100 | 0 | 0 | ||
| Day 5 | 0 | 0 | 0 | 0 | 100 | 0 | ||
| Day 6 | 0 | 0 | 0 | 0 | 0 | 100 | ||
| Validation | Day 1 | 93.33 | 0 | 0 | 0 | 0 | 0 | 96.67% |
| Day 2 | 1.33 | 89.33 | 0 | 0 | 0 | 1.33 | ||
| Day 3 | 5.33 | 0 | 100 | 0 | 0 | 0 | ||
| Day 4 | 0 | 0 | 0 | 100 | 0 | 0 | ||
| Day 5 | 0 | 5.33 | 0 | 0 | 98.67 | 0 | ||
| Day 6 | 0 | 5.33 | 0 | 0 | 1.33 | 98.67 |
| WAMACs | C1 | C2 | C3 | C4 | C5 | C6 | C7 | C8 | C9 | C10 | C11 | C12 | ||||||
|---|---|---|---|---|---|---|---|---|---|---|---|---|---|---|---|---|---|---|
| Wavelength Range | 1310–1334 | 1336–1348 | 1350–1358 | 1360–1366 | 1370–1376 | 1380–1388 | 1390–1396 | 1398–1418 | 1421–1430 | 1432–1444 | 1448–1454 | 1458–1468 | 1472–1482 | 1482–1496 | 1506–1516 | 1518–1538 | 1540–1559 | 1560–1590 |
| Difference spectra | ||||||||||||||||||
| Day 2–Day 1 | 1391 | 1453 | 1472 | 1515 | 1534 | 1565 | ||||||||||||
| Day 3–Day 1 | 1360 | 1422 | 1453 | 1534 | 1565 | |||||||||||||
| Day 4–Day 1 | 1354 | 1416 | 1453 | 1472 | 1534 | 1565 | ||||||||||||
| Day 5–Day 1 | 1360 | 1416 | 1453 | 1534 | 1565 | |||||||||||||
| Day 6–Day 1 | 1360 | 1416 | 1453 | 1534 | 1565 | |||||||||||||
| PCA loadings | ||||||||||||||||||
| PC 1 | 1373 | |||||||||||||||||
| PC 2 | 1447 | |||||||||||||||||
| PC 3 | 1385 | 1453 | ||||||||||||||||
| PC 4 | 1311 | 1391 | 1447 | 1472 | 1490 | 1521 | 1546 | 1571, 1589 | ||||||||||
| PC 5 | 1336, 1348 | 1373 | 1397 | 1428 | 1459 | 1478 | 1490 | 1521, 1534 | 1577 | |||||||||
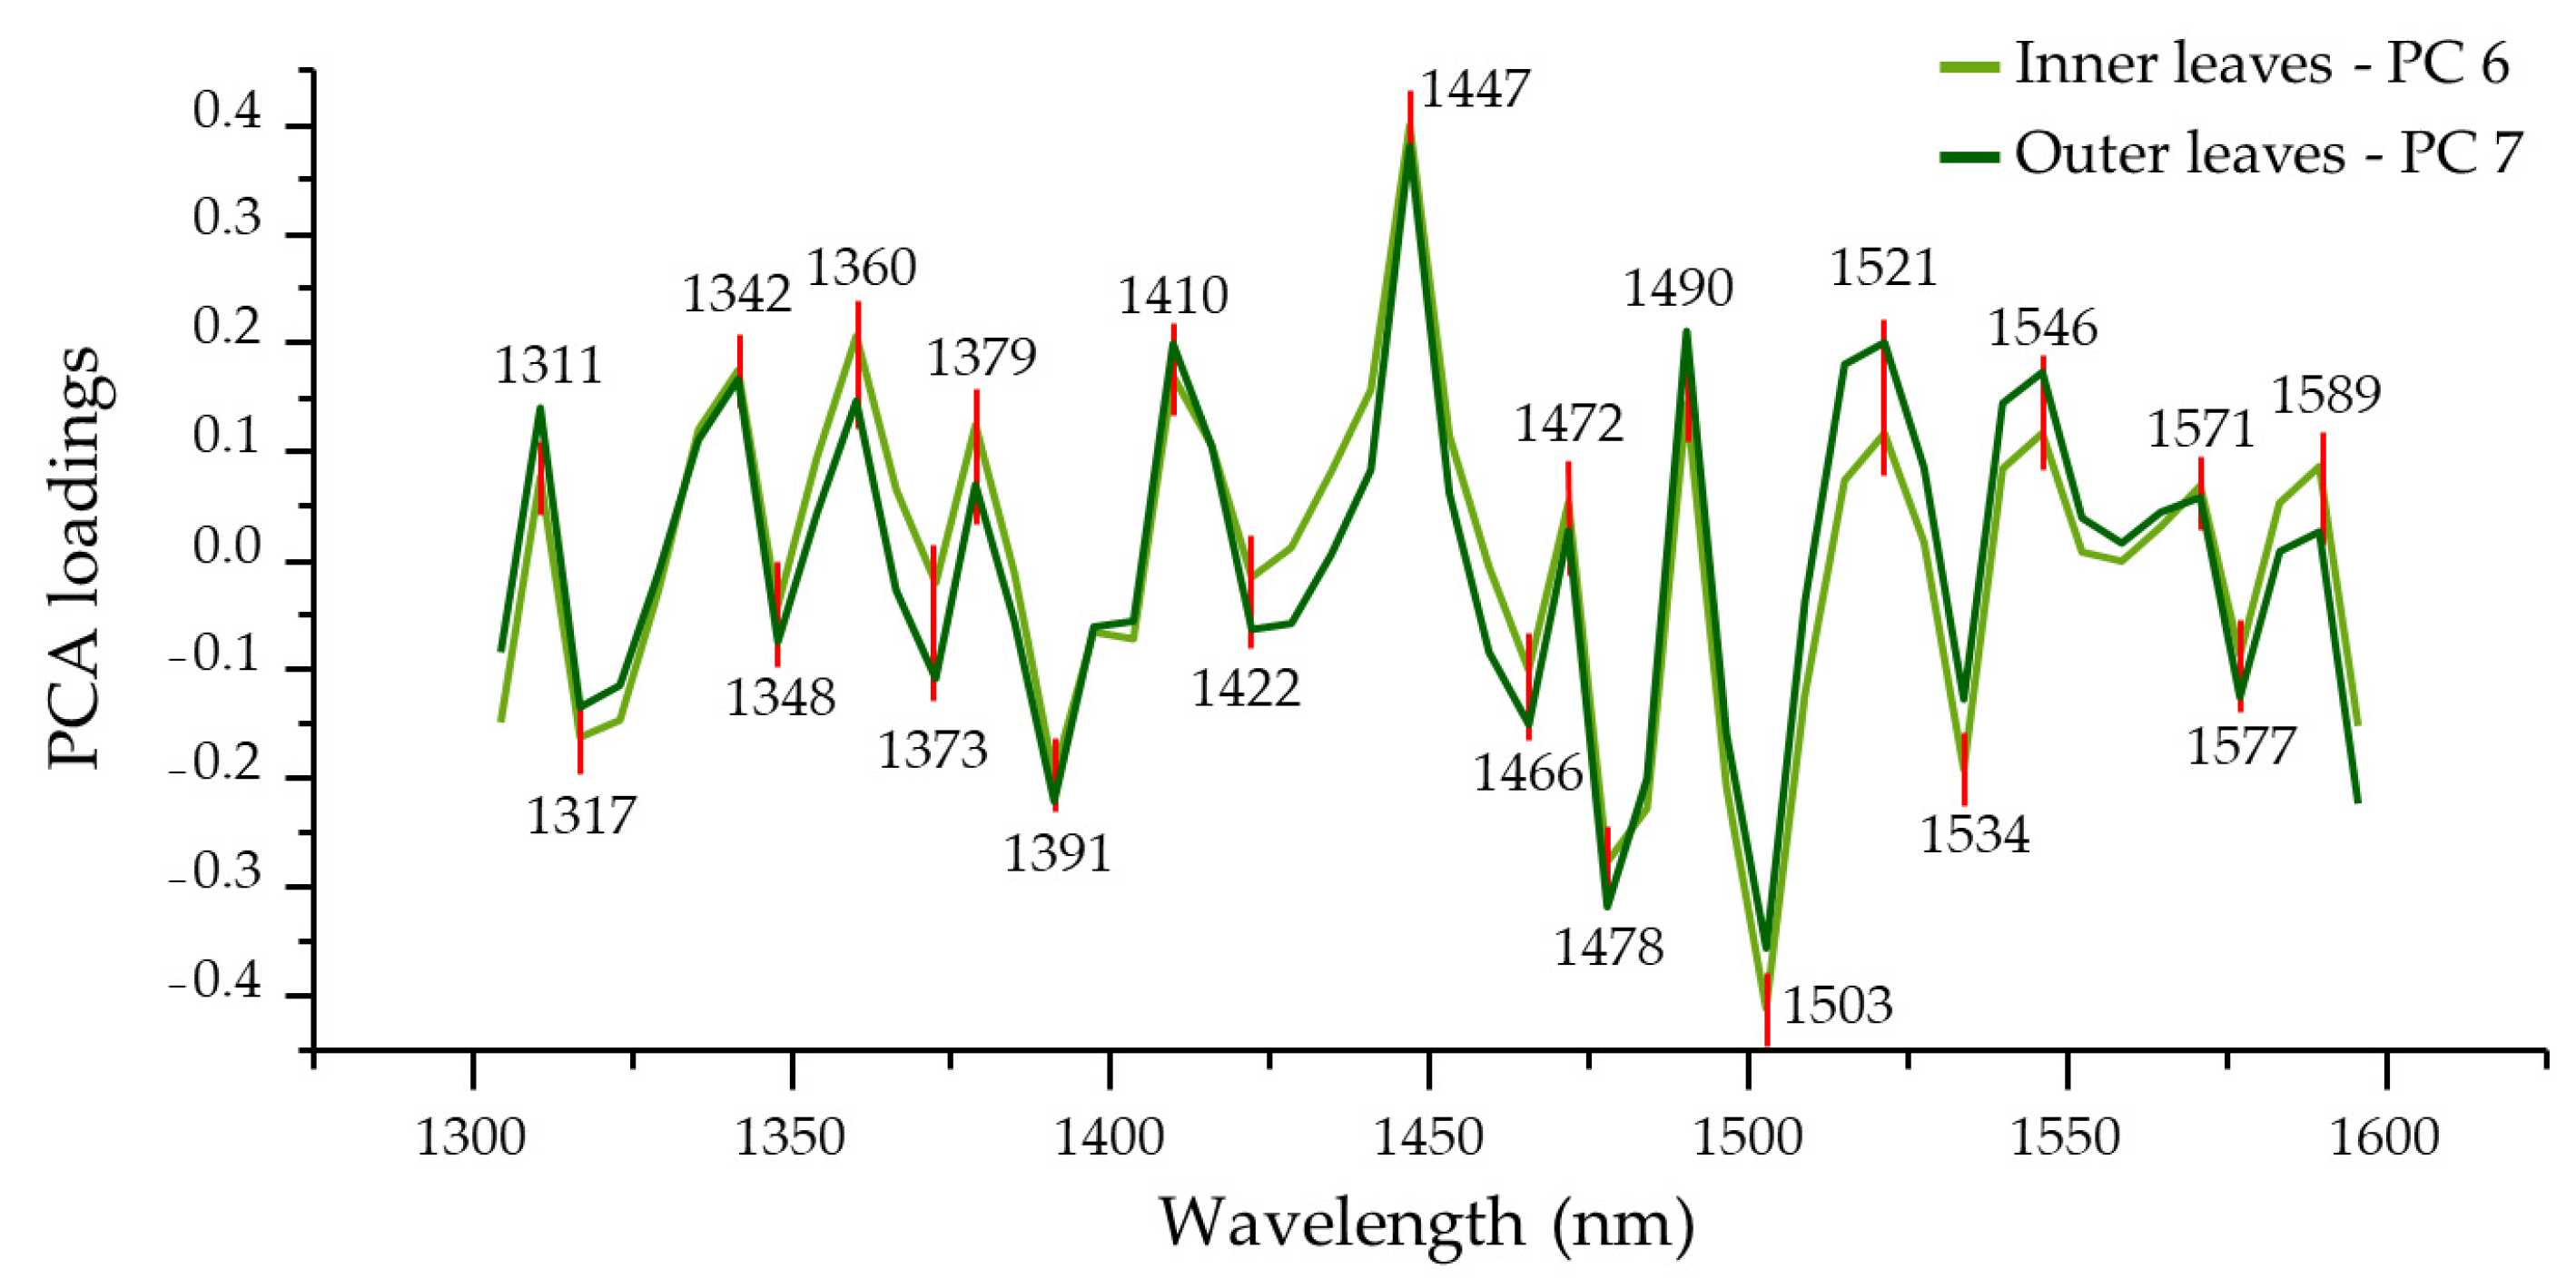
| PC 6 | 1311, 1317 | 1342, 1348 | 1360 | 1373 | 1379 | 1391 | 1410 | 1422 | 1447 | 1466 | 1472, 1478 | 1490 | 1503 | 1521, 1534 | 1546 | 1571, 1577, 1589 | ||
| PC 7 | 1354 | 1410 | 1478 | |||||||||||||||
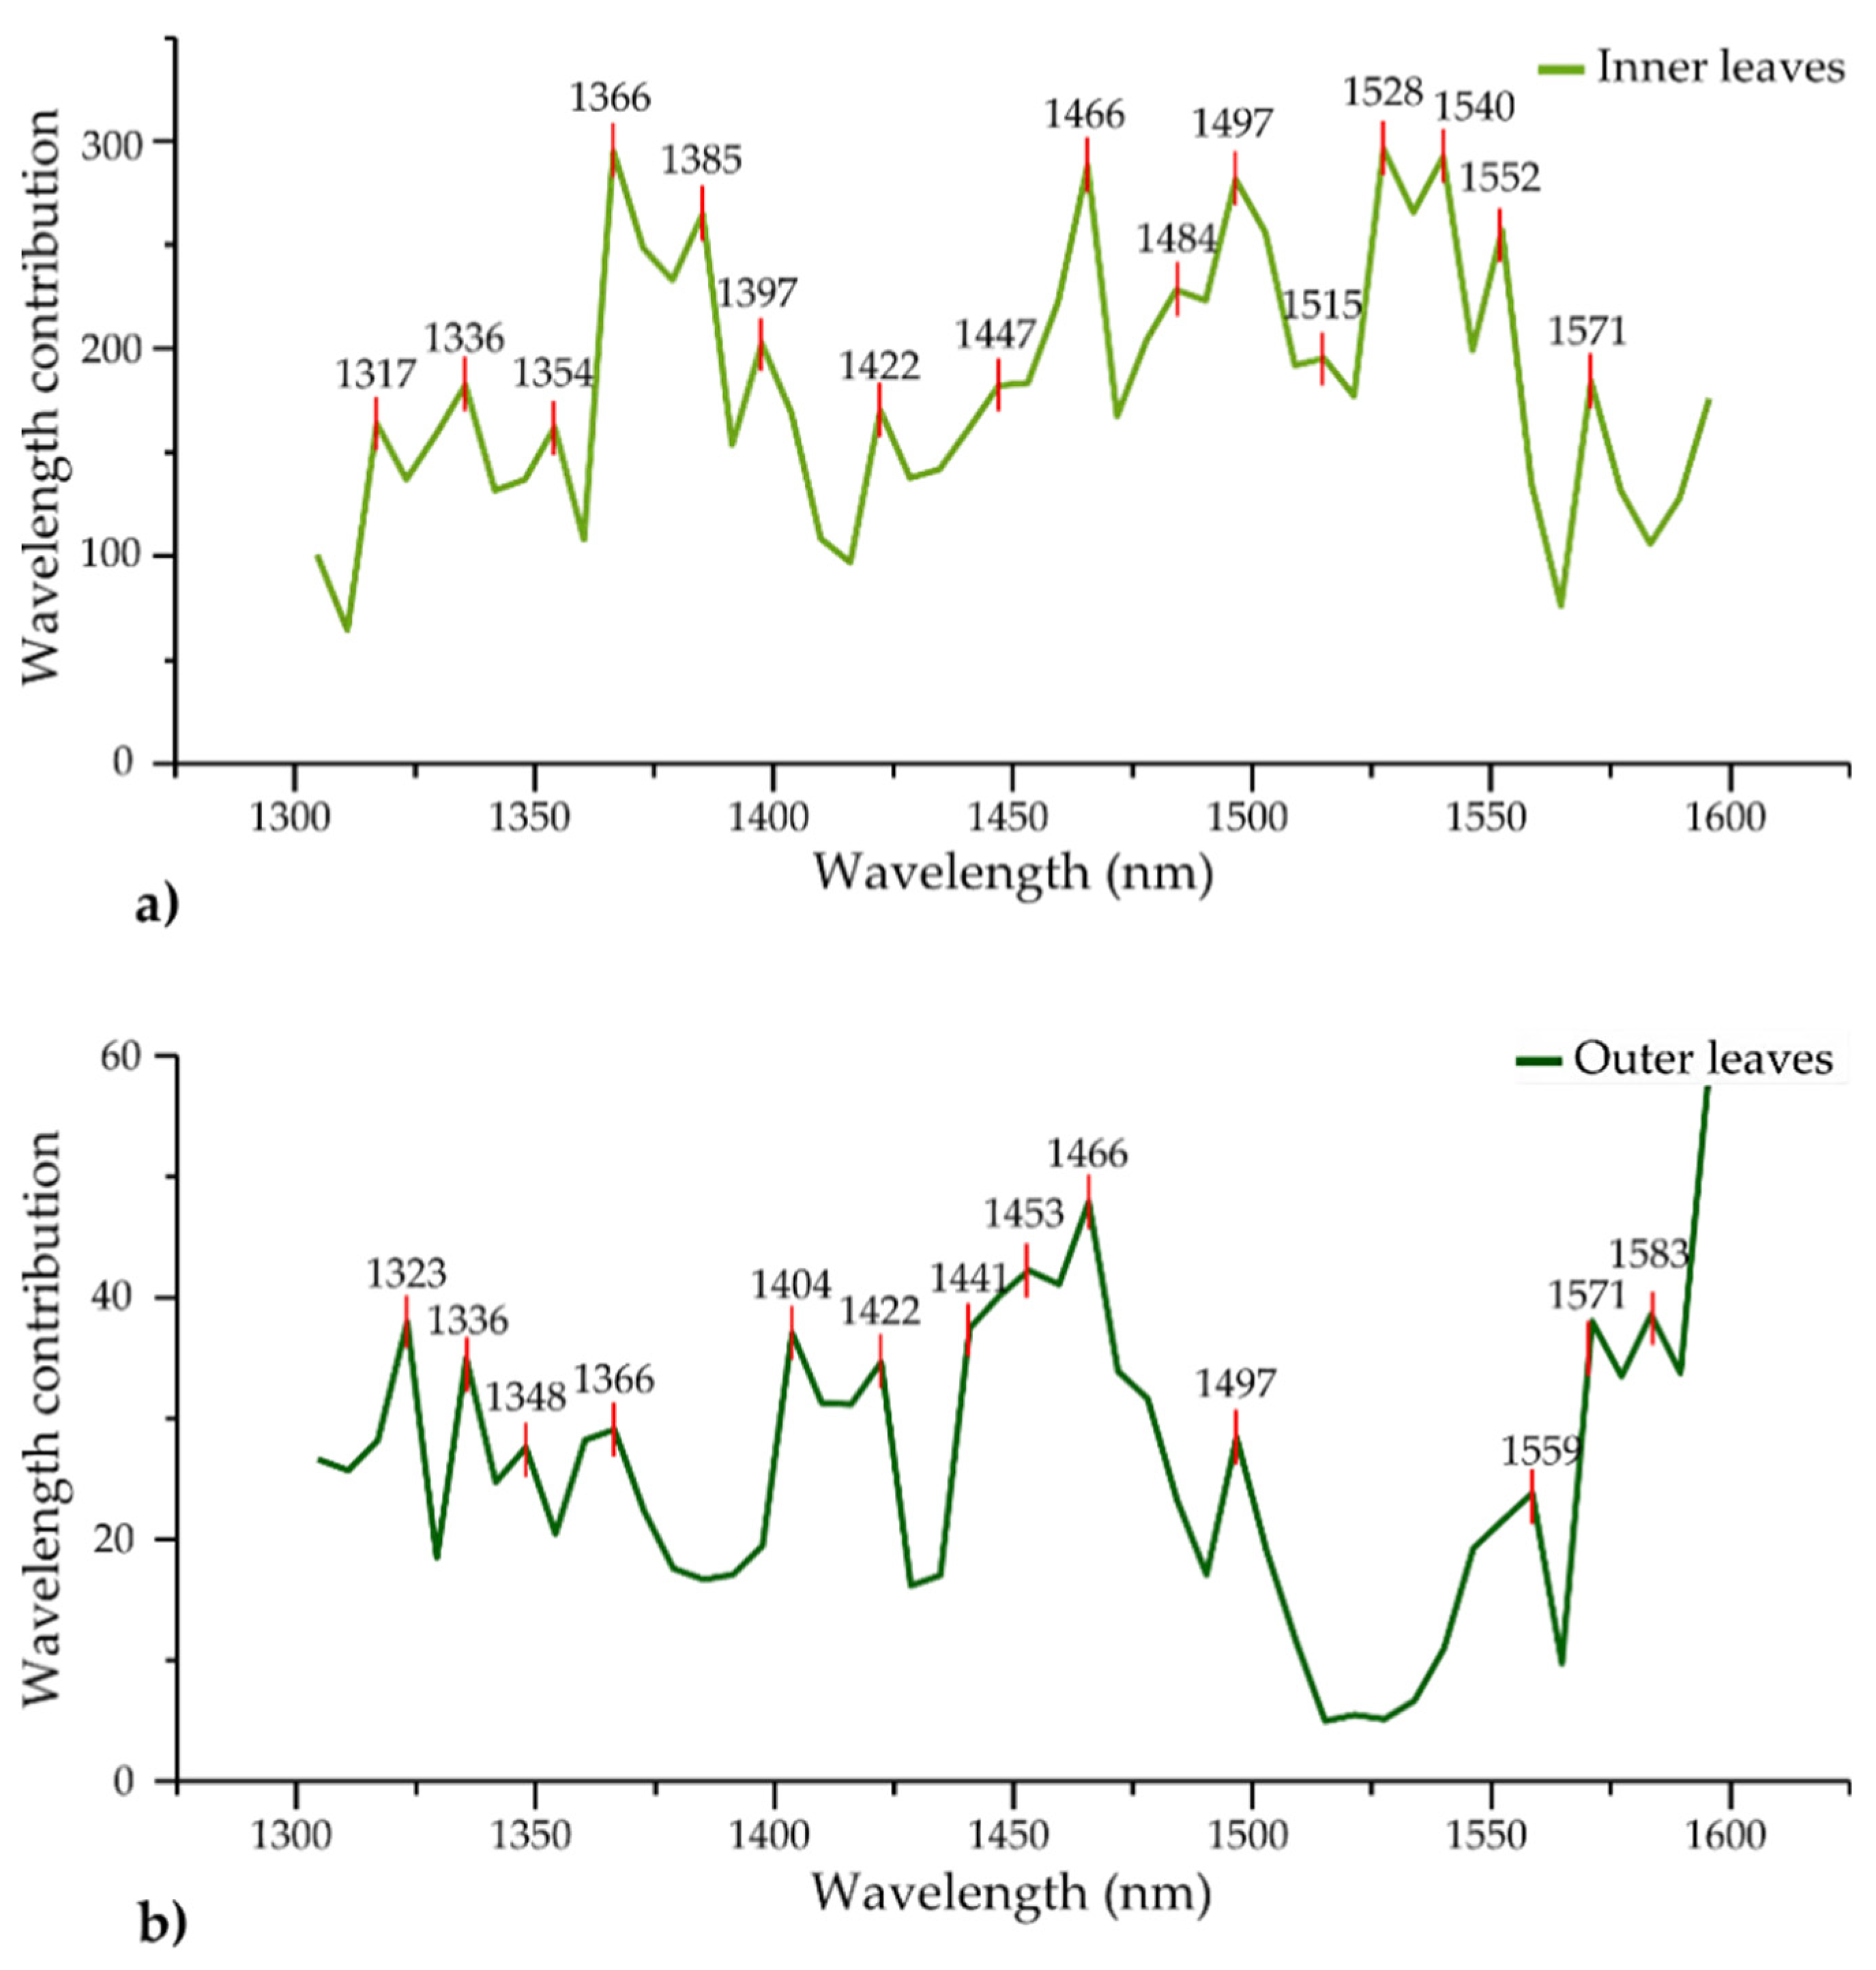
| LDA wavelength contribution | 1317 | 1336 | 1354 | 1366 | 1397 | 1422 | 1447 | 1466 | 1484, 1497 | 1515 | 1528 | 1540, 1552 | 1571 | |||||
| PLS regression vectors | 1329 | 1336, 1348 | 1360, 1366 | 1373 | 1385 | 1391 | 1397, 1410 | 1422, 1428 | 1441 | 1459 | 1472, 1478 | 1484 | 1503, 1509 | 1521, 1528 | 1540 | 1571, 1577, 1589 |
| WAMACs | C1 | C2 | C3 | C4 | C5 | C6 | C7 | C8 | C9 | C10 | C11 | C12 | ||||||
|---|---|---|---|---|---|---|---|---|---|---|---|---|---|---|---|---|---|---|
| Wavelength Range | 1310–1334 | 1336–1348 | 1350–1358 | 1360–1366 | 1370–1376 | 1380–1388 | 1390–1396 | 1398–1418 | 1421–1430 | 1432–1444 | 1448–1454 | 1458–1468 | 1472–1482 | 1482–1496 | 1506– 1516 | 1518–1538 | 1540–1559 | 1560–1590 |
| Difference spectra | ||||||||||||||||||
| Day 2–Day 1 | 1379 | 1428 | 1546 | 1565 | ||||||||||||||
| Day 3–Day 1 | 1379 | 1441 | 1534 | 1565 | ||||||||||||||
| Day 4–Day 1 | 1379 | 1441 | 1546 | 1565 | ||||||||||||||
| Day 5–Day 1 | 1385 | 1441 | 1565 | |||||||||||||||
| Day 6–Day 1 | 1385 | 1441 | 1571 | |||||||||||||||
| PCA loadings | ||||||||||||||||||
| PC 1 | 1416 | 1515 | ||||||||||||||||
| PC 2 | 1447 | |||||||||||||||||
| PC 3 | 1385 | 1447 | ||||||||||||||||
| PC 4 | 1391 | 1490 | 1515 | |||||||||||||||
| PC 5 | 1360 | 1404 | 1459 | 1521 | ||||||||||||||
| PC 6 | 1360 | 1379 | 1416 | 1472 | 1490 | 1515 | ||||||||||||
| PC 7 | 1311, 1317 | 1342, 1348 | 1360 | 1373 | 1391 | 1410 | 1422 | 1447 | 1466 | 1472, 1478 | 1490 | 1503 | 1521, 1534 | 1546 | 1571, 1577, 1589 | |||
| LDA wavelength contribution | 1323 | 1336, 1348 | 1366 | 1404 | 1422 | 1441 | 1453 | 1466 | 1497 | 1559 | 1571, 1583 | |||||||
| PLS regression vectors | 1317 | 1342 | 1360, 1366 | 1373 | 1385 | 1391 | 1397, 1410, 1416 | 1422, 1428 | 1441 | 1453 | 1490 | 1503, 1509, 1515 | 1528 | 1540, 1559 | 1571, 1577, 1589 |
| Monitoring Storage of Lettuce (This Study) | 1348 | 1360 | 1373 | 1385 | 1391 | 1410 | 1422 | 1441 | 1453 | 1466 | 1472 | 1490 | 1515 |
|---|---|---|---|---|---|---|---|---|---|---|---|---|---|
| Mung bean germination [126] | 1343 | 1364 | 1374 | 1383 | 1411 | 1426 | 1441 | 1453 | 1462 | 1477 | 1489 | 1513 | |
| Monitoring pineapple slice solar dehydration [118] | 1342 | 1366 | 1373 | 1410 | 1428 | 1441 | 1453 | 1459 | 1478 | 1490 | 1515 | ||
| Monitoring rice germ storage [24] | 1343 | 1364 | 1375 | 1382 | 1392 | 1410 | 1425 | 1436 | 1455 | 1474 | 1492 | 1518 | |
| Storage monitoring of rocket salad [22] | 1342 | 1366 | 1373 | 1385 | 1416 | 1428 | 1441 | 1453 | 1466 | 1478 | 1490 | 1509 | |
| Studying the influence of packaging and coating materials during storage of winter melons [127] | 1344 | 1364 | 1372 | 1382 | 1398 | 1410 | 1438 1444 | 1464 | 1474 | 1492 | 1518 | ||
| Studying apple sensory texture of stored apples [21] | 1344 | 1364 | 1372 | 1382 | 1398 | 1410 | 1438 1444 | 1464 | 1474 | 1492 | 1518 |
Disclaimer/Publisher’s Note: The statements, opinions and data contained in all publications are solely those of the individual author(s) and contributor(s) and not of MDPI and/or the editor(s). MDPI and/or the editor(s) disclaim responsibility for any injury to people or property resulting from any ideas, methods, instructions or products referred to in the content. |
© 2023 by the authors. Licensee MDPI, Basel, Switzerland. This article is an open access article distributed under the terms and conditions of the Creative Commons Attribution (CC BY) license (https://creativecommons.org/licenses/by/4.0/).
Share and Cite
Vitalis, F.; Muncan, J.; Anantawittayanon, S.; Kovacs, Z.; Tsenkova, R. Aquaphotomics Monitoring of Lettuce Freshness during Cold Storage. Foods 2023, 12, 258. https://doi.org/10.3390/foods12020258
Vitalis F, Muncan J, Anantawittayanon S, Kovacs Z, Tsenkova R. Aquaphotomics Monitoring of Lettuce Freshness during Cold Storage. Foods. 2023; 12(2):258. https://doi.org/10.3390/foods12020258
Chicago/Turabian StyleVitalis, Flora, Jelena Muncan, Sukritta Anantawittayanon, Zoltan Kovacs, and Roumiana Tsenkova. 2023. "Aquaphotomics Monitoring of Lettuce Freshness during Cold Storage" Foods 12, no. 2: 258. https://doi.org/10.3390/foods12020258