Article

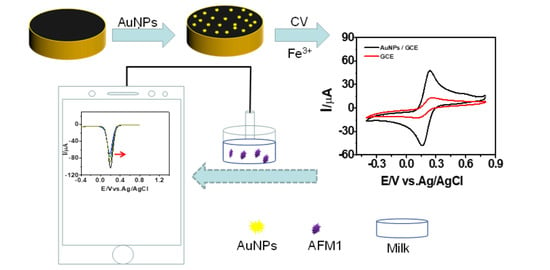
The Ultrasensitive Detection of Aflatoxin M1 Using Gold Nanoparticles Modified Electrode with Fe3+ as a Probe

1
Department of Chemistry and Chemical Engineering, Henan Institute of Science and Technology, Xinxiang 453003, China
2
School of Food Science and Engineering, Shaanxi University of Science and Technology, Xi’an 710021, China
*
Author to whom correspondence should be addressed.
Foods 2023, 12(13), 2521; https://doi.org/10.3390/foods12132521
Submission received: 31 May 2023 / Revised: 26 June 2023 / Accepted: 27 June 2023 / Published: 28 June 2023

Abstract

:
The increasing incidence of diseases caused by highly carcinogenic aflatoxin M1 (AFM1) in food demands a simple, fast, and cost-effective detection technique capable of sensitively monitoring AFM1. Recent works predominantly focus on the electrochemical aptamer-based biosensor, which still faces challenges and high costs in experimentally identifying an efficient candidate aptamer. However, the direct electrochemical detection of AFM1 has been scarcely reported thus far. In this study, we observed a significant influence on the electrochemical signals of ferric ions at a gold nanoparticle-modified glassy carbon electrode (AuNPs/GCE) by adding varying amounts of AFM1. Utilizing ferricyanide as a sensitive indicator of AFM1, we have introduced a novel approach for detecting AFM1, achieving an unprecedentedly low detection limit of 1.6 × 10⁻²¹ g/L. Through monitoring the fluorescence quenching of AFM1 with Fe3+ addition, the interaction between them has been identified at a ratio of 1:936. Transient fluorescence analysis reveals that the fluorescence quenching process is predominantly static. It is interesting that the application of iron chelator diethylenetriaminepentaacetic acid (DTPA) cannot prevent the interaction between AFM1 and Fe3+. With a particle size distribution analysis, it is suggested that a combination of AFM1 and Fe3+ occurs and forms a polymer-like aggregate. Nonetheless, the mutual reaction mechanism between AFM1 and Fe3+ remains unexplained and urgently necessitates unveiling. Finally, the developed sensor is successfully applied for the AFM1 test in real samples, fully meeting the detection requirements for milk.

Graphical Abstract

1. Introduction

Aflatoxins, produced by Aspergillus flavus and Aspergillus. parasiticus, which are commonly found in cereal grains, dairy products, beans, and nuts [1,2,3], are toxic compounds with a difuran ring structure. The improper storage conditions can result in contamination with aflatoxins, and the intake of aflatoxins is associated with a significant portion of hepatocellular carcinoma cases worldwide such as impaired liver function and immune response and an increase in susceptibility to infectious diseases [4,5,6]. These toxins can enter the bloodstream and undergo metabolization in the human body. There are four generally recognized aflatoxins designated B1, B2, G1, and G2. Aflatoxin B1 (AFB1) is the major mycotoxin produced by most species under culture conditions and is the most frequently studied of the four. However, the index compound of AFB1 is not carcinogenic before it is metabolically activated. AFM1, a hydroxylated metabolite of AFB1 in human food and animal feed, is excreted in urine and secreted in milk in mammalian species within 12 h after consumption, while its toxicity is much less known. AFM1, in particular, is reclassified as a naturally occurring carcinogen belonging to Group 1, with the formation of DNA adducts [7]. Nonetheless, many nations have set regulatory limits for maximum allowable AFM1 in milk and other dairy products. In 2005, the Food and Drug Administration (FDA) set an AFM1 action level in milk and other dairy products at 0.5 μg/L. The European Union (EU) set a much stricter standard that allows a maximum of 0.05 μg/L in milk in 2006 [7]. Turna noted that a high AFM1 level in milk was associated with a high level of AFB1 in animal feed, which upon consumption could harm both animal and human health [8]. Accordingly, timely monitoring of aflatoxins during biological transformation can help reduce the risk of diseases [9]. Consequently, the development of a sensitive detection method has become a prominent research focus in recent years.
Currently, the identification and quantification of aflatoxins are commonly performed using thin-layer chromatography (TLC) [10], immunoaffinity chromatography [11], high-performance liquid chromatography (HPLC) [12], and enzyme-linked immunosorbent assay (ELISA) [13]. However, these methods have drawbacks such as being time-consuming, requiring special equipment, or involving cumbersome sample pretreatment and false-positive results [14]. A reliable and promising alternative approach that offers high sensitivity, ease of operation, fast analysis, and cost-effectiveness is the electrochemical method. Recently, electrochemical aptamer-based sensors have gained significant attention for aflatoxin monitoring. However, the instability of the biological recognition piece limited the use as anticipated.
Abnous et al. [15] reported an electrochemical sensing strategy for the detection of AFB1 based on aptamer-complementary strands of aptamer complex, forming a π-shape structure on the electrode surface, with a detection limit of 2 pg/mL. Ahmadi et al. [16] developed a pencil graphite electrode modified with reduced graphene oxide and gold nanoparticles for the detection of AFM1, achieving a detection limit of 0.3 ng/L. Furthermore, the detection of AFM1 has been accomplished using voltammetric biosensors, utilizing silver nanoparticles dispersed on an α-cyclodextrin-GQDs nanocomposite [17]. Aflatoxins can be electrochemically oxidized to ketone because of containing an alcohol group, which is generated by the hydrolysis of the aromatic ester group in a basic medium. This allows the direct detection of aflatoxins without the need for recognition elements or tags [18]. Gevaerd et al. [19] reported the direct determination of AFB1 in 2020 at the screen-printed electrode (SPE) modified with gold nanoparticles and graphene quantum dots (AuNPs-GQDs), which exerted an electrocatalytic effect on the oxidation of AFB1 (shift of the oxidation peak to less positive values). The performance in ng/mL level by this approach was quite similar to those obtained with other systems where bioreceptors are used. However, the low specificity of this format of detection limits its further application for the selective determination of aflatoxins. Thus, there is still a growing demand for novel sensors that offer a simple electrode modification process, high sensitivity, low cost, and ease of use for the detection of Aflatoxins replacing commonly used biological recognition systems described above.
Aflatoxins belong to the class of coumarin compounds characterized by their difuran ring structures. Previous reports have identified coumarin compounds as fluorescent probes for various metal ions such as Mg2+ [20], Cu2+ [21,22], Zn2+ [23], and others. In recent years, numerous small molecule fluorescent probes for Fe3+ have been developed [24,25] based on a selective binding approach for example complexation or chelation. Wang et al. [26] reported a highly selective coumarin-based chemosensor for the detection of Fe3+ where coumarin FB displayed a high affinity to Fe3+ resulting in forming an FB-Fe3+ complex. Zhao et al. [27] specifically designed and synthesized Schiff base probes using phenanthro [9,10-d] imidazole-coumarin derivatives, demonstrating the formation of a 1:1 complex between these probes and Fe3+.
Considering this, the electrochemical signals of Fe3+ could potentially reflect the concentration of aflatoxins. There appear to be interactions between Fe3+ and aflatoxins, which warrant further comprehensive investigation, particularly in understanding the nature of the interaction between Fe3+ and aflatoxins.
As is known, electrode modifiers having good conductivity and catalytic activity play an important role in influencing the sensitivity and capability of modified electrodes. Commonly, conducting polymers, molecularly imprinted materials and some metals such as gold, iron, silver, and palladium can be used as electrode modifier materials for enhancing the peak currents, which is necessary for determining the trace amount of analytes in real samples. In this work, we have compared the electrochemical activity of polythionine, molecularly imprinted L-cysteine, and electrodeposited gold nanoparticles (AuNPs). Among them, the uniform deposition of AuNPs onto the glassy carbon electrode (GCE) surface is well known for its ability to increase the effective area and confer the direct electron transfer between the analyte and the electrode base [28,29], making it an excellent sensing platform and giving a much better electrochemical signal towards Fe3+ as shown in Supplementary Figure S1. In this study, we have successfully developed an electrochemical sensor by modifying a GCE with AuNPs (AuNPs/GCE) for the detection of AFM1. While the electrochemical synthesis of AuNPs without the requirement of an external linker or functionalizing ligand is well established, aiming for the best electrochemical performance; herein, we have particularly optimized the electrochemical sweeping methods and parameters, deposition times, and minimal solution preparation because the in situ tailoring of nanoparticle surface chemistry resulted in improved catalytic activity and selectivity. The sensor utilizes ferricyanide as a mediator, where the presence of AuNPs greatly facilitates the electrode reaction and enhances the catalytic activity towards ferricyanide. Consequently, this sensor exhibits an unprecedented lowest detectable concentration of AFM1 over the widest linear range reported thus far.
To demonstrate the specificity of Fe3+ in AFM1 detection, an immunoassay column was utilized. Remarkably, an impressive reaction ratio of AFM1 to Fe3+ was obtained. The performance of the developed sensor was evaluated by measuring AFM1 in spiked milk samples, yielding satisfactory analytical results since it is easy, quick, and does not involve developing the biological material methodology.

2. Materials and Methods

2.1. Chemicals and Apparatus

AFM1 was obtained from Toronto Research Chemicals, while HAuCl4·3H2O (≥99%) was acquired from Sigma Aldrich. KCl, K3[Fe(CN)6], K4[Fe(CN)6], NaH2PO4, and Na2HPO4 were purchased from Aladdin Reagents. Unless otherwise specified, all reagents were used as received. Phosphate buffer solutions (PBS) were prepared by diluting 0.1 M NaH2PO4 and 0.1 M Na2HPO4 stock solutions. All solutions were prepared using double-distilled water with a resistivity of 18 MΩ·cm.
The electrochemical experiments were conducted at room temperature using a CHI900D workstation (Shanghai CH Instrument Ltd., Shanghai, China) equipped with a conventional three-electrode system. The system consisted of a glassy carbon electrode (GCE, 3.0 mm in diameter) as the working electrode, a platinum wire as the counter electrode, and an Ag/AgCl (saturated KCl) electrode as the reference electrode. Electrochemical impedance spectroscopy (EIS) measurements were performed in PBS containing 5 mM K3[Fe(CN)6]/K4[Fe(CN)6] (mole ratio of 1:1) and 0.1 M KCl at room temperature. An AUTOLAB PGSTAT302N (Metrohm Auto lab B.V., Herisau, Switzerland) was used for EIS measurements, employing a formal potential of 0.2 V, 5 mV amplitude, and a frequency range from 0.1 Hz to 100 kHz. Nyquist plots were generated from the impedance data and fitted using AUTOLAB Nova 1.8.
Scanning electron microscopy (SEM) experiments were conducted using an XL30 ESEM-FEG (FEI Company, Hillsboro, OR, USA) with an acceleration voltage of 20.0 kV. Molecular fluorescence spectra were measured using an F-180 fluorescence spectroscope (Tianjin Gangdong Co., Ltd., Tianjin, China). The steady-state and transient-state fluorescence spectra were obtained using an FLS 1000 spectrometer (Edinburgh Instruments, West Lothian, UK). Particle size distribution analysis was obtained using a nanoparticle size analyzer Winner 802 (Jinan Weina Particle Instruments, Jinan, China). The enzyme-linked immunosorbent assay (ELISA) was performed using a Varioskan™ LUX (Thermo Fisher Scientific, Waltham, MA, USA).

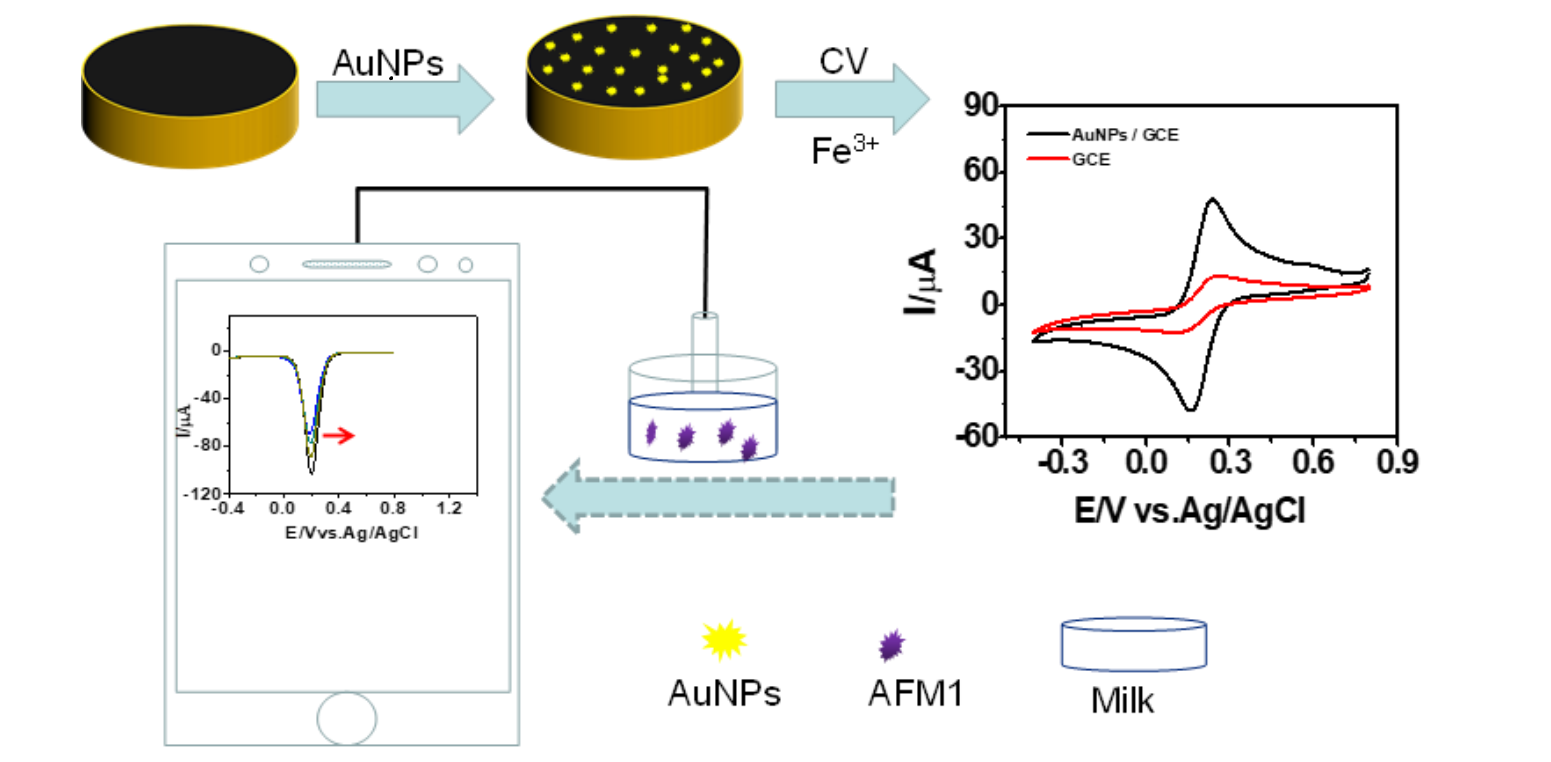
2.2. Preparation of AuNPs/GCE

Figure 1A depicts the schematic diagram illustrating the modification of GCE with AuNPs. To achieve this, the GCE was initially polished to a mirror finish using 0.05 μm alumina slurry on a microcloth. Subsequently, it was ultrasonicated with distilled water for 1 min to ensure cleanliness. The polished and cleaned GCE was then immersed in a solution containing 5 mM HAuCl4 and 0.1 M KCl. AuNPs were formed using cyclic voltammetry (CV) in a potential range from −0.4 V to 1.2 V, with a scan rate of 10 mV/s for 20 cycles. Figure 1B displays the cyclic voltammograms, which exhibit a monotonically increasing trend of the redox waves, confirming the continuous growth of the AuNPs layer.
Following the AuNPs formation, the AuNPs/GCE was thoroughly rinsed with deionized water and transferred to a 0.1 M PBS solution at pH 7.0. The electrode was scanned until a stable voltammogram was obtained. Figure 1C shows the corresponding SEM image of the AuNPs/GCE, revealing a compact layer with uniformly distributed and smaller AuNPs, providing full coverage.

2.3. Sample Preparation

AFM1 stock solution was prepared by dissolving an appropriate mass of AFM1 in pH 7.0 PBS, and working solutions with different concentrations of AFM1 were prepared by diluting the stock solution with buffer. The commercial milk was purchased from a local store. In the experimental procedure, 30 mL of the milk sample was transferred to a centrifuge tube. To remove proteins, 20% TCA (trichloroacetic acid) was added, and the mixture was centrifuged for 5 min. Subsequently, centrifugation was performed at a speed of 6000 rpm for 10 min. The resulting supernatant was then filtered through a 0.22 μm filter and passed through an immunoaffinity column. Finally, the filtered sample was subjected to testing. The possibility and reliability of the method being applied in practice were established in regard to evaluating the recovery rate in actual samples.

3. Results and Discussion

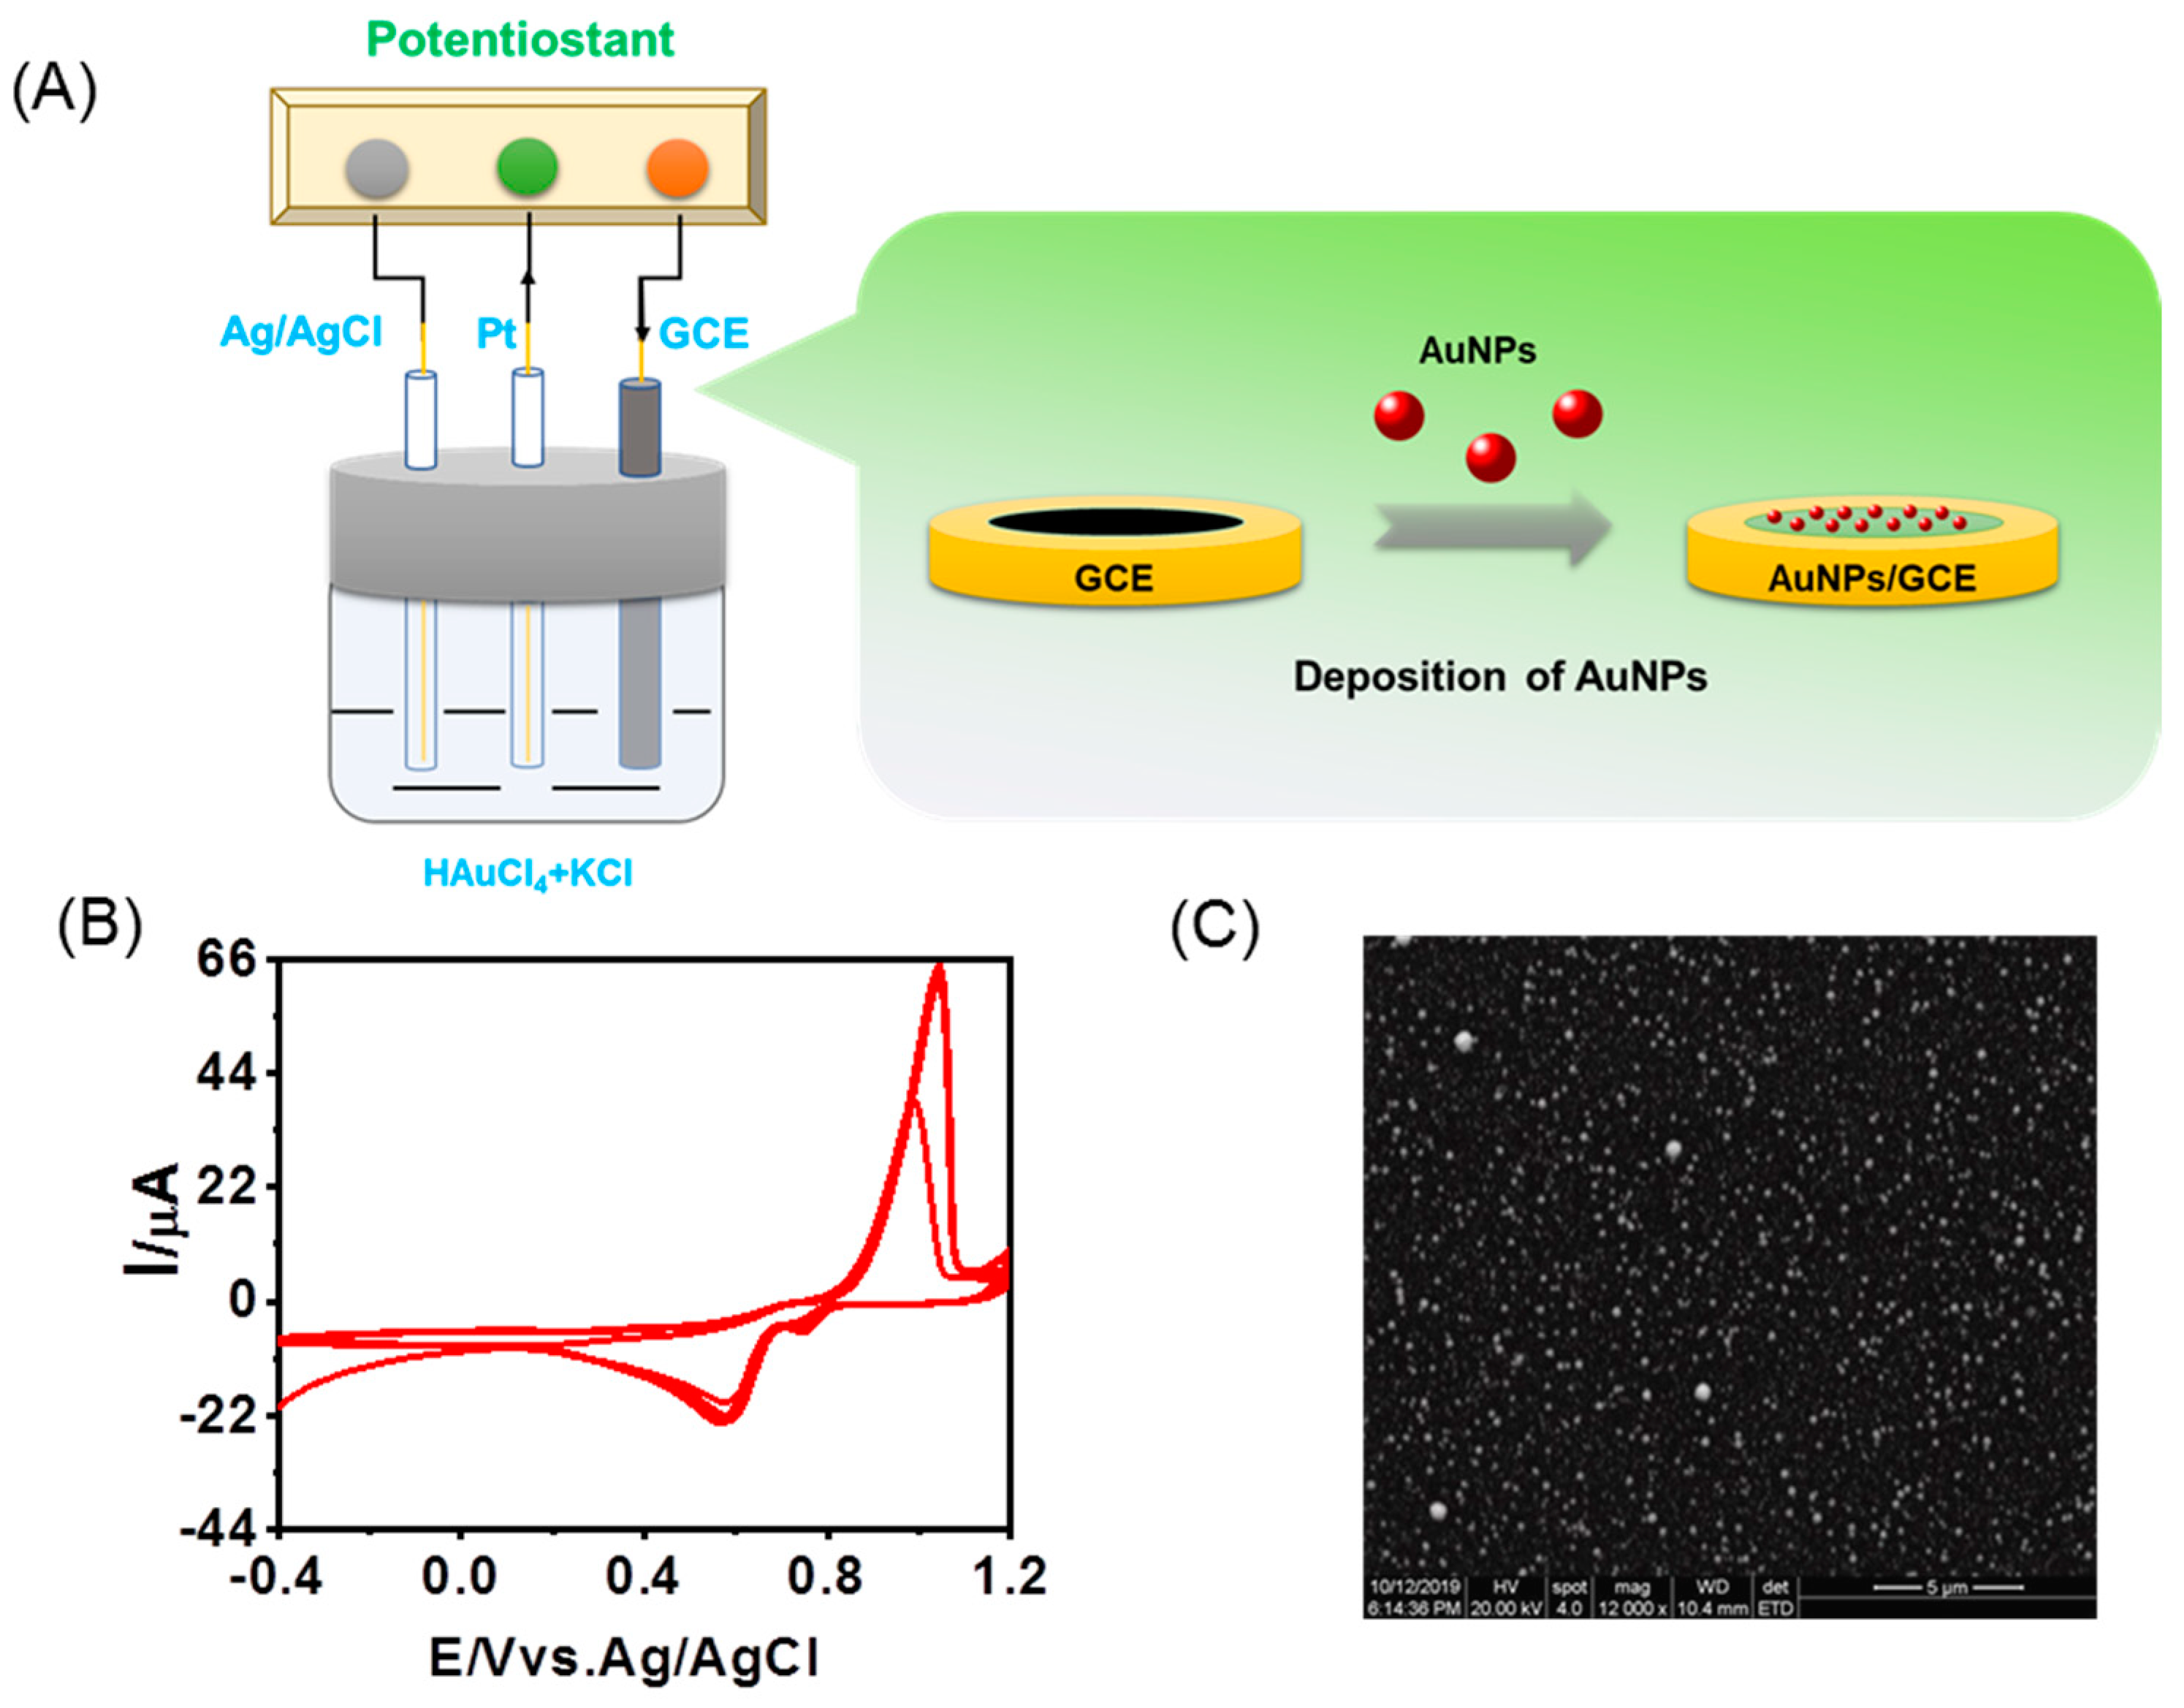
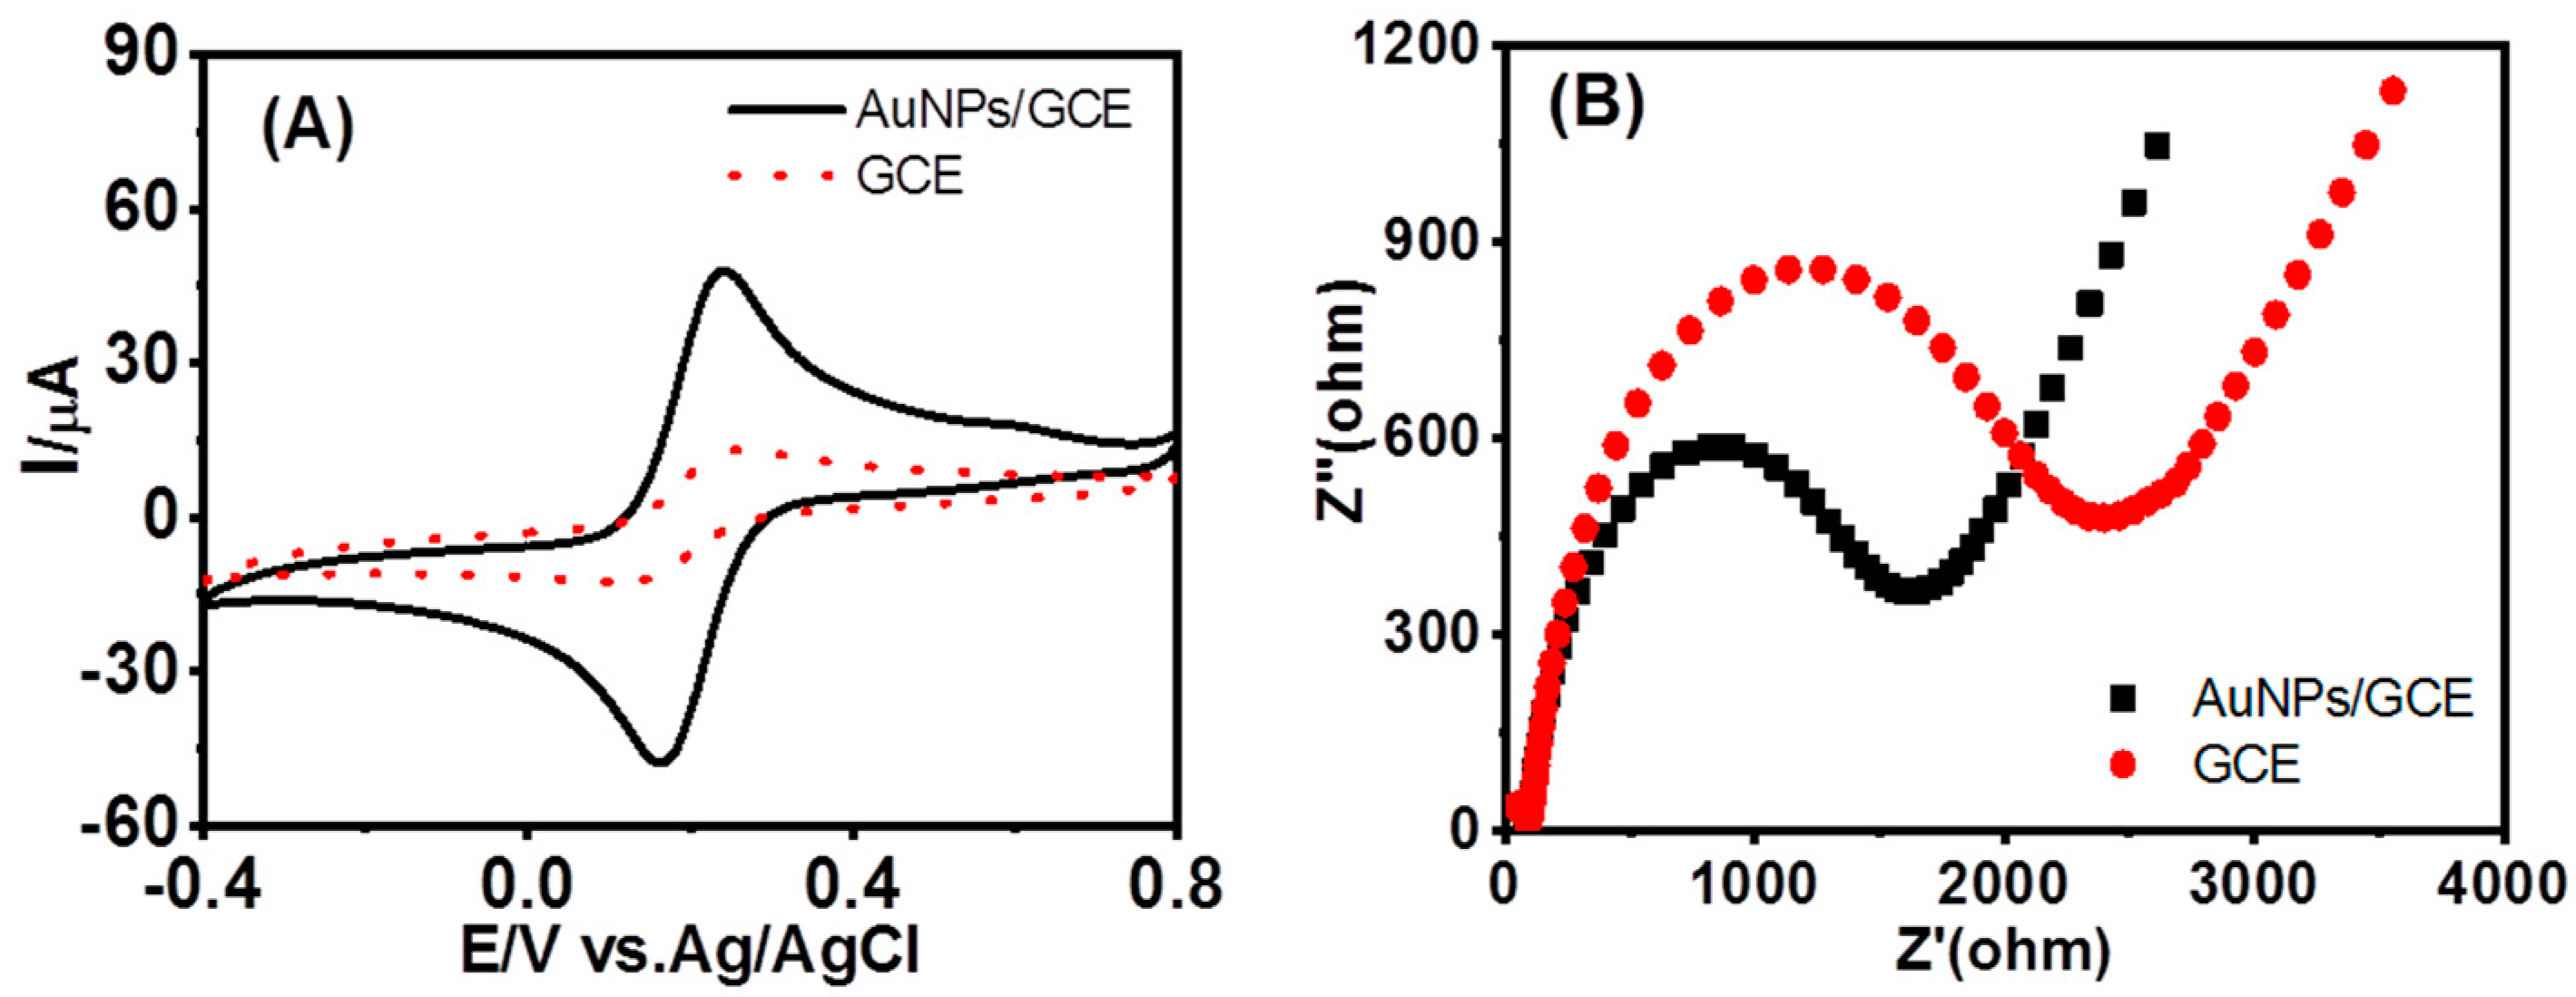
3.1. Electrochemical Characterization of the AuNPs/GCE

The electrochemical behaviors of AuNPs/GCE were investigated by performing CV (cyclic voltammetry) and EIS (electrochemical impedance spectroscopy) measurements in a 0.1 M PBS solution (pH 7.0) containing 5 mM Fe(CN)63−/4−. Figure 2A clearly shows that AuNPs/GCE exhibits remarkable activity and reversibility, as evidenced by the distinct peak-to-peak separation (ΔEp = ca. 78 mV at 100 mV·s−1) and enhanced peak current observed in the CVs, in comparison to the bare GCE. Furthermore, the CVs of AuNPs/GCE remained nearly constant despite variations in the number of ultrasonic cleaning cycles, indicating the high stability of the modifier layer.
Additionally, the Nyquist plots presented in Figure 2B, obtained from the EIS measurements, further support the superior conductivity of AuNPs/GCE when compared to the bare GCE. This enhanced conductivity contributes to the exceptional electrochemical catalytic performance exhibited by AuNPs/GCE without the use of any additional biomolecule as an electrode modifier.

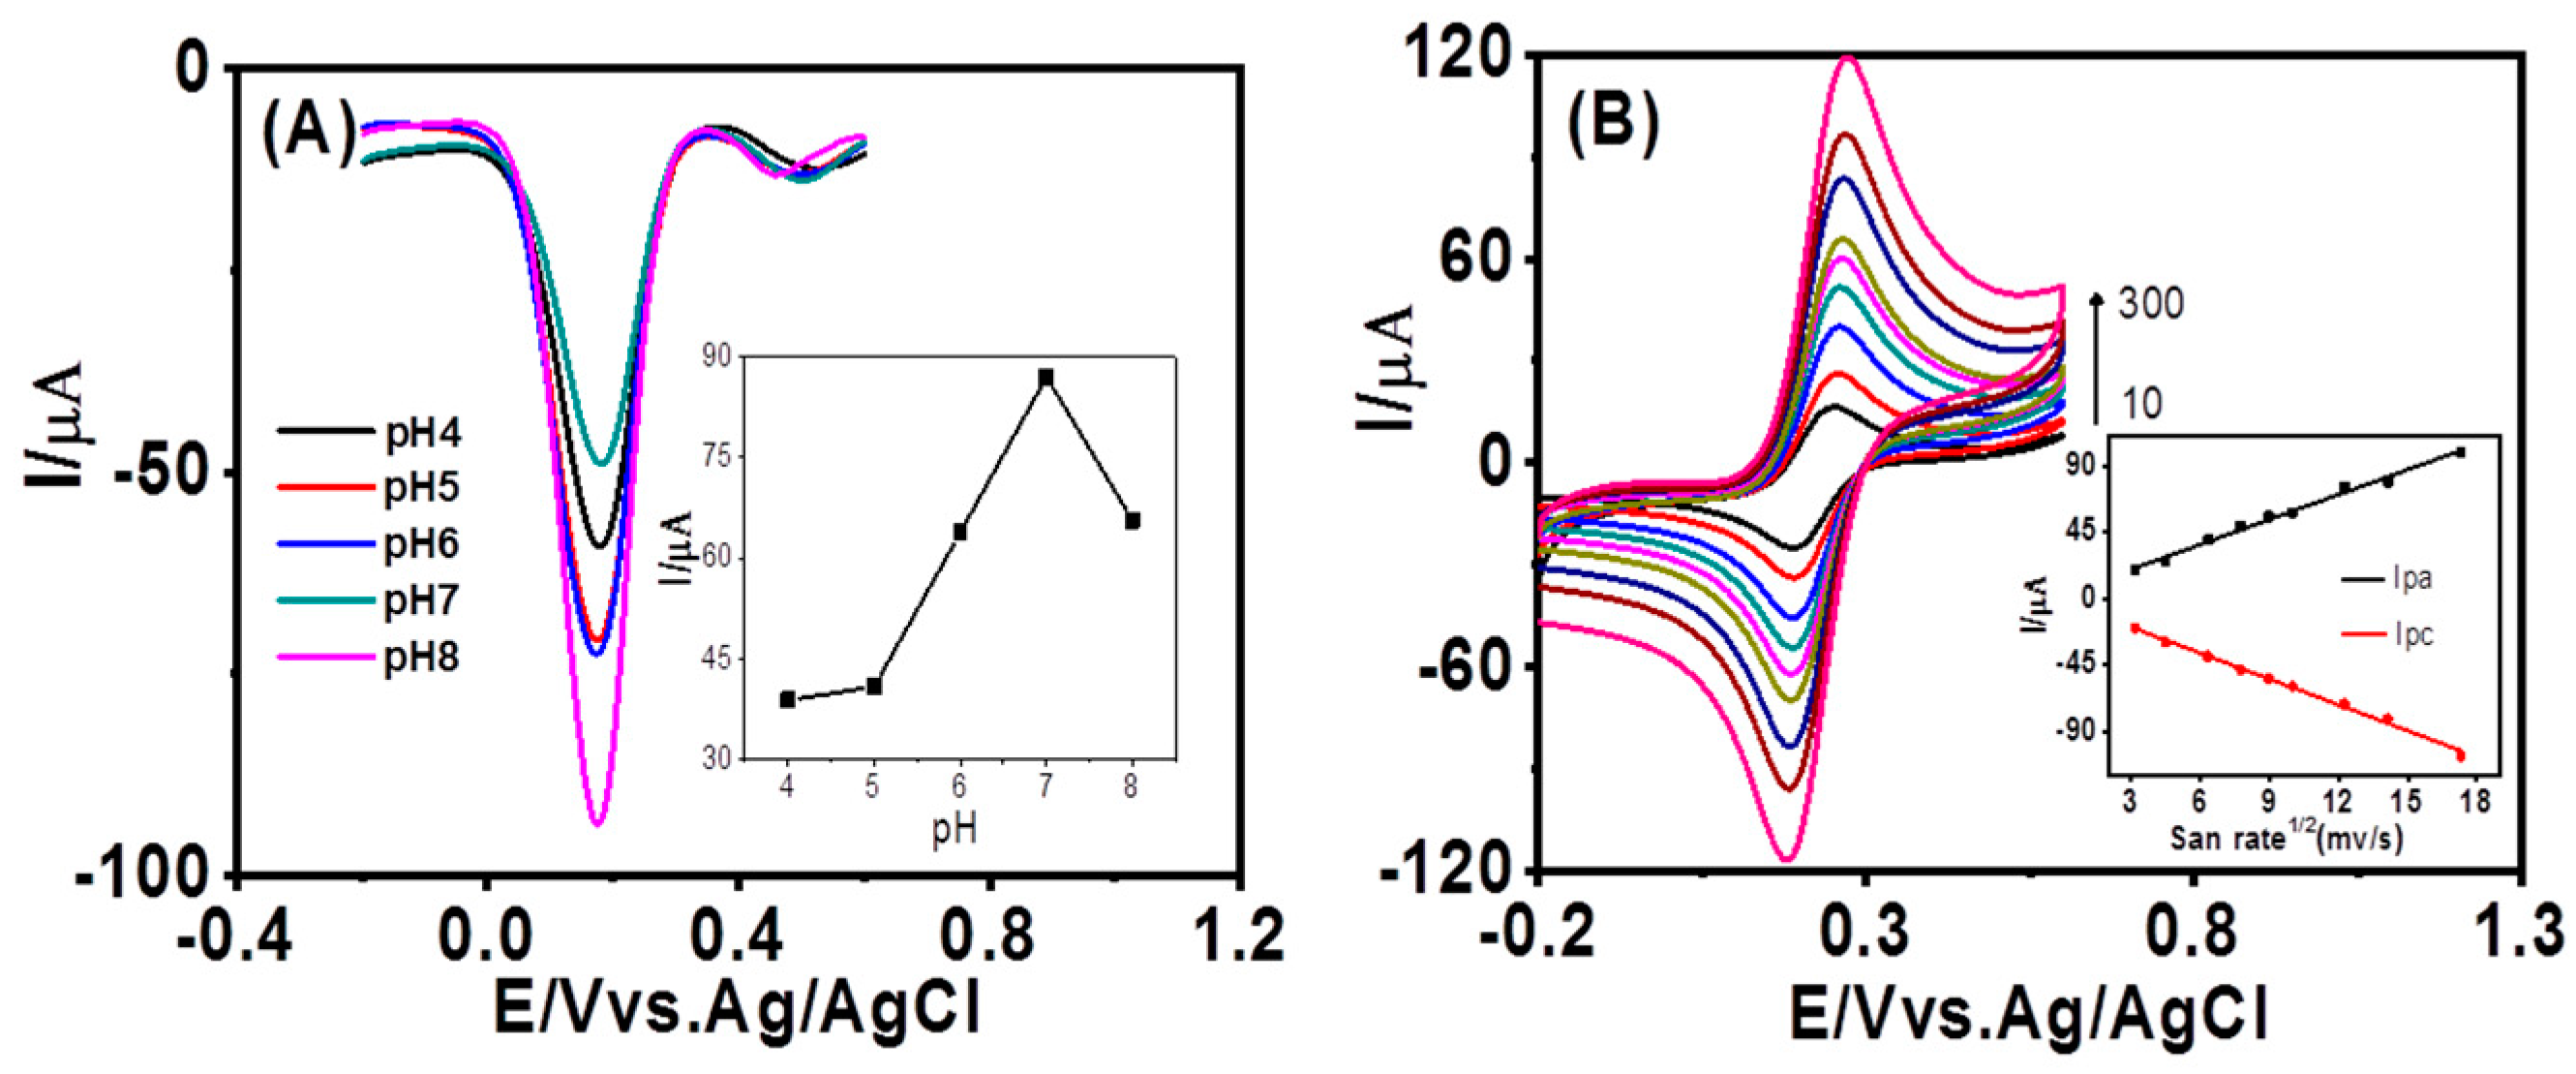
3.2. Effect of pH and Scan Rates on Fe3+ Signals at AuNPs/GCE in the Presence of AFM1

The impact of pH variation on the electrochemical response of Fe3+ at AuNPs/GCE in the presence of AFM1 was further investigated using different buffer solutions prepared and adjusted to a pH range of 4.0 to 8.0. Protons always exert a significant impact on the reaction speed when being involved in the electrochemical reactions of organic compounds. Figure 3A illustrates the gradual increase in peak currents in differential pulse voltammetry (DPV) with an increase in pH within the range of 4–9. The peak currents reach a maximum at pH 7.0 and then decline, leading to the selection of pH 7 for subsequent experiments. This phenomenon is also aligned with the fact that AFM1 is generally more stable in neutral pH. Notably, the absence of proton involvement in the reaction is evident as the peak potential does not exhibit a linear shift with pH.
Figure 3B presents the cyclic voltammograms (CVs) obtained at AuNPs/GCE with different scan rates. It is observed that both the cathodic peak current (Ipa) and anodic peak current (Ipc) are directly proportional to the square root of the scan rates within the range of 10–300 mV·s−1. The correlated linear equations can be expressed as Ipa (µA) = 5.63 v1/2 (mV·s−1) + 2.72, and Ipc (µA) = −5.84 v1/2 (mV·s−1) − 2.23, respectively, with the consistent regression coefficient (r2) of 0.99 (inset of Figure 3B), suggesting a diffusion-controlled redox behavior of Fe3+ at AuNPs/GCE according to Randles–Sevcik equation instead of a surface reaction-controlled process. Moreover, the fact that peak potential is nearly independent on the scan rate suggests that the redox reaction is electrochemically reversible.

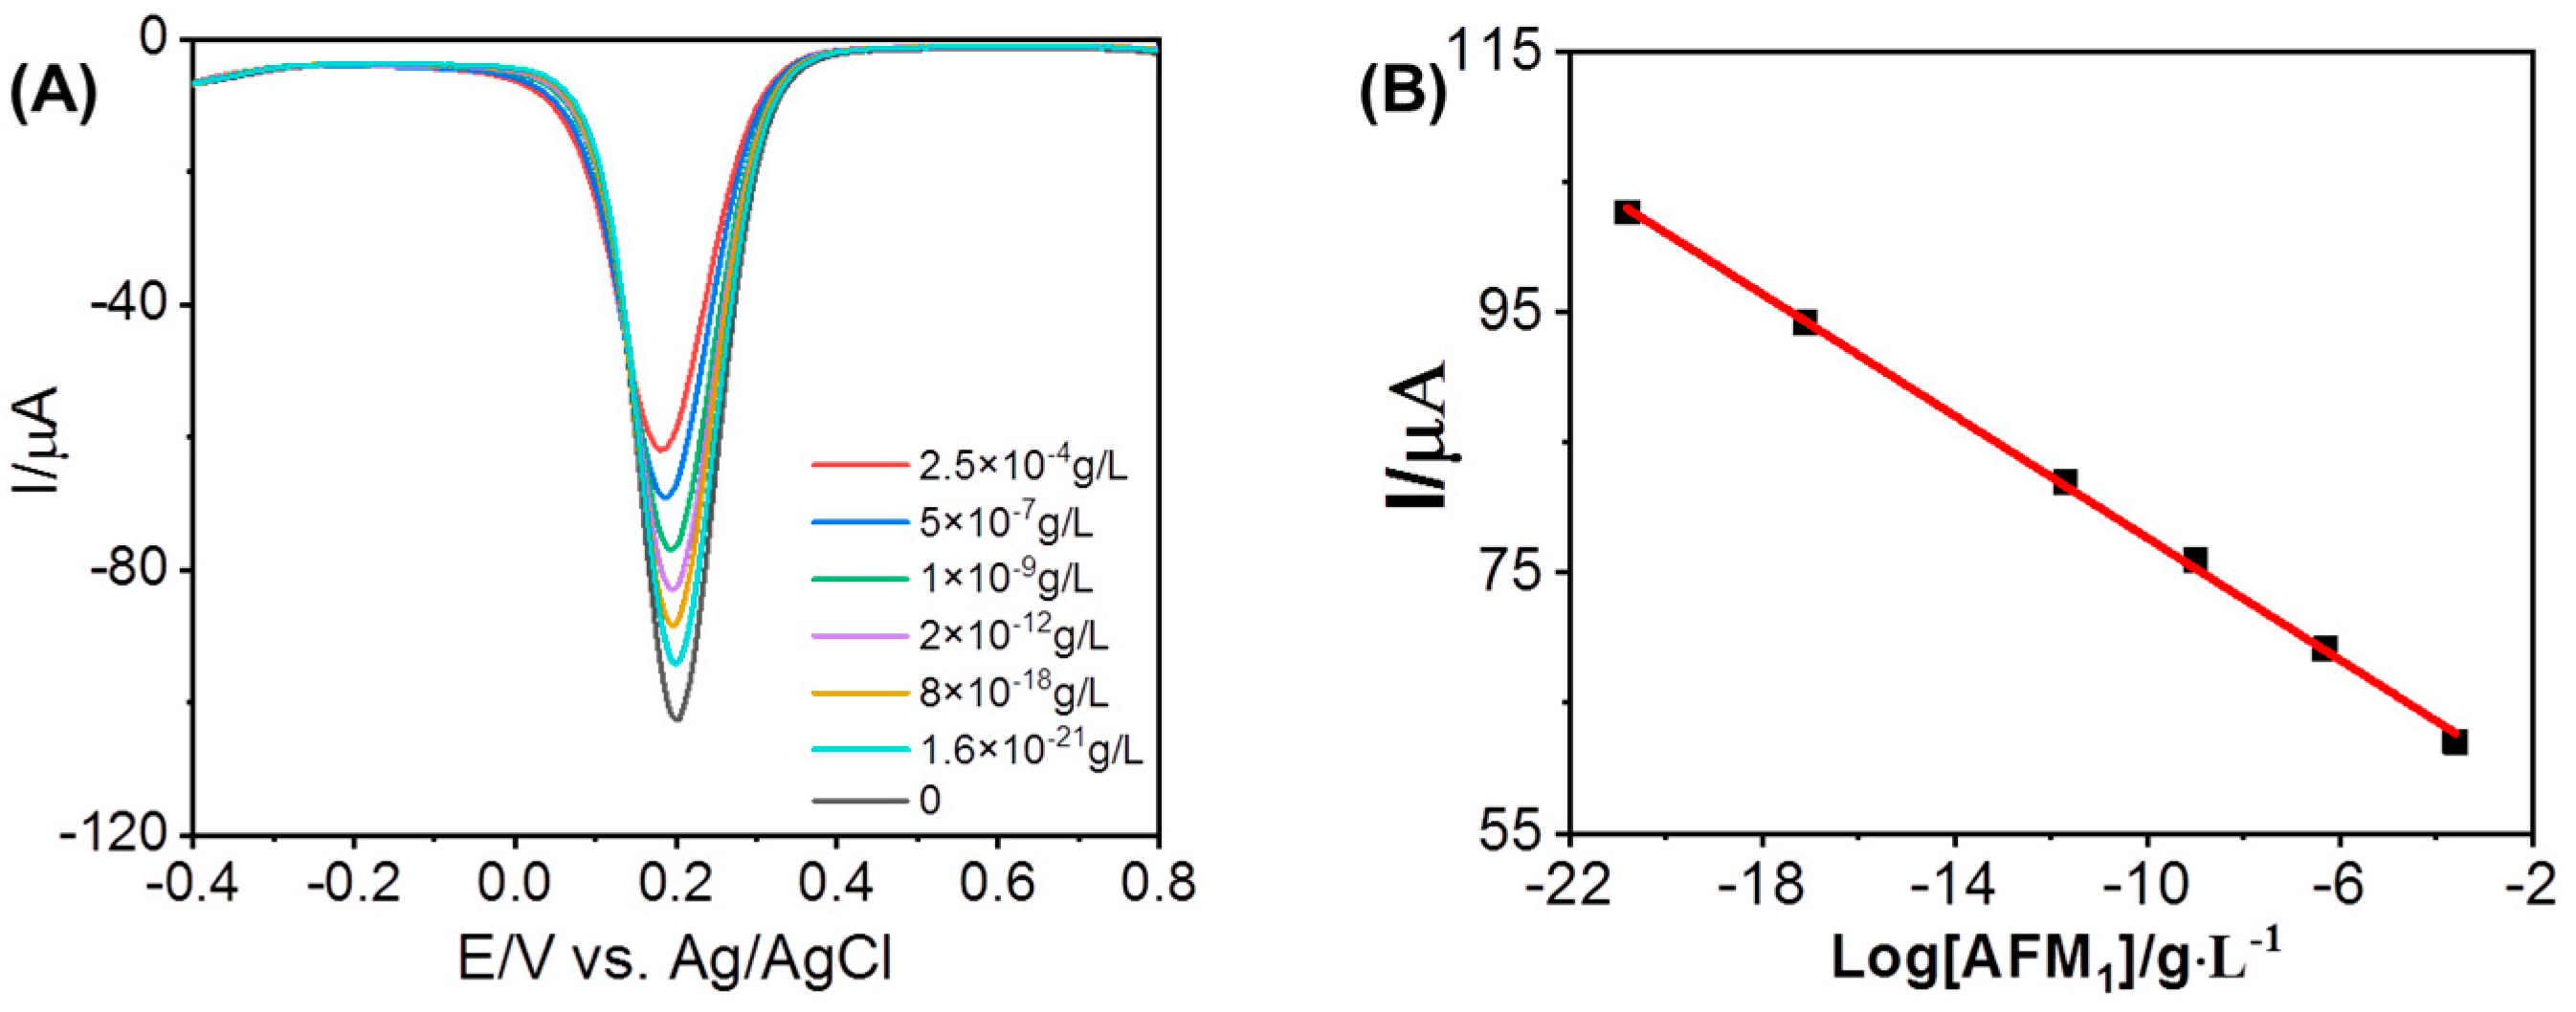
3.3. Electrochemical Response of Fe3+ at AuNPs/GCE in the Presence of AFM1

Differential pulse voltammetry (DPV) is an effective and rapid electroanalytical technique with lower concentration detection limits. The electrochemical responses of Fe3+ were further investigated using the DPV technique, with varying concentrations of AFM1 added to the electrolyte. Figure 4 illustrates the findings, where it can be observed that the peak currents of Fe3+ decrease as the concentrations of AFM1 increase within the range of 1.6 × 10⁻²¹ to 2.5 × 10⁻⁴ g/L. A linear regression equation for AFM1 of I (µA) = −2.34 lg [AFM1] (g/L) + 54.261 with a correlation coefficient of 0.99879 was derived from the data. Each current response was measured three times, yielding a relative standard deviation (RSD) of 4.3%. These results clearly demonstrate the successful application of the developed sensor for ultrasensitive detection of AFM1, with the lowest observed concentration of 1.6 × 10⁻²¹ g/L, surpassing previous reports based on the electrochemical method as listed in Table 1. When the electrode was stored in the refrigerator at 4 °C, the current response remained almost unchanged for about 2 weeks by taking advantage of a highly reliable electrode-preparing process. This raises a crucial question regarding the nature of the reaction occurring between Fe3+ and AFM1, leading to significant suppression of the electrochemical signals of Fe3+ in the presence of AFM1. We also confirmed the capability of the present method for the monitoring of AFB1-NAC and AFB1-lysine, which are another two metabolites from AFB1 as shown in Supplementary Figure S2.
Furthermore, the potential application of this method for detecting other toxins such as zearalenone (ZEA), ochratoxins (OTA), AFB2, and AFG1 was investigated. The DPVs obtained for these toxins are shown in Figure 5. Similar phenomena were observed for AFB2 and AFG1, confirming the method’s suitability for selective detection of aflatoxins.

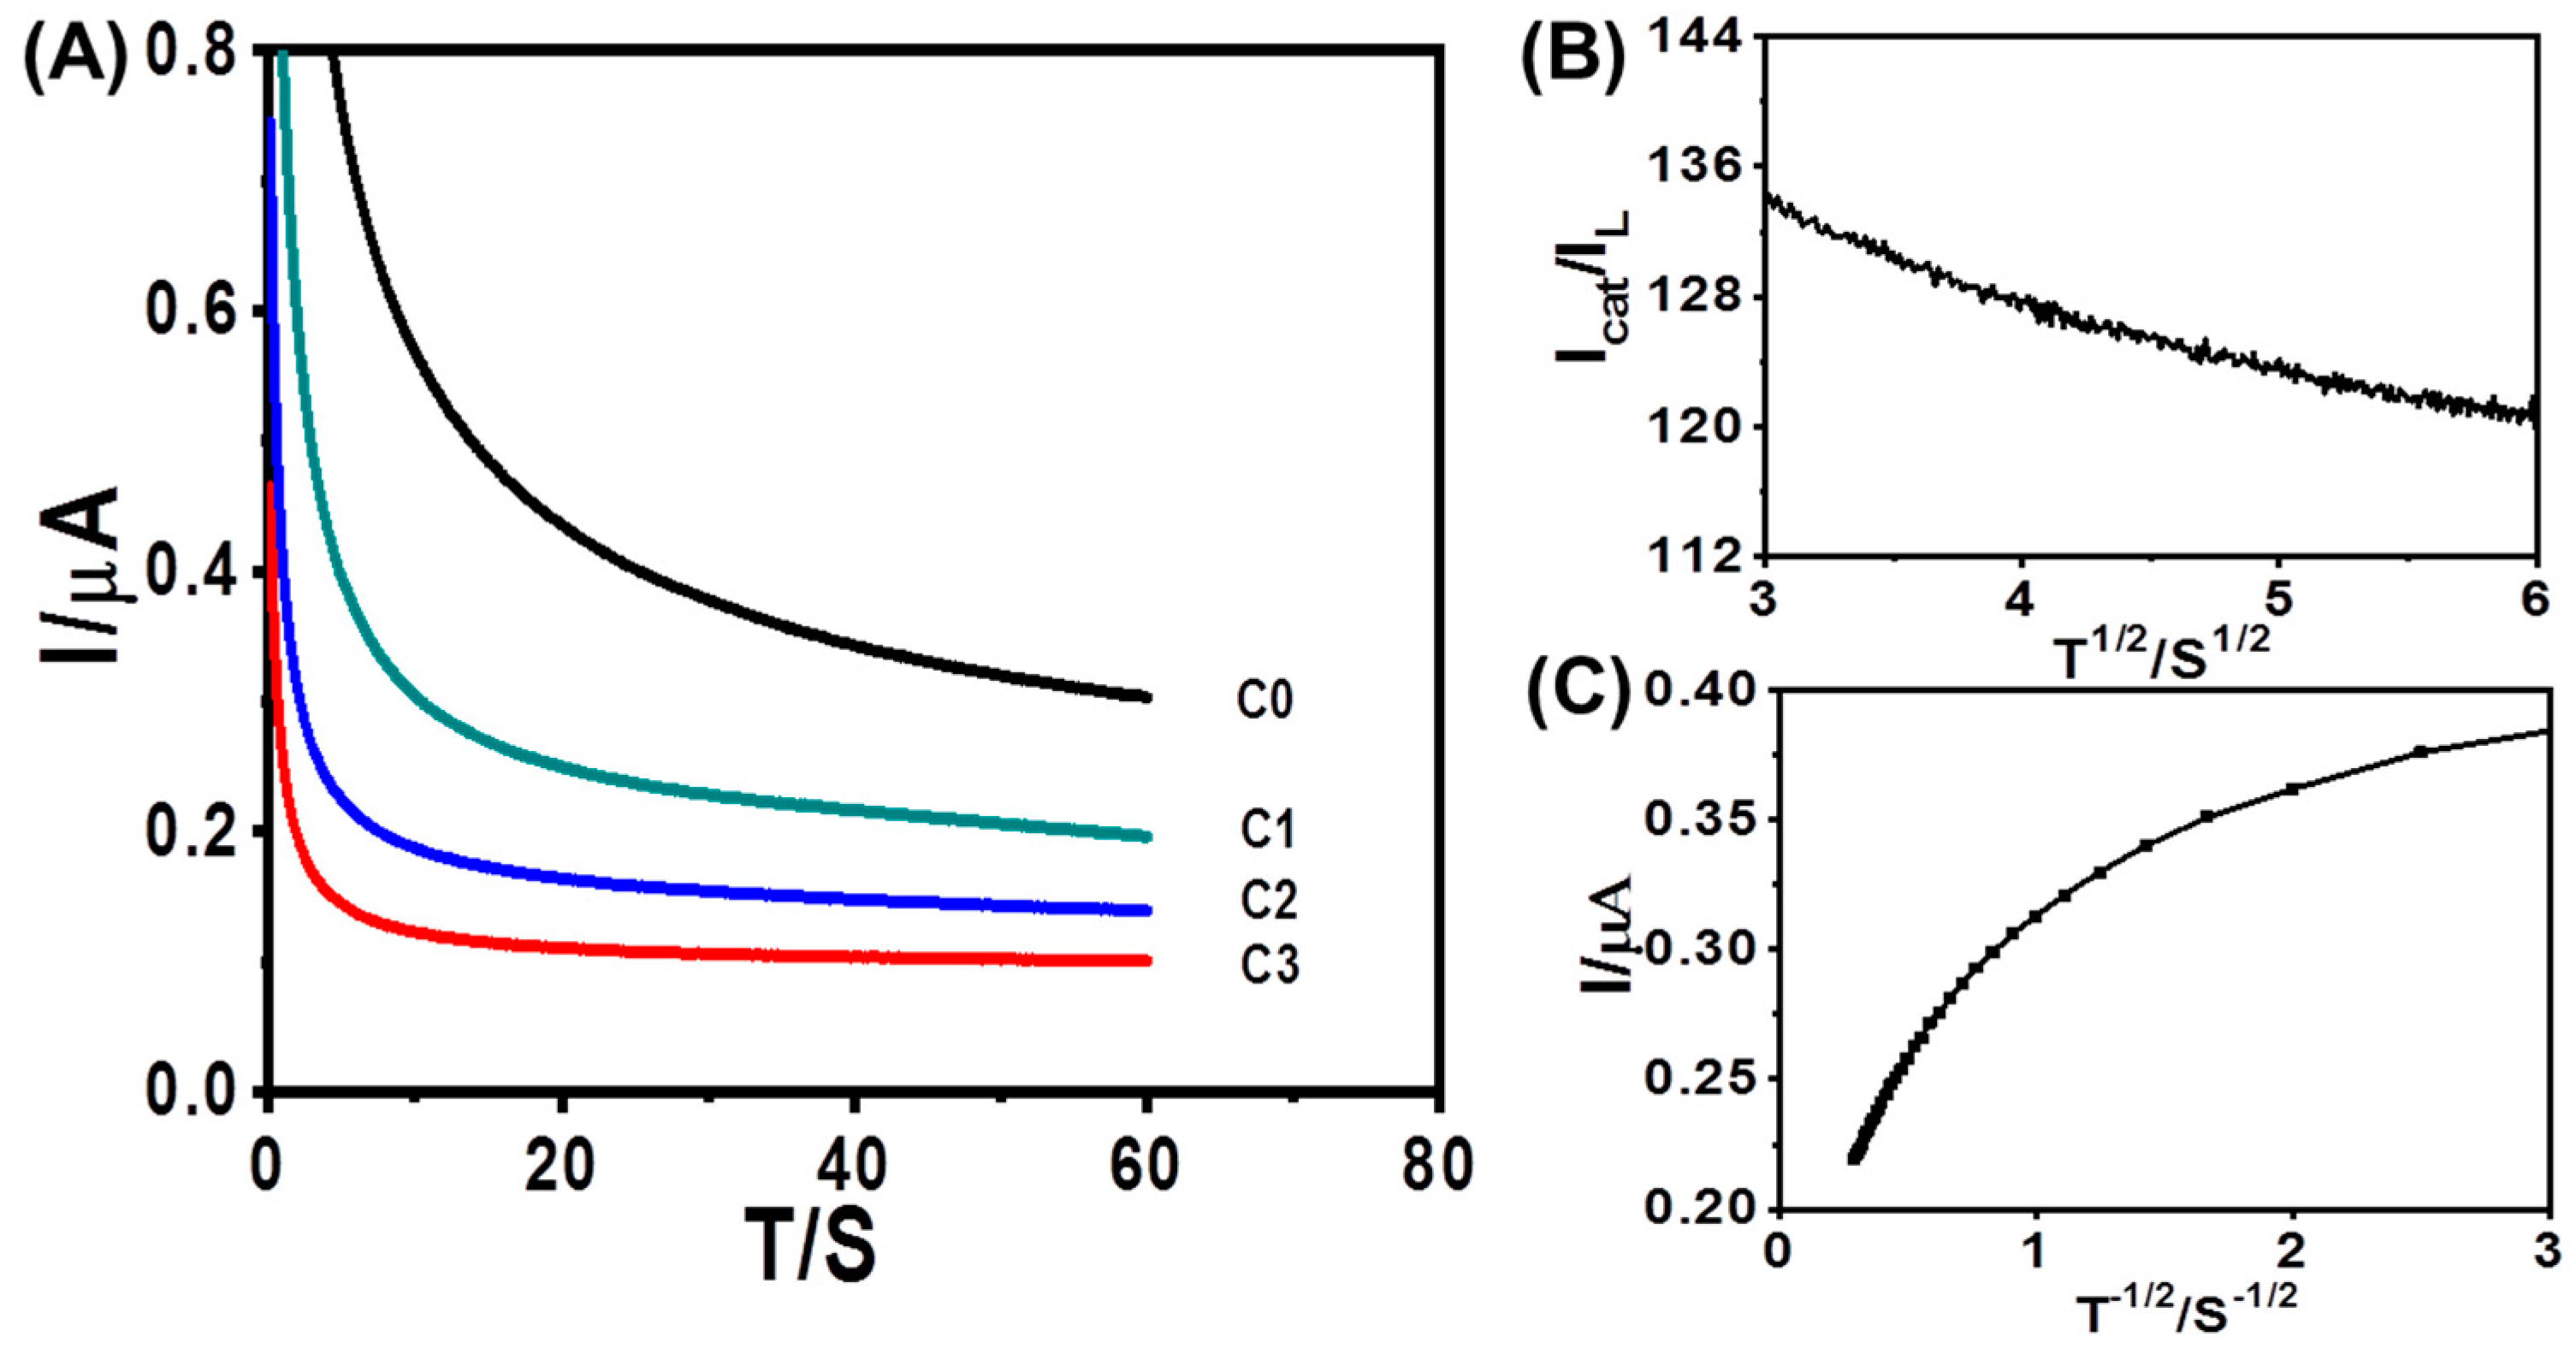
3.4. Chronoamperometric Studies

The diffusion coefficient and catalytic rate constant of Fe3+ in the presence of AFM1 were calculated from chronoamperometry. From the time-current curve, as shown in Figure 6A, it has been deduced that inversely linear dependency exists between the current and the square root of time as shown in Figure 6B. The slope of the linear equation could be obtained by using the Cottrell Equation:
I = nFAD1/21/2t1/2
where n is the number of transferred electrons, F is the Faraday constant, A is the proportion of the electrode, D is the diffusion coefficient of active substance, C is the initial molar concentration, and t is the running time. From the resulting slope, the D value was obtained to be 6.463 × 10⁻⁸ cm2·s−1. Chronoamperometry was also used to measure the catalytic rate constants from the following Equation:
Icat/Id = c1/2π1/2 = π1/2(kCt)
where Icat and Id were the currents of Fe3+ at AuNPs/GCE in the presence and absence of AFM1 and Fe3+, respectively, γ = kCt is the error function, k is the catalytic rate constant, C is the concentration of AFM1 and Fe3+, and t is the running time (s). From the slope of the Icat/Id vs. t1/2 plot, as shown in Figure 6C, the k value was obtained to be 4.8 × 10⁻² cm3·mol−1·s−1.

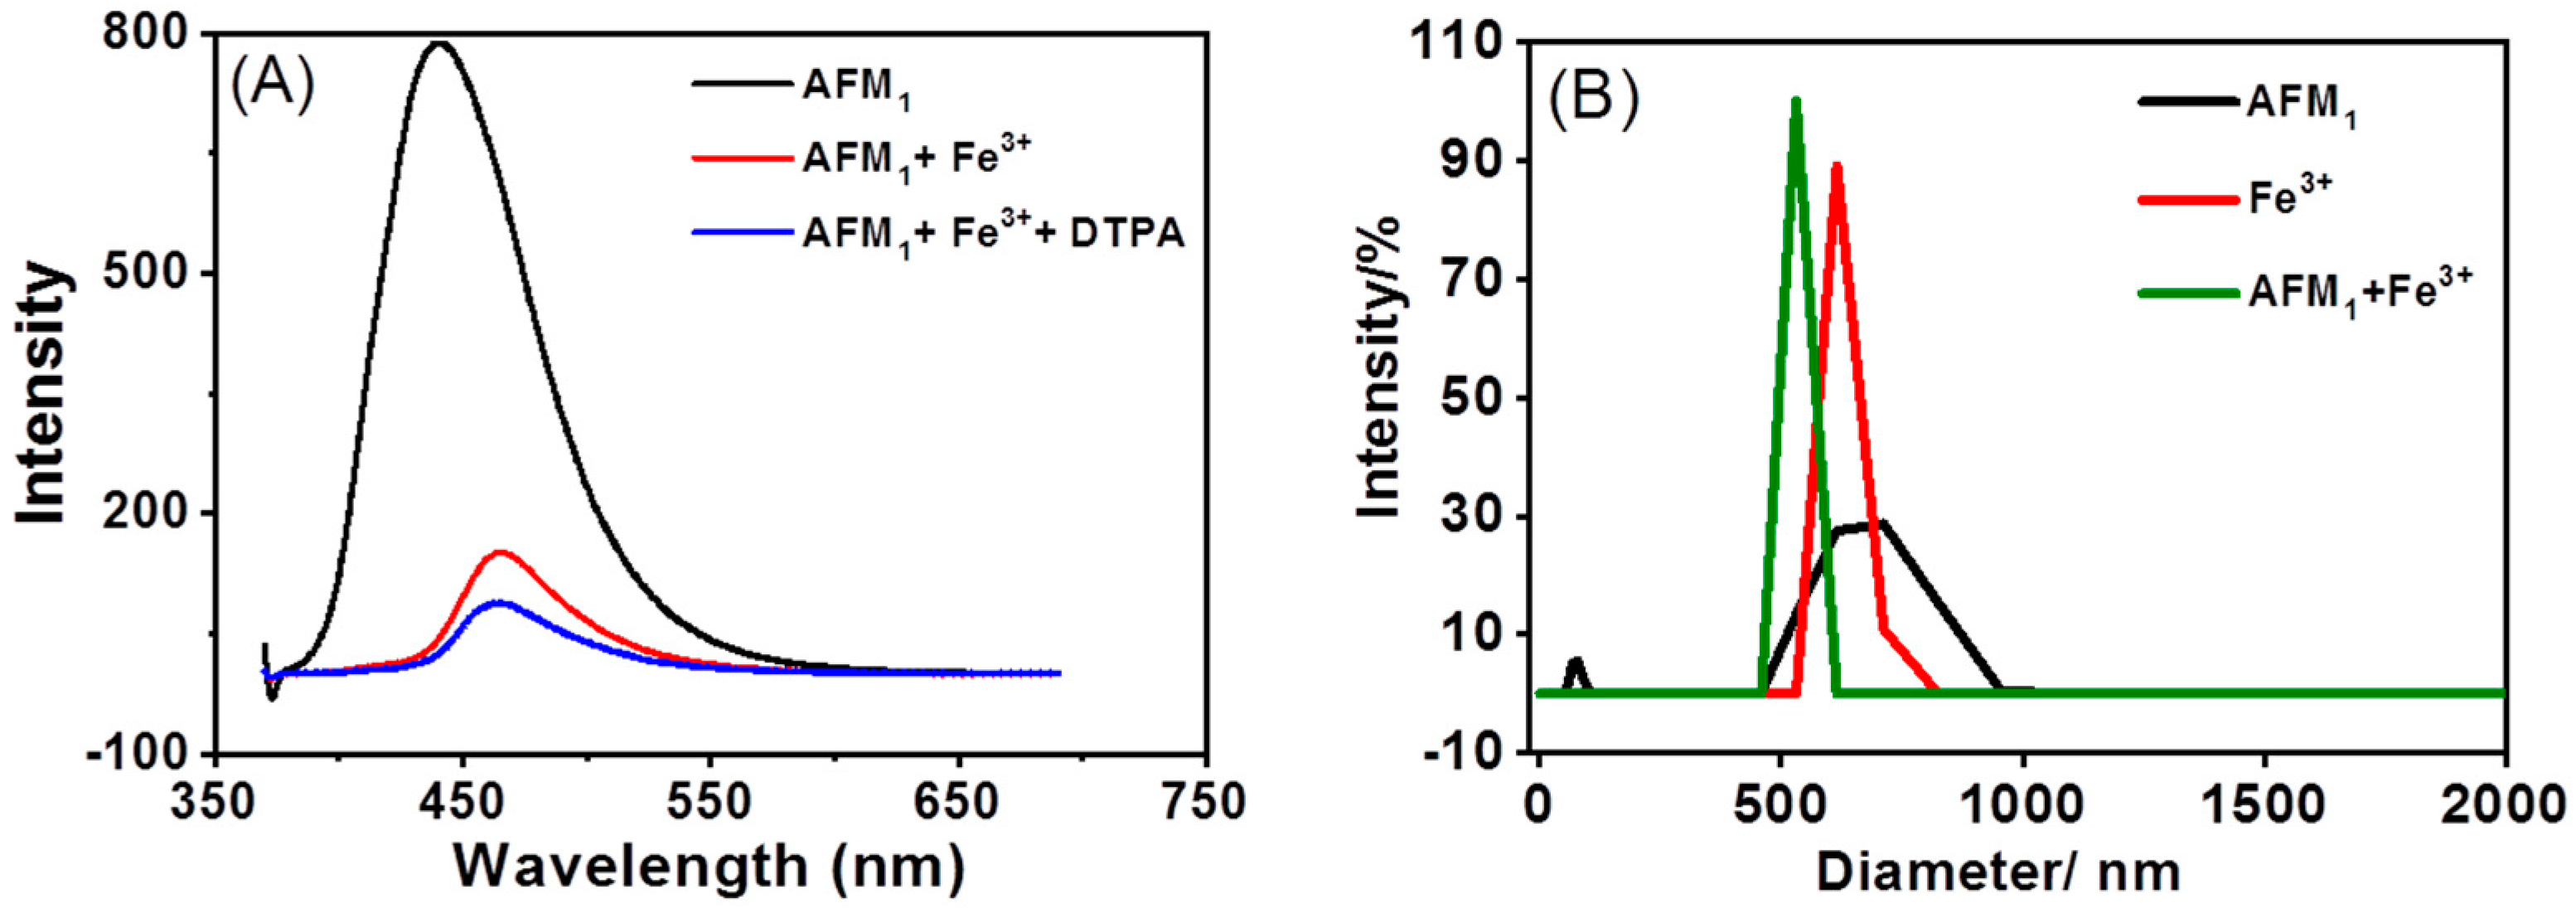
3.5. Effect of Fe3+ Concentration on AFM1 Fluorescence Intensity

The fluorescence intensity of AFM1 in the presence of Fe3+ was observed to decrease as the solution pH values increased, as shown in Supplementary Figure S3. Although, generally, the fluorescence intensity at neutral pH is higher than that in acidic or base environments, there is competition occurring between Fe3+ and H+ assumed by Patel-Sorrentino et al., for the explanation of pH effect [35]. Additionally, in order to further explore the response properties of AFM1 to Fe3+, the fluorescence titration experiment in tris buffer solution was performed with the gradual addition of Fe3+ to AFM1. The concentration of AFM1 was maintained at 1 × 10⁻⁵ M, while the concentration of Fe3+ was over the range from 0 to 5.12 × 10⁻⁶ M. Figure 7A demonstrates that the fluorescence intensity gradually decreases with increasing Fe3+ concentration; to put it another way, the addition of Fe3+ leads to a remarkable fluorescence quenching of AFM1. Once the concentration reaches 8 mM, the fluorescence intensity remains constant at nearly zero and does not change because of quenching saturation. It can be assumed that they may tend to form polymer-like nano-aggregates [36]. The fitting curve is illustrated in Figure 7B, revealing a concentration ratio of AFM1 to Fe3+ of approximately 1:936. Transient fluorescence analysis (Figure 7C) confirms that the fluorescence quenching process is predominantly static, as AFM1, Fe3+, and AFM1+Fe3+ exhibit high coinciding properties. The second-order fitting curve of transient fluorescence spectra by the ordinary least square method is displayed in Supplementary Figure S4. The non-linear Equation is expressed as follows:
Y = A1 × exp(−x/t1) + A2 × exp(−x/t2) + y0 (r2 = 0.99)
where A1 = 3155.94 ± 17.67, t1 = 1250.31 ± 14.00, A2 = 156.62 ± 11.16, t2 = 13,712.75 ± 1427.08, y0 = −3.42 ± 2.37, respectively. A calculated fluorescence lifetime of 12.402 µs by formula t = (A1 × t12) + (A2 × t22)/(A1 × t1 + A2 × t2) proves that the interaction between AFM1 and Fe3+ is ultrafast.
To determine the specific effect of Fe3+, various ions including Na+, K+, Zn2+, Cu2+, Ni2+, Pb2+, Cd2+, Mn2+, Mg2+, and Co2+ were investigated for their interference on the fluorescence intensity of AFM1 under the same conditions. As demonstrated in Figure 7D, none of these ions caused any significant interference even at higher concentrations reflected by negligible responses of AFM1. The fluorescence intensity of AFM1 was also examined in the presence of vitamin B12, a water-soluble vitamin known for its metal ion content, and heme iron. Similar to the effect of Fe3+, the fluorescence intensity gradually decreased with increasing concentration, as depicted in Supplementary Figure S5. These findings indicate a certain interaction between AFM1 and Fe3+.
To evaluate the intensity of this interaction, diethylenetriaminepentaacetic acid (DTPA) was employed as a competitor against AFM1. As it was, DTPA may form a complexation with Fe3+ to release AFM1 so as to observe an increase in fluorescence intensity. Despite the strong Fe3+-binding ability of DTPA, the addition of DTPA (5 mM) to a mixture of AFM1 (4 μg/mL) and Fe3+ (3.2 mM) unexpectedly led to a further decrease in fluorescence intensity, as depicted in Figure 8A. This suggests that DTPA can surprisingly enhance the interaction between AFM1 and Fe3+. The particle size distribution analysis of AFM1+Fe3+ in the 420–600 nm range (Figure 8B) compared with Fe3+ and AFM1 in the range of 500–800 nm and 400–1000 nm, respectively, further confirms their combination.

3.6. Determination of AFM1 in Milk

To assess the effectiveness and feasibility of the proposed method, AFM1 levels in milk were measured. Spike and recovery experiments were conducted by measuring DPV responses in real milk samples with known concentrations of AFM1 added. The AFM1 concentrations in the milk samples were determined through calibration and are presented in Table 2. In all cases, good recoveries were obtained for AFM1 varying from 92.0% to 93.9% considering the level of concentration being analyzed, which is comparatively better than those obtained from spectrofluorimetry and ELISA. These findings strongly demonstrate the practical applicability and reliability of the proposed method.

4. Conclusions

In this study, we have introduced a novel approach for detecting AFM1, utilizing the electrochemical signals of ferricyanide as a sensitive indicator of AFM1 concentrations. Notably, we achieved an unprecedentedly low detection limit of 1.6 × 10⁻²¹ g/L, surpassing previous reports. Furthermore, the recovery rates of 92.4–93.9% obtained from real sample testing underscore the potential of this method as a reliable screening technique for AFM1 detection in food. This approach combines the advantages of nanotechnology, supramolecular recognition techniques, and signal amplification, providing a versatile tool for monitoring aflatoxins. Ongoing investigations aim to elucidate the underlying interaction mechanism between AFM1 and Fe3+. Since most research on the electrochemical detection of aflatoxins is focused on aptamer immunosensors, this work may open new opportunities for Fe3+ as a probe for reversely monitoring coumarin-based small molecules. Meanwhile, this work will provide a beneficial reference for sensing of other toxins in food or pharmaceutical assays.

Supplementary Materials

The following supporting information can be downloaded at: https://www.mdpi.com/article/10.3390/foods12132521/s1, Figure S1: CV response of different modified electrodes in Fe3+ and AFM1; Figure S2: Effect of pH on fluorescence spectrum intensity; Figure S3: The DPV response of AFB1, AFB1-NAC and AFB1-lysine respectively at AuNPs/GCE; Figure S4 The second-order fitting curve of transient fluorescence spectra; Figure S5 Fluorescence intensity at different concentrations of heme iron and VB12.

Author Contributions

Conceptualization, X.L. and M.Z.; methodology, X.L.; software, H.M.; formal analysis, X.L. and H.L.; investigation, M.Z.; resources, D.X. and L.H.; data curation, X.L.; writing—original draft preparation, X.L.; writing—review and editing, D.X. and L.H. All authors have read and agreed to the published version of the manuscript.

Funding

This work was supported by National Key R&D Program of China(2022YFD2100601), National Natural Science Foundation of China (32272278) and Innovation Capability Support Program of Shaanxi Province (Program No. 2023-CX-TD-61).

Data Availability Statement

The data used to support the findings of this study can be made available by the corresponding author upon request.

Conflicts of Interest

The authors declare no conflict interest.

References

  1. Ma, H.H.; Sun, J.Z.; Zhang, Y.; Bian, C.; Xia, S.H.; Zhen, T. Label-free immunosensor based on one-step electrodeposition of chitosan-gold nanoparticles biocompatible film on Au microelectrode for determination of aflatoxin B1 in maize. Biosens. Bioelectron. 2016, 80, 222–229. [Google Scholar] [CrossRef]
  2. Malhotra, B.D.; Srivastava, S.; Ali, M.A.; Singh, C. Nanomaterial-based biosensors for food toxin detection. Appl. Biochem. Biotechnol. 2014, 174, 880–896. [Google Scholar] [CrossRef]
  3. Machida, M.; Gomi, K. Aspergillus: Molecular Biology and Genomics; Horizon Scientific Press: Tsukuba, Japan, 2010. [Google Scholar]
  4. Liu, Y.; Wu, F. Global burden of aflatoxin-induced hepatocellular carcinoma: A risk assessment. Environ. Health Perspect. 2010, 118, 818–824. [Google Scholar] [CrossRef] [Green Version]
  5. Liu, Y.; Chang, C.C.; Marsh, G.M.; Wu, F. Population attributable risk of aflatoxin-related liver cancer: Systematic review and meta-analysis. Eur. J. Cancer 2012, 48, 2125–2136. [Google Scholar] [CrossRef] [PubMed] [Green Version]
  6. Wu, F. Perspective: Time to face the fungal threat. Nature 2014, 516, S7. [Google Scholar] [CrossRef] [PubMed]
  7. Lee, J.; Her, J.Y.; Lee, K.G. Reduction of aflatoxins (B1, B2, G1, and G2) in soybean-based model systems. Food Chem. 2015, 189, 45–51. [Google Scholar] [CrossRef]
  8. Turna, N.S.; Wu, F. Aflatoxin M1 in milk: A global occurrence, intake, & exposure assessment. Trends Food Sci. Tech. 2021, 110, 183–192. [Google Scholar]
  9. Turner, N.W.; Subrahmanyam, S.; Piletsky, S.A. Analytical methods for determination of mycotoxins: A review. Anal. Chim. Acta 2009, 632, 168–180. [Google Scholar] [CrossRef]
  10. Stroka, J.; Anklam, E. Development of a simplified densitometer for the determination of aflatoxins by thin-layer chromatography. J. Chromatogr. A 2000, 904, 263–268. [Google Scholar] [CrossRef]
  11. Kolosova, A.Y.; Shim, W.B.; Yang, Z.Y.; Eremin, S.A.; Chung, D.H. Direct competitive ELISA based on a monoclonal antibody for detection of aflatoxin B1 stabilization of ELISA kit components and application to grain samples. Anal. Bioanal. Chem. 2006, 384, 286–294. [Google Scholar] [CrossRef]
  12. Khayoon, W.S.; Saad, B.; Yan, C.B.; Hashim, N.H.; Ali, A.S.M.; Salleh, M.I.; Salleh, B. Determination of aflatoxins in animal feeds by HPLC with multifunctional column clean-up. Food Chem. 2010, 118, 882–886. [Google Scholar] [CrossRef]
  13. Kav, K.; Col, R.; Tekinsen, K.K. Detection of aflatoxin M1 levels by ELISA in white-brined Urfa cheese consumed in Turkey. Food Control 2011, 22, 1883–1886. [Google Scholar] [CrossRef]
  14. Selvaraj, J.N.; Zhou, L.; Wang, Y.; Zhao, Y.J.; Xing, F.G.; Dai, X.F.; Liu, Y. Mycotoxin detection-recent trends at global level. Integr. Agric. 2015, 14, 2265–2281. [Google Scholar] [CrossRef]
  15. Abnous, K.; Danesh, N.M.; Alibolandi, M.; Ramezani, M.; Emrani, A.S.; Zolfaghari, R.; Taghdisi, S.M. A new amplified π-shape electrochemical aptasensor for ultrasensitive detection of aflatoxin B1. Biosens. Bioelectron. 2017, 94, 374–379. [Google Scholar] [CrossRef]
  16. Ahamadi, S.F.; Hojjatoleslamy, M.; Kiani, H.; Molavi, H. Monitoring of aflatoxin M1 in milk using a novel electrochemical aptasensor based on reduced grapheme oxide and gold nanoparticles. Food Chem. 2021, 373, 131321. [Google Scholar] [CrossRef]
  17. Shadjou, R.; Hasanzadeh, M.; Heidar-poor, M.; Shadjou, N. Electrochemical monitoring of aflatoxin M1 in milk samples using silver nanoparticles dispersed on α-cyclodextrin-GQDs nanocomposite. J. Mol. Recognit. 2018, 31, e2699. [Google Scholar] [CrossRef]
  18. Perez-Fernandez, B.; Escosura-Muniz, A.D.L. Electrochemical biosensors based on nanomaterials for aflatoxins detection: A review (2015–2021). Anal. Chim. Acta 2022, 1212, 339658. [Google Scholar] [CrossRef]
  19. Gevaerd, A.; Banks, C.E.; Bergamini, M.F.; Marcolino-Junior, L.H. Nanomodified screen-printed electrode for direct determination of aflatoxin B1 in malted barley samples. Sens. Actuator B Chem. 2020, 307, 127547. [Google Scholar] [CrossRef]
  20. Suzuki, Y.; Komatsu, H.; Ikeda, T.; Satio, N.; Araki, S.; Citterio, D.; Hisamoto, D.; Kitamura, Y.; Kubota, T.; Nakagawa, J.; et al. Design and Synthesis of Mg2+ Selective Fluoroionophores Based on a Coumarin Derivative and Application for Mg2+ Measurement in a Living Cell. Anal. Chem. 2002, 74, 1423–1428. [Google Scholar] [CrossRef]
  21. Ciesienski, K.L.; Hyman, L.M.; Derisavifard, S.; Franz, K.J. Toward the detection of cellular copper(II) by a light-activated fluorescence increase. Inorg. Chem. 2010, 49, 6808–6810. [Google Scholar] [CrossRef] [Green Version]
  22. Sheng, J.R.; Feng, F.; Qiang, Y.; Liang, F.G.; Sen, L.; Wei, F.H. A coumarin-derived fluorescence chemosensors selective for copper(II). Anal. Lett. 2008, 41, 2203–2213. [Google Scholar] [CrossRef]
  23. Lim, N.C.; Brückner, C. DPA-substituted coumarins as chemosensors for zinc(II): Modulation of the chemosensory characteristics by variation of the position of the chelate on the coumarin. Chem. Commun. 2004, 10, 1094–1095. [Google Scholar] [CrossRef] [PubMed]
  24. Kumar, R.; Gahlyan, P.; Yadav, N.; Bhandari, M.; Kakkar, R.; Manu, D.; Prasad, A.K. Bis-triazolylated-1,4-dihydropyridin—Highly selective hydrophilic fluorescent probe for detection of Fe3+. Dyes Pigm. 2017, 147, 420–428. [Google Scholar] [CrossRef]
  25. Xu, Y.K.; Liu, X.G.; Zhao, J.Y.; Wang, H.Y.; Liu, Z.; Yang, X.F.; Pei, M.S.; Zhang, G.Y. A new “ON–OFF–ON” fluorescent probe for sequential detection of Fe3+ and PPi based on 2-pyridin-2-ylethanamine and benzimidazo [2,1-a]benz[de]isoquinoline-7-one-12-carboxylic acid. New J. Chem. 2019, 43, 474–480. [Google Scholar] [CrossRef]
  26. Wang, W.; Wu, J.; Liu, Q.L.; Gao, Y.; Liu, H.M.; Zhao, B. A highly selective coumarin-based chemosensor for the sequential detection of Fe3+and pyrophosphate and its application in living cell imaging. Tetrahedron Lett. 2018, 59, 1860–1865. [Google Scholar] [CrossRef]
  27. Zhao, B.; Liu, T.; Fang, Y.; Wang, L.Y.; Song, B.; Deng, Q.G. Two ‘turn-off’ Schiff base fluorescence sensors based on phenanthro [9,10-d]imidazole-coumarin derivatives for Fe3+ in aqueous solution. Tetrahedron Lett. 2016, 57, 4417–4423. [Google Scholar] [CrossRef]
  28. Luna, D.M.N.; Avelino, K.Y.P.S.; Cordeiro, M.T.; Andrade, C.A.S.; Oliveira, M.D.L. Electrochemical immunosensor for dengue virus serotypes based on 4-mercaptobenzoic acid modified gold nanoparticles on self-assembled cysteine monolayers. Sens. Actuators B Chem. 2015, 220, 565–572. [Google Scholar] [CrossRef]
  29. Jalalian, S.H.; Ramezani, M.; Danesh, N.M.; Alibolandi, M.; Abnous, K.; Taghdisi, S.M. A novel electrochemical aptasensor for detection of aflatoxin M1 based on target-induced immobilization of gold nanoparticles on the surface of electrode. Biosens. Bioelectron. 2018, 117, 487–492. [Google Scholar] [CrossRef]
  30. Micheli, L.; Grecco, R.; Badea, M.; Moscone, D.; Palleschi, G. An electrochemical immunosensor for aflatoxin M1 determination in milk using screen-printed electrodes. Biosens. Bioelectron. 2006, 21, 588–596. [Google Scholar] [CrossRef] [Green Version]
  31. Nguyen, B.H.; Tran, L.D.; Do, Q.P.; Nguyen, H.L.; Tran, N.H.; Nguyen, P.X. Label-free detection of aflatoxin M1 with electrochemical Fe3O4/polyaniline-based aptasensor. Mater. Sci. Eng. C 2013, 33, 2229–2234. [Google Scholar] [CrossRef]
  32. Smolko, V.; Shurpik, D.; Porfireva, A.; Evtugyn, G.; Stoikov, I.; Hianik, T. Electrochemical Aptasensor Based on Poly(Neutral red) and Carboxylated Pillar [5]arene for Sensitive Determination of Aflatoxin M1. Electroanalysis 2018, 30, 486–496. [Google Scholar] [CrossRef]
  33. Karczmarczyk, A.; Baeumner, A.J.; Feller, K.H. Rapid and sensitive inhibition-based assay for the electrochemical detection of Ochratoxin A and Aflatoxin M1 in red wine and milk. Electrochim. Acta 2017, 243, 82–89. [Google Scholar] [CrossRef]
  34. Dinçkaya, E.; Kınık, Ö.; Sezgintürk, M.K.; Altuğ, Ç.; Akkoca, A. Development of an impedimetric aflatoxin M1 biosensor based on a DNA probe and gold nanoparticles. Biosens. Bioelectron. 2011, 26, 3806–3811. [Google Scholar] [CrossRef] [PubMed]
  35. Patel-Sorrentino, N.; Mounier, S.; Benaim, J.Y. Excitation–emission fluorescence matrix to study pH influence on organic matter fluorescence in the Amazon basin rivers. Water Res. 2002, 36, 2571–2581. [Google Scholar] [CrossRef]
  36. Hussain, E.; Li, Y.X.; Cheng, C.; Zhuo, H.P.; Shahzad, S.A.; Ali, S.; Ismail, M.; Qi, H.; Yu, C. Benzo[ghi]perylene and coronene as ratiometric fluorescence probes for the selective sensing of nitroaromatic explosives. Talanta 2020, 207, 120316. [Google Scholar] [CrossRef] [PubMed]
Figure 1. The preparation of AuNPs−modified glassy carbon electrode. (A) Schematic diagram of AuNPs modification onto glassy carbon electrode; (B) CVs of Au electrodeposition onto GCE in 0.1 M pH 7.0 PBS; (C) SEM image of AuNPs/GCE.
Foods 12 02521 g001
Figure 2. The improved performance of AuNPs−modified glassy carbon electrode. (A) CVs of ferricyanide at GCE and AuNPs/GCE in the presence of AFM1; (B) Nyquist Plot (Z′ vs. −Z′′) of GCE and AuNPs/GCE.
Foods 12 02521 g002
Figure 3. The effects of different pH on the sensitivity of AuNPs/GCE to Fe3+ and AFM1. (A) DPVs of ferricyanide at AuNPs/GCE in 0.1 M PBS in the presence of AFM1 with pH ranging from 4.0 to 8.0. (B) CVs of ferricyanide GCE in 0.1 M pH 7.0 PBS at AuNPs/GCE in the presence of AFM1 at various scan rates (10, 20, 40, 60, 80, 100, 150, 200, and 300 mV·s−1, respectively). Inset shows plots of Ipa and Ipc (μA) versus the square root of the scan rate.
Foods 12 02521 g003
Figure 4. (A) DPVs profile of 5 mM ferricyanide at AuNPs/AGCE in the presence of AFM1 at different concentrations (2.5 × 10⁻⁴, 5 × 10⁻⁷, 1 × 10⁻⁹, 2 × 10⁻¹², 8 × 10⁻¹⁸, 1.6 × 10⁻²¹ g/L, and 0, respectively). (B) Inset shows the plot of Ipa as a Logarithmic function of the concentration of AFM1.
Foods 12 02521 g004
Figure 5. DPVs profile of ferricyanide at AuNPs/GCE in 0.1M PBS in the presence of ZEA (A), OTA (B), AFB2 (C), and AFG1 (D) at different concentrations.
Foods 12 02521 g005
Figure 6. Amperomertric i-t Curves of AFM1 with different concentrations (C0: 0, C1: 6.25 × 10⁻¹⁰ g/L, C2:2.5 × 10⁻¹⁵ g/L, and C3:1 × 10⁻²⁰ g/L) at AuNPs/GCE in the presence of 5 mM [Fe(CN)6]4−. (A) Potential is 400 mV. (B) Dependence of Icatal/IL on t1/2. (C) Dependency of transient current on t−1/2.
Foods 12 02521 g006
Figure 7. The specific interaction between Fe3+ and AFM1. (A) Effects of Fe3+ addition on fluorescence emission of AFM1; (B) Fluorescence intensity as a function of Fe3+ concentration; (C) Transient fluorescence lifetime of AFM1, AFM1 + Fe3+; (D) Effects of other metal ions on the fluorescence emission of AFM1.
Foods 12 02521 g007
Figure 8. Evaluation on the intensity of interaction between AFM1 and Fe3+. (A) The Fluorescence intensity of AFM1, AFM1+Fe3+, and AFM1+Fe3++DTPA. (B) The Particle size distribution of AFM1, Fe3+, and AFM1+Fe3+.
Foods 12 02521 g008
Table 1. Comparison of analytical performance for the electrochemical detection of AFM1.
SystemDetection LimitLinear RangeRef.
A-CD-GQDs-AgNPs/GCE2 μm0.015–25 μM[17]
Apt-CS-AuNPs/SPGE0.9 ng/L2–600 ng/L[29]
anti-AFM1/SPGE2.5 × 10−8 g/kg3 × 10−8–1.6 × 10⁻⁷ g/kg[30]
Fe3O4-PANi/IDE1.98 ng/mL6–60 ng/mL[31]
NR/P [5]A-COOH/GCE0.5 ng/L5–120 ng/L[32]
AuNPs/SPE37 pg/mL-[33]
ss-HSDNA-AuNPs/GE0.36 ng/mL1–14 ng/mL[34]
Fe3+-AuNPs/GCE1.6 × 10−21 g/L1.6 × 10−21–2.5 × 10⁻⁴ g/LThis work
Table 2. The determination of AFM1 in milk with three methods.
MethodAdd/μMDetected/μMRecovery%
This work2.962.7893.9
8.918.2492.4
23.7822.1793.2
Spectrofluorimetry2.21.986
3.162.578
12.6510.0884
ELISA2.62.3992.1
8.417.8293
20.2518.7192.4
Disclaimer/Publisher’s Note: The statements, opinions and data contained in all publications are solely those of the individual author(s) and contributor(s) and not of MDPI and/or the editor(s). MDPI and/or the editor(s) disclaim responsibility for any injury to people or property resulting from any ideas, methods, instructions or products referred to in the content.

