
The Application of Ultraviolet Treatment to Prolong the Shelf Life of Chilled Beef
Abstract
:1. Introduction
2. Materials and Methods
2.1. Sample Preparation
2.2. Optimization of UV Sterilization Conditions
2.3. Evaluation of Preservation Effect
2.4. Index Determination
2.4.1. UV Intensity Detection
2.4.2. Total Bacterial Count
2.4.3. Sensory Evaluation
2.4.4. Color [24]
2.4.5. Thiobarbituric Acid Reactive Substances (TBARS)
2.4.6. Total Volatile Basic Nitrogen (TVB-N)
2.4.7. pH
2.5. Statistical Analysis
3. Results and Discussion
3.1. Evaluation of UV Sterilization Conditions
3.1.1. UV Sterilization Intensity
3.1.2. Effect of UV Sterilization on Total Bacterial Count and Lipid Oxidation
3.1.3. Effect of UV Sterilization on Color
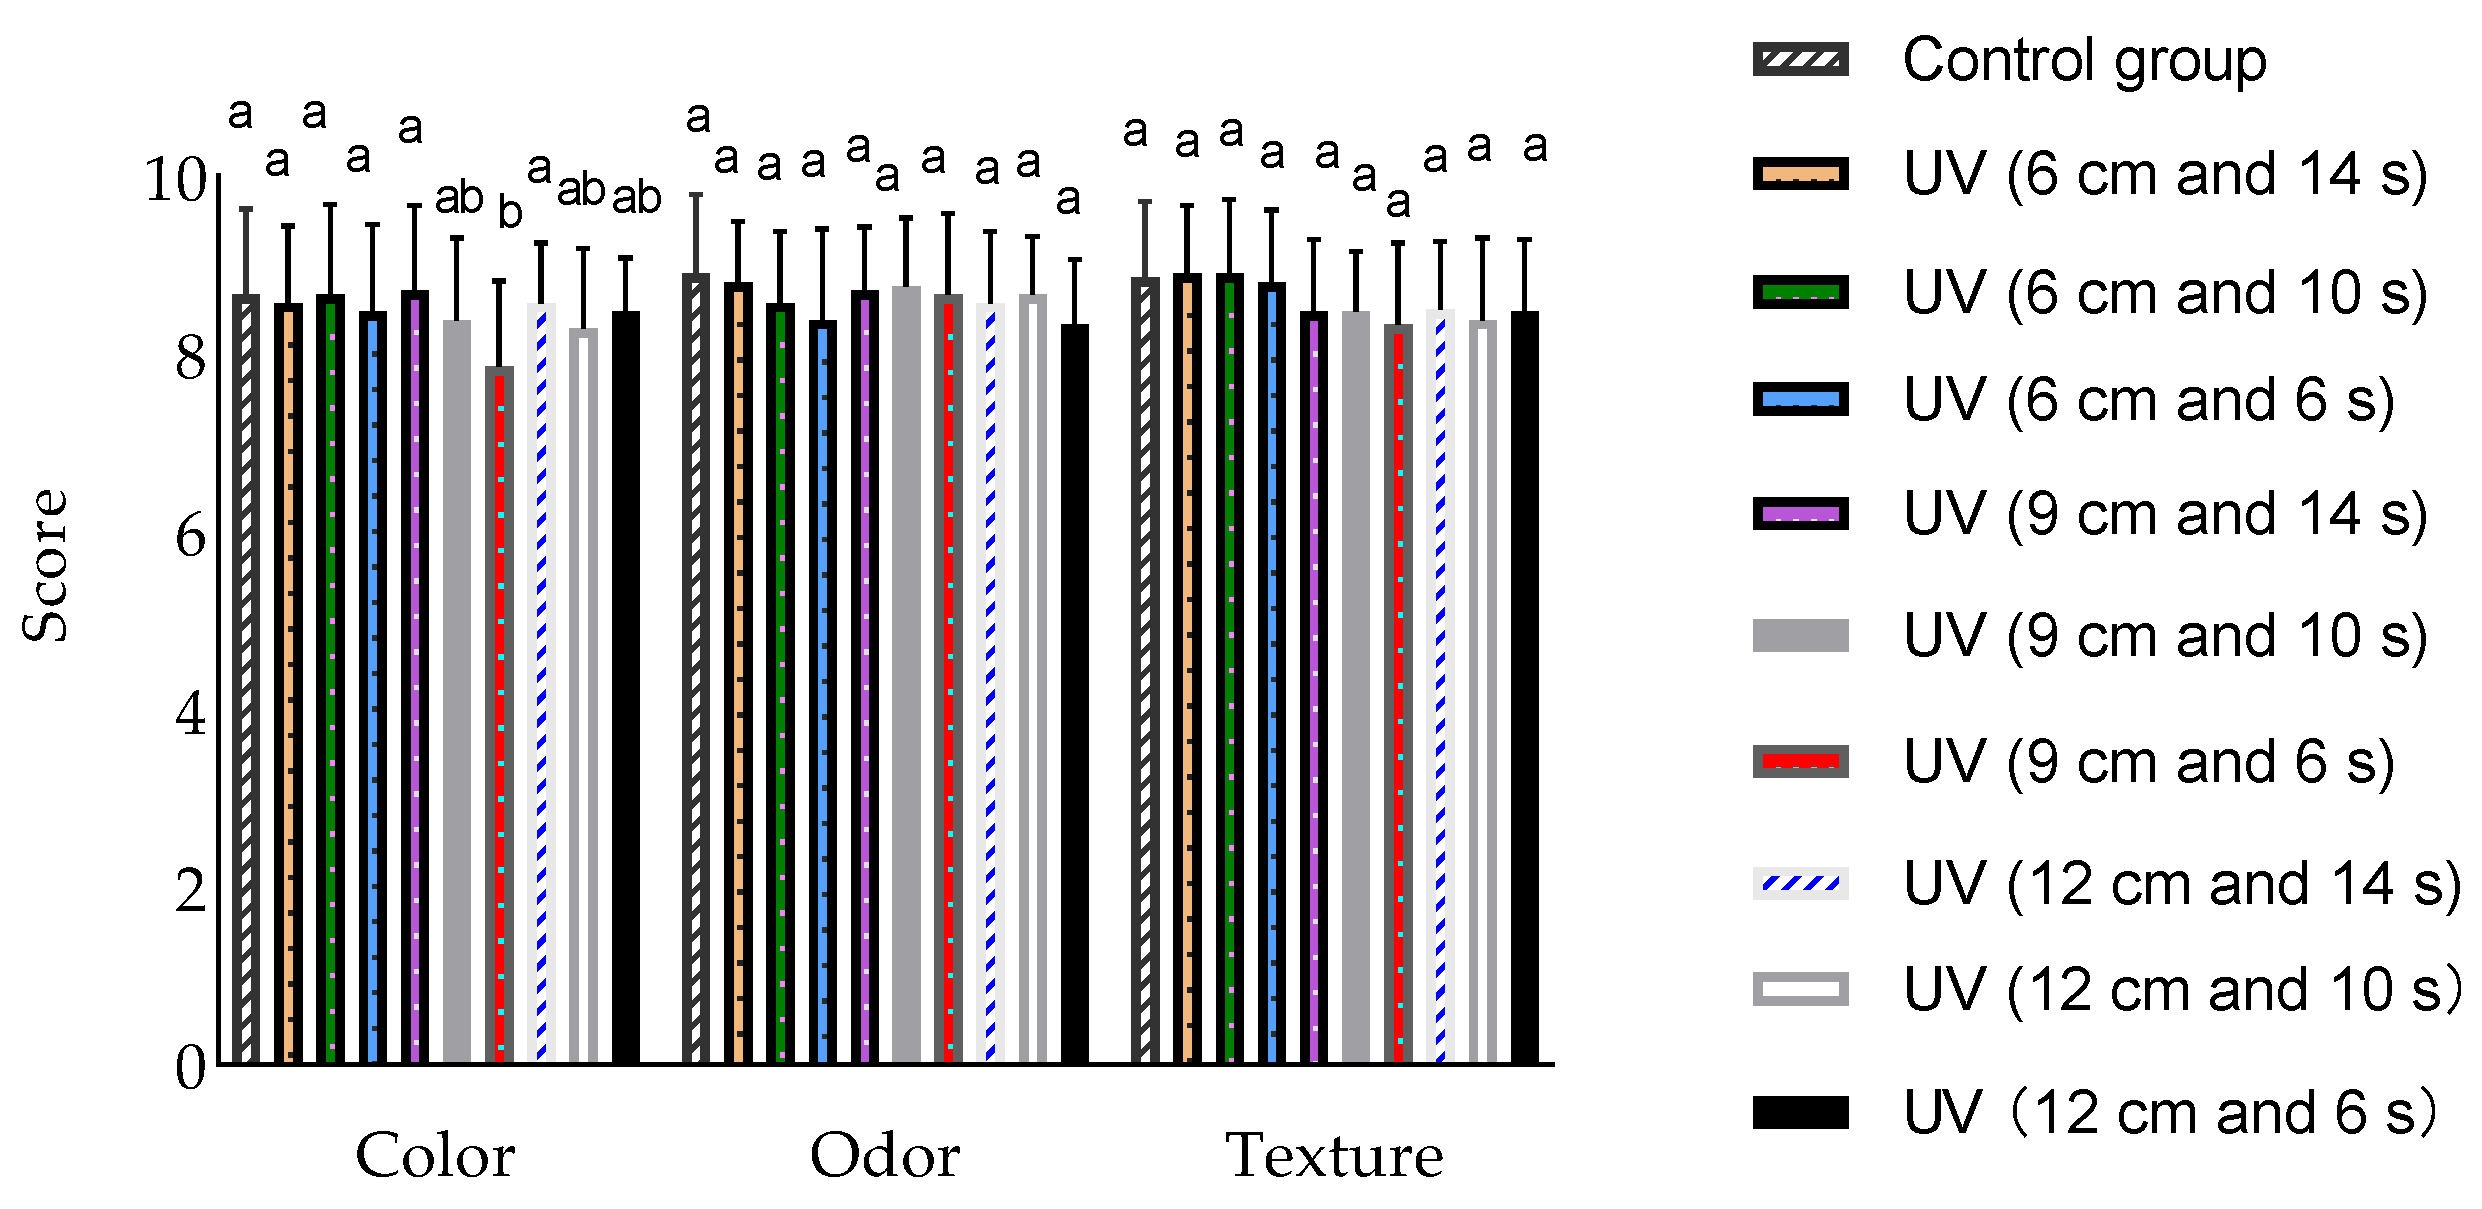
3.1.4. Effect of UV Sterilization on Sensory Evaluation
3.2. Preservation Effect during Storage
3.2.1. Total Bacterial Count
3.2.2. Total Volatile Basic Nitrogen (TVB-N)
3.2.3. pH
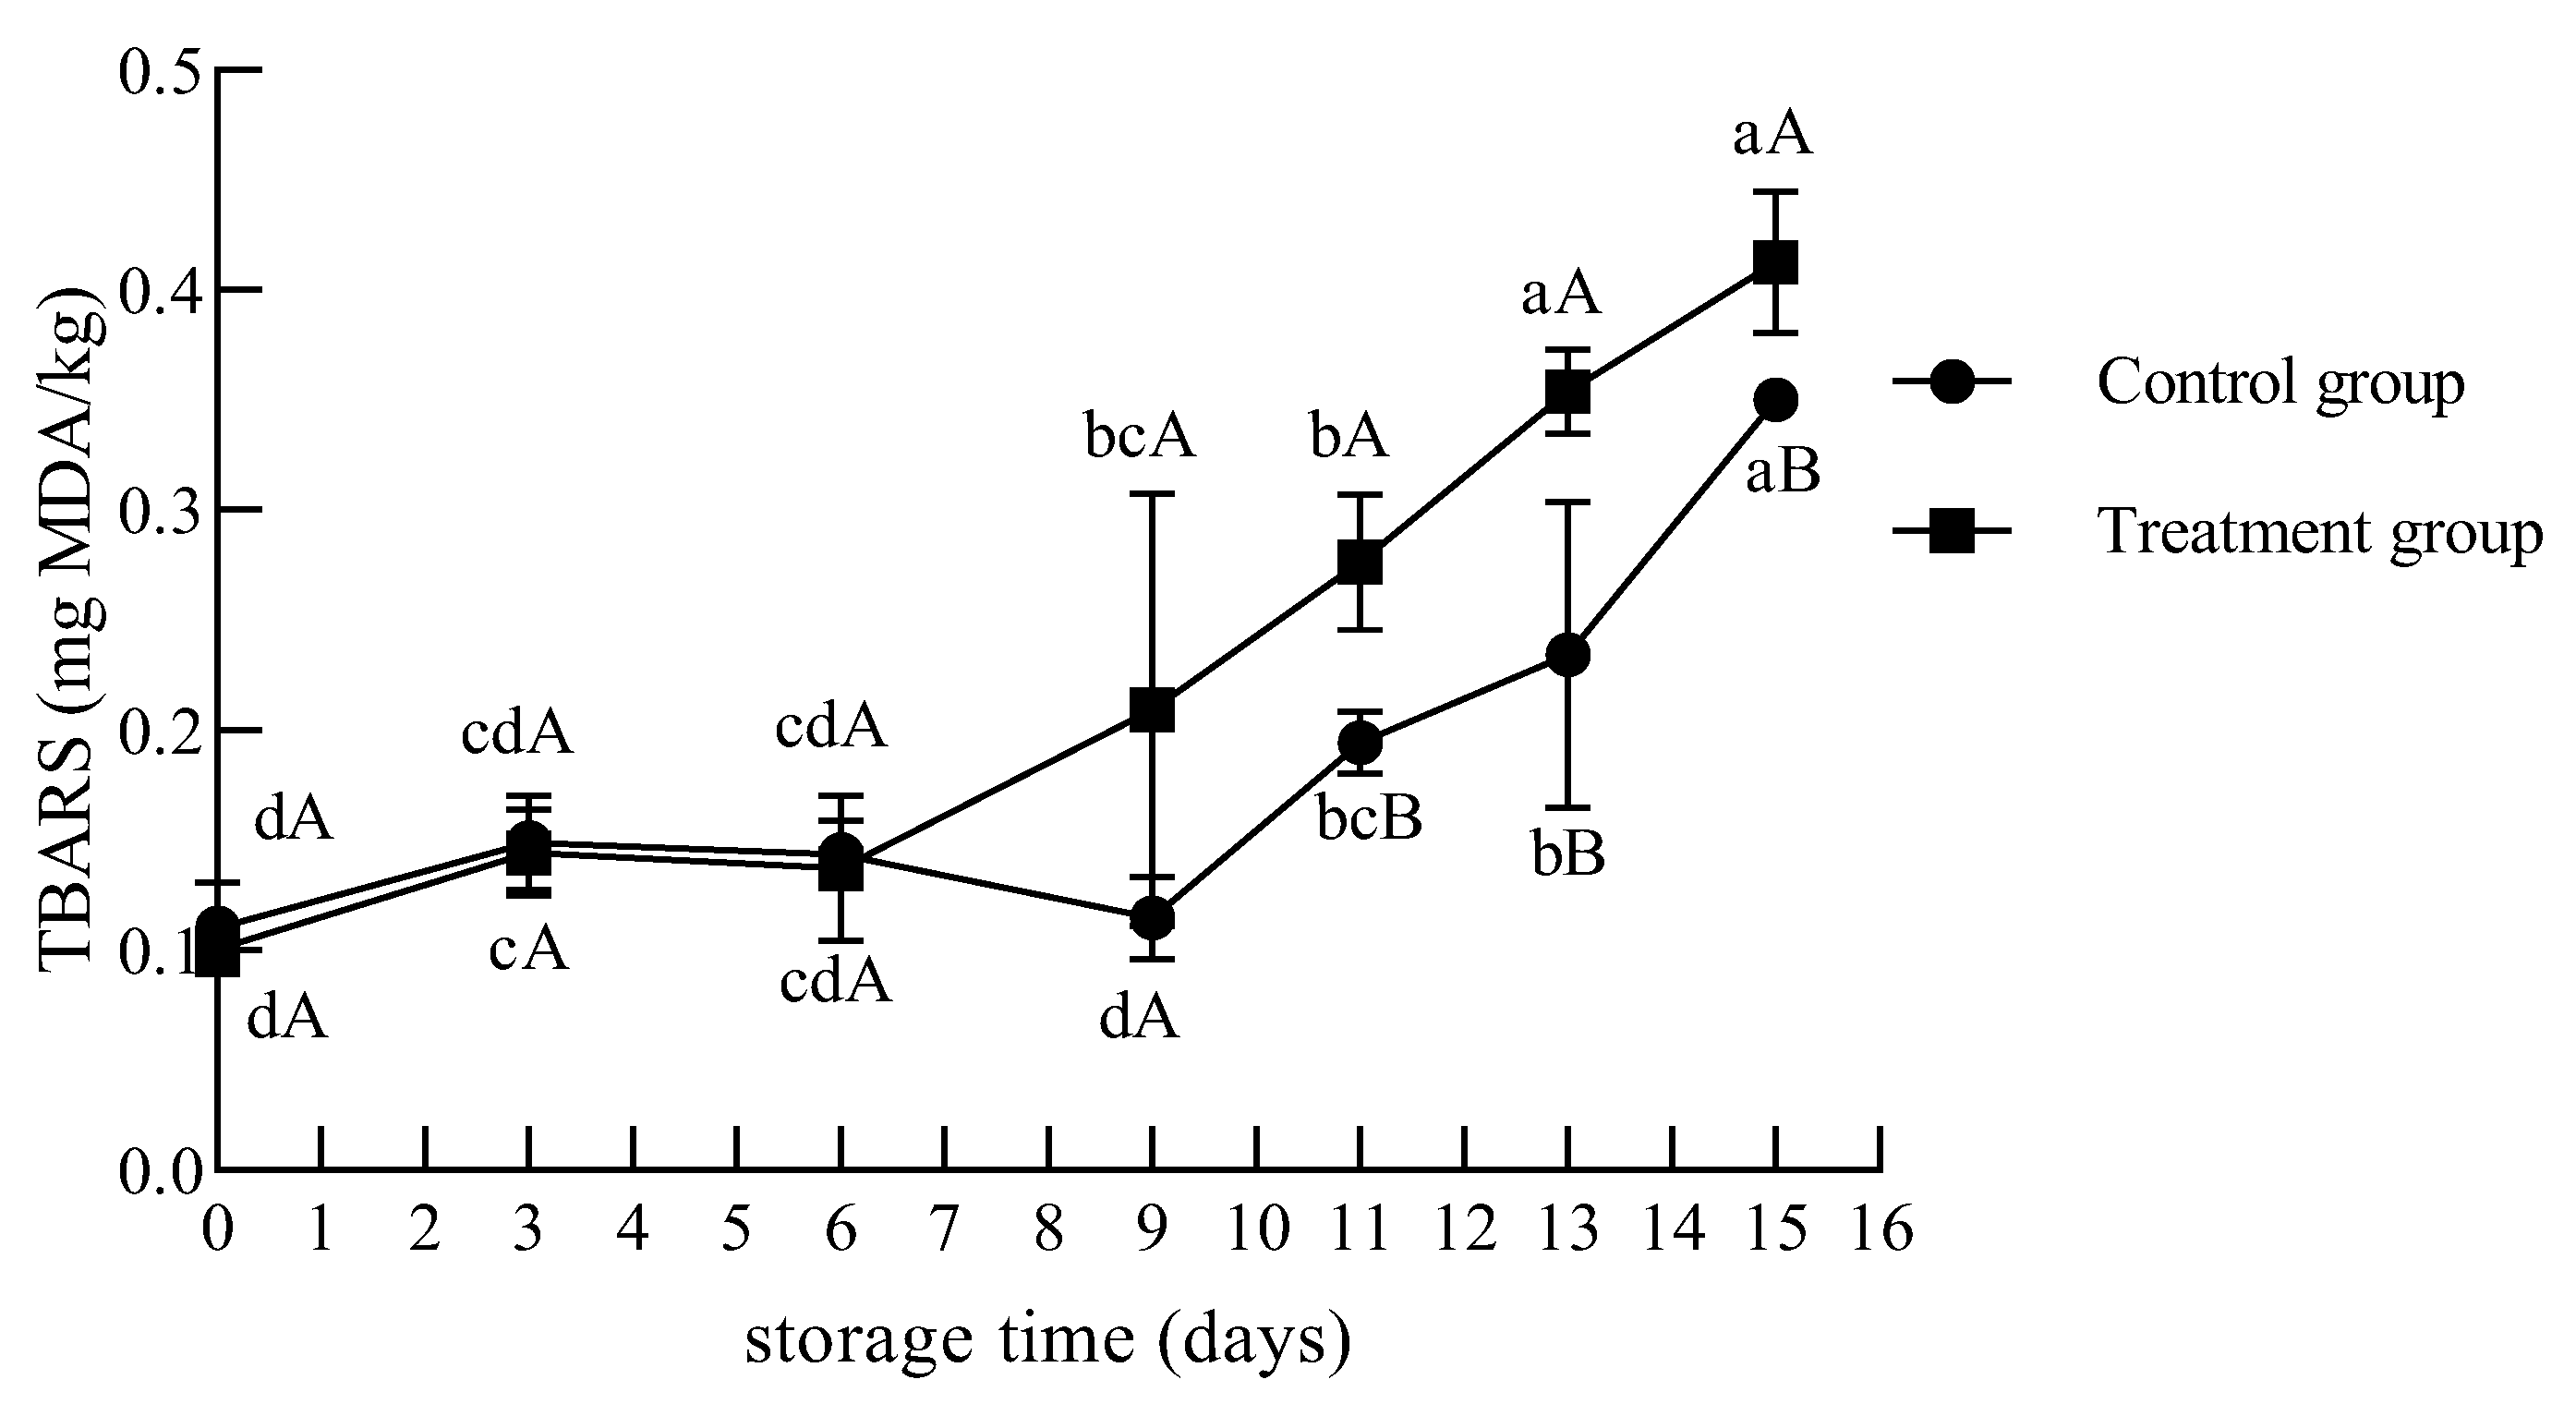
3.2.4. TBARS
3.2.5. Color
3.2.6. Sensory Evaluation
4. Conclusions
Author Contributions
Funding
Data Availability Statement
Conflicts of Interest
References
- Jiang, S.; Zhu, Y.; Peng, J.; Zhang, Y.; Zhang, W.; Liu, Y. Characterization of Stewed Beef by Sensory Evaluation and Multiple Intelligent Sensory Technologies Combined with Chemometrics Methods. Food Chem. 2023, 408, 135193. [Google Scholar] [CrossRef] [PubMed]
- Júnior, P.O.V.; Cardoso, R.D.C.V.; Nunse, I.L.; Lima, W.K.D.S. Quality and Safety of Fresh Beef in Retail: A Review. J. Food Protect. 2022, 85, 435–447. [Google Scholar] [CrossRef]
- Shao, L.; Chen, S.; Wang, H.; Zhang, J.; Xu, X.; Wang, H. Advances in Understanding the Predominance, Phenotypes, and Mechanisms of Bacteria Related to Meat Spoilage. Trends Food Sci. Tech. 2021, 118, 822–832. [Google Scholar] [CrossRef]
- Chagnot, C.; Agus, A.; Renier, S.; Peyrin, F.; Talon, R.; Astruc, T.; Desvaux, M. In Vitro Colonization of the Muscle Extracellular Matrix Components by Escherichia coli O157:H7: The Influence of Growth Medium, Temperature and pH on Initial Adhesion and Induction of Biofilm Formation by Collagens I and III. PLoS ONE. 2013, 8, e59386. [Google Scholar] [CrossRef] [Green Version]
- Li, X.; Wang, J.; Gao, X.; Xie, B.; Sun, Z. Inhibitory Effects of Lotus Seedpod Procyanidins Against Lipid and Protein Oxidation and Spoilage Organisms in Chilled-storage Beef. LWT-Food Sci. Technol. 2022, 160, 113247. [Google Scholar] [CrossRef]
- Soro, A.B.; Whyte, P.; Bolton, D.J.; Tiwari, B.K. Application of a LED-UV Based Light Technology for Decontamination of Chicken Breast Fillets: Impact on Microbiota and Quality Attributes. LWT-Food Sci. Technol. 2021, 145, 111297. [Google Scholar] [CrossRef]
- Guerrero-Beltrán, J.A.; Barbosa-Cánovas, G.V. Advantages and Limitations on Processing Foods by UV light. Food Sci. Technol. Int. 2016, 10, 137–147. [Google Scholar] [CrossRef]
- Indiarto, R.; Irawan, A.N.; Subroto, E. Meat Irradiation: A Comprehensive Review of Its Impact on Food Quality and Safety. Foods 2023, 12, 1845. [Google Scholar] [CrossRef]
- U.S. Food and Drug Administration. Irradiation in the Production, Processing and Handling of food. 21 CFR 179 Fed. Regist. 2000, 65, 71056–71058. Available online: https://www.federalregister.gov/documents/2000/11/29/00-30453/irradiation-in-the-production-processing-and-handling-of-food (accessed on 4 May 2023).
- Haughton, P.N.; Lyng, J.G.; Cronin, D.A.; Morgan, D.J.; Fanning, S.; Whyte, P. Efficacy of UV Light Treatment for the Microbiological Decontamination of Chicken, Associated Packaging, and Contact Surfaces. J. Food Protect. 2011, 74, 565–572. [Google Scholar] [CrossRef] [Green Version]
- Sommers, C.H.; Sheen, S. Inactivation of Avirulent Yersinia Pestis on Food and Food Contact Surfaces by Ultraviolet Light and Freezing. Food Microbiol. 2015, 50, 1–4. [Google Scholar] [CrossRef]
- Koutchma, T. Advances in ultraviolet light technology for non-thermal processing of liquid foods. Food Bioprocess Technol. 2009, 2, 138–155. [Google Scholar] [CrossRef]
- McSharry, S.; Koolman, L.; Whyte, P.; Bolton, D. Inactivation of Listeria monocytogenes and Salmonella typhimurium in beef broth and on diced beef using an ultraviolet light emitting diode (UV-LED) system. LWT—Food Sci. Technol. 2022, 158, 113150. [Google Scholar] [CrossRef]
- Calle, A.; Fernandez, M.; Montoya, B.; Schmidt, M.; Thompson, J. UV-C LED Irradiation Reduces Salmonella on Chicken and Food Contact Surfaces. Foods 2021, 10, 1459. [Google Scholar] [CrossRef] [PubMed]
- Kim, H.J.; Lee, Y.J.; Eun, J.B. Changes in the Microbiological Characteristics of Korean Native Cattle (Hanwoo) Beef Exposed to Ultraviolet (UV) Irradiation Prior to Refrigeration. Korean J. Food Sci. An. 2014, 34, 815–821. [Google Scholar] [CrossRef]
- Yeh, Y.; de Moura, F.H.; Van Den Broek, K.; de Mello, A.S. Effect of ultraviolet light, organic acids, and bacteriophage on Salmonella populations in ground beef. Meat Sci. 2018, 139, 44–48. [Google Scholar] [CrossRef]
- Corrêa, T.Q.; Blanco, K.C.; Garcia, É.B.; Perez, S.M.L.; Chianfrone, D.J.; Morais, V.S.; Bagnato, V.S. Effects of Ultraviolet Light and Curcumin-Mediated Photodynamic Inactivation on Microbiological Food Safety: A Study in Meat and Fruit. Photodiagnosis Photodyn. Ther. 2020, 30, 101678. [Google Scholar] [CrossRef]
- Holck, A.; Liland, K.H.; Carlehög, M.; Heir, E. Reductions of Listeria monocytogenes on cold-smoked and raw salmon fillets by UV-C and pulsed UV light. Innov. Food Sci. Emerg. Technol. 2018, 50, 1–10. [Google Scholar] [CrossRef]
- Chun, H.H.; Kim, J.Y.; Lee, B.D.; Yu, D.J.; Song, K.B. Effect of UV-C irradiation on the inactivation of inoculated pathogens and quality of chicken breasts during storage. Food Control 2010, 21, 276–280. [Google Scholar] [CrossRef]
- Cichoski, A.J.; Moura, H.C.; Silva, M.S.; Rampelotto, C.; Wagner, R.; Barin, J.S.; Vendruscolo, R.J.; Dugatto, J.S.; Athayde, D.R.; Dalla Costa, M.A. Oxidative and microbiological profiles of chicken drumsticks treated with ultraviolet-C radiation. J. Food Process. Pres. 2015, 39, 2780–2791. [Google Scholar] [CrossRef]
- Wang, J.; Chen, J.; Sun, Y.; He, J.; Zhou, C.; Xia, Q.; Dang, Y.; Pan, D.; Du, L. Ultraviolet-radiation Technology for Preservation of Meat and Meat Products: Recent Advances and Future Trends. Food Control 2023, 148, 109684. [Google Scholar] [CrossRef]
- Kalchayanand, N.; Bosolevac, J.M.; King, D.A.; Wheeler, T.L. Evaluation of UVC Radiation and a UVC-Ozone Combination as Fresh Beef Interventions against Shiga Toxin–Producing Escherichia coli, Salmonella, and Listeria monocytogenes and Their Effects on Beef Quality. J. Food Protect. 2020, 83, 1520–1529. [Google Scholar] [CrossRef] [PubMed]
- Kim, H.J.; Lee, Y.J.; Eun, J.B. Effects of Ultraviolet Radiation on the Physicochemical Characteristics of Korean Native Cattle (Hanwoo) Beef. J. Korean Soc. Appl. Biol. Chem. 2015, 58, 149–156. [Google Scholar] [CrossRef]
- Chang, Y.; Liu, Y.; Bai, Y.; Teng, S.; Guo, Y.; Han, D.; Ye, K. Effect of Different Degrees of Deep Freezing on the Quality of Snowflake Beef during Storage. Foods 2022, 11, 2175. [Google Scholar] [CrossRef] [PubMed]
- Erkan, N.; Özden, Ö. Quality assessment of whole and gutted sardines (Sardina pilchardus) stored in ice. Int. J. Food Sci. Tech. 2008, 43, 1549–1559. Available online: https://ifst.onlinelibrary.wiley.com/doi/10.1111/j.1365-2621.2007.01579.x (accessed on 4 May 2023). [CrossRef]
- Tarek, A.R.; Rasco, B.A.; Sablani, S.S. Ultraviolet-C Light Inactivation Kinetics of E. coli on Bologna Beef Packaged in Plastic Films. Food Bioprocess Tech. 2015, 8, 1267–1280. [Google Scholar] [CrossRef]
- McLeod, A.; Hovde Liland, K.; Haugen, J.E.; Sørheim, O.; Myhrer, K.S.; Holck, A.L. Chicken fillets subjected to UV-C and pulsed UV light: Reduction of pathogenic and spoilage bacteria, and changes in sensory quality. J. Food Safety. 2018, 38, e12421. [Google Scholar] [CrossRef] [PubMed] [Green Version]
- Sobeli, C.; Uyarcan, M.; Kayaardı, S. Pulsed UV-C radiation of beef loin steaks: Effects on microbial inactivation, quality attributes and volatile compounds. Innov. Food Sci. Emerg. 2021, 67, 102558. [Google Scholar] [CrossRef]
- Park, S.Y.; Ha, S. Ultraviolet-C Radiation on the Fresh Chicken Breast: Inactivation of Major Foodborne Viruses and Changes in Physicochemical and Sensory Qualities of Product. Food Bioprocess Technol. 2015, 8, 895–906. [Google Scholar] [CrossRef]
- Falowo, A.B.; Fayemi, P.O.; Muchenje, V. Natural antioxidants against lipid–protein oxidative deterioration in meat and meat products: A review. Food Res. Int. 2014, 64, 171–181. [Google Scholar] [CrossRef]
- Cao, Y.; Hao, R.; Guo, Z.; Han, L.; Yu, Q.; Zhang, W. Combined effects of superchilling and natural extracts on beef preservation quality. LWT-Food Sci. Technol. 2022, 153, 112520. [Google Scholar] [CrossRef]
- Lázaro, C.A.; Conte-Júnior, C.A.; Monteiro, M.L.G.; Canto, A.C.V.S.; Costa-Lima, B.R.C.; Mano, S.B.; Franco, R.M. Effects of Ultraviolet Light on Biogenic Amines and Other Quality Indicators of Chicken Meat during Refrigerated Storage. Poult. Sci. 2014, 93, 2304–2313. [Google Scholar] [CrossRef] [PubMed]
- Guo, Z.; Ge, X.; Guo, Q.; Yang, L.; Han, M.; Han, G.; Yu, Q.; Han, L. Changes in chilled beef packaged in starch film containing sea buckthorn pomace extract and quality changes in the film during super-chilled storage. Meat Sci. 2021, 182, 108620. [Google Scholar] [CrossRef] [PubMed]
- Ishaq, A.; Syed, Q.A.; Ebner, P.D.; Ubaid ur Rahman, H. Multiple hurdle technology to improve microbial safety, quality and oxidative stability of refrigerated raw beef. LWT-Food Sci. Technol. 2021, 138, 110529. [Google Scholar] [CrossRef]
- Chen, X.; Zhang, Y.; Yang, X.; Hopkins, D.L.; Zhu, L.; Dong, P.; Liang, R.; Luo, X. Shelf-life and microbial community dynamics of super-chilled beef imported from Australia to China. Food Res. Int. 2019, 120, 784–792. [Google Scholar] [CrossRef] [PubMed]
- Reichel, J.; Kehrenberg, C.; Krischek, C. Inactivation of Yersinia enterocolitica and Brochothrix thermosphacta on pork by UV-C irradiation. Meat Sci. 2019, 158, 107909. [Google Scholar] [CrossRef]
- Domínguez, R.; Pateiro, M.; Gagaoua, M.; Barba, F.J.; Zhang, W.; Lorenzo, J.M. A Comprehensive Review on Lipid Oxidation in Meat and Meat Products. Antioxidants 2019, 8, 429. [Google Scholar] [CrossRef] [Green Version]
- Monteiro, M.L.; Mársico, E.T.; Canto, A.C.V.d.C.S.; Costa-Lima, B.R.C.d.; Costa, M.P.d.; Viana, F.M.; Silva, T.G.P.d.; Conte-Junior, C.A. Impact of UV-C Light on the Fatty Acid Profile and Oxidative Stability of Nile Tilapia (Oreochromis niloticus) Fillets. J. Food Sci. 2017, 82, 1028–1036. [Google Scholar] [CrossRef]
- Tomasevic, I.; Djekic, I.; Font-i-Furnols, M.; Terjung, N.; Lorenzo, J.M. Recent advances in meat color research. Curr. Opin. Food Sci. 2021, 41, 81–87. [Google Scholar] [CrossRef]
- Holman, B.W.B.; Mao, Y.; Coombs, C.E.O.; Ven, R.J.V.D.; Hopkins, D.L. Relationship between colorimetric (instrumental) evaluation and consumer-defined beef colour acceptability. Meat Sci. 2016, 121, 104–106. [Google Scholar] [CrossRef]
- Rosario, D.K.A.; Mutz, Y.S.; Castro, V.S.; Bernardes, P.C.; Rajkovic, A.; Conte-Junior, C.A. Optimization of UV-C light and lactic acid combined treatment in decontamination of sliced Brazilian dry-cured loin: Salmonella Typhimurium inactivation and physicochemical quality. Meat Sci. 2021, 172, 108308. [Google Scholar] [CrossRef] [PubMed]
- Lyon, S.A.; Fletcher, D.L.; Berrang, M.E. Germicidal ultraviolet light to lower numbers of Listeria monocytogenes on broiler breast fillets. Poult. Sci. 2007, 86, 964–967. [Google Scholar] [CrossRef] [PubMed]
- Liu, N.; Zhu, Q.; Zeng, X.; Yang, B.; Liang, M.; Hu, P.; He, L.; Deng, L.; Liang, C.; Zhang, R. Influences of pulsed light-UV treatment on the storage period of dry-cured meat and shelf life prediction by ASLT method. J. Food Sci. Technol. 2019, 56, 1744–1756. [Google Scholar] [CrossRef] [PubMed]


| Score | Color | Odor | Texture |
|---|---|---|---|
| 9–10 | Bright red and shiny | Excellent | Soft and elastic, non-sticky surface |
| 7–8 | Red and shiny | Satisfactory | Good elasticity, non-sticky surface |
| 5–6 | Dark red and dull | Acceptable | General elasticity, slightly viscous surface |
| 3–4 | Dark or pale and dull | Poor | Inelastic, sticky surface |
| 0–2 | Dark brown | Very poor | Inelastic, strong surface adhesion |
| Distance | Test Point a (W/m2) | Test Point b (W/m2) | Test Point c (W/m2) | Test Point d (W/m2) | Test Point e (W/m2) |
|---|---|---|---|---|---|
| 6 cm | 4.96 ± 0.03 aC | 5.14 ± 0.02 aA | 5.05 ± 0.02 aB | 4.40 ± 0.07 aE | 4.50 ± 0.03 aD |
| 9 cm | 3.87 ± 0.01 bC | 4.00 ± 0.03 bA | 3.97 ± 0.03 bB | 2.95 ± 0.05 bE | 3.02 ± 0.04 bD |
| 12 cm | 2.68 ± 0.01 cB | 2.68 ± 0.01 cB | 2.71 ± 0.01 cA | 1.95 ± 0.01 cC | 1.95 ± 0.01 cC |
| UV-Group | Color L* Values | Color a* Values | Color b* Values | ∆E |
|---|---|---|---|---|
| control group | 41.97 ± 2.17 ab | 15.33 ± 1.87 a | 9.16 ± 1.04 a | / |
| UV (6 cm and 14 s) | 42.30 ± 2.76 ab | 15.05 ± 1.97 a | 9.33 ± 0.71 a | 2.46 ± 1.15 ab |
| UV (6 cm and 10 s) | 39.98 ± 2.77 b | 13.46 ± 2.06 a | 8.01 ± 1.32 a | 3.78 ± 0.50 a |
| UV (6 cm and 6 s) | 40.92 ± 3.28 ab | 13.50 ± 2.12 a | 8.65 ± 1.55 a | 3.74 ± 0.72 a |
| UV (9 cm and 14 s) | 40.56 ± 3.30 ab | 15.75 ± 3.10 a | 8.31 ± 1.27 a | 3.96 ± 0.68 a |
| UV (9 cm and 10 s) | 42.05 ± 3.16 ab | 13.98 ± 2.72 a | 8.01 ± 1.20 a | 3.70 ± 0.65 a |
| UV (9 cm and 6 s) | 43.75 ± 2.65 a | 14.90 ± 2.00 a | 9.56 ± 1.61 a | 2.71 ± 0.84 ab |
| UV (12 cm and 14 s) | 41.40 ± 1.99 ab | 16.09 ± 1.51 a | 9.29 ± 1.22 a | 1.27 ± 0.43 b |
| UV (12 cm and 10 s) | 43.37 ± 3.08 a | 14.53 ± 2.31 a | 8.44 ± 1.30 a | 2.96 ± 1.48 ab |
| UV (12 cm and 6 s) | 42.60 ± 1.07 ab | 14.34 ± 2.34 a | 8.00 ± 1.72 a | 2.31 ± 0.64 ab |
Disclaimer/Publisher’s Note: The statements, opinions and data contained in all publications are solely those of the individual author(s) and contributor(s) and not of MDPI and/or the editor(s). MDPI and/or the editor(s) disclaim responsibility for any injury to people or property resulting from any ideas, methods, instructions or products referred to in the content. |
© 2023 by the authors. Licensee MDPI, Basel, Switzerland. This article is an open access article distributed under the terms and conditions of the Creative Commons Attribution (CC BY) license (https://creativecommons.org/licenses/by/4.0/).
Share and Cite
Teng, S.; Gan, J.; Chen, Y.; Yang, L.; Ye, K. The Application of Ultraviolet Treatment to Prolong the Shelf Life of Chilled Beef. Foods 2023, 12, 2410. https://doi.org/10.3390/foods12122410
Teng S, Gan J, Chen Y, Yang L, Ye K. The Application of Ultraviolet Treatment to Prolong the Shelf Life of Chilled Beef. Foods. 2023; 12(12):2410. https://doi.org/10.3390/foods12122410
Chicago/Turabian StyleTeng, Shuang, Junlan Gan, Yu Chen, Liyuan Yang, and Keping Ye. 2023. "The Application of Ultraviolet Treatment to Prolong the Shelf Life of Chilled Beef" Foods 12, no. 12: 2410. https://doi.org/10.3390/foods12122410