
How Chemometrics Can Fight Milk Adulteration

 , ,
, ,  ,
,  , and
, and 
Abstract
:1. Introduction
2. Chemometric Approaches
2.1. Clustering
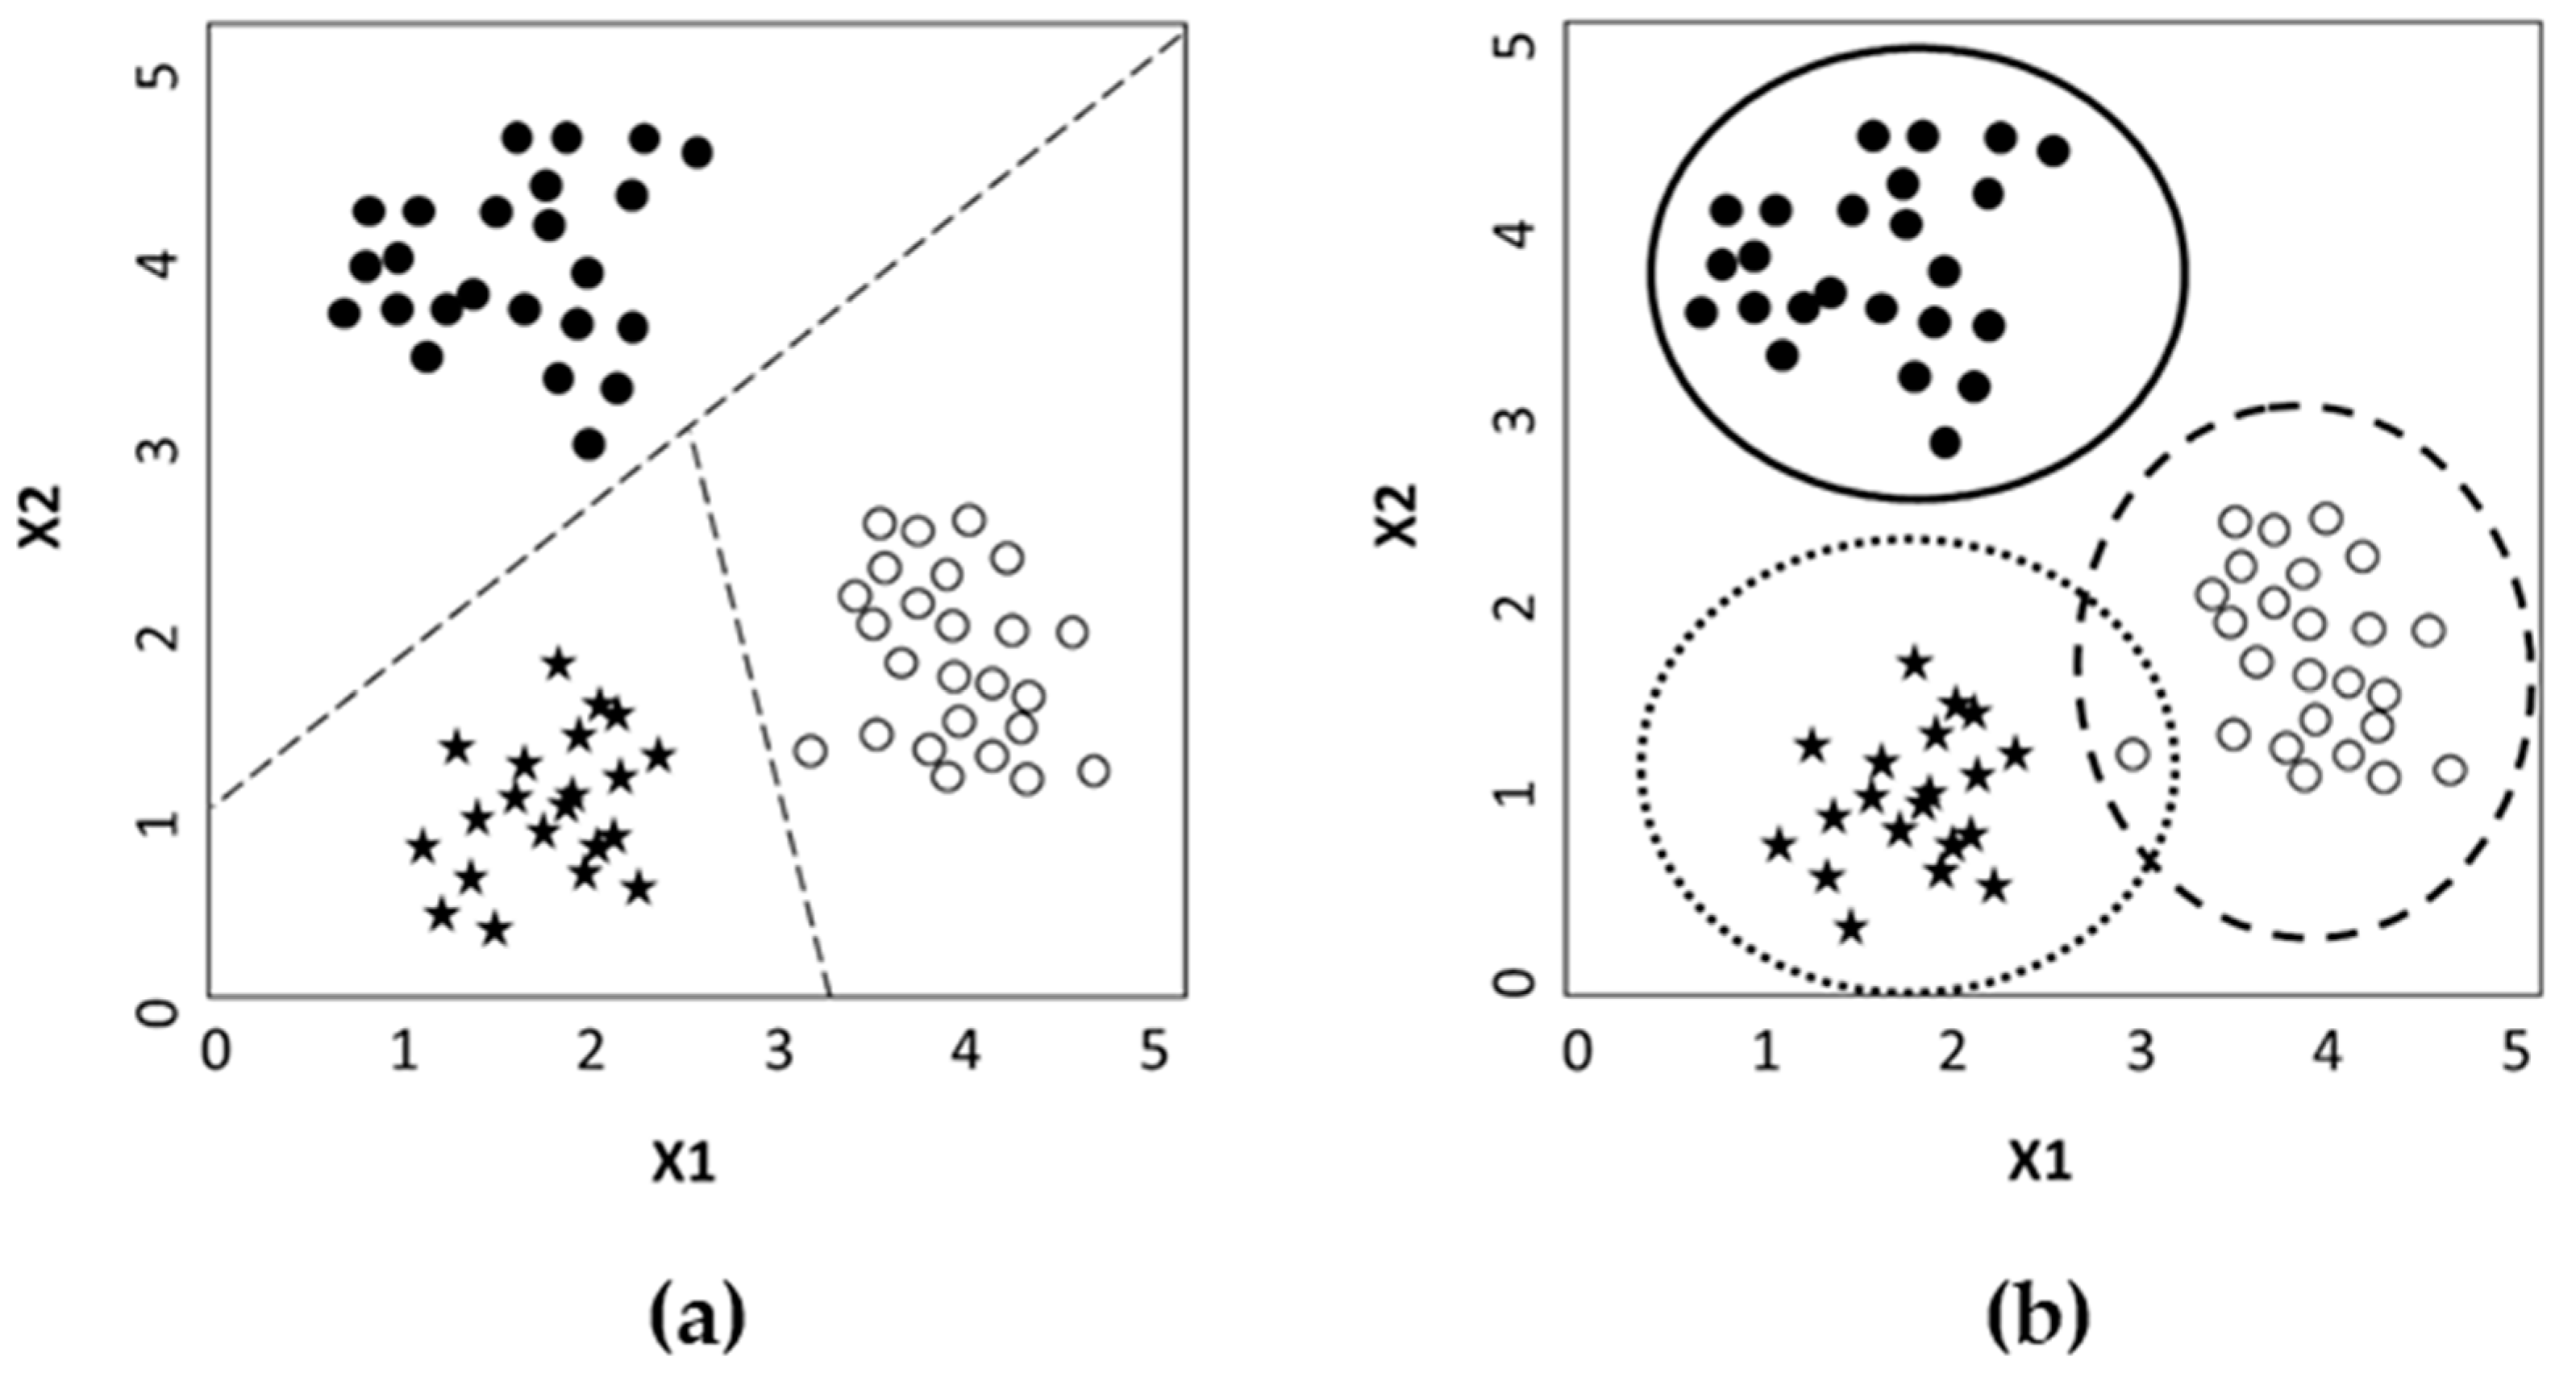
2.2. Classification

| Type of Milk | Target | Analytical Method(s) | Classification Method(s) | Reference |
|---|---|---|---|---|
| Cow | Classification | NIRS | EELM | Chen [67] |
| Cow | Organic milk geographical indication | Isotope ratio | OPLS-DA | Chung [58] |
| Cow | Authenticity | NMR | CDA | Segato [72] |
| Goat | Adulteration detection | Image analysis | OC-Classifier, OC-PLS, DD-SIMCA | dos Santos Pereira [66] |
| Cow | Quality | Chemical analysis, NIRS | PCA, SIMCA, PLS-DA | Ejeahalaka [62] |
| Various | Authenticity | NIRS, EDXRF | DD-SIMCA, PLS-DA, C-SVC | Galvan [61] |
| Cow | Adulteration | IR | LS-SVM | Jin [59] |
| Cow | Adulteration | NIRS | PCA, PLS | Kamboj [57] |
| Milk powder | Adulteration | Raman | PCA, SIMCA | Karunathilaka [60] |
| Cow | Geographical origin | Isotope ratio | ANOVA, DA, OPLS-DA, DD-SIMCA | Potočnik [68] |
| Cow | Authentication | Chemical analysis | PCA, OPLS-DA | Vargas [56] |
| Cow | Authentication | FTIR | PCA, kNN, SVM, RF, LDA | Wang [65] |
| Cow | Traceability | Chemical analysis, isotope ratio, | PCA, OPLS-DA | Xie [69] |
| Cow | Quality, breed classification | NMR | PLS, PLS-DA | Tomassini [70] |
| Cow | Quality | NMR | PCA, PLS-DA, OPLS-DA, HCA, RF | Sundekilde [71] |
| Cow | Quality | NMR | PCA, OPLS-DA | Yanibada [73] |
| Donkey | Authentication | NIRS | PLS-DA, VSN, ASCA | Di Donato [63] |
2.3. Regression
| Type of Milk | Target | Analytical Method(s) | Regression Method(s) | Reference |
|---|---|---|---|---|
| Cow milk | Water | NIR | PLS | [57] |
| Cow milk | Urea | NIR | PLS | [75] |
| Fat-filled milk powder | Melamine, urea | NIR | PLS | [76] |
| Goat milk powder | Melamine, urea, starch | NIR | PLS, MCR-ALS | [77] |
| Milk powder—infant formula | Melamine, vanillin | NIR HSI | PLS | [78] |
| Cow milk | Sugar | NIR | PLS | [79] |
| Cow milk | Anionic surfactant (SDS) | NIR, MIR (ATR) | PLS, GA-PLS | [80] |
| Yogurt | Margarine, sunflower oil, corn oil, hydrogenated vegetable oil | NIR, MIR | PLS | [81] |
| Desiccated coconut powder | Coconut milk | Vis-NIR | PLS | [82] |
| Donkey milk | Cow milk | NIR | PLS | [73] |
| Buffalo milk | Cow milk | MIR | PLS | [83] |
| Buffalo milk | Cow milk | MIR | PLS, MLR | [84] |
| Goat milk | Cow milk | MIR, Raman | PLS | [85] |
| Horse milk | Cow milk, goat milk | MIR | PLS, PCR | [86] |
| Coconut milk | Water | MIR | PLS, PCR | [87] |
| Cow milk | Soya bean oil, sugar | MIR (ATR) | PLS, MLR | [88] |
| Cow milk | Sucrose | MIR (ATR) | PLS, PCR | [89] |
| Cow milk | Formalin | MIR (ATR) | PLS, PCR | [13] |
| Cow milk | Maltodextrin, sodium carbonate, whey | Raman | PLS | [90] |
| Cow milk | Whey | Raman | PLS | [91] |
| White ultra-filtered cheese | Margarine, palm oil, and corn oil | Raman | PLS | [92] |
| Cow milk | Reconstituted skim milk powder | Cyclic voltammetry | PLS | [11] |
| Cow milk | Urea | Electrochemical impedance spectroscopy | PLS | [36] |
| Buffalo milk | Cow milk | Face fluorescence spectroscopy | PLS | [93] |
| Ovine and caprine milk | Cow milk | Laser-induced breakdown spectroscopy | PLS | [94] |
| Cow milk | Formaldehyde | TD-NMR | PLS | [12] |
| Cow milk | Formaldehyde | Opto-electronic nose | PLS | [40] |
| Cow milk | Sodium bicarbonate, sodium hydroxide, hydrogen peroxide, starch, sucrose, urea | MIR (ATR) | MLR | [97] |
| Skimmed milk powder | Semicarbazide hydrochloride, ammonium sulfate, cornstarch | NIR (miniature spectral devices) | OPLS | [99] |
| Cow milk | Whey | MIR | PLS, siPLS, LS-SVM | [38] |
| Cow milk | Melamine | Fluorescence spectroscopy | PARAFAC, U-PLS/RBL | [102] |
| Milk powder | Melamine, wheat flour, corn flour | Raman | GRNN | [108] |
| Cow milk | Acidity | Raman | PLS, BP-ANN | [109] |
| Colostrum | Mature cow milk | NIR, dielectric spectroscopy | PLS, LS-SVM | [111] |
| Ovine milk and caprine milk | Cow milk | MALDI-TOF-MS | PLS, GLM-Lasso | [113] |
| Cow milk | Water | NIR (portable) | BRT | [115] |
| Cow milk | Water | Digital image analysis | XGBoost | [116] |
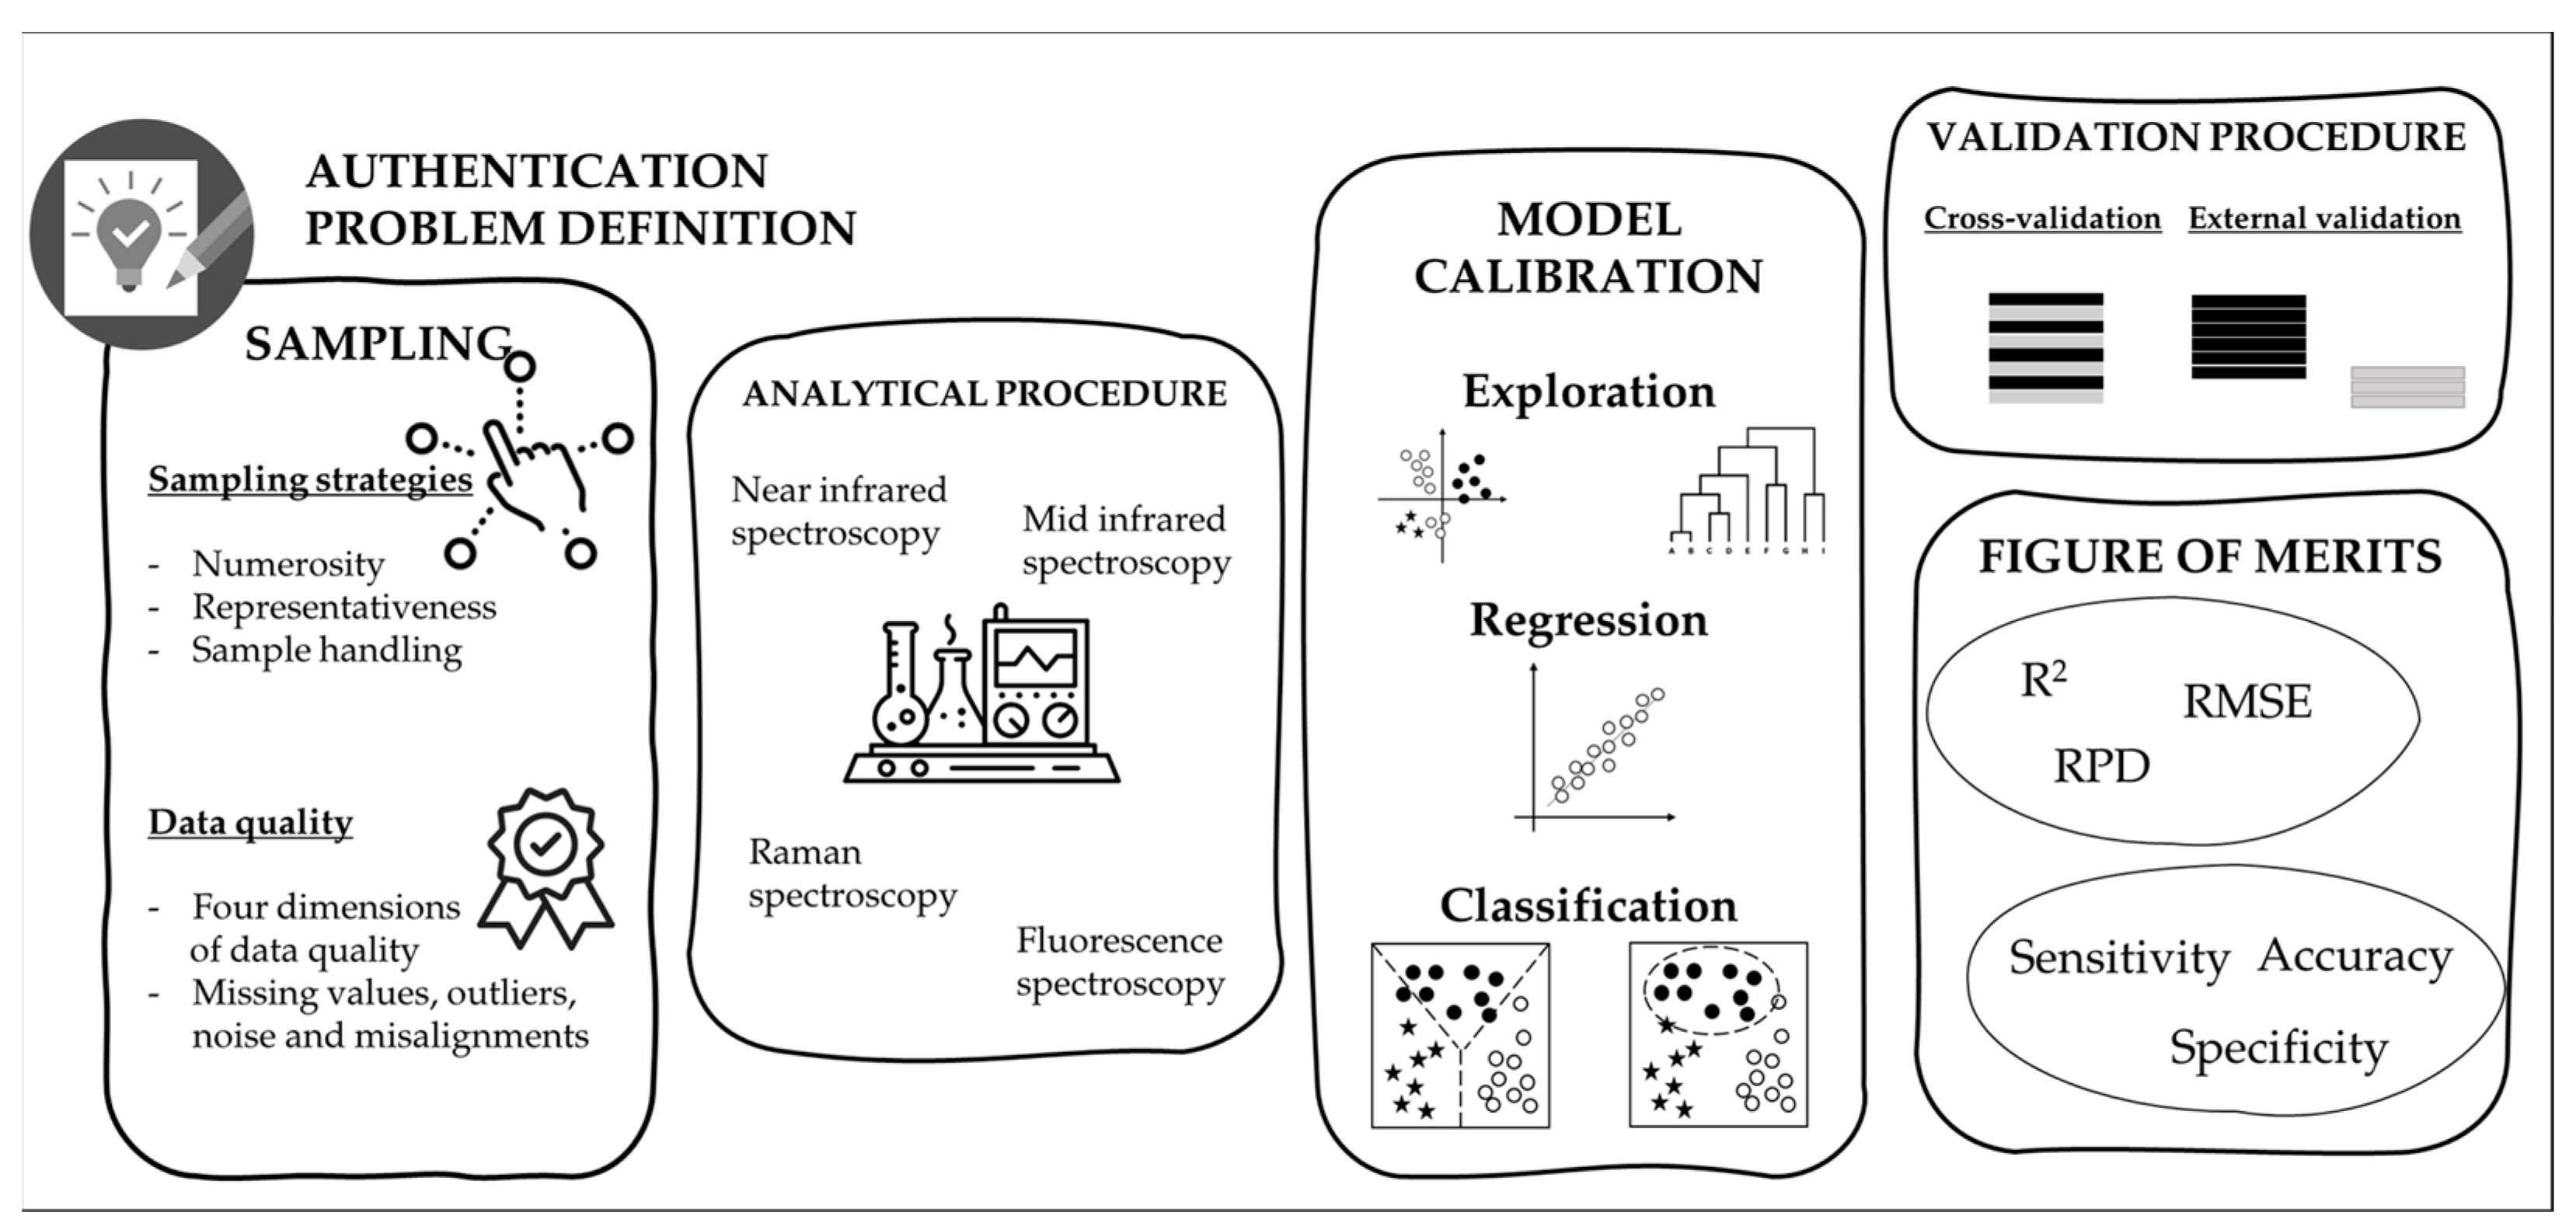
3. Steps for Development and Validation of a Chemometric Approach
3.1. Correct Sampling Procedure
3.1.1. Sampling Strategies
3.1.2. Data Quality
3.2. Pre-Processing
3.3. Data Reduction
3.4. Use of Robust Validation Procedures
3.5. Performance Criteria/Figure of Merits
3.5.1. R2 (Coefficient of Determination) and RMSE (Root Mean Squared Error)
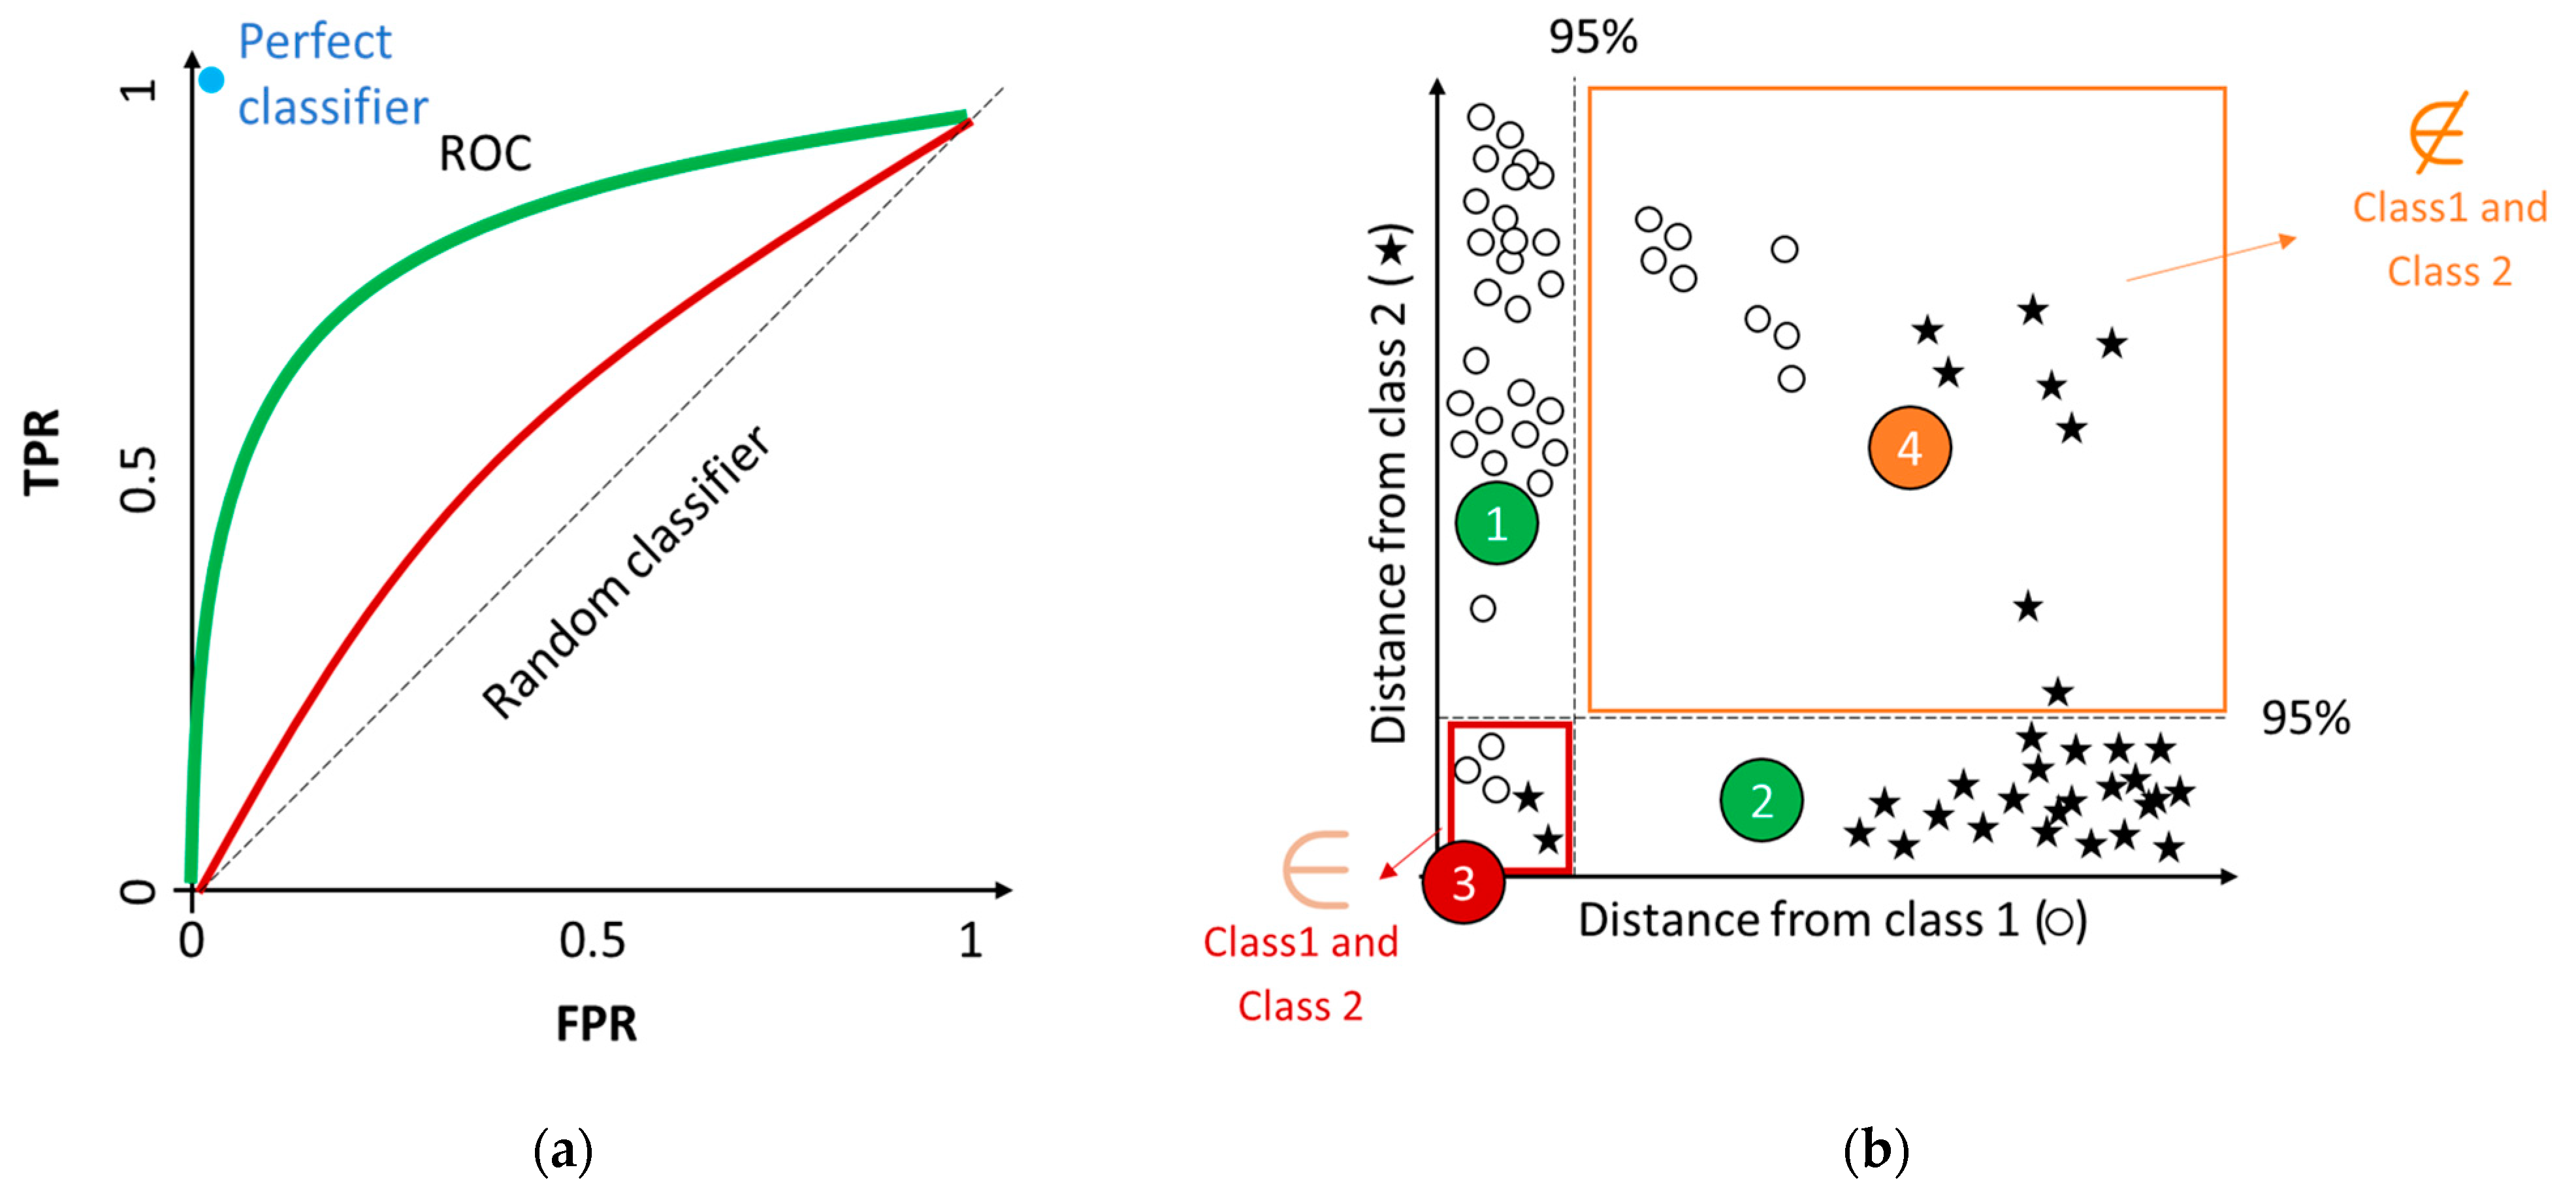
3.5.2. Specificity and Sensitivity, and Graphical Representations
4. Methods for Rapid and On-Site Detection to Combat Milk Adulteration
5. Conclusions
Author Contributions
Funding
Acknowledgments
Conflicts of Interest
References
- Uncu, A.O.; Uncu, A.T. A barcode-DNA analysis method for the identification of plant oil adulteration in milk and dairy products. Food Chem. 2020, 326, 126986. [Google Scholar] [CrossRef] [PubMed]
- Zhang, T.; Wu, X.; Wu, B.; Dai, C.; Fu, H. Rapid authentication of the geographical origin of milk using portable near-infrared spectrometer and fuzzy uncorrelated discriminant transformation. J. Food Process. Eng. 2022, 45, e14040. [Google Scholar] [CrossRef]
- Ye, H.; Yang, J.; Xiao, G.; Zhao, Y.; Li, Z.; Bai, W.; Zeng, X.; Dong, H. A comprehensive overview of emerging techniques and chemometrics for authenticity and traceability of animal-derived food. Food Chem. 2023, 402, 134216. [Google Scholar] [CrossRef] [PubMed]
- Nascimento, C.F.; Santos, P.M.; Pereira-Filho, E.R.; Rocha, F.R. Recent advances on determination of milk adulterants. Food Chem. 2017, 221, 1232–1244. [Google Scholar] [CrossRef] [PubMed]
- Moore, J.C.; Spink, J.; Lipp, M. Development and application of a database of food ingredient fraud and economically motivated adulteration from 1980 to 2010. J. Food Sci. 2012, 77, R118–R126. [Google Scholar] [CrossRef]
- Giglioti, R.; Polli, H.; Azevedo, B.T.; Katiki, L.M.; Vercesi Filho, A.E. Detection and quantification of adulteration in milk and dairy products: A novel and sensitive qPCR-based method. Food Chem. Mol. Sci. 2022, 4, 100074. [Google Scholar] [CrossRef]
- Teixeira, J.L.D.P.; Carames, E.T.D.S.; Baptista, D.P.; Gigante, M.L.; Pallone, J.A.L. Vibrational spectroscopy and chemometrics tools for authenticity and improvement the safety control in goat milk. Food Control 2020, 112, 107105. [Google Scholar] [CrossRef]
- Du, L.; Lu, W.; Cai, Z.J.; Bao, L.; Hartmann, C.; Gao, B.; Yu, L.L. Rapid detection of milk adulteration using intact protein flow injection mass spectrometric fingerprints combined with chemometrics. Food Chem. 2018, 240, 573–578. [Google Scholar] [CrossRef]
- Motta, T.C.; Hoff, R.B.; Barreto, F.; Andrade, R.B.S.; Lorenzini, D.M.; Meneghini, L.Z.; Pizzolato, T.M. Detection and confirmation of milk adulteration with cheese whey using proteomic-like sample preparation and liquid chromatography–electrospray–tandem mass spectrometry analysis. Talanta 2014, 120, 498–505. [Google Scholar] [CrossRef]
- Qin, C.; Liu, L.; Wang, Y.; Leng, T.; Zhu, M.; Gan, B.; Xie, J.; Yu, Q.; Chen, Y. Advancement of omics techniques for chemical profile analysis and authentication of milk. Trends Food Sci. Technol. 2022, 127, 114–128. [Google Scholar] [CrossRef]
- Nikolaou, P.; Deskoulidis, E.; Topoglidis, E.; Kakoulidou, A.T.; Tsopelas, F. Application of chemometrics for detection and modeling of adulteration of fresh cow milk with reconstituted skim milk powder using voltammetric fingerpriting on a graphite/SiO2 hybrid electrode. Talanta 2020, 206, 120223. [Google Scholar] [CrossRef] [PubMed]
- Coimbra, P.T.; Bathazar, C.F.; Guimarães, J.T.; Coutinho, N.M.; Pimentel, T.C.; Neto, R.P.C.; Esmerino, E.A.; Freitas, M.Q.; Silva, M.C.; Tavares, M.I.B.; et al. Detection of formaldehyde in raw milk by time domain nuclear magnetic resonance and chemometrics. Food Control 2020, 110, 107006. [Google Scholar] [CrossRef]
- Balan, B.; Dhaulaniya, A.S.; Jamwal, R.; Sodhi, K.K.; Kelly, S.; Cannavan, A.; Singh, D.K. Application of Attenuated Total Reflectance-Fourier Transform Infrared (ATR-FTIR) spectroscopy coupled with chemometrics for detection and quantification of formalin in cow milk. Vib. Spectrosc. 2020, 107, 103033. [Google Scholar] [CrossRef]
- Wasnik, P.G.; Menon, R.R.; Sivaram, M.; Nath, B.S.; Balasubramanyam, B.V.; Manjunatha, M. Development of mathematical model for prediction of adulteration levels of cow ghee with vegetable fat using image analysis. J. Food Sci. Technol. 2019, 56, 2320–2325. [Google Scholar] [CrossRef]
- Roy, M.; Doddappa, M.; Yadav, B.K.; Jaganmohan, R.; Sinija, V.R.; Manickam, L.; Sarvanan, S. Detection of soybean oil adulteration in cow ghee (clarified milk fat): An ultrafast study using flash gas chromatography electronic nose coupled with multivariate chemometrics. J. Sci. Food Agric. 2022, 102, 4097–4108. [Google Scholar] [CrossRef]
- Vatavali, K.; Kosma, I.; Louppis, A.; Gatzias, I.; Badeka, A.V.; Kontominas, M.G. Characterisation and differentiation of geographical origin of Graviera cheeses produced in Greece based on physico-chemical, chromatographic and spectroscopic analyses, in combination with chemometrics. Int. Dairy J. 2020, 110, 104799. [Google Scholar] [CrossRef]
- Aleixandre-Tudo, J.L.; Castello-Cogollos, L.; Aleixandre, J.L.; Aleixandre-Benavent, R. Chemometrics in food science and technology: A bibliometric study. Chemom. Intell. Lab. Syst. 2022, 222, 104514. [Google Scholar] [CrossRef]
- Kamal, M.; Karoui, R. Analytical methods coupled with chemometric tools for determining the authenticity and detecting the adulteration of dairy products: A review. Trends Food Sci. Technol. 2015, 46, 27–48. [Google Scholar] [CrossRef]
- Gómez-Caravaca, A.M.; Maggio, R.M.; Cerretani, L. Chemometric applications to assess quality and critical parameters of virgin and extra-virgin olive oil. A review. Anal. Chim. Acta 2016, 913, 1–21. [Google Scholar] [CrossRef]
- Oliveri, P. Class-modelling in food analytical chemistry: Development, sampling, optimisation and validation issues—A tutorial. Anal. Chim. Acta 2017, 982, 9–19. [Google Scholar] [CrossRef]
- McGrath, T.F.; Haughey, S.A.; Patterson, J.; Fauhl-Hassek, C.; Donarski, J.; Alewijn, M.; van Ruth, S.; Elliott, C.T. What are the scientific challenges in moving from targeted to non-targeted methods for food fraud testing and how can they be addressed? Spectroscopy case study. Trends Food Sci. Technol. 2018, 76, 38–55. [Google Scholar] [CrossRef]
- Cubero-Leon, E.; Penalver, R.; Maquet, A. Review on metabolomics for food authentication. Food Res. Int. 2014, 60, 95–10711. [Google Scholar]
- Hanganu, A.; Chira, N. When detection of dairy food fraud fails: An alternate approach through proton nuclear magnetic resonance spectroscopy. J. Dairy Sci. 2021, 104, 8454–8466. [Google Scholar] [CrossRef] [PubMed]
- Souhassou, S.; Bassbasi, M.; Hirri, A.; Kzaiber, F.; Oussama, A. Detection of camel milk adulteration using Fourier transformed infrared spectroscopy FT-IR coupled with chemometrics methods. Int. Food Res. J. 2018, 25, 1213–1218. [Google Scholar]
- Wang, X.; Esquerre, C.; Downey, G.; Henihan, L.; O’Callaghan, D.; O’Donnell, C. Feasibility of discriminating dried dairy ingredients and preheat treatments using mid-infrared and Raman Spectroscopy. Food Anal. Methods 2018, 11, 1380–1389. [Google Scholar] [CrossRef]
- Karunathilaka, S.R.; Yakes, B.J.; He, K.; Chung, J.K.; Mossoba, M. Non-targeted NIR spectroscopy and SIMCA classification for commercial milk powder authentication: A study using eleven potential adulterants. Heliyon 2018, 4, e00806. [Google Scholar] [CrossRef] [Green Version]
- Da Silva Dias, L.; da Silva Junior, J.C.; Felício, A.L.D.S.M.; de França, J.A. A NIR photometer prototype with integrating sphere for the detection of added water in raw milk. IEEE Trans. Instrum. Meas. 2018, 67, 2812–2819. [Google Scholar] [CrossRef]
- Windarsih, A.; Rohman, A.; Irnawati; Riyanto, S. The Combination of Vibrational Spectroscopy and Chemometrics for Analysis of Milk Products Adulteration. Int. J. Food Sci. 2021, 2021, 8853358. [Google Scholar] [CrossRef]
- de Lima, A.B.S.; Batista, A.S.; de Jesus, J.C.; de Jesus Silva, J.; de Araújo, A.C.M.; Santos, L.S. Fast quantitative detection of black pepper and cumin adulterations by near-infrared spectroscopy and multivariate modeling. Food Control 2020, 107, 106802. [Google Scholar] [CrossRef]
- Jiménez-Carvelo, A.M.; González-Casado, A.; Bagur-González, M.G.; Cuadros-Rodríguez, L. Alternative data mining/machine learning methods for the analytical evaluation of food quality and authenticity—A review. Food Res. Int. 2019, 122, 25–39. [Google Scholar] [CrossRef]
- Teixeira, J.L.d.P.; Caramês, E.T.d.S.; Baptista, D.P.; Gigante, M.L.; Pallone, J.A.L. Rapid adulteration detection of yogurt and cheese made from goat milk by vibrational spectroscopy and chemometric tools. J. Food Compost. Anal. 2021, 96, 103712. [Google Scholar] [CrossRef]
- Ramirez-Lopez, L.; Schmidt, K.; Behrens, T.; Van Wesemael, B.; Demattê, J.A.; Scholten, T. Sampling optimal calibration sets in soil infrared spectroscopy. Geoderma 2014, 226, 140–150. [Google Scholar] [CrossRef]
- Jain, A.K.; Murty, M.N.; Flynn, P.J. Data clustering: A review. ACM Comput. Surv. CSUR 1999, 31, 264–323. [Google Scholar] [CrossRef]
- Bratchell, N. Chapter 6 Cluster Analysis. Data Handl. Sci. Technol. 1992, 9, 179–208. [Google Scholar]
- Saxena, A.; Prasad, M.; Gupta, A.; Bharill, N.; Patel, O.P.; Tiwari, A.; Er, M.J.; Ding, W.; Lin, C. A review of clustering techniques and developments. Neurocomputing 2017, 267, 664–681. [Google Scholar] [CrossRef] [Green Version]
- Minetto, T.A.; França, B.D.; da Silva Dariz, G.; Veiga, E.A.; Galvão, A.C.; da Silva Robazza, W. Identifying adulteration of raw bovine milk with urea through electrochemical impedance spectroscopy coupled with chemometric techniques. Food Chem. 2022, 385, 132678. [Google Scholar] [CrossRef]
- Cirak, O.; Icyer, N.C.; Durak, M.Z. Rapid detection of adulteration of milks from different species using Fourier Transform Infrared Spectroscopy (FTIR). J. Dairy Res. 2018, 85, 222–225. [Google Scholar] [CrossRef]
- Vinciguerra, L.L.; Marcelo, M.C.; Motta, T.; Meneghini, L.Z.; Bergold, A.M.; Ferrão, M.F. Chemometric tools and FTIR-ATR spectroscopy applied in milk adulterated with cheese whey. Química Nova 2019, 42, 249–254. [Google Scholar] [CrossRef]
- Ezhilan, M.; Gumpu, M.B.; Ramachandra, B.L.; Nesakumar, N.; Babu, K.J.; Krishnan, U.M.; Rayappan, J.B.B. Design and development of electrochemical biosensor for the simultaneous detection of melamine and urea in adulterated milk samples. Sens. Actuators B Chem. 2017, 238, 1283–1292. [Google Scholar] [CrossRef]
- Mostafapour, S.; Gharaghani, F.M.; Hemmateenejad, B. Converting electronic nose into opto-electronic nose by mixing MoS2 quantum dots with organic reagents: Application to recognition of aldehydes and ketones and determination of formaldehyde in milk. Anal. Chim. Acta 2021, 1170, 338654. [Google Scholar] [CrossRef]
- Li, Q.; Yu, Z.; Zhu, D.; Meng, X.; Pang, X.; Liu, Y.; Frew, R.; Chen, H.; Chen, G. The application of NMR-based milk metabolite analysis in milk authenticity identification. J. Sci. Food Agric. 2017, 97, 2875–2882. [Google Scholar] [CrossRef] [PubMed]
- Sowmya, N.; Ponnusamy, V. Development of spectroscopic sensor system for an IoT application of adulteration identification on milk using machine learning. IEEE Access 2021, 9, 53979–53995. [Google Scholar] [CrossRef]
- Souza, S.O.; Santos, V.S.; Santos, E.S.; Ávila, D.V.L.; Nascimento, C.C.; Costa, S.S.L.; Garcia, C.A.B.; Araujo, R.G.O. Evaluation of the mineral content in milk and yogurt types using chemometric tools. Microchem. J. 2018, 143, 1–8. [Google Scholar] [CrossRef]
- Rodríguez-Bermúdez, R.; López-Alonso, M.; Miranda, M.; Fouz, R.; Orjales, I.; Herrero-Latorre, C. Chemometric authentication of the organic status of milk on the basis of trace element content. Food Chem. 2018, 240, 686–693. [Google Scholar] [CrossRef]
- Zain, S.M.; Behkami, S.; Bakirdere, S.; Koki, I.B. Milk authentication and discrimination via metal content clustering–A case of comparing milk from Malaysia and selected countries of the world. Food Control 2016, 66, 306–314. [Google Scholar] [CrossRef]
- Xu, S.; Zhao, C.; Deng, X.; Zhang, R.; Qu, L.; Wang, M.; Ren, S.; Wu, H.; Yue, Z.; Niu, B. Determining the geographical origin of milk by multivariate analysis based on stable isotope ratios, elements and fatty acids. Anal. Methods 2021, 13, 2537–2548. [Google Scholar] [CrossRef]
- Amenzou, N.; Hamid, M.; Fouad, T.; Elyahyaoui, A.; Elghali, T.; Elmoqrani, L.; Mahmoud, E. Stable Isotope Ratios in Dairy Products (Milk) as New Tool to Determine Their Different Origins in Morocco; Joint FAO/IAEA Centre of Nuclear Techniques in Food and Agriculture, Food Safety and Control Section: Vienna, Austria, 2022; pp. 60–69, 128. ISBN 978-92-0-124822-0. ISSN 1011-4289. CONTRACT MOR 18051. [Google Scholar]
- Podkolzin, I.; Solovev, A. Application of Stable Isotope Techniques and Elemental Analysis to Confirm Geographical Origin of Milk Produced in the Russian Federation; IAEA: Vienna, Austria, 2022. [Google Scholar]
- Karrar, E.; Mohamed Ahmed, I.A.; Huppertz, T.; Wei, W.; Jin, J.; Wang, X. Fatty acid composition and stereospecificity and sterol composition of milk fat from different species. Int. Dairy J. 2022, 128, 105313. [Google Scholar] [CrossRef]
- Bhumireddy, S.R.; Rocchetti, G.; Pallerla, P.; Lucini, L.; Sripadi, P. A combined targeted/untargeted screening based on GC/MS to detect low-molecular-weight compounds in different milk samples of different species and as affected by processing. Int. Dairy J. 2021, 118, 105045. [Google Scholar] [CrossRef]
- Tan, D.; Zhang, X.; Su, M.; Jia, M.; Zhu, D.; Kebede, B.; Wu, H.; Chen, G. Establishing an untargeted-to-MRM liquid chromatography–mass spectrometry method for discriminating reconstituted milk from ultra-high temperature milk. Food Chem. 2021, 337, 127946. [Google Scholar] [CrossRef]
- Couvreur, S.; Hurtaud, C. Relationships between milks differentiated on native milk fat globule characteristics and fat, protein and calcium compositions. Animal 2017, 11, 507–518. [Google Scholar] [CrossRef]
- Dhankhar, J.; Sharma, R.; Indumathi, K. A comparative study of sterols in milk fat of different Indian dairy animals based on chemometric analysis. J. Food Meas. Charact. 2020, 14, 2538–2548. [Google Scholar] [CrossRef]
- Marini, F. Classification methods in chemometrics. In Proceedings of the Mediterraneum Meeting, Ventotene, Italy, 1–4 June 2008. [Google Scholar]
- Derde, M.P.; Massart, D.L. UNEQ: A disjoint modelling technique for pattern recognition based on normal distribution. Anal. Chim. Acta 1986, 184, 33–51. [Google Scholar] [CrossRef]
- Vargas-Bello-Pérez, E.; Gomez-Cortes, P.; Geldsetzer-Mendoza, C.; Sol Morales, M.; Toro-Mujica, P.; Fellenberg, M.A.; Ibanez, R.A. Authentication of retail cheeses based on fatty acid composition and multivariate data analysis. Int. Dairy J. 2018, 85, 280–284. [Google Scholar] [CrossRef]
- Kamboj, U.; Kaushal, N.; Mishra, S.; Munjal, N. Application of Selective Near Infrared Spectroscopy for Qualitative and Quantitative Prediction of Water Adulteration in Milk. Mater. Today Proc. 2020, 24, 2449–2456. [Google Scholar] [CrossRef]
- Chung, I.M.; Kim, J.K.; Yang, Y.J.; An, Y.J.; Kim, S.Y.; Kwon, C.; Kim, S.H. A case study for geographical indication of organic milk in Korea using stable isotope ratios-based chemometric analysis. Food Control 2020, 107, 106755. [Google Scholar] [CrossRef]
- Jin, H.; Dong, G.M.; Wu, H.Y.; Yang, Y.R.; Huang, M.Y.; Wang, M.Y.; Yang, R.J. Identification of adulterated milk based on auto-correlation spectra. Spectrochim. Acta Part A Mol. Biomol. Spectrosc. 2023, 286, 121987. [Google Scholar] [CrossRef]
- Karunathilaka, S.R.; Yakes, B.J.; He, K.; Brückner, L.; Mossoba, M.M. First use of handheld Raman spectroscopic devices and on-board chemometric analysis for the detection of milk powder adulteration. Food Control 2018, 92, 137–146. [Google Scholar] [CrossRef]
- Galvan, D.; Lelis, C.A.; Effting, L.; Melquiades, F.L.; Bona, E.; Conte-Junior, C.A. Low-cost spectroscopic devices with multivariate analysis applied to milk authenticity. Microchem. J. 2022, 181, 107746. [Google Scholar] [CrossRef]
- Ejeahalaka, K.K.; On, S.L.W. Chemometric studies of the effects of milk fat replacement with different proportions of vegetable oils in the formulation of fat-filled milk powders: Implications for quality assurance. Food Chem. 2019, 295, 198–205. [Google Scholar] [CrossRef]
- Di Donato, F.; Biancolillo, A.; Ferretti, A.; D’Archivio, A.A.; Marini, F. Near Infrared Spectroscopy coupled to Chemometrics for the authentication of donkey milk. J. Food Compos. Anal. 2022; in press. [Google Scholar] [CrossRef]
- Zontov, Y.V.; Rodionova, O.Y.; Kucheryavskiy, S.V.; Pomerantsev, A.L. DD-SIMCA—A MATLAB GUI tool for data driven SIMCA approach. Chemom. Intell. Lab. Syst. 2017, 167, 23–28. [Google Scholar] [CrossRef]
- Wang, Y.T.; Ren, H.B.; Liang, W.Y.; Jin, X.; Yuan, Q.; Liu, Z.R.; Chen, D.M.; Zhang, Y.H. A novel approach to temperature-dependent thermal processing authentication for milk by infrared spectroscopy coupled with machine learning. J. Food Eng. 2021, 311, 110740. [Google Scholar] [CrossRef]
- Dos Santos Pereira, E.V.; de Sousa Fernandes, D.D.; de Almeida, L.F.; Sucupira Maciel, M.I.; Gonçalves Dias Diniz, P.H. Goat milk authentication by one-class classification of digital image-based fingerprint signatures: Detection of adulteration with cow milk. Microchem. J. 2022, 180, 107640. [Google Scholar] [CrossRef]
- Chen, H.; Tan, C.; Lin, Z.; Wua, T. Classification of different liquid milk by near-infrared spectroscopy and ensemble modelling. Spectrochim. Acta Part A Mol. Biomol. Spectrosc. 2021, 251, 119460. [Google Scholar] [CrossRef]
- Potočnik, D.; Nečemer, M.; Perišić, I.; Jagodic, M.; Mazej, D.; Camin, F.; Eftimov, T.; Strojnik, L.; Ogrinc, N. Geographical verification of Slovenian milk using stable isotope ratio, multielement and multivariate modelling approaches. Food Chem. 2020, 326, 126958. [Google Scholar] [CrossRef]
- Xie, L.; Zhao, S.; Rogers, K.M.; Xia, Y.; Zhang, B.; Suo, R.; Zhao, Y. A case of milk traceability in small-scale districts-Inner Mongolia of China by nutritional and geographical parameters. Food Chem. 2020, 316, 126332. [Google Scholar] [CrossRef]
- Tommasini, A.; Curone, G.; Solè, M.; Capuani, G.; Sciubba, F.; Conta, G.; Miccheli, G.; Vigo, D. NMR-based metabolomics to evaluate the milk composition from Friesian and autochtonous cows of Northern Italy at different lactation times. Nat. Prod. Res. 2019, 33, 1085–1091. [Google Scholar] [CrossRef]
- Sundekilde, U.K.; Larsen, L.B.; Bertram, C. NMR-Based milk metabolomics. Metabolites 2013, 3, 204–222. [Google Scholar] [CrossRef]
- Segato, S.; Caligiani, A.; Contiero, B.; Galaverna, G.; Bisutti, V.; Cozzi, G. 1H NMR metabolic profile to discriminate pasture based alpine Asiago PDO cheeses. Animals 2019, 9, 722. [Google Scholar] [CrossRef] [Green Version]
- Yanibada, B.; Boudra, H.; Debrauwer, L.; Martin, C.; Morgavi, D.P.; Canlet, C. Evaluation of sample preparation methods for NMR-based metabolomics of cow milk. Heliyon 2018, 4, e00856. [Google Scholar] [CrossRef] [Green Version]
- Wold, S.; Martens, H.; Wold, H. The multivariate calibration problem in chemistry solved by PLS method. In Matrix Pencils; Springer: Berlin/Heidelberg, Germany, 1983; pp. 286–293. [Google Scholar]
- Mabood, F.; Ali, L.; Boque, R.; Abbas, G.; Jabeen, F.; Haq, Q.M.I.; Hussain, J.; Hamaed, A.M.; Naureen, Z.; Al-Nabhani, M.; et al. Robust Fourier transformed infrared spectroscopy coupled with multivariate methods for detection and quantification of urea adulteration in fresh milk samples. Food Sci. Nutr. 2020, 8, 5249–5258. [Google Scholar] [CrossRef] [PubMed]
- Ejeahalaka, K.K.; On, S.L. Effective detection and quantification of chemical adulterants in model fat-filled milk powders using NIRS and hierarchical modelling strategies. Food Chem. 2020, 309, 125785. [Google Scholar] [CrossRef] [PubMed]
- Zhao, X.; Wang, Y.; Liu, X.; Jiang, H.; Zhao, Z.; Niu, X.; Li, C.; Pang, B.; Li, Y. Single-and Multiple-Adulterants Determinations of Goat Milk Powder by NIR Spectroscopy Combined with Chemometric Algorithms. Agriculture 2022, 12, 434. [Google Scholar] [CrossRef]
- Zhao, X.; Li, C.; Zhao, Z.; Wu, G.; Xia, L.; Jiang, H.; Wang, T.; Chu, X.; Liu, J. Generic models for rapid detection of vanillin and melamine adulterated in infant formulas from diverse brands based on near-infrared hyperspectral imaging. Infrared Phys. Technol. 2021, 116, 103745. [Google Scholar] [CrossRef]
- Kamboj, U.; Kaushal, N.; Jabeen, S. Near Infrared Spectroscopy as an efficient tool for the Qualitative and Quantitative Determination of Sugar Adulteration in Milk. J. Phys. Conf. Ser. 2020, 1531, 12024. [Google Scholar] [CrossRef]
- Hosseini, E.; Ghasemi, J.B.; Daraei, B.; Asadi, G.; Adib, N. Application of genetic algorithm and multivariate methods for the detection and measurement of milk-surfactant adulteration by attenuated total reflection and near-infrared spectroscopy. J. Sci. Food Agric. 2021, 101, 2696–2703. [Google Scholar] [CrossRef]
- Temizkan, R.; Can, A.; Dogan, M.A.; Mortas, M.; Ayvaz, H. Rapid detection of milk fat adulteration in yoghurts using near and mid-infrared spectroscopy. Int. Dairy J. 2020, 110, 104795. [Google Scholar] [CrossRef]
- Pandiselvam, R.; Mahanti, N.K.; Manikantan, M.R.; Kothakota, A.; Chakraborty, S.K.; Ramesh, S.V.; Beegum, P.S. Rapid detection of adulteration in desiccated coconut powder: Vis-NIR spectroscopy and chemometric approach. Food Control 2022, 133, 108588. [Google Scholar] [CrossRef]
- Spina, A.A.; Ceniti, C.; Piras, C.; Tilocca, B.; Britti, D.; Morittu, V.M. Mid-Infrared (MIR) Spectroscopy for the quantitative detection of cow’s milk in buffalo milk. J. Anim. Sci. Technol. 2022, 64, 531–538. [Google Scholar] [CrossRef]
- Gonçalves, B.H.R.; Silva, G.J.; Jesus, J.C.D.; Conceição, D.G.; Santos, L.S.; Ferrão, S.P. Fast verification of buffalo’s milk authenticity by mid-infrared spectroscopy, analytical measurements and multivariate calibration. J. Braz. Chem. Soc. 2020, 31, 1453–1460. [Google Scholar] [CrossRef]
- Yaman, H. A rapid method for detection adulteration in goat milk by using vibrational spectroscopy in combination with chemometric methods. J. Food Sci. Technol. 2020, 57, 3091–3098. [Google Scholar] [CrossRef] [PubMed]
- Arifah, M.F.; Nisa, K.; Windarsih, A.; Rohman, A. The Application of FTIR Spectroscopy and Chemometrics for the Authentication Analysis of Horse Milk. Int. J. Food Sci. 2022, 2022, 7643959. [Google Scholar] [CrossRef] [PubMed]
- Sitorus, A.; Muslih, M.; Cebro, I.S.; Bulan, R. Dataset of adulteration with water in coconut milk using FTIR spectroscopy. Data Br. 2021, 36, 107058. [Google Scholar] [CrossRef]
- Jaiswal, P.; Jha, S.N.; Kaur, J.; Hg, R. Rapid detection and quantification of soya bean oil and common sugar in bovine milk using attenuated total reflectance–fourier transform infrared spectroscopy. Int. J. Dairy Technol. 2018, 71, 292–300. [Google Scholar] [CrossRef]
- Balan, B.; Dhaulaniya, A.S.; Jamwal, R.; Yadav, A.; Kelly, S.; Cannavan, A.; Singh, D.K. Rapid detection and quantification of sucrose adulteration in cow milk using Attenuated total reflectance-Fourier transform infrared spectroscopy coupled with multivariate analysis. Spectrochim. Acta Part A Mol. Biomol. Spectrosc. 2020, 240, 118628. [Google Scholar] [CrossRef] [PubMed]
- Tian, H.; Chen, S.; Li, D.; Lou, X.; Chen, C.; Yu, H. Simultaneous detection for adulterations of maltodextrin, sodium carbonate, and whey in raw milk using Raman spectroscopy and chemometrics. J. Dairy Sci. 2022, 105, 7242–7252. [Google Scholar] [CrossRef] [PubMed]
- De Oliveira Mendes, T.; Rodrigues, B.V.M.; Porto, B.L.S.; da Rocha, R.A.; de Oliveira, M.A.L.; de Castro, F.K.; de Carvalho dos Anjos, V.; Bell, M.J.V. Raman Spectroscopy as a fast tool for whey quantification in raw milk. Vib. Spectrosc. 2020, 111, 103150. [Google Scholar] [CrossRef]
- Genis, D.O.; Sezer, B.; Durna, S.; Boyaci, I.H. Determination of milk fat authenticity in ultra-filtered white cheese by using Raman spectroscopy with multivariate data analysis. Food Chem. 2021, 336, 127699. [Google Scholar] [CrossRef]
- Ullah, R.; Khan, S.; Ali, H.; Bilal, M. Potentiality of using front face fluorescence spectroscopy for quantitative analysis of cow milk adulteration in buffalo milk. Spectrochim. Acta Part A Mol. Biomol. Spectrosc. 2020, 225, 117518. [Google Scholar] [CrossRef]
- Sezer, B.; Durna, S.; Bilge, G.; Berkkan, A.; Yetisemiyen, A.; Boyaci, I.H. Identification of milk fraud using laser-induced breakdown spectroscopy (LIBS). Int. Dairy J. 2018, 81, 1–7. [Google Scholar] [CrossRef]
- Lai, T.L.; Robbins, H.; Wei, C.Z. Strong consistency of least squares estimates in multiple regression II. J. Multivar. Anal. 1979, 9, 343–361. [Google Scholar] [CrossRef] [Green Version]
- Mandel, J. Use of the singular value decomposition in regression analysis. Am. Stat. 1982, 36, 15–24. [Google Scholar]
- Conceição, D.G.; Gonçalves, B.H.R.; Hora, F.F.D.; Faleiro, A.S.; Santos, L.S.; Ferrão, S.P. Use of FTIR-ATR spectroscopy combined with multivariate analysis as a screening tool to identify adulterants in raw milk. J. Braz. Chem. Soc. 2019, 30, 780–785. [Google Scholar] [CrossRef]
- Trygg, J.; Wold, S. Orthogonal projections to latent structures (O-PLS). J. Chemom. J. Chemom. Soc. 2002, 16, 119–128. [Google Scholar] [CrossRef]
- Delatour, T.; Becker, F.; Krause, J.; Romero, R.; Gruna, R.; Längle, T.; Panchaud, A. Handheld spectral sensing devices should not mislead consumers as far as non-authentic food is concerned: A case study with adulteration of milk powder. Foods 2021, 11, 75. [Google Scholar] [CrossRef]
- Nørgaard, L.; Hahn, M.T.; Knudsen, L.B.; Farhat, I.A.; Engelsen, S.B. Multivariate near-infrared and Raman spectroscopic quantifications of the crystallinity of lactose in whey permeate powder. Int. Dairy J. 2005, 15, 1261–1270. [Google Scholar] [CrossRef]
- Öhman, J.; Geladi, P.; Wold, S. Residual bilinearization. Part 1: Theory and algorithms. J. Chemom. 1990, 4, 79–90. [Google Scholar] [CrossRef]
- Barreto, M.C.; Braga, R.G.; Lemos, S.G.; Fragoso, W.D. Determination of melamine in milk by fluorescence spectroscopy and second-order calibration. Food Chem. 2021, 364, 130407. [Google Scholar] [CrossRef] [PubMed]
- De Araújo Gomes, A.; Schenone, A.V.; Goicoechea, H.C.; de Araújo, M.C.U. Unfolded partial least squares/residual bilinearization combined with the Successive Projections Algorithm for interval selection: Enhanced excitation-emission fluorescence data modeling in the presence of the inner filter effect. Anal. Bioanal. Chem. 2015, 407, 5649–5659. [Google Scholar] [CrossRef]
- Bro, R. PARAFAC. Tutorial and applications. Chemom. Intel. Lab. Syst. 1997, 38, 149–171. [Google Scholar] [CrossRef]
- De Juan, A.; Tauler, R. Multivariate curve resolution (MCR) from 2000: Progress in concepts and applications. Crit. Rev. Anal. Chem. 2006, 36, 163–176. [Google Scholar] [CrossRef]
- Kelwade, J.P.; Salankar, S.S. Radial basis function neural network for prediction of cardiac arrhythmias based on heart rate time series. In Proceedings of the 2016 IEEE First International Conference on Control, Measurement and Instrumentation (CMI), Kolkata, India, 8–10 January 2016; IEEE: New York, NY, USA, 2016; pp. 454–458. [Google Scholar]
- Yabunaka, K.I.; Hosomi, M.; Murakami, A. Novel application of a back-propagation artificial neural network model formulated to predict algal bloom. Water Sci. Technol. 1997, 36, 89–97. [Google Scholar] [CrossRef]
- Wang, Y.; Liu, Q. Fast identification of powdered milk adulteration by generalized regression neural network algorithm. In International Conference on Computer Graphics, Artificial Intelligence, and Data Processing (ICCAID 2021); SPIE: Bellingham, WA, USA, 2022; Volume 12168, pp. 717–724. [Google Scholar]
- Huang, W.; Fan, D.; Li, W.; Meng, Y.; Liu, T.C.Y. Rapid evaluation of milk acidity and identification of milk adulteration by Raman spectroscopy combined with chemometrics analysis. Vib. Spectrosc. 2022, 123, 103440. [Google Scholar] [CrossRef]
- Suykens, J.A.K.; Vandewalle, J. Least square support vector machine classifiers. Neural Process. Lett. 1999, 9, 293–300. [Google Scholar] [CrossRef]
- Yang, K.; An, C.; Zhu, J.; Guo, W.; Lu, C.; Zhu, X. Comparison of near-infrared and dielectric spectra for quantitative identification of bovine colostrum adulterated with mature milk. J. Dairy Sci. 2022, 105, 8638–8649. [Google Scholar] [CrossRef] [PubMed]
- Tibshirani, R. Regression shrinkage and selection via the lasso. J. R. Stat. Soc. B Methodol. 1996, 58, 267–288. [Google Scholar] [CrossRef]
- Rysova, L.; Cejnar, P.; Hanus, O.; Legarova, V.; Havlik, J.; Nejeschlebova, H.; Nemeckova, I.; Jedelska, R.; Bozik, M. Use of MALDI-TOF MS technology to evaluate adulteration of small ruminant milk with raw bovine milk. J. Dairy Sci. 2022, 105, 4882–4894. [Google Scholar] [CrossRef]
- Friedman, J.; Hastie, T.; Tibshirani, R. Additive logistic regression: A statistical view of boosting (with discussion and a rejoinder by the authors). Ann. Stat. 2000, 28, 337–407. [Google Scholar] [CrossRef]
- Ehsani, S.; Dastgerdy, E.M.; Yazdanpanah, H.; Parastar, H. Ensemble classification and regression techniques combined with portable near infrared spectroscopy for facile and rapid detection of water adulteration in bovine raw milk. J. Chemom. 2022; Early View. [Google Scholar]
- Asefa, B.G.; Hagos, L.; Kore, T.; Emire, S.A. Feasibility of Image Analysis Coupled with Machine Learning for Detection and Quantification of Extraneous Water in Milk. Food Anal. Methods 2022, 15, 3092–3103. [Google Scholar] [CrossRef]
- Chen, T.; Guestrin, C. Xgboost: A scalable tree boosting system. In Proceedings of the 22nd ACM Sigkdd International Conference on Knowledge Discovery and Data Mining, San Francisco, CA, USA, 13–17 August 2016; pp. 785–794. [Google Scholar]
- Schlesier, K.; Fauhl-Hassek, C.; Forina, M.; Cotea, V.; Kocsi, E.; Schoula, R.; van Jaarsveld, F.; Wittkowaki, R. Characterisation and determination of the geographical origin of wines. Part I: Overview. Eur. Food Res. Technol. 2009, 230, 13. [Google Scholar] [CrossRef]
- Esbensen, K.H.; Paoletti, C.; Thiex, N. Representative sampling for food and feed materials: A critical need for food/feed safety. J. AOAC Int. 2015, 98, 249–251. [Google Scholar] [CrossRef] [PubMed] [Green Version]
- Peris-Díaz, M.D.; Krężel, A. A guide to good practice in chemometric methods for vibrational spectroscopy, electrochemistry, and hyphenated mass spectrometry. Trends Anal. Chem. 2021, 135, 116157. [Google Scholar] [CrossRef]
- Kemsley, E.K.; Defernez, M.; Marini, F. Multivariate statistics: Considerations and confidences in food authenticity problems. Food Control 2019, 105, 102–112. [Google Scholar] [CrossRef]
- Szymańska, E. Modern data science for analytical chemical data—A comprehensive review. Anal. Chim. Acta 2018, 1028, 1–10. [Google Scholar] [CrossRef] [PubMed]
- Engel, J.; Gerretzen, J.; Szymańska, E.; Jansen, J.J.; Downey, G.; Blanchet, L.; Buydens, L.M. Breaking with trends in pre-processing? Trends Anal. Chem. 2013, 50, 96–106. [Google Scholar] [CrossRef]
- Yang, Y.; Hettinga, K.A.; Erasmus, S.W.; Pustjens, A.M.; van Ruth, S.M. Opportunities for fraudsters: When would profitable milk adulterations go unnoticed by common, standardized FTIR measurements? Food Res. Int. 2020, 136, 109543. [Google Scholar] [CrossRef]
- Oliveri, P.; Malegori, C.; Simonetti, R.; Casale, M. The impact of signal pre-processing on the final interpretation of analytical outcomes—A tutorial. Anal. Chim. Acta 2019, 1058, 9–17. [Google Scholar] [CrossRef] [PubMed]
- Rabatel, G.; Marini, F.; Walczak, B.; Roger, J.M. VSN: Variable sorting for normalization. J. Chemom. 2020, 34, e3164. [Google Scholar] [CrossRef]
- Westad, F.; Marini, F. Validation of chemometric models–a tutorial. Anal. Chim. Acta 2015, 893, 14–24. [Google Scholar] [CrossRef]
- Rajamanickam, V.; Babel, H.; Montano-Herrera, L.; Ehsani, A.; Stiefel, F.; Haider, S.; Presser, B.; Knapp, B. About model validation in bioprocessing. Processes 2021, 9, 961. [Google Scholar] [CrossRef]
- Smilde, A.; Bro, R.; Geladi, P. Multi-Way Analysis in Chemistry and Related Fields; John Wiley & Sons, Ltd.: New York, NY, USA, 2004; Volume 240, pp. 260–280. [Google Scholar]
- Daszykowski, M.; Walczak, B.; Massart, D.L. Representative subset selection. Anal. Chim. Acta 2022, 468, 91–103. [Google Scholar] [CrossRef]
- Williams, P.; Dardenne, P.; Flinn, P. Tutorial: Items to be included in a report on a near infrared spectroscopy project. J. Near Infrared Spectrosc. 2017, 25, 85–90. [Google Scholar] [CrossRef]
- Bittante, G.; Patel, N.; Cecchinato, A.; Berzaghi, P. Invited review: A comprehensive review of visible and near-infrared spectroscopy for predicting the chemical composition of cheese. J. Dairy Sci. 2022, 105, 1817–1836. [Google Scholar] [CrossRef]
- Williams, P.C. Implementation of near-infrared technology. In Near-Infrared Technology in the Agricultural and Food Industries; American Association of Cereal Chemist Press: St. Paul, Minnesota, USA, 2001; pp. 145–169. [Google Scholar]
- Bellon-Maurel, V.; Fernandez-Ahumada, E.; Palagos, B.; Roger, J.M.; McBratney, A. Critical review of chemometric indicators commonly used for assessing the quality of the prediction of soil attributes by NIR spectroscopy. Trends Anal. Chem. 2010, 29, 1073–1081. [Google Scholar] [CrossRef]
- Sharma, R.; Verma, A.; Shinde, N.; Mann, B.; Gandhi, K.; Wichers, J.H.; van Amerongen, A. Adulteration of cow’s milk with buffalo’s milk detected by an on-site carbon nanoparticles-based lateral flow immunoassay. Food Chem. 2021, 351, 129311. [Google Scholar] [CrossRef] [PubMed]
- Agriopoulou, S.; Stamatelopoulou, E.; Varzakas, T. Advances in analysis and detection of major mycotoxins in foods. Foods 2020, 9, 518. [Google Scholar] [CrossRef] [Green Version]
- Di Nardo, F.; Chiarello, M.; Cavalera, S.; Baggiani, C.; Anfossi, L. Ten Years of Lateral Flow Immunoassay Technique Applications: Trends, Challenges and Future Perspectives. Sensors 2021, 21, 5185. [Google Scholar] [CrossRef]
- Agriopoulou, S.; Stamatelopoulou, E.; Varzakas, T. Advances in Occurrence, Importance, and Mycotoxin Control Strategies: Prevention and Detoxification in Foods. Foods 2020, 9, 137. [Google Scholar] [CrossRef]
- Wang, C.; Peng, J.; Liu, D.-F.; Xing, K.-Y.; Zhang, G.-G.; Huang, Z.; Cheng, S.; Zhu, F.F.; Duan, M.L.; Zhang, K.Y.; et al. Lateral flow immunoassay integrated with competitive and sandwich models for the detection of aflatoxin M1 and Escherichia coli O157:H7 in milk. J. Dairy Sci. 2018, 101, 8767–8777. [Google Scholar] [CrossRef] [Green Version]
- Yue, X.; Pan, Q.; Zhou, J.; Ren, H.; Peng, C.; Wang, Z.; Zhang, Y. A simplified fluorescent lateral flow assay for melamine based on aggregation induced emission of gold nanoclusters. Food Chem. 2022, 385, 132670. [Google Scholar] [CrossRef]
- El Sheikha, A.F. DNAFoil: Novel technology for the rapid detection of food adulteration. Trends Food Sci. Technol. 2019, 86, 544–552. [Google Scholar] [CrossRef]
- Roy, M.; Yadav, B.K. Electronic nose for detection of food adulteration: A review. J. Food Sci. Technol. 2022, 59, 846–858. [Google Scholar] [CrossRef] [PubMed]
- Tian, H.; Chen, B.; Lou, X.; Yu, H.; Yuan, H.; Huang, J.; Chen, C. Rapid detection of acid neutralizers adulteration in raw milk using FGC E-nose and chemometrics. J. Food Meas. Charact. 2022, 16, 2978–2988. [Google Scholar] [CrossRef]
- Tohidi, M.; Ghasemi-Varnamkhasti, M.; Ghafarinia, V.; Mohtasebi, S.S.; Bonyadian, M. Identification of trace amounts of detergent powder in raw milk using a customized low-cost artificial olfactory system: A novel method. Measurement 2018, 124, 120–129. [Google Scholar] [CrossRef]


| Type of Milk | Target | Analytical Method(s) | Clustering Method | Approach | Reference |
|---|---|---|---|---|---|
| Milk adulteration | |||||
| Cow’s, sheep’s, and water buffalo’s origin milk | Adulteration from different species’ origin milk | FTIR | HCA | method | [37] |
| Bovine milk | Adulteration with urea | EIS | HCA | Euclidean distance | [36] |
| UTH milk samples (skimmed and semi-skimmed) and raw milk | Adulteration with cheese whey, based on quantification of caseinomacropeptide | FTIR-ATR | HCA | Euclidean distance and Ward’s method | [38] |
| Cow milk | Adulteration with melamine and urea | Electrochemical biosensor | HCA | Ward’s method | [39] |
| Bovine milk | Adulteration with formaldehyde, based on aldehydes and ketones | Colorimetric sensor array | HCA | - | [40] |
| UHT whole bovine milk and UHT goat milk | Adulteration with soymilk in bovine and goat milk, as well as bovine milk in goat milk. | NMR | CA | The minimum distance method | [41] |
| Raw cow milk | Adulteration with Sodium Salicylate, Dextrose, Hydrogen Peroxide, Ammonium Sulphate | Sensor system | k-means clustering algorithm | - | [42] |
| Milk authentication | |||||
| Powder and liquid milk | Type of milk based on metal profiles | ICP-OES | HCA | Euclidean distance and Ward’s method | [43] |
| Organic and conventional milk | Type of milk (organic vs. conventional) based on organic status and trace element content | ICP-MS | HCA | Euclidean distance and Ward’s method | [44] |
| Malaysian vs. milk from other countries | Geographical origin, based on metal content | ICP-MS | HCA | Ward’s method | [45] |
| - | Geographical origin, isotope ratios, metals, and fatty acids | CF-IRMS (δ 18O), EA-IRMS (δ 13C and δ15N), GC (fatty acids), ICP-OES (Na, K, Mn, P, Zn, Ca, Fe, and Mg), and ICP-MS (other metals) | HCA | - | [46] |
| Cow milk | Geographical origin, based on stable isotope ratios | IRMS and CRDS | HCA | - | [47] |
| Raw milk | Geographical origin, based on stable isotope ratios and metal content | IRMS and ICP-MS | HCA and k-means clustering algorithm | HCA: Euclidean distance and Ward’s method K means: 200 iterations and 25 random starting points | [48] |
| Cow, goat, camel, donkey, and yak milk | Species recognition based on sn-2 and sn-1,3 fatty acid composition and sterols | GC, GC-MS | HCA | - | [49] |
| Fresh buffalo, bovine, and donkey milk as well as processed milk samples (pasteurized and dried skimmed powder) | Species recognition based on amino acids, non-amino acids, and citric acid cycle metabolites | GC-MS | HCA | Euclidean distance and Ward’s method | [50] |
| Reconstituted milk vs. UHT milk | Different content of peptides, lipids, and nucleic acids | UPLC–Q-TOF-MS combined with UPLC–MS/MS | HCA | - | [51] |
| Cow milk | Fat globule characteristics (diameter, membrane surface, and yield), fat, protein, fatty acids, calcium content | IR (fat, protein, and lactose contents), GC (fatty acids composition), atomic absorption spectrophotometry (calcium content) | HCA | Euclidean distance | [52] |
| Cow, goat, buffalo, and camel milk | Different seasons of milk collection, based on sterols in milk fat of different species’ origin of milk | GC–MS-SIM | HCA | Euclidean distance | [53] |
| Classification Method | Extended Name | Abbreviation |
|---|---|---|
| Discriminant | Partial least squares-discriminant analysis | PLS-DA |
| Orthogonal partial least squares-discriminant analysis | OPLS-DA | |
| One class-partial least squares | OC-PLS | |
| Quadratic discriminant analysis | QDA | |
| Random forest | RF | |
| Support vector machine | SVM | |
| Linear discriminant analysis | LDA | |
| k-nearest neighbors | kNN | |
| Extreme learning machine | ELM | |
| Ensemble of extreme learning machine | EELM | |
| Class-modeling | Soft independent modeling of class analogy | SIMCA |
| Data-driven soft independent modeling of class analogy | DD-SIMCA | |
| Unequal class models | UNEQ |
Disclaimer/Publisher’s Note: The statements, opinions and data contained in all publications are solely those of the individual author(s) and contributor(s) and not of MDPI and/or the editor(s). MDPI and/or the editor(s) disclaim responsibility for any injury to people or property resulting from any ideas, methods, instructions or products referred to in the content. |
© 2022 by the authors. Licensee MDPI, Basel, Switzerland. This article is an open access article distributed under the terms and conditions of the Creative Commons Attribution (CC BY) license (https://creativecommons.org/licenses/by/4.0/).
Share and Cite
Grassi, S.; Tarapoulouzi, M.; D’Alessandro, A.; Agriopoulou, S.; Strani, L.; Varzakas, T. How Chemometrics Can Fight Milk Adulteration. Foods 2023, 12, 139. https://doi.org/10.3390/foods12010139
Grassi S, Tarapoulouzi M, D’Alessandro A, Agriopoulou S, Strani L, Varzakas T. How Chemometrics Can Fight Milk Adulteration. Foods. 2023; 12(1):139. https://doi.org/10.3390/foods12010139
Chicago/Turabian StyleGrassi, Silvia, Maria Tarapoulouzi, Alessandro D’Alessandro, Sofia Agriopoulou, Lorenzo Strani, and Theodoros Varzakas. 2023. "How Chemometrics Can Fight Milk Adulteration" Foods 12, no. 1: 139. https://doi.org/10.3390/foods12010139