
Insight into the Recent Application of Chemometrics in Quality Analysis and Characterization of Bee Honey during Processing and Storage
 , , ,
, , , 
Abstract
:1. Introduction
2. Methodology and Design
3. Honey Processing and Storage
3.1. Influence of Storage Conditions on Raw Honey Quality
3.2. Influence of Storage Conditions on Raw Honey Quality
3.3. Honey Thermal Treatment
4. Chemometrics Used in Honey Quality Analysis during Storage and Processing
4.1. Introduction to Chemometrics in Honey Quality Analysis
4.1.1. Unsupervised Chemometric Methods
- ANOVA or ANalysis Of VAriance is used to compare statistical populations in order to decide if there are statistically significant differences between them. Its use has become a standard requirement for proving the soundness and validity of a research hypothesis. In the context of chemometrics, ANOVA is used to investigate the effect of independent variables on the dependent variable. If multiple dependent variables are of interest then a Multivariate ANOVA (MANOVA) is performed [126];
- Cluster Analysis (CA) which groups samples in clusters with the most used being:
- o
- HCA or Hierarchical Cluster Analysis [127], which uses distance-based methods to group the data in hierarchical clusters and to place a new sample in this hierarchy;
- o
- K-means clustering, which is a non-hierarchical clustering of data in k clusters.
- Principal Component Analysis (PCA) is used to reduce the dimensionality of a sample space when many features are investigated for many samples; they are plotted in a reduced space where the axes are combinations of the features chosen so that the relations between them (distances) are preserved [130]. PCA principal use is for visualization and qualitative analysis and it needs the use of a secondary method—usually a supervised Discriminant Analysis (DA) method—for classification. In [128,129], PCA is used in combination with k-Mean cluster analysis to visualize the grouping of pollutants based on geographical location [127] or human activity [128]. PCA was used by [131] to cluster honey types based on the data expressing the content in vi-tamin B2 and Cu and the antioxidant activity measured by 2,2′-azino-bis(3-ethylbenzothiazoline-6-sulfonic acid (ABTS) [132] and CUPric Reducing Antioxidant Capacity (CUPRAC) [133] values. The grouping allows the identification of the botanical origin:
- o
- An extension to multiple dimensions of PCA is the PARAllel FACtor analysis (PARAFAC) [134,135,136] which can be used on multiway spectral data. It is employed in [134] where fluorescence spectrometry data are first decomposed with PARAFAC in order to identify the representative patterns in honey. An improvement of the traditional PARAFAC specifically for use on chromatography data is the alternating trilinear decomposition algorithm (ATLD) [137]. ATLD can be used to decompose the HPLC data in order to evidence the data related to the phenolic components used as markers; the quantitative data can be subjected to PCA analysis to visualize the clustering potential of the chosen markers in honey [138].
4.1.2. Supervised Chemometric Methods
- DA methods which use the observations of a number of variables for each sample for the separation of samples of the training set in groups and for the allocation of new (test) samples in these groups [140]. DA methods can be grouped after the type of relation used in:
- o
- Linear Discriminant Analysis (LDA) which builds a discriminator function as a linear combination of the independent variables. It is a common technique used to build predictors for the botanical and geographical origins of honey based on their composition. One recent example is given in [139], that used LDA to develop a predictor for the geographical origin of Bracatinga honeydew honey based on IPC-MS data.
- o
- Stepwise Linear Discriminant Analysis (SLDA) uses a stepwise inclusion of the independent variables in the model [144].
- Partial Least Square (PLS) methods are regression-type methods. In opposition to the Ordinary Least Squares (OLS), where all independent variables are used, in PLS a smaller number of uncorrelated components are generated from the independent variables in a similar fashion to PCA [146]. Some examples of using these components for regression in honey analysis are:
- o
- o
- Partial Least Square—Discriminant Analysis (PLS-DA) is a combination between PLS and DA, used when categorical results are needed [148]. The influence of different preprocessing steps (autoscale, variance (std) scaling, min–max scaling, class centroid centering and scaling, smoothing, SNV and Pareto) on the accuracy of a PLS DA predictor for the geographical and botanical origin of honey, is analyzed by [149]. The predictor uses 1H NMR spectra data. A first pretreatment step is the reduction in the data by replacing each six consecutive chemical shifts with their mean. For the geographical origin, identification of the highest accuracy is obtained through autoscale, variance (std) scaling and class centroid centering and scaling. For the botanical origin, the highest accuracy is obtained through the variance (std) scaling data pre-treatment [149];
- o
- Unfolded PLS-DA UPLS-DA combines unfolded PLS [150] which decompose the sample spectra to extract the relevant information with DA;
- o
- o
- Linear discriminant analysis based on partial least-squares (PLS-LDA) in which LDA is performed using PLS as the reduction step [153];
- o
- Orthogonal projections to latent structures discriminant analysis (OPLS-DA) combines Orthogonal projections to latent structures (OPLS), which separates the independent variables into predictive and uncorrelated variables, with DA for a categorical response [154];
- 1H NMR spectra of Chinese honey samples are used to identify adulterated honey. A PCA LDA discriminator and an OPLS-DA one were built, trained, validated and tested. The OPLS-DA has a slightly better accuracy. The OPLS-DA also helped to identify a set of substances with significantly different concentrations in altered and unaltered honey that can be used as a marker for adulteration [155];
- PCA and OPLS-DA on proteomics data obtained with sequential window acquisition of all theoretical fragment ion mass spectra (SWATH-MS) to develop a predictor for honey adulteration, the producing region (Tainan, Changhua, and Taichung), country (Taiwan and Thailand) and botanical sources (longan and litchi) [138]:
- o
- Orthogonalized partial least squares coupled with linear discriminant analysis (SO-PLS-LDA) is a multi-block discriminant classifier that results from the combination of LDA with the sequential and orthogonalized-partial least squares method (SO-PLS) which is a multi-block regression method [156,157]. A method for detection of honey alteration after heat treatment (4 h at 80 °C) is presented in [158]. The data are obtained through differential pulse voltammetry using three types of Natural Deep Eutectic Solvents (NADES) buffers and a normal buffer with the multiple wells screen-printed carbon electrodes. The data for each type of buffer were first used individually for developing a PLS DA classification models. With the fused data from the four sensors, a multiblock classifier based on SO-PLS-LDA with very good accuracy is developed;
- k-Nearest Neighbors method (kNN) classifies the sample based on the classes of the k-nearest neighbors [159];
- Soft Independent Modeling by Class Analogy Method (SIMCA) uses PCA on the samples of the training set for the construction of the classification models [160].
- Support Vector Machine methods (SVM) use the training set to construct the hyperplane that separates the classes with the largest margin [163]. Support vector machine can be used for regression (SVR) [163] or for classification (SVC) [164]. The Least Squared-Support Vector Machines (LS-SVM) [165] are improved variants.
- Artificial Neural Networks (ANN) are universal approximators that mimic the functioning of biological neurons [171]. Convolutional neural networks (CNN) are ANN in which the connectivity is inspired by the animal visual cortex.
4.2. Modification of the Quality Parameters Used for Quality Evaluation of Honey during Processing as Analyzed by Chemometrics
4.2.1. Free Acidity
- (a)
- Organic acids. Acidity is mainly derived from the presence of organic acids, up to 0.5% in honeys, contributing to honey flavor, stability against microorganisms, enhancement of chemical reactions and antibacterial and antioxidant activities [178]. The principal organic acid in honey is gluconic acid derived from the activity of the glucose-oxidase enzyme on the glucose substrate, that is in equilibrium with δ-gluconolactone [179,180,181,182]. The gluconic acid level, for a specific honey species, is mostly dependent on the time elapsed between the collection of nectar and formation of the final honey by bees for obtaining the final density in the honeycomb cells, while glucose–oxidase activity becomes insignificant when the honey is thickened [183]. Moreover, other organic acids are found in honey such as formic, aspartic, acetic, butyric, citric, fumaric, galacturonic, gluconic, glutamic, butyric, glutaric, 2-hydroxybutyric, glyoxylic, α -hydroxyglutaric, lactic, isocitric, α-ketoglutaric, malic, 2-oxopentanoic, malonic, methylmalonic, propionic, pyruvic, quinic, shikimic, succinic, tartaric, oxalic acid and others [184]; their ratio and abundance are influenced by the honey species enabling discrimination of the honeys [179,185], while some organic acids have exhibited a high discriminant power for the separation of conventional from organic honeys [186];
- (b)
- Lactones. Lactones found in honey are mostly in the form of gluconolactones, constituting part of the organic acids in the intra-esterified form; they contribute a reserved acidity measured when the honey solution becomes alkaline [36]; lactonic acidity is added to FA to yield the total acidity of honey [77]. The pH of honey and its acidity are not parameters directly related to each other because many other components found in honey exert a buffering capacity, therefore, compensating for a part of honey’s true acidity [187,188]. Similarly to pH, free and lactonic acidity in the different honeys are dependent on their botanical origin, also influenced by the harvesting season [178,183,187,189,190,191].
- (a)
- Effect of maturation. During honey maturation, the FA or total acidity is increased while pH is significantly decreased [178]. In a pioneering study covering the introduction of national legislative limits for Talh honey, the free acidity (FA) of Talh honey was determined from Talh tree leaves and flowers (30 ± 0.99; 34 ± 0.92 meq/kg) to bee crop (honey stomach) and unripe honey (43 ± 1.80; 72 ± 1.56 meq/kg) and finally to ripe honey (77 ± 1.28 meq/kg), [193], while the highest pH value was recorded in the leaves and kept decreasing as honey production proceeded, obtaining its lowest value in ripe honey (4.91 ± 0.06);
- (b)
- Effect of storage. Reports have shown a significant effect of storage on honey FA, pH, (p < 0.05), with FA increasing and pH decreasing with storage time [181,194,195]. In one kinetic study, exclusively dedicated to the variability of all the three parameters versus 30 months storage for honey stored at room temperature (15–25 °C), lactonic acidity found to increase by storage time (p < 0.05), even at a higher degree than FA increased or pH decreased [196], while in some cases lactonic acidity was slightly decreased, and total acidity was increased [181]. Formation of levulinic and formic acids also is derived from 5-HMF transformation, and keep increasing by storage [197]. Evaluation of the variability of FA, pH, lactonic acidity, and total acidity has resulted in estimation of 20 months of storage to be the “best before” period “once opened” [196].Investigation of the effect of short storage at 35–40 °C for 3 and 6 months with or without the addition of metabisulfites (12 pp) on water content (WC), pH, FA, lactone acidity and total acidity of two honeys, cashew and marmeleiro [198], showed that significant differences were observed for pH, FA, lactone acidity and total acidity compared to the respective parameters for the fresh samples. A reverse correlation between FA and lactone acidity was recorded and attributed to the glucose–oxidase activity that converts glucose to gluconolactone, which is consequently hydrolyzed to gluconic acid. In this study, FA is reduced but lactone acidity is increased with the storage time. The presence of bisulfite acted upon the esterification of gluconic acid to increase the lactone concentration [198];
- (c)
- Effect of dehumidification. Dehumidification of honey in other studies has shown no differences in pH and FA between raw and dehumidified honeys when a group of samples from the stingless bees H. itama, G. thoratica and T. apicalis honeybee species were used. However, samples of H. itamas honey had a lower FA and higher pH and ash content values than G. thoratica honey samples [199], similarly to honeys of the other bee tribe [200];
- (d)
- Effect of temperature/storage. Storage under different thermal conditions for times up to eight months induced a great increase in the free acidity of Talh honey, a rare type of honey because of its high FA. Talh honey naturally exceeds the permitted level for the FA values (>50 meq/kg) which is attributable to the plant origin. Storage temperature was found to be a factor with the highest significant influencing power on the FA (p < 0.05). Although all the values of FA in this study were beyond the standard limit, the results indicated that the stability of the FA of Talh honey was maintained stable at low temperatures (0–25 °C) for up to 6 months without significant effects [194]. In this study, statistical analysis showed the FA to exert a positive correlation with storage period (0.401), storage temperature (0.631), 5-HMF (0.852), color (0.541), moisture (0.440) and EC (0.155). On the other hand, FA was negatively correlated (p < 0.05) with glucose (−0.892), pH (−0.851), fructose (−0.821), sucrose (−0.422) and diastase activity (DN) (−0.309). Thus, low pH, DN and sugars are associated with higher FA. The strong positive correlation of FA with the 5-HMF is related to the strong effect of pH on the formation of furfurals generated more by the Amadori Rearrangement Products pathway than the routes of reductones and fission products dominant at pH > 7 [181,201].
4.2.2. Ash Content and Electric Conductivity (EC)
4.2.3. Sugars
4.2.4. HMF
4.2.5. Components in Crystallization
4.2.6. Amino Acids/Proteins
4.2.7. Diastase Activity
4.2.8. Water Content
4.3. Chemometrics Used in Recent Studies Related to Honey Quality Analysis during Storage and Processing
5. Conclusions
Author Contributions
Funding
Data Availability Statement
Conflicts of Interest
References
- Eyer, M.; Neumann, P.; Dietemann, V. A Look into the Cell: Honey Storage in Honey Bees, Apis mellifera. PLoS ONE 2016, 11, e0161059. [Google Scholar] [CrossRef] [Green Version]
- Srivastava, P.K. Status Report on Bee Keeping and Honey Processing. 2020. Available online: https://msmedikanpur.gov.in/cmdatahien/reports/diffIndustries/Status%20Report%20on%20Bee%20keeping%20&%20Honey%20Processing%202019-202020.pdf (accessed on 21 January 2022).
- Long, L. A Global History; Reaction Books Ltd.: London, UK, 2017; pp. 8–15. [Google Scholar]
- Dunne, J.; Höhn, A.; Franke, G.; Neumann, K.; Breunig, P.; Gillard, T.; Walton-Doyle, C.; Evershed, R.P. Honey-collecting in prehistoric West Africa from 3500 years ago. Nat. Commun. 2021, 12, 2227. [Google Scholar] [CrossRef]
- Dranca, F.; Ropciuc, S.; Pauliuc, D.; Oroian, M. Honey adulteration detection based on composition and differential scanning calorimetry (DSC) parameters. LWT 2022, 168, 113910. [Google Scholar] [CrossRef]
- Marlowe, F.W.; Berbesque, J.C.; Wood, B.; Crittenden, A.; Porter, C.; Mabulla, A. Honey, Hadza, hunter-gatherers, and human evolution. J. Hum. Evol. 2014, 71, 119–128. [Google Scholar] [CrossRef]
- Chirsanova, A.; Capcanari, T.; Boiştean, A.; Khanchel, I. Bee honey: History, characteristics, properties, benefits and adulteration in the beekeeping sector. J. Soc. Sci. 2021, 4, 98–114. [Google Scholar] [CrossRef]
- Gündoğdu, E.; Cakmakci, S.; Şat, İ. An Overview of Honey: Its Composition, Nutritional and Functional Properties. J. Food Sci. Eng. 2019, 9, 10–14. [Google Scholar] [CrossRef]
- Khan, R.U.; Naz, S.; Abudabos, A.M. Towards a better understanding of the therapeutic applications and corresponding mechanisms of action of honey. Environ. Sci. Pollut. Res. Int. 2017, 24, 27755–27766. [Google Scholar] [CrossRef]
- Louppis, A.P.; Karabagias, I.K.; Kontakos, S.; Kontominas, M.G.; Papastephanou, C. Botanical discrimination of Greek unifloral honeys based on mineral content in combination with physicochemical parameter analysis, using a validated chemometric approach. Microchem. J. 2017, 135, 180–189. [Google Scholar] [CrossRef]
- Notardonato, I.; Passarella, S.; Ianiri, G.; Di Fiore, C.; Russo, M.V.; Avino, P. Analytical Method Development and Chemometric Approach for Evidencing Presence of Plasticizer Residues in Nectar Honey Samples. Int. J. Environ. Res. Public Health 2020, 17, 1692. [Google Scholar] [CrossRef] [Green Version]
- Nayik, G.A.; Nanda, V. A chemometric approach to evaluate the phenolic compounds, antioxidant activity and mineral content of different unifloral honey types from Kashmir, India. LWT 2016, 74, 504–513. [Google Scholar] [CrossRef]
- da Silva, P.M.; Gauche, C.; Gonzaga, L.V.; Costa, A.C.O.; Fett, R. Honey: Chemical composition, stability and authenticity. Food Chem. 2016, 196, 309–323. [Google Scholar] [CrossRef]
- Ajibola, A.; Chamunorwa, J.P.; Erlwanger, K.H. Nutraceutical values of natural honey and its contribution to human health and wealth. Nutr. Metab. 2012, 9, 61. [Google Scholar] [CrossRef] [Green Version]
- Liyanage, D.; Bauddhaloka, M. Health benefits and traditional uses of honey: A review. J. Apith. 2017, 2, 9–14. [Google Scholar]
- Mironescu, M.; Fratila, L.; Hupert, A.; Mironescu, I.D. Obtaining and Characterisation of Starch-Based Edible Films Incorporating Honey, Propolis and Bee Bread. Acta Univ. Cibiniensis. Ser. E Food Technol. 2019, 23, 193–198. [Google Scholar] [CrossRef] [Green Version]
- Camacho-Bernal, G.I.; Nelly del Socorro, C.-C.; Ramírez-Moreno, E.; Delgado-Olivares, L.; Zafra-Rojas, Q.Y.; Castañeda-Ovando, A.; Suárez-Jacobo, Á. Addition of Bee Products in Diverse Food Sources: Functional and Physicochemical Properties. Appl. Sci. 2021, 11, 8156. [Google Scholar] [CrossRef]
- Aurongzeb, M.; Azim, M.K. Antimicrobial properties of natural honey: A review of literature. Pak. J. Biochem. Mol. Biol. 2011, 44, 118–124. [Google Scholar]
- Almasaudi, S. The antibacterial activities of honey. Saudi J. Biol. Sci. 2021, 28, 2188–2196. [Google Scholar] [CrossRef]
- Khalil, I.; Moniruzzaman, M.; Boukraâ, L.; Benhanifia, M.; Islam, A.; Islam, N.; Sulaiman, S.A.; Gan, S.H. Physicochemical and antioxidant properties of Algerian honey. Molecules 2012, 17, 11199–11215. [Google Scholar] [CrossRef] [Green Version]
- Kek, S.P.; Chin, N.L.; Yusof, Y.A.; Tan, S.W.; Chua, L.S. Classification of entomological origin of honey based on its physicochemical and antioxidant properties. Int. J. Food Prop. 2017, 20, S2723–S2738. [Google Scholar] [CrossRef]
- Erejuwa, O.O.; Sulaiman, S.A.; Ab Wahab, M.S. Honey: A novel antioxidant. Molecules 2012, 17, 4400–4423. [Google Scholar] [CrossRef]
- Ali, A.M.; Kunugi, H. Propolis, Bee Honey, and Their Components Protect against Coronavirus Disease 2019 (COVID-19): A Review of In Silico, In Vitro, and Clinical Studies. Molecules 2021, 26, 1232. [Google Scholar] [CrossRef]
- Ranneh, Y.; Akim, A.M.; Hamid, H.A.; Khazaai, H.; Fadel, A.; Zakaria, Z.A.; Albujja, M.; Bakar, M.F.A. Honey and its nutritional and anti-inflammatory value. BMC Complement. Med. Ther. 2021, 21, 30. [Google Scholar] [CrossRef]
- Premratanachai, P.; Chanchao, C. Review of the anticancer activities of bee products. Asian Pac. J. Trop. Biomed. 2014, 4, 337–344. [Google Scholar] [CrossRef] [Green Version]
- Directive 2014/63/EU. Directive 2014/63/EU of the European Parliament and of the Council Amending Council Directive 2001/110/EC Relating to Honey. 2014. Available online: https://eur-lex.europa.eu/legal-content/EN/TXT/HTML/?uri=CELEX%3A32014L0063 (accessed on 21 January 2022).
- Karabagias, I.K.; Karabournioti, S. Discrimination of Clover and Citrus Honeys from Egypt According to Floral Type Using Easily Assessable Physicochemical Parameters and Discriminant Analysis: An External Validation of the Chemometric Approach. Foods 2018, 7, 70. [Google Scholar] [CrossRef] [Green Version]
- Zhang, X.-H.; Qing, X.-D.; Mu, S.-T.; Wang, D.; Zheng, J.-J.; Zhou, S.-J.; Kang, C.; Liu, Z. Authentication of honey of different nectar sources and antioxidant property evaluation by phenolic composition analysis with chemometrics. Food Control 2021, 124, 107900. [Google Scholar] [CrossRef]
- Olawode, E.O.; Tandlich, R.; Cambray, G. 1H-NMR Profiling and Chemometric Analysis of Selected Honeys from South Africa, Zambia, and Slovakia. Molecules 2018, 23, 578. [Google Scholar] [CrossRef] [Green Version]
- Abdulkhaliq, A.; Swaileh, K.M. Physico-chemical properties of multi-floral honey from the West Bank, Palestine. Int. J. Food Prop. 2017, 20, 447–454. [Google Scholar] [CrossRef] [Green Version]
- Tomczyk, M.; Zaguła, G.; Puchalski, C.; Dżugan, M. Transfer of Some Toxic Metals from Soil to Honey Depending on Bee Habitat Conditions. Acta Univ. Cibiniensis. Ser. E Food Technol. 2020, 24, 49–59. [Google Scholar] [CrossRef]
- Lazor, P.; Tomáš, J.; Tóth, T.; Tóth, J.; Čéryová, S. Monitoring of air pollution and atmospheric deposition of heavy metals by analysis of honey. J. Microbiol. Biotechnol. Food Sci. 2021, 4, 522–533. [Google Scholar]
- Shamsudin, S.; Selamat, J.; Sanny, M.; A, R.S.; Jambari, N.N.; Khatib, A. A Comparative Characterization of Physicochemical and Antioxidants Properties of Processed Heterotrigona itama Honey from Different Origins and Classification by Chemometrics Analysis. Molecules 2019, 24, 3898. [Google Scholar] [CrossRef] [Green Version]
- Krishnan, R.; Mohammed, T.; Kumar, G.S.; Arunima, S. Honey crystallization: Mechanism, evaluation and application. J. Pharm. Innov. 2021, 10, 222–231. [Google Scholar] [CrossRef]
- Grégrová, A.; Kružík, V.; Vrácovská, E.; Rajchl, A.; Čížková, H. Evaluation of factors affecting crystallization of disparate set of multi-flower honey samples. Agron. Res. 2015, 13, 1215–1226. [Google Scholar]
- Machado De-Melo, A.A.; Almeida-Muradian, L.B.D.; Sancho, M.T.; Pascual-Maté, A. Composition and properties of Apis mellifera honey: A review. J. Apic. Res. 2018, 57, 5–37. [Google Scholar] [CrossRef]
- Sanova, P.; Jitka, S.; Hrubcová, B.; Šeráková, P. Segmentation of Honey Buyers’ Behaviour by Conjoint Analysis. Sci. Agric. Bohem. 2017, 48, 55–62. [Google Scholar] [CrossRef]
- Luo, X.; Dong, Y.; Gu, C.; Zhang, X.; Ma, H. Processing Technologies for Bee Products: An Overview of Recent Developments and Perspectives. Front. Nutr. 2021, 8, 727181. [Google Scholar] [CrossRef] [PubMed]
- Thrasyvoulou, A.; Tananaki, C.; Goras, G.; Karazafiris, E.; Dimou, M.; Liolios, V.; Kanelis, D.; Gounari, S. Legislation of honey criteria and standards. J. Apic. Res. 2018, 57, 88–96. [Google Scholar] [CrossRef]
- Israili, Z.H. Antimicrobial properties of honey. Am. J. Ther. 2014, 21, 304–323. [Google Scholar] [CrossRef]
- Piotr, S. Antimicrobial Activity of Honey. In Honey Analysis; Vagner de Alencar Arnaut de, T., Ed.; IntechOpen: Rijeka, Croatia, 2017; p. 10. [Google Scholar]
- Martinello, M.; Mutinelli, F. Antioxidant Activity in Bee Products: A Review. Antioxidants 2021, 10, 71. [Google Scholar] [CrossRef]
- Santos, M.C.; Nascimento, P.A.M.; Guedes, W.N.; Pereira-Filho, E.R.; Filletti, É.R.; Pereira, F.M.V. Chemometrics in analytical chemistry—An overview of applications from 2014 to 2018. Eclet. Quim. 2019, 44, 11–25. [Google Scholar] [CrossRef] [Green Version]
- Kuś, P.M.; Rola, R. LC-QqQ-MS/MS methodology for determination of purine and pyrimidine derivatives in unifloral honeys and application of chemometrics for their classification. Food Chem. 2021, 348, 129076. [Google Scholar] [CrossRef]
- Liu, T.; Ming, K.; Wang, W.; Qiao, N.; Qiu, S.; Yi, S.; Huang, X.; Luo, L. Discrimination of honey and syrup-based adulteration by mineral element chemometrics profiling. Food Chem. 2021, 343, 128455. [Google Scholar] [CrossRef] [PubMed]
- Drivelos, S.A.; Danezis, G.P.; Halagarda, M.; Popek, S.; Georgiou, C.A. Geographical origin and botanical type honey authentication through elemental metabolomics via chemometrics. Food Chem. 2021, 338, 127936. [Google Scholar] [CrossRef] [PubMed]
- Zhang, J.; Chen, H.; Fan, C.; Gao, S.; Zhang, Z.; Bo, L. Classification of the botanical and geographical origins of Chinese honey based on 1H NMR profile with chemometrics. Food Res. Int. 2020, 137, 109714. [Google Scholar] [CrossRef] [PubMed]
- Ghanavati Nasab, S.; Javaheran Yazd, M.; Marini, F.; Nescatelli, R.; Biancolillo, A. Classification of honey applying high performance liquid chromatography, near-infrared spectroscopy and chemometrics. Chemom. Intell. Lab. Syst. 2020, 202, 104037. [Google Scholar] [CrossRef]
- Revenga-Parra, M.; Robledo, S.N.; Martínez-Periñán, E.; González-Quirós, M.M.; Colina, A.; Heras, A.; Pariente, F.; Lorenzo, E. Direct determination of monosaccharides in honey by coupling a sensitive new Schiff base Ni complex electrochemical sensor and chemometric tools. Sens. Actuators B Chem. 2020, 312, 127848. [Google Scholar] [CrossRef]
- Rodríguez-Flores, M.S.; Escuredo, O.; Míguez, M.; Seijo, M.C. Differentiation of oak honeydew and chestnut honeys from the same geographical origin using chemometric methods. Food Chem. 2019, 297, 124979. [Google Scholar] [CrossRef] [PubMed]
- Stöbener, A.; Naefken, U.; Kleber, J.; Liese, A. Determination of trace amounts with ATR FTIR spectroscopy and chemometrics: 5-(hydroxymethyl)furfural in honey. Talanta 2019, 204, 1–5. [Google Scholar] [CrossRef]
- Wang, X.; Yang, S.; He, J.; Chen, L.; Zhang, J.; Jin, Y.; Zhou, J.; Zhang, Y. A green triple-locked strategy based on volatile-compound imaging, chemometrics, and markers to discriminate winter honey and sapium honey using headspace gas chromatography-ion mobility spectrometry. Food Res. Int. 2019, 119, 960–967. [Google Scholar] [CrossRef]
- Ciulu, M.; Serra, R.; Caredda, M.; Salis, S.; Floris, I.; Pilo, M.I.; Spano, N.; Panzanelli, A.; Sanna, G. Chemometric treatment of simple physical and chemical data for the discrimination of unifloral honeys. Talanta 2018, 190, 382–390. [Google Scholar] [CrossRef]
- Ferreiro-González, M.; Espada-Bellido, E.; Guillén-Cueto, L.; Palma, M.; Barroso, C.G.; Barbero, G.F. Rapid quantification of honey adulteration by visible-near infrared spectroscopy combined with chemometrics. Talanta 2018, 188, 288–292. [Google Scholar] [CrossRef]
- Devi, A.; Jangir, J.; Anu-Appaiah, K.A. Chemical characterization complemented with chemometrics for the botanical origin identification of unifloral and multifloral honeys from India. Food Res. Int. 2018, 107, 216–226. [Google Scholar] [CrossRef] [PubMed]
- Sun, Z.; Zhao, L.; Cheng, N.; Xue, X.; Wu, L.; Zheng, J.; Cao, W. Identification of botanical origin of Chinese unifloral honeys by free amino acid profiles and chemometric methods. J. Pharm. Anal. 2017, 7, 317–323. [Google Scholar] [CrossRef] [PubMed]
- Azevedo, M.S.; Seraglio, S.K.T.; Rocha, G.; Balderas, C.B.; Piovezan, M.; Gonzaga, L.V.; Falkenberg, D.D.B.; Fett, R.; de Oliveira, M.A.L.; Costa, A.C.O. Free amino acid determination by GC-MS combined with a chemometric approach for geographical classification of bracatinga honeydew honey (Mimosa scabrella Bentham). Food Control 2017, 78, 383–392. [Google Scholar] [CrossRef]
- Spiteri, M.; Rogers, K.M.; Jamin, E.; Thomas, F.; Guyader, S.; Lees, M.; Rutledge, D.N. Combination of 1H NMR and chemometrics to discriminate manuka honey from other floral honey types from Oceania. Food Chem. 2017, 217, 766–772. [Google Scholar] [CrossRef]
- Pasias, I.N.; Kiriakou, I.K.; Proestos, C. HMF and diastase activity in honeys: A fully validated approach and a chemometric analysis for identification of honey freshness and adulteration. Food Chem. 2017, 229, 425–431. [Google Scholar] [CrossRef]
- Popek, S.; Halagarda, M.; Kursa, K. A new model to identify botanical origin of Polish honeys based on the physicochemical parameters and chemometric analysis. LWT 2017, 77, 482–487. [Google Scholar] [CrossRef]
- Karabagias, I.K.; Louppis, A.P.; Karabournioti, S.; Kontakos, S.; Papastephanou, C.; Kontominas, M.G. Characterization and geographical discrimination of commercial Citrus spp. honeys produced in different Mediterranean countries based on minerals, volatile compounds and physicochemical parameters, using chemometrics. Food Chem. 2017, 217, 445–455. [Google Scholar] [CrossRef]
- Li, S.; Zhang, X.; Shan, Y.; Su, D.; Ma, Q.; Wen, R.; Li, J. Qualitative and quantitative detection of honey adulterated with high-fructose corn syrup and maltose syrup by using near-infrared spectroscopy. Food Chem. 2017, 218, 231–236. [Google Scholar] [CrossRef]
- Arroyo-Manzanares, N.; García-Nicolás, M.; Castell, A.; Campillo, N.; Viñas, P.; López-García, I.; Hernández-Córdoba, M. Untargeted headspace gas chromatography—Ion mobility spectrometry analysis for detection of adulterated honey. Talanta 2019, 205, 120123. [Google Scholar] [CrossRef]
- Rodríguez-Flores, M.S.; Falcão, S.I.; Escuredo, O.; Seijo, M.C.; Vilas-Boas, M. Description of the volatile fraction of Erica honey from the northwest of the Iberian Peninsula. Food Chem. 2021, 336, 127758. [Google Scholar] [CrossRef]
- Khansaritoreh, E.; Salmaki, Y.; Akbari Azirani, T.; Henareh, F.; Alizadeh, K.; Ramezani, E.; Zarre, S.; Beckh, G.; Behling, H. The sources and quality of Iranian honey. Heliyon 2021, 7, e06651. [Google Scholar] [CrossRef] [PubMed]
- Zawawi, N.; Chong, P.J.; Mohd Tom, N.N.; Saiful Anuar, N.S.; Mohammad, S.M.; Ismail, N.; Jusoh, A.Z. Establishing Relationship between Vitamins, Total Phenolic and Total Flavonoid Content and Antioxidant Activities in Various Honey Types. Molecules 2021, 26, 4399. [Google Scholar] [CrossRef] [PubMed]
- Saklani, S.; Kuma, N. Quality Honey Production, Processing, and Various Mechanisms for Detection of Adulteration. In A Miraculous Product of Nature; Kumar, B., Agrawal, O.P., Hajam, Y.A., Eds.; CRC Press: Boca Raton, FL, USA, 2022. [Google Scholar]
- Habryka, C.; Socha, R.; Juszczak, L. The Effect of Enriching Honey with Propolis on the Antioxidant Activity, Sensory Characteristics, and Quality Parameters. Molecules 2020, 25, 1176. [Google Scholar] [CrossRef] [PubMed] [Green Version]
- Kowalski, S.; Makarewicz, M. Functional properties of honey supplemented with bee bread and propolis. Nat. Prod. Res. 2017, 31, 2680–2683. [Google Scholar] [CrossRef] [PubMed]
- Sowa, P.; Tarapatskyy, M.; Puchalski, C.; Jarecki, W.; Dżugan, M. A novel honey-based product enriched with coumarin from Melilotus flowers. J. Food Meas. Charact. 2019, 13, 1748–1754. [Google Scholar] [CrossRef] [Green Version]
- Guldas, M.; Gurbuz, O.; Cakmak, I.; Yildiz, E.; Sen, H. Effects of honey enrichment with Spirulina platensis on phenolics, bioaccessibility, antioxidant capacity and fatty acids. LWT 2022, 153, 112461. [Google Scholar] [CrossRef]
- Tomczyk, M.; Miłek, M.; Sidor, E.; Kapusta, I.; Litwińczuk, W.; Puchalski, C.; Dżugan, M. The Effect of Adding the Leaves and Fruits of Morus alba to Rape Honey on Its Antioxidant Properties, Polyphenolic Profile, and Amylase Activity. Molecules 2020, 25, 84. [Google Scholar] [CrossRef] [Green Version]
- Štajner, D.; Popović, B.M.; Čanadanović-Brunet, J.; Đilas, S.; Ćetković, G. Nutritive composition and free radical scavenger activity of honey enriched with of Rosa spp. LWT-Food Sci. Technol. 2014, 55, 408–413. [Google Scholar] [CrossRef]
- Miłek, M.; Grabek-Lejko, D.; Stępień, K.; Sidor, E.; Mołoń, M.; Dżugan, M. The enrichment of honey with Aronia melanocarpa fruits enhances its in vitro and in vivo antioxidant potential and intensifies its antibacterial and antiviral properties. Food Funct. 2021, 12, 8920–8931. [Google Scholar] [CrossRef]
- Šedík, P.; Horská, E.; Ivanišová, E.; Kačániová, M.; Krasnodębski, A. Consumer behaviour of young generation in slovakia towards cocoa-enriched honey. Potravinárstvo/Slovak J. Food Sci. 2019, 13, 18–24. [Google Scholar] [CrossRef] [Green Version]
- Šedík, P.; Cristina Bianca, P.; Ivanišová, E. Interdisciplinary Approach Towards Consumer Acceptability of Flavoured Honey: Case of Young Generation in Slovakia. Bull. UASVM Food Sci. Technol. 2020, 77, 2020. [Google Scholar] [CrossRef] [PubMed]
- Directive 2001/110/EC. European Commission Council Directive 2001/110/EC of 20 December 2001 Relating to Honey. Off. J. Eur. Communities 2002, 10, 47–52.
- Chin, N.L.; Sowndhararajan, K. A Review on Analytical Methods for Honey Classification, Identification and Authentication. In Honey Analysis—New Advances and Challenges; De Toledo, V.D.A.A., Dechechi Chambó, E., Eds.; IntechOpen Limited: London, UK, 2020. [Google Scholar]
- Oroian, M.; Amariei, S.; Escriche, I.; Leahu, A.; Damian, C.; Gutt, G. Chemical Composition and Temperature Influence on the Rheological Behaviour of Honeys. Int. J. Food Prop. 2014, 17, 2228–2240. [Google Scholar] [CrossRef]
- Witczak, M.; Juszczak, L.; Gałkowska, D. Non-Newtonian behaviour of heather honey. J. Food Eng. 2011, 104, 532–537. [Google Scholar] [CrossRef]
- Tafere, D.A. Chemical composition and uses of Honey: A Review. J. Food Nutr. Res. 2021, 4, 194–201. [Google Scholar]
- Prica, N.; Živkov Baloš, M.; Jakšić, S.; Mihaljev, Ž.; Kartalović, B.; Babić, J.; Savić, S. Moisture and Acidity as Indicators of the Quality of Honey Originating from Vojvodina Region. Arch. Vet. Sci. 2015, 7, 99–109. [Google Scholar] [CrossRef]
- Kędzierska-Matysek, M.; Florek, M.; Wolanciuk, A.; Skałecki, P. Effect of freezing and room temperatures storage for 18 months on quality of raw rapeseed honey (Brassica napus). J. Food Sci. Technol. 2016, 53, 3349–3355. [Google Scholar] [CrossRef] [Green Version]
- Aljuhaimi, F.; Özcan, M.M.; Ghafoor, K.; Babiker, E.E. Determination of physicochemical properties of multifloral honeys stored in different containers. J. Food Process. Preserv. 2018, 42, e13379. [Google Scholar] [CrossRef]
- Cimo’, G.; Conte, P. Conformational Redistribution of Honey Components following Different Storage Conditions. Int. J. Spectrosc. 2015, 2015, 354327. [Google Scholar] [CrossRef] [Green Version]
- Mouhoubi-Tafinine, Z.; Ouchemoukh, S.; Bey, M.; Louaileche, H.; Tamendjari, A. Effect of storage on hydroxymethylfurfural (HMF) and color of some Algerian honey. Int. Food Res. J. 2018, 25, 1044–1050. [Google Scholar]
- Juliano, C.; Magrini, G.A. Methylglyoxal, the Major Antibacterial Factor in Manuka Honey: An Alternative to Preserve Natural Cosmetics? Cosmetics 2019, 6, 1. [Google Scholar] [CrossRef] [Green Version]
- Bucekova, M.; Valachova, I.; Kohutova, L.; Prochazka, E.; Klaudiny, J.; Majtan, J. Honeybee glucose oxidase—Its expression in honeybee workers and comparative analyses of its content and H2O2-mediated antibacterial activity in natural honeys. Naturwissenschaften 2014, 101, 661–670. [Google Scholar] [CrossRef] [PubMed]
- Chen, C.; Campbell, L.T.; Blair, S.E.; Carter, D.A. The effect of standard heat and filtration processing procedures on antimicrobial activity and hydrogen peroxide levels in honey. Front. Microbiol. 2012, 3, 265. [Google Scholar] [CrossRef] [PubMed] [Green Version]
- Bogdanov, S. Honey as Nutrient and Functional Food. Proteins 2016, 15, 1400–2700. [Google Scholar]
- Sowa, P.; Grabek-Lejko, D.; Wesołowska, M.; Swacha, S.; Dżugan, M. Hydrogen peroxide-dependent antibacterial action of Melilotus albus honey. Lett. Appl. Microbiol. 2017, 65, 82–89. [Google Scholar] [CrossRef] [PubMed]
- Guttentag, A.; Krishnakumar, K.; Cokcetin, N.; Harry, E.; Carter, D. Factors affecting the production and measurement of hydrogen peroxide in honey samples. Access Microbiol. 2021, 3, 000198. [Google Scholar] [CrossRef]
- Bianchin, J.N.; Nardini, G.; Merib, J.; Dias, A.N.; Martendal, E.; Carasek, E. Screening of volatile compounds in honey using a new sampling strategy combining multiple extraction temperatures in a single assay by HS-SPME-GC-MS. Food Chem. 2014, 145, 1061–1065. [Google Scholar] [CrossRef]
- Castro-Vázquez, L.; Elena Alañon, M.; Gonzalez-Viñas, M.A.; Soledad Pérez-Coello, M. Changes in the volatile fractions and sensory properties of heather honey during storage under different temperatures. Eur. Food Res. Technol. 2012, 235, 185–193. [Google Scholar] [CrossRef]
- Visquert, M.; Vargas, M.; Escriche, I. Effect of postharvest storage conditions on the colour and freshness parameters of raw honey. Int. J. Food Sci. Technol. 2014, 49, 181–187. [Google Scholar] [CrossRef]
- Codex Alimentarious, C. Standars for Honey. 2019, pp. 1–9. Available online: https://extension://bfdogplmndidlpjfhoijckpakkdjkkil/pdf/viewer.html?file=https%3A%2F%2Fwww.fao.org%2Ffao-who-codexalimentarius%2Fsh-proxy%2Fen%2F%3Flnk%3D1%26url%3Dhttps%25253A%25252F%25252Fworkspace.fao.org%25252Fsites%25252Fcodex%25252FStandards%25252FCXS%252B12-1981%25252Fcxs_012e.pdf (accessed on 10 November 2022).
- Lastriyanto, A.; Wibowo, S.A.; Erwan, E.J.F.; Batoro, J.; Masyithoh, D.; Lamerkabel, J. Moisture Reduction of Honey in Dehumidification and Evaporation Processes. J. Mech. Sci. Technol. 2020, 4, 153–163. [Google Scholar] [CrossRef]
- Escuredo, O.; Dobre, I.; Fernández-González, M.; Seijo, M.C. Contribution of botanical origin and sugar composition of honeys on the crystallization phenomenon. Food Chem. 2014, 149, 84–90. [Google Scholar] [CrossRef]
- Singh, S.; Gill, R.S.; Singh, P.P. Desiccant honey dehydrator. Int. J. Ambient. Energy 2011, 32, 62–69. [Google Scholar] [CrossRef]
- Gill, R.S.; Hans, V.S.; Singh, S.; Pal Singh, P.; Dhaliwal, S.S. A small scale honey dehydrator. J. Food Sci. Technol. 2015, 52, 6695–6702. [Google Scholar] [CrossRef] [PubMed] [Green Version]
- Yap, S.K.; Chin, N.L.; Yusof, Y.A.; Chong, K.Y. Quality characteristics of dehydrated raw Kelulut honey. Int. J. Food Prop. 2019, 22, 556–571. [Google Scholar] [CrossRef] [Green Version]
- Abid, A.; Yunus, M.A.M.; Sahlan, S.; Ramli, M.M.; Amin, M.R.A.; Lotpi, Z.F.M.; Anuar, N.H.K. An Optimized Honey Dehydration System with Drying Air Temperature and Relative Humidity Control. In Proceedings of the 2019 IEEE International Conference on Automatic Control and Intelligent Systems (I2CACIS), Selangor, Malaysia, 29 June 2019; pp. 305–310. [Google Scholar]
- Morawski, M.; Malec, M.; Niezgoda-Żelasko, B. Effective Condensing Dehumidification in a Rotary-Spray Honey Dehydrator. Energies 2022, 15, 100. [Google Scholar] [CrossRef]
- Ramli, A.S.; Basrawi, F.; Daing Idris, D.M.N.; bin Yusof, M.H.; Khalil Ibrahim, T.; Mustafa, Z.; Sulaiman, S.A. A new dewatering technique for stingless bees honey. MATEC Web Conf. 2017, 131, 03014. [Google Scholar] [CrossRef]
- Jiang, M.; Bai, X.; Sun, J.; Zhu, W. Implication of ultrasonic power and frequency for the ultrasonic vacuum drying of honey. Dry. Technol. 2021, 39, 1389–1400. [Google Scholar] [CrossRef]
- Aydoğan Coşkun, B.; Coklar, H.; Akbulut, M. Effect of heat treatment for liquefaction and pasteurization on antioxidant activity and phenolic compounds of Astragalus and sunflower-cornflower honeys. Food Sci. Technol. 2019, 40, 629–634. [Google Scholar] [CrossRef]
- Villacrés-Granda, I.; Proaño, A.; Coello, D.; Debut, A.; Vizuete, K.; Ballesteros, I.; Granda-Albuja, G.; Rosero-Mayanquer, H.; Battino, M.; Giampieri, F.; et al. Effect of thermal liquefaction on quality, chemical composition and antibiofilm activity against multiresistant human pathogens of crystallized eucalyptus honey. Food Chem. 2021, 365, 130519. [Google Scholar] [CrossRef]
- Kowalski, S. Changes of antioxidant activity and formation of 5-hydroxymethylfurfural in honey during thermal and microwave processing. Food Chem. 2013, 141, 1378–1382. [Google Scholar] [CrossRef]
- Kabbani, D.; Sepulcre, F.; Wedekind, J. Ultrasound-assisted liquefaction of rosemary honey: Influence on rheology and crystal content. J. Food Eng. 2011, 107, 173–178. [Google Scholar] [CrossRef]
- Akhmazillah, M.F.N.; Farid, M.M.; Silva, F.V.M. High pressure processing (HPP) of honey for the improvement of nutritional value. Innov. Food Sci. Emerg. Technol. 2013, 20, 59–63. [Google Scholar] [CrossRef]
- Quintero-Lira, A.; Ángeles Santos, A.; Aguirre-Álvarez, G.; Reyes-Munguía, A.; Almaraz-Buendía, I.; Campos-Montiel, R.G. Effects of liquefying crystallized honey by ultrasound on crystal size, 5-hydroxymethylfurfural, colour, phenolic compounds and antioxidant activity. Eur. Food Res. Technol. 2017, 243, 619–626. [Google Scholar] [CrossRef]
- Önür, İ.; Misra, N.N.; Barba, F.J.; Putnik, P.; Lorenzo, J.M.; Gökmen, V.; Alpas, H. Effects of ultrasound and high pressure on physicochemical properties and HMF formation in Turkish honey types. J. Food Eng. 2018, 219, 129–136. [Google Scholar] [CrossRef]
- Kuś, P.M.; Jerković, I. New Sample Preparation Method for Honey Volatiles Fingerprinting Based on Dehydration Homogeneous Liquid–Liquid Extraction (DHLLE). Molecules 2018, 23, 1769. [Google Scholar] [CrossRef] [Green Version]
- Janghu, S.; Bera, M.B.; Nanda, V.; Rawson, A. Study on Power Ultrasound Optimization and Its Comparison with Conventional Thermal Processing for Treatment of Raw Honey. Food Technol. Biotechnol. 2017, 55, 570–579. [Google Scholar] [CrossRef]
- Scripcă, L.A.; Amariei, S. The Use of Ultrasound for Preventing Honey Crystallization. Foods 2021, 10, 773. [Google Scholar] [CrossRef]
- Peláez-Acero, A.; Cobos-Velasco, J.E.; González-Lemus, U.; Espino-Manzano, S.O.; Aguirre-Álvarez, G.; González-Montiel, L.; Figueira, A.C.; Campos-Montiel, R.G. Bioactive compounds and antibacterial activities in crystallized honey liquefied with ultrasound. Ultrason. Sonochem. 2021, 76, 105619. [Google Scholar] [CrossRef]
- Dżugan, M.; Grabek-Lejko, D.; Sidor, E.; Tomczyk, M. The impact of ultrasound decrystallization on enzymatic, antioxidant and antibacterial properties of honey. Innov. Food Sci. Emerg. Technol. 2021, 71, 102709. [Google Scholar] [CrossRef]
- Chiozzi, V.; Agriopoulou, S.; Varzakas, T. Advances, Applications, and Comparison of Thermal (Pasteurization, Sterilization, and Aseptic Packaging) against Non-Thermal (Ultrasounds, UV Radiation, Ozonation, High Hydrostatic Pressure) Technologies in Food Processing. Appl. Sci. 2022, 12, 2202. [Google Scholar] [CrossRef]
- Al-Habsi, N.A.; Niranjan, K. Effect of high hydrostatic pressure on antimicrobial activity and quality of Manuka honey. Food Chem. 2012, 135, 1448–1454. [Google Scholar] [CrossRef]
- Singh, I.; Singh, S. Honey moisture reduction and its quality. J. Food Sci. Technol. 2018, 55, 3861–3871. [Google Scholar] [CrossRef] [PubMed]
- Stojković, M.; Cvetković, D.; Savić, A.; Topalić-Trivunović, L.; Velemir, A.; Papuga, S.; Žabić, M. Changes in the physicochemical, antioxidant and antibacterial properties of honeydew honey subjected to heat and ultrasound pretreatments. J. Food Sci. Technol. 2021, 58, 2555–2566. [Google Scholar] [CrossRef] [PubMed]
- Saxena, S.; Gautam, S.; Sharma, A. Microbial Decontamination of Honey of Indian Origin Using Gamma Radiation and Its Biochemical and Organoleptic Properties. J. Food Sci. 2010, 75, M19–M27. [Google Scholar] [CrossRef]
- Sircar, A.; Yadav, K. Application of Geothermal water for Honey Processing. In Proceedings of the PROCEEDINGS, 43rd Workshop on Geothermal Reservoir Engineering, Stanford, CA, USA, 12–14 February 2018. [Google Scholar]
- Yadav, K.; Sircar, A. Application of low enthalpy geothermal fluid for space heating and cooling, honey processing and milk pasteurization. Case Stud. Therm. Eng. 2019, 14, 100499. [Google Scholar] [CrossRef]
- Bystrzanowska, M.; Tobiszewski, M. Chemometrics for Selection, Prediction, and Classification of Sustainable Solutions for Green Chemistry—A Review. Symmetry 2020, 12, 2055. [Google Scholar] [CrossRef]
- Alkarkhi, A.; Alqaraghuli, W.A.A. Multivariate Analysis of Variance. In Applied Statistics for Environmental Science with R; Alkarkhi, A., Alqaraghuli, W.A.A., Eds.; Elsevier: Amsterdam, The Netherlands, 2020; pp. 87–112. [Google Scholar]
- Nielsen, F. Introduction to HPC with MPI for Data Science; Springer: Cham, Switzerland, 2016. [Google Scholar]
- Passarella, S.; Guerriero, E.; Quici, L.; Ianiri, G.; Cerasa, M.; Notardonato, I.; Protano, C.; Vitali, M.; Russo, M.V.; De Cristofaro, A.; et al. Dataset of PAHs determined in home-made honey samples collected in Central Italy by means of DLLME-GC-MS and cluster analysis for studying the source apportionment. Data Br. 2022, 42, 108136. [Google Scholar] [CrossRef]
- Passarella, S.; Guerriero, E.; Quici, L.; Ianiri, G.; Cerasa, M.; Notardonato, I.; Protano, C.; Vitali, M.; Russo, M.V.; De Cristofaro, A.; et al. PAHs presence and source apportionment in honey samples: Fingerprint identification of rural and urban contamination by means of chemometric approach. Food Chem. 2022, 382, 132361. [Google Scholar] [CrossRef]
- Bro, R.; Smilde, A.K. Principal component analysis. Anal. Methods 2014, 6, 2812–2831. [Google Scholar] [CrossRef] [Green Version]
- Kaygusuz, H.; Tezcan, F.; Bedia Erim, F.; Yildiz, O.; Sahin, H.; Can, Z.; Kolayli, S. Characterization of Anatolian honeys based on minerals, bioactive components and principal component analysis. LWT 2016, 68, 273–279. [Google Scholar] [CrossRef]
- Ilyasov, I.R.; Beloborodov, V.L.; Selivanova, I.A.; Terekhov, R.P. ABTS/PP Decolorization Assay of Antioxidant Capacity Reaction Pathways. Int. J. Mol. Sci. 2020, 21, 1131. [Google Scholar] [CrossRef] [Green Version]
- Özyürek, M.; Güçlü, K.; Apak, R. The main and modified CUPRAC methods of antioxidant measurement. TrAC Trends Anal. Chem. 2011, 30, 652–664. [Google Scholar] [CrossRef]
- Antônio, D.C.; de Assis, D.C.S.; Botelho, B.G.; Sena, M.M. Detection of adulterations in a valuable Brazilian honey by using spectrofluorimetry and multiway classification. Food Chem. 2022, 370, 131064. [Google Scholar] [CrossRef] [PubMed]
- Andersen, C.M.; Bro, R. Practical aspects of PARAFAC modeling of fluorescence excitation-emission data. J. Chemom. 2003, 17, 200–215. [Google Scholar] [CrossRef]
- Bro, R. PARAFAC. Tutorial and applications. Chemom. Intell. Lab. Syst. 1997, 38, 149–171. [Google Scholar] [CrossRef]
- Wu, H.-L.; Nie, J.-F.; Yu, Y.-J.; Yu, R.-Q. Multi-way chemometric methodologies and applications: A central summary of our research work. Anal. Chim. Acta 2009, 650, 131–142. [Google Scholar] [CrossRef] [PubMed]
- Zheng, Y.-F.; Wu, M.-C.; Chien, H.-J.; Wang, W.-C.; Kuo, C.-Y.; Lai, C.-C. Honey proteomic signatures for the identification of honey adulterated with syrup, producing country, and nectar source using SWATH-MS approach. Food Chem. 2021, 354, 129590. [Google Scholar] [CrossRef]
- Silva, B.; Gonzaga, L.V.; Maltez, H.F.; Samochvalov, K.B.; Fett, R.; Costa, A.C.O. Elemental profiling by ICP-MS as a tool for geographical discrimination: The case of bracatinga honeydew honey. J. Food Compos. Anal. 2021, 96, 103727. [Google Scholar] [CrossRef]
- Alkarkhi, A.F.M.; Alqaraghuli, W.A.A. Easy Statistics for Food Science with R; Academic Press: London, UK, 2018. [Google Scholar]
- Rinnan, Å.; Berg, F.V.D.; Engelsen, S.B. Review of the most common pre-processing techniques for near-infrared spectra. TrAC Trends Anal. Chem. 2009, 28, 1201–1222. [Google Scholar] [CrossRef]
- Moros, J.; Garrigues, S.; Guardia, M.D.L. Vibrational spectroscopy provides a green tool for multi-component analysis. TrAC Trends Anal. Chem. 2010, 29, 578–591. [Google Scholar] [CrossRef]
- Pauliuc, D.; Ciursă, P.; Ropciuc, S.; Dranca, F.; Oroian, M. Physicochemical parameters prediction and authentication of different monofloral honeys based on FTIR spectra. J. Food Compos. Anal. 2021, 102, 104021. [Google Scholar] [CrossRef]
- Kubus, M. Discriminant Stepwise Procedure. Folia Oeconomica 2014, 3, 302. [Google Scholar]
- Karabagias, I.K.; Karabagias, V.K.; Nayik, G.A.; Gatzias, I.; Badeka, A.V. A targeted chemometric evaluation of the volatile compounds of Quercus ilex honey in relation to its provenance. LWT 2022, 154, 112588. [Google Scholar] [CrossRef]
- Dijkstra, T.K. Latent Variables and Indices: Herman Wold’s Basic Design and Partial Least Squares. In Handbook of Partial Least Squares: Concepts, Methods and Applications; Esposito Vinzi, V., Chin, W.W., Henseler, J., Wang, H., Eds.; Springer: Berlin/Heidelberg, Germany, 2010; pp. 23–46. [Google Scholar]
- Wold, S.; Eriksson, L.; Kettaneh, N. PLS in Data Mining and Data Integration. In Handbook of Partial Least Squares: Concepts, Methods and Applications; Esposito Vinzi, V., Chin, W.W., Henseler, J., Wang, H., Eds.; Springer: Berlin/Heidelberg, Germany, 2010; pp. 327–357. [Google Scholar]
- Lee, L.C.; Liong, C.Y.; Jemain, A.A. Partial least squares-discriminant analysis (PLS-DA) for classification of high-dimensional (HD) data: A review of contemporary practice strategies and knowledge gaps. Analyst 2018, 143, 3526–3539. [Google Scholar] [CrossRef] [PubMed]
- Hategan, A.R.; Guyon, F.; Magdas, D.A. The improvement of honey recognition models built on 1H NMR fingerprint through a new proposed approach for feature selection. J. Food Compos. Anal. 2022, 114, 104786. [Google Scholar] [CrossRef]
- Olivieri, A.C.; Escandar, G.M.; Goicoechea, H.C.; de la Peña, A.M. Chapter 7—Unfolded and Multiway Partial Least-Squares with Residual Multilinearization: Fundamentals. In Data Handling in Science and Technology; de la Peña, A.M., Goicoechea, H.C., Escandar, G.M., Olivieri, A.C., Eds.; Elsevier: Amsterdam, The Netherlands, 2015; Volume 29, pp. 347–363. [Google Scholar]
- Bro, R. Multiway calibration. Multilinear PLS. J. Chemom. 1996, 10, 47–61. [Google Scholar] [CrossRef]
- Liland, K.H.; Indahl, U.G.; Skogholt, J.; Mishra, P. The canonical partial least squares approach to analysing multiway datasets—N-CPLS. J. Chemom. 2022, 36, e3432. [Google Scholar] [CrossRef]
- Tang, L.; Peng, S.; Bi, Y.; Shan, P.; Hu, X. A new method combining LDA and PLS for dimension reduction. PLoS ONE 2014, 9, e96944. [Google Scholar] [CrossRef] [Green Version]
- Bylesjö, M.; Rantalainen, M.; Cloarec, O.; Nicholson, J.K.; Holmes, E.; Trygg, J. OPLS discriminant analysis: Combining the strengths of PLS-DA and SIMCA classification. J. Chemom. 2006, 20, 341–351. [Google Scholar] [CrossRef]
- He, C.; Liu, Y.; Liu, H.; Zheng, X.; Shen, G.; Feng, J. Compositional identification and authentication of Chinese honeys by 1H NMR combined with multivariate analysis. Food Res. Int. 2020, 130, 108936. [Google Scholar] [CrossRef]
- Biancolillo, A.; Næs, T. Chapter 6—The Sequential and Orthogonalized PLS Regression for Multiblock Regression: Theory, Examples, and Extensions. In Data Handling in Science and Technology; Cocchi, M., Ed.; Elsevier: Amsterdam, The Netherlands, 2019; Volume 31, pp. 157–177. [Google Scholar]
- Næs, T.; Måge, I.; Segtnan, V.H. Incorporating interactions in multi-block sequential and orthogonalised partial least squares regression. J. Chemom. 2011, 25, 601–609. [Google Scholar] [CrossRef]
- Azcarate, S.M.; Elia Dazat, R.; Camiña, J.M.; Silva, M.F.; Gomez, F.J.V. NADES-modified voltammetric sensors and information fusion for detection of honey heat alteration. Food Control 2022, 140, 109144. [Google Scholar] [CrossRef]
- Cunningham, P.; Delany, S.J. K-Nearest Neighbour Classifiers-A Tutorial. ACM Comput. Surv. 2021, 54, 1–25. [Google Scholar] [CrossRef]
- Brereton, R.G. One Class Classifiers. In Chemometrics for Pattern Recognition; Sons, J.W., Ed.; John Wiley & Sons: Hoboken, NJ, USA, 2009; pp. 233–287. [Google Scholar]
- Suciu, R.C.; Guyon, F.; Magdas, D.A. Application of emission—Excitation matrices in parallel with factor analysis with other chemometric techniques for honey classification. J. Food Compos. Anal. 2022, 107, 104401. [Google Scholar] [CrossRef]
- Brendel, R.; Schwolow, S.; Gerhardt, N.; Schwab, J.; Rau, P.; Oest, M.; Rohn, S.; Weller, P. MIR spectroscopy versus MALDI-ToF-MS for authenticity control of honeys from different botanical origins based on soft independent modelling by class analogy (SIMCA)—A clash of techniques? Spectrochim. Acta A Mol. Biomol. Spectrosc. 2021, 263, 120225. [Google Scholar] [CrossRef] [PubMed]
- Awad, M.; Khanna, R. Support Vector Machines for Classification. In Efficient Learning Machines; Awad, M., Khanna, R., Eds.; Apress: Berkeley, CA, USA, 2015; pp. 39–66. [Google Scholar]
- Awad, M.; Khanna, R. Support Vector regression. In Efficient Learning Machines; Awad, M., Khanna, R., Eds.; Apress: Berkeley, CA, USA, 2015; pp. 67–80. [Google Scholar]
- Suykens, J.A.K.; Van, G.T.; De Brabanter, J.; De Moor, B.; Vandewalle, J. Least Squares Support Vector Machines; World Scientific Pub. Co.: Singapore, 2002. [Google Scholar]
- Li, Q.; Zeng, J.; Lin, L.; Zhang, J.; Zhu, J.; Yao, L.; Wang, S.; Yao, Z.; Wu, Z. Low risk of category misdiagnosis of rice syrup adulteration in three botanical origin honey by ATR-FTIR and general model. Food Chem. 2020, 332, 127356. [Google Scholar] [CrossRef] [PubMed]
- ElMasry, G.; Sun, D.-W. CHAPTER 1—Principles of Hyperspectral Imaging Technology. In Hyperspectral Imaging for Food Quality Analysis and Control; Sun, D.-W., Ed.; Academic Press: San Diego, CA, USA, 2010; pp. 3–43. [Google Scholar]
- Noviyanto, A.; Abdulla, W.H. Honey botanical origin classification using hyperspectral imaging and machine learning. J. Food Eng. 2020, 265, 109684. [Google Scholar] [CrossRef]
- Sharin, S.N.; Sani, M.S.A.; Jaafar, M.A.; Yuswan, M.H.; Kassim, N.K.; Manaf, Y.N.; Wasoh, H.; Zaki, N.N.M.; Hashim, A.M. Discrimination of Malaysian stingless bee honey from different entomological origins based on physicochemical properties and volatile compound profiles using chemometrics and machine learning. Food Chem. 2021, 346, 128654. [Google Scholar] [CrossRef]
- Chaharlangi, M.; Tashkhourian, J.; Bordbar, M.M.; Brendel, R.; Weller, P.; Hemmateenejad, B. A paper-based colorimetric sensor array for discrimination of monofloral European honeys based on gold nanoparticles and chemometrics data analysis. Spectrochim. Acta A Mol. Biomol. Spectrosc. 2021, 247, 119076. [Google Scholar] [CrossRef]
- Awad, M.; Khanna, R. Deep Neural Networks. In Efficient Learning Machines: Theories, Concepts, and Applications for Engineers and System Designers; Awad, M., Khanna, R., Eds.; Apress: Berkeley, CA, USA, 2015; pp. 127–147. [Google Scholar]
- Özbalci, B.; Boyaci, İ.H.; Topcu, A.; Kadılar, C.; Tamer, U. Rapid analysis of sugars in honey by processing Raman spectrum using chemometric methods and artificial neural networks. Food Chem. 2013, 136, 1444–1452. [Google Scholar] [CrossRef]
- Oroian, M.; Ropciuc, S.; Buculei, A. Romanian honey authentication based on physico-chemical parameters and chemometrics. J. Food Meas. Charact. 2017, 11, 719–725. [Google Scholar] [CrossRef]
- Wójcik, S.; Ciepiela, F.; Baś, B.; Jakubowska, M. Deep learning assisted distinguishing of honey seasonal changes using quadruple voltammetric electrodes. Talanta 2022, 241, 123213. [Google Scholar] [CrossRef] [PubMed]
- Wu, X.; Xu, B.; Ma, R.; Niu, Y.; Gao, S.; Liu, H.; Zhang, Y. Identification and quantification of adulterated honey by Raman spectroscopy combined with convolutional neural network and chemometrics. Spectrochim. Acta A Mol. Biomol. Spectrosc. 2022, 274, 121133. [Google Scholar] [CrossRef] [PubMed]
- Schubert, E.; Gertz, M. Intrinsic t-Stochastic Neighbor Embedding for Visualization and Outlier Detection. In Proceedings of the Similarity Search and Applications, Munich, Germany, 4–6 October 2017; pp. 188–203. [Google Scholar]
- Wu, X.; Xu, B.; Ma, R.; Gao, S.; Niu, Y.; Zhang, X.; Du, Z.; Liu, H.; Zhang, Y. Botanical origin identification and adulteration quantification of honey based on Raman spectroscopy combined with convolutional neural network. Vib. Spectrosc. 2022, 123, 103439. [Google Scholar] [CrossRef]
- Wu, M.-C.; Wu, C.-Y.; Klaithin, K.; Tiong, K.K.; Peng, C.-C. Effect of harvest time span on physicochemical properties, antioxidant, antimicrobial, and anti-inflammatory activities of Meliponinae honey. J. Sci. Food Agric. 2022, 102, 5750–5758. [Google Scholar] [CrossRef] [PubMed]
- An, N.; Cai, W.-J.; Zhu, Q.-F.; Wang, W.; Hussain, D.; Feng, Y.-Q. Metabolic profiling of organic acids in honey by stable isotope labeling assisted liquid chromatography-mass spectrometry. J. Food Compos. Anal. 2020, 87, 103423. [Google Scholar] [CrossRef]
- Kawashima, H.; Suto, M.; Suto, N. Stable carbon isotope ratios for organic acids in commercial honey samples. Food Chem. 2019, 289, 49–55. [Google Scholar] [CrossRef]
- Apriceno, A.; Girelli, A.M.; Scuto, F.R.; Tarola, A.M. Determination of furanic compounds and acidity for Italian honey quality. Flavour Fragr. J. 2018, 33, 411–419. [Google Scholar] [CrossRef]
- Karabagias, I.K.; Badeka, A.V.; Kontakos, S.; Karabournioti, S.; Kontominas, M.G. Botanical discrimination of Greek unifloral honeys with physico-chemical and chemometric analyses. Food Chem. 2014, 165, 181–190. [Google Scholar] [CrossRef]
- Zhang, G.-Z.; Tian, J.; Zhang, Y.-Z.; Li, S.-S.; Zheng, H.-Q.; Hu, F.-L. Investigation of the Maturity Evaluation Indicator of Honey in Natural Ripening Process: The Case of Rape Honey. Foods 2021, 10, 2882. [Google Scholar] [CrossRef]
- Costa dos Santos, A.; Carina Biluca, F.; Brugnerotto, P.; Valdemiro Gonzaga, L.; Carolina Oliveira Costa, A.; Fett, R. Brazilian stingless bee honey: Physicochemical properties and aliphatic organic acids content. Food Res. Int. 2022, 158, 111516. [Google Scholar] [CrossRef]
- Seraglio, S.K.T.; Bergamo, G.; Brugnerotto, P.; Gonzaga, L.V.; Fett, R.; Costa, A.C.O. Aliphatic organic acids as promising authenticity markers of bracatinga honeydew honey. Food Chem. 2021, 343, 128449. [Google Scholar] [CrossRef] [PubMed]
- Consonni, R.; Bernareggi, F.; Cagliani, L.R. NMR-based metabolomic approach to differentiate organic and conventional Italian honey. Food Control 2019, 98, 133–140. [Google Scholar] [CrossRef]
- Machado, A.M.; Tomás, A.; Russo-Almeida, P.; Duarte, A.; Antunes, M.; Vilas-Boas, M.; Graça Miguel, M.; Cristina Figueiredo, A. Quality assessment of Portuguese monofloral honeys. Physicochemical parameters as tools in botanical source differentiation. Food Res. Int. 2022, 157, 111362. [Google Scholar] [CrossRef] [PubMed]
- Belay, A.; Haki, G.D.; Birringer, M.; Borck, H.; Lee, Y.-C.; Cho, C.-W.; Kim, K.-T.; Bayissa, B.; Baye, K.; Melaku, S. Sugar profile and physicochemical properties of Ethiopian monofloral honey. Int. J. Food Prop. 2017, 20, 2855–2866. [Google Scholar] [CrossRef]
- Karabagias, I.K.; Louppis, A.P.; Kontakos, S.; Drouza, C.; Papastephanou, C. Characterization and Botanical Differentiation of Monofloral and Multifloral Honeys Produced in Cyprus, Greece, and Egypt Using Physicochemical Parameter Analysis and Mineral Content in Conjunction with Supervised Statistical Techniques. J. Anal. Methods Chem. 2018, 2018, 7698251. [Google Scholar] [CrossRef]
- Blidi, S.; Gotsiou, P.; Loupassaki, S.; Grigorakis, S.; Calokerinos, A.C. Effect of Thermal Treatment on the Quality of Honey Samples from Crete. Adv. Food Sci. Eng. 2017, 1, 1–8. [Google Scholar] [CrossRef]
- Majewska, E.; Drużyńska, B.; Wołosiak, R. Determination of the botanical origin of honeybee honeys based on the analysis of their selected physicochemical parameters coupled with chemometric assays. Food Sci. Biotechnol. 2019, 28, 1307–1314. [Google Scholar] [CrossRef] [Green Version]
- Seraglio, S.K.T.; Bergamo, G.; Molognoni, L.; Daguer, H.; Silva, B.; Gonzaga, L.V.; Fett, R.; Costa, A.C.O. Quality changes during long-term storage of a peculiar Brazilian honeydew honey: “Bracatinga”. J. Food Compos. Anal. 2021, 97, 103769. [Google Scholar] [CrossRef]
- Raweh, H.S.A.; Ahmed, A.Y.B.H.; Iqbal, J.; Alqarni, A.S. Monitoring and evaluation of free acidity levels in Talh honey originated from Talh tree Acacia gerrardii Benth. J. King Saud Univ. Sci. 2022, 34, 101678. [Google Scholar] [CrossRef]
- Raweh, H.S.A.; Badjah-Hadj-Ahmed, A.Y.; Iqbal, J.; Alqarni, A.S. Impact of Different Storage Regimes on the Levels of Physicochemical Characteristics, Especially Free Acidity in Talh (Acacia gerrardii Benth.) Honey. Molecules 2022, 27, 5959. [Google Scholar] [CrossRef]
- Castro-Vázquez, L.; Díaz-Maroto, M.C.; González-Viñas, M.A.; de la Fuente, E.; Pérez-Coello, M.S. Influence of Storage Conditions on Chemical Composition and Sensory Properties of Citrus Honey. J. Agric. Food Chem. 2008, 56, 1999–2006. [Google Scholar] [CrossRef] [PubMed]
- Mar Cavia, M.D.; Fernández-Muiño, M.A.; Francisco Huidobro, J.; Teresa Sancho, M. ‘Best before period once opened’ for honey samples from oceanic climates on the basis of their acidity types. Int. J. Food Sci. Technol. 2008, 43, 1929–1934. [Google Scholar] [CrossRef]
- Yang, W.; Zhang, C.; Li, C.; Huang, Z.Y.; Miao, X. Pathway of 5-hydroxymethyl-2-furaldehyde formation in honey. J. Food Sci. Technol. 2019, 56, 2417–2425. [Google Scholar] [CrossRef]
- Moreira, R.F.A.; De Maria, C.A.B.; Pietroluongo, M.; Trugo, L.C. Chemical changes in the non-volatile fraction of Brazilian honeys during storage under tropical conditions. Food Chem. 2007, 104, 1236–1241. [Google Scholar] [CrossRef]
- Ismail, N.F.; Maulidiani, M.; Omar, S.; Zulkifli, M.F.; Mohd Radzi, M.N.F.; Ismail, N.; Jusoh, A.Z.; Roowi, S.; Yew, W.M.; Rudiyanto, R.; et al. Classification of stingless bee honey based on species, dehumidification process and geographical origins using physicochemical and ATR-FTIR chemometric approach. J. Food Compos. Anal. 2021, 104, 104126. [Google Scholar] [CrossRef]
- Vázquez, L.; Verdú, A.; Miquel, A.; Burló, F.; Carbonell-Barrachina, A.A. Changes in physico-chemical properties, hydroxymethylfurfural and volatile compounds during concentration of honey and sugars in Alicante and Jijona turrón. Eur. Food Res. Technol. 2007, 225, 757–767. [Google Scholar] [CrossRef]
- Ames, J.M. Control of the Maillard reaction in food systems. Trends Food Sci. Technol. 1990, 1, 150–154. [Google Scholar] [CrossRef]
- Karabagias, I.K.; Badeka, A.; Kontakos, S.; Karabournioti, S.; Kontominas, M.G. Characterisation and classification of Greek pine honeys according to their geographical origin based on volatiles, physicochemical parameters and chemometrics. Food Chem. 2014, 146, 548–557. [Google Scholar] [CrossRef]
- Bentabol Manzanares, A.; García, Z.H.; Galdón, B.R.; Rodríguez, E.R.; Romero, C.D. Differentiation of blossom and honeydew honeys using multivariate analysis on the physicochemical parameters and sugar composition. Food Chem. 2011, 126, 664–672. [Google Scholar] [CrossRef]
- Escriche, I.; Kadar, M.; Juan-Borrás, M.; Domenech, E. Suitability of antioxidant capacity, flavonoids and phenolic acids for floral authentication of honey. Impact of industrial thermal treatment. Food Chem. 2014, 142, 135–143. [Google Scholar] [CrossRef]
- Płowaś-Korus, I.; Masewicz, Ł.; Szwengiel, A.; Rachocki, A.; Baranowska, H.M.; Medycki, W. A novel method of recognizing liquefied honey. Food Chem. 2018, 245, 885–889. [Google Scholar] [CrossRef] [PubMed]
- Karabagias, V.K.; Karabagias, I.K.; Gatzias, I. The impact of different heating temperatures on physicochemical, color attributes, and antioxidant activity parameters of Greek honeys. J. Food Process Eng. 2018, 41, e12668. [Google Scholar] [CrossRef]
- de la Fuente, E.; Ruiz-Matute, A.I.; Valencia-Barrera, R.M.; Sanz, J.; Martínez Castro, I. Carbohydrate composition of Spanish unifloral honeys. Food Chem. 2011, 129, 1483–1489. [Google Scholar] [CrossRef] [Green Version]
- Sahin, H.; Kolayli, S.; Beykaya, M. Investigation of Variations of Invertase and Glucose Oxidase Degrees against Heating and Timing Options in Raw Honeys. J. Chem. 2020, 2020, 5398062. [Google Scholar] [CrossRef] [Green Version]
- Beliz, H.-D.; Grosch, W.; Schieberle, P. Sugars, Sugar Alcohols and Honey. In Food Chemistry, 4th ed.; Springer: Berlin/Heidelberg, Germany, 2009; pp. 883–889. [Google Scholar]
- Razali, M.T.; Zainal, Z.A.; Maulidiani, M.; Shaari, K.; Zamri, Z.; Mohd Idrus, M.Z.; Khatib, A.; Abas, F.; Ling, Y.S.; Rui, L.L.; et al. Classification of Raw Stingless Bee Honeys by Bee Species Origins Using the NMR- and LC-MS-Based Metabolomics Approach. Molecules 2018, 23, 2160. [Google Scholar] [CrossRef] [Green Version]
- Yan, S.; Wang, W.; Zhao, W.; Tian, W.; Wang, X.; Wu, L.; Xue, X. Identification of the maturity of acacia honey by an endogenous oligosaccharide: A preliminary study. Food Chem. 2023, 399, 134005. [Google Scholar] [CrossRef]
- Karabagias, I.K.; Vlasiou, M.; Kontakos, S.; Drouza, C.; Kontominas, M.G.; Keramidas, A.D. Geographical discrimination of pine and fir honeys using multivariate analyses of major and minor honey components identified by 1H NMR and HPLC along with physicochemical data. Eur. Food Res. Technol. 2018, 244, 1249–1259. [Google Scholar] [CrossRef]
- Li, H.; Wu, M.; She, S.; Lin, G.; Zhou, J.; Chen, L. Study on stable carbon isotope fractionation of rape honey from rape flowers (Brassica napus L.) to its unifloral ripe honey. Food Chem. 2022, 386, 132754. [Google Scholar] [CrossRef]
- Cavia, M.M.; Fernández-Muiño, M.A.; Alonso-Torre, S.R.; Huidobro, J.F.; Sancho, M.T. Evolution of acidity of honeys from continental climates: Influence of induced granulation. Food Chem. 2007, 100, 1728–1733. [Google Scholar] [CrossRef]
- White, J.W., Jr.; Riethof, M.; Kushnir, I. Composition of Honey. VI. The Effect of Storage on Carbohydrates, Acidity and Diastase Content. J. Food Sci. 1961, 26, 63–71. [Google Scholar] [CrossRef]
- Echigo, T.; Takenaka, T. Changes in Erlose Contents by Honeybee Invertase. Agric. Biol. Chem. 1973, 47, 177–183. [Google Scholar] [CrossRef] [Green Version]
- Chong, K.Y.; Chin, N.L.; Yusof, Y.A. Thermosonication and optimization of stingless bee honey processing. Food Sci. Technol. Int. 2017, 23, 608–622. [Google Scholar] [CrossRef] [PubMed]
- Biluca, F.C.; Della Betta, F.; de Oliveira, G.P.; Pereira, L.M.; Gonzaga, L.V.; Costa, A.C.O.; Fett, R. 5-HMF and carbohydrates content in stingless bee honey by CE before and after thermal treatment. Food Chem. 2014, 159, 244–249. [Google Scholar] [CrossRef] [PubMed] [Green Version]
- Rust, A.; Marini, F.; Allsopp, M.; Williams, P.J.; Manley, M. Application of ANOVA-simultaneous component analysis to quantify and characterise effects of age, temperature, syrup adulteration and irradiation on near-infrared (NIR) spectral data of honey. Spectrochim. Acta A Mol. Biomol. Spectrosc. 2021, 253, 119546. [Google Scholar] [CrossRef]
- Kędzierska-Matysek, M.; Matwijczuk, A.; Florek, M.; Barłowska, J.; Wolanciuk, A.; Matwijczuk, A.; Chruściel, E.; Walkowiak, R.; Karcz, D.; Gładyszewska, B. Application of FTIR spectroscopy for analysis of the quality of honey. BIO Web Conf. 2018, 10, 02008. [Google Scholar] [CrossRef] [Green Version]
- Antonova, O.; Calvo, J.; Seifert, A. Rapid Detection of Thermal Treatment of Honey by Chemometrics-Assisted FTIR Spectroscopy. Foods 2021, 10, 2892. [Google Scholar] [CrossRef]
- Grainger, M.N.C.; Manley-Harris, M.; Lane, J.R.; Field, R.J. Kinetics of conversion of dihydroxyacetone to methylglyoxal in New Zealand mānuka honey: Part I—Honey systems. Food Chem. 2016, 202, 484–491. [Google Scholar] [CrossRef]
- Turhan, I.; Tetik, N.; Karhan, M.; Gurel, F.; Reyhan Tavukcuoglu, H. Quality of honeys influenced by thermal treatment. LWT-Food Sci. Technol. 2008, 41, 1396–1399. [Google Scholar] [CrossRef]
- Lee, Y.C.; Shlyankevich, M.; Jeong, H.K.; Douglas, J.S.; Surh, Y.J. Bioactivation of 5-Hydroxymethyl-2-Furaldehyde to an Electrophilic and Mutagenic Allylic Sulfuric Acid Ester. Biochem. Biophys. Res. Commun. 1995, 209, 996–1002. [Google Scholar] [CrossRef]
- Bruce, W.R.; Archer, M.C.; Corpet, D.E.; Medline, A.; Minkin, S.; Stamp, D.; Yin, Y.; Zhang, X.-M. Diet, aberrant crypt foci and colorectal cancer. Mutat. Res./Fundam. Mol. Mech. Mutagen. 1993, 290, 111–118. [Google Scholar] [CrossRef]
- Bakhiya, N.; Monien, B.; Frank, H.; Seidel, A.; Glatt, H. Renal organic anion transporters OAT1 and OAT3 mediate the cellular accumulation of 5-sulfooxymethylfurfural, a reactive, nephrotoxic metabolite of the Maillard product 5-hydroxymethylfurfural. Biochem. Pharmacol. 2009, 78, 414–419. [Google Scholar] [CrossRef] [PubMed] [Green Version]
- Lemus Ringele, G.B.; Beteinakis, S.; Papachristodoulou, A.; Axiotis, E.; Mikros, E.; Halabalaki, M. NMR Metabolite Profiling in the Quality and Authentication Assessment of Greek Honey—Exploitation of STOCSY for Markers Identification. Foods 2022, 11, 2853. [Google Scholar] [CrossRef] [PubMed]
- Khan, Z.S.; Nanda, V.; Bhat, S.; Khan, A. Kinetic Studies of HMF Formation and Diastase Activity in Two Different Honeys of Kashmir. Int. J. Curr. Microbiol. Appl. Sci. 2015, 4, 97–107. [Google Scholar]
- Román-Leshkov, Y.; Chheda, J.N.; Dumesic, J.A. Phase Modifiers Promote Efficient Production of Hydroxymethylfurfural from Fructose. Science 2006, 312, 1933–1937. [Google Scholar] [CrossRef] [PubMed] [Green Version]
- Semchyshyn, H.M. Fructation in vivo: Detrimental and protective effects of fructose. Biomed. Res. Int. 2013, 2013, 343914. [Google Scholar] [CrossRef] [Green Version]
- Bath, P.K.; Singh, N. A Research Note Chemical Changes in Helianthus Annuus and Eucalyptus Lanceolatus Honey during Storage. J. Food Qual. 2000, 23, 443–451. [Google Scholar] [CrossRef]
- Fallico, B.; Zappalà, M.; Arena, E.; Verzera, A. Effects of conditioning on HMF content in unifloral honeys. Food Chem. 2004, 85, 305–313. [Google Scholar] [CrossRef]
- Boonchiangma, S.; Chanthai, S.; Srijaranai, S. Chemical Compositions and Non-Enzymatic Browning Compounds of Thai Honey: A Kinetic Study. J. Food Process Eng. 2011, 34, 1584–1596. [Google Scholar] [CrossRef]
- Bulut, L.; Kilic, M. Kinetics of Hydroxymethylfurfural Accumulation and Color Change in Honey during Storage in Relation to Moisture Content. J. Food Process. Preserv. 2009, 33, 22–32. [Google Scholar] [CrossRef]
- Kasiotis, K.M.; Machera, K. Improved liquid chromatographic photo diode array mass spectrometric determination of 5-hydroxymethylfurfural and related furfurals in honey. Toxicol. Environ. Chem. 2017, 99, 578–589. [Google Scholar] [CrossRef]
- Kim, J.S.; Lee, Y.S. The effect of pH on the formation of furfural compounds in the glucose and fructose with amino acid enantiomers in maillard reaction. J. Food Sci. Nutr. 2008, 13, 54–59. [Google Scholar] [CrossRef] [Green Version]
- Yan, S.; Sun, M.; Zhao, L.; Wang, K.; Fang, X.; Wu, L.; Xue, X. Comparison of Differences of α-Dicarbonyl Compounds between Naturally Matured and Artificially Heated Acacia Honey: Their Application to Determine Honey Quality. J. Agric. Food Chem. 2019, 67, 12885–12894. [Google Scholar] [CrossRef] [PubMed]
- Arena, E.; Ballistreri, G.; Tomaselli, F.; Fallico, B. Survey of 1,2-Dicarbonyl Compounds in Commercial Honey of Different Floral Origin. J. Food Sci. 2011, 76, C1203–C1210. [Google Scholar] [CrossRef] [PubMed]
- Pita-Calvo, C.; Guerra-Rodríguez, M.E.; Vázquez, M. Analytical Methods Used in the Quality Control of Honey. J. Agric. Food Chem. 2017, 65, 690–703. [Google Scholar] [CrossRef] [PubMed]
- Pasias, I.N.; Raptopoulou, K.G.; Makrigennis, G.; Ntakoulas, D.D.; Lembessis, D.; Dimakis, V.; Katsinas, R.; Proestos, C. Finding the optimum treatment procedure to delay honey crystallization without reducing its quality. Food Chem. 2022, 381, 132301. [Google Scholar] [CrossRef]
- Lazaridou, A.; Biliaderis, C.G.; Bacandritsos, N.; Sabatini, A.G. Composition, thermal and rheological behaviour of selected Greek honeys. J. Food Eng. 2004, 64, 9–21. [Google Scholar] [CrossRef]
- Oroian, M.; Amariei, S.; Escriche, I.; Gutt, G. A Viscoelastic Model for Honeys Using the Time–Temperature Superposition Principle (TTSP). Food Bioprocess Technol. 2013, 6, 2251–2260. [Google Scholar] [CrossRef]
- Schiassi, M.C.E.V.; Souza, V.R.D.; Alves, N.A.; Lago, A.M.T.; Silva, S.H.; Carvalho, G.R.; de Resende, J.V.; Queiroz, F. Effect of botanical origin on stability and crystallization of honey during storage. Br. Food J. 2022, 124, 2689–2704. [Google Scholar] [CrossRef]
- Ma, Y.; Zhang, B.; Li, H.; Li, Y.; Hu, J.; Li, J.; Wang, H.; Deng, Z. Chemical and molecular dynamics analysis of crystallization properties of honey. Int. J. Food Prop. 2017, 20, 725–733. [Google Scholar] [CrossRef]
- Dobre, I.; Georgescu, L.A.; Alexe, P.; Escuredo, O.; Seijo, M.C. Rheological behavior of different honey types from Romania. Food Res. Int. 2012, 49, 126–132. [Google Scholar] [CrossRef]
- Dettori, A.; Tappi, S.; Piana, L.; Dalla Rosa, M.; Rocculi, P. Kinetic of induced honey crystallization and related evolution of structural and physical properties. LWT 2018, 95, 333–338. [Google Scholar] [CrossRef]
- Segato, S.; Merlanti, R.; Bisutti, V.; Montanucci, L.; Serva, L.; Lucatello, L.; Mirisola, M.; Contiero, B.; Conficoni, D.; Balzan, S.; et al. Multivariate and machine learning models to assess the heat effects on honey physicochemical, colour and NIR data. Eur. Food Res. Technol. 2019, 245, 2269–2278. [Google Scholar] [CrossRef]
- Chen, G.; Sun, X.; Huang, Y.; Chen, K. Tracking the dehydration process of raw honey by synchronous two-dimensional near infrared correlation spectroscopy. J. Mol. Struct. 2014, 1076, 42–48. [Google Scholar] [CrossRef]
- Xagoraris, M.; Lazarou, E.; Kaparakou, E.H.; Alissandrakis, E.; Tarantilis, P.A.; Pappas, C.S. Botanical origin discrimination of Greek honeys: Physicochemical parameters versus Raman spectroscopy. J. Sci. Food Agric. 2021, 101, 3319–3327. [Google Scholar] [CrossRef]
- Escuredo, O.; Míguez, M.; Fernández-González, M.; Carmen Seijo, M. Nutritional value and antioxidant activity of honeys produced in a European Atlantic area. Food Chem. 2013, 138, 851–856. [Google Scholar] [CrossRef] [PubMed]
- Kosar, F.; Akram, N.A.; Sadiq, M.; Al-Qurainy, F.; Ashraf, M. Trehalose: A Key Organic Osmolyte Effectively Involved in Plant Abiotic Stress Tolerance. J. Plant Growth Regul. 2019, 38, 606–618. [Google Scholar] [CrossRef]
- Amariei, S.; Norocel, L.; Scripcă, L.A. An innovative method for preventing honey crystallization. Innov. Food Sci. Emerg. Technol. 2020, 66, 102481. [Google Scholar] [CrossRef]
- Kivrak, İ. Free Amino Acid Profiles of 17 Turkish Unifloral Honeys. J. Liq. Chromatogr. Relat. Technol. 2015, 38, 855–862. [Google Scholar] [CrossRef]
- Silici, S.; Karaman, K. Chemometric Approaches for the Characterization of Turkish Rhododendron and Honeydew Honeys Depending on Amino Acid Composition. J. Liq. Chromatogr. Relat. Technol. 2014, 37, 864–877. [Google Scholar] [CrossRef]
- Iglesias, M.T.; de Lorenzo, C.; Polo, M.D.C.; Martín-Álvarez, P.J.; Pueyo, E. Usefulness of Amino Acid Composition To Discriminate between Honeydew and Floral Honeys. Application to Honeys from a Small Geographic Area. J. Agric. Food Chem. 2004, 52, 84–89. [Google Scholar] [CrossRef]
- Dimins, F.; Cinkmanis, I.; Radenkovs, V.; Augspole, I.; Valdovska, A. Analysis of 18 Free Amino Acids in Honeybee and Bumblebee Honey from Eastern and Northern Europe and Central Asia Using HPLC-ESI-TQ-MS/MS Approach Bypassing Derivatization Step. Foods 2022, 11, 2744. [Google Scholar] [CrossRef] [PubMed]
- Zhao, H.; Cheng, N.; Zhang, Y.; Sun, Z.; Zhou, W.; Wang, Y.; Cao, W. The effects of different thermal treatments on amino acid contents and chemometric-based identification of overheated honey. LWT 2018, 96, 133–139. [Google Scholar] [CrossRef]
- Iglesias, M.T.; Martín-Álvarez, P.J.; Polo, M.C.; de Lorenzo, C.; González, M.; Pueyo, E. Changes in the Free Amino Acid Contents of Honeys During Storage at Ambient Temperature. J. Agric. Food Chem. 2006, 54, 9099–9104. [Google Scholar] [CrossRef] [PubMed]
- Pérez, R.A.; Iglesias, M.T.; Pueyo, E.; González, M.; de Lorenzo, C. Amino Acid Composition and Antioxidant Capacity of Spanish Honeys. J. Agric. Food Chem. 2007, 55, 360–365. [Google Scholar] [CrossRef] [PubMed]
- Sanz, M.L.; del Castillo, M.D.; Corzo, N.; Olano, A. 2-Furoylmethyl Amino Acids and Hydroxymethylfurfural As Indicators of Honey Quality. J. Agric. Food Chem. 2003, 51, 4278–4283. [Google Scholar] [CrossRef] [PubMed]
- Nie, S.; Huang, J.; Hu, J.; Zhang, Y.; Wang, S.; Li, C.; Marcone, M.; Xie, M. Effect of pH, temperature and heating time on the formation of furan in sugar–glycine model systems. Food Sci. Hum. Wellness 2013, 2, 87–92. [Google Scholar] [CrossRef] [Green Version]
- Yan, S.; Wang, X.; Wu, Y.; Wang, K.; Shan, J.; Xue, X. A metabolomics approach revealed an Amadori compound distinguishes artificially heated and naturally matured acacia honey. Food Chem. 2022, 385, 132631. [Google Scholar] [CrossRef]
- Quintas, P.Y.; Keunchkarian, S.; Romero, L.; Canizo, B.V.; Wuilloud, R.G.; Castells, C.B. Determination of amino acid content and its enantiomeric composition in honey samples from Mendoza, Argentina. J. Food Process. Preserv. 2021, 45, e15966. [Google Scholar] [CrossRef]
- Huang, Z.; Liu, L.; Li, G.; Li, H.; Ye, D.; Li, X. Nondestructive Determination of Diastase Activity of Honey Based on Visible and Near-Infrared Spectroscopy. Molecules 2019, 24, 1244. [Google Scholar] [CrossRef]
- Serrano, S.; Espejo, R.; Villarejo, M.; Jodral, M.L. Diastase and invertase activities in Andalusian honeys. Int. J. Food Sci. Technol. 2007, 42, 76–79. [Google Scholar] [CrossRef]
- Juan-Borrás, M.; Domenech, E.; Hellebrandova, M.; Escriche, I. Effect of country origin on physicochemical, sugar and volatile composition of acacia, sunflower and tilia honeys. Food Res. Int. 2014, 60, 86–94. [Google Scholar] [CrossRef]
- Vit, P.; Pulcini, P. Diastase and invertase activities in Meliponini and Trigonini honeys from Venezuela. J. Apic. Res. 1996, 35, 57–62. [Google Scholar] [CrossRef]
- Czipa, N.; Phillips, C.J.C.; Kovács, B. Composition of acacia honeys following processing, storage and adulteration. J. Food Sci. Technol. 2019, 56, 1245–1255. [Google Scholar] [CrossRef] [Green Version]
- Tosi, E.; Martinet, R.; Ortega, M.; Lucero, H.; Ré, E. Honey diastase activity modified by heating. Food Chem. 2008, 106, 883–887. [Google Scholar] [CrossRef]
- Sahinler, N. Effects of heating and storage on hydroxy methylfurfural and diastase activity of different Turkish honeys. J. Apic. Res. 2007, 46, 34–39. [Google Scholar] [CrossRef]
- Serin, S.; Turhan, K.N.; Turhan, M. Correlation between water activity and moisture content of Turkish flower and pine honeys. Food Sci. Technol. 2018, 38, 238–243. [Google Scholar] [CrossRef] [Green Version]
- Svečnjak, L.; Jović, O.; Prđun, S.; Rogina, J.; Marijanović, Z.; Car, J.; Matošević, M.; Jerković, I. Influence of beeswax adulteration with paraffin on the composition and quality of honey determined by physico-chemical analyses, 1H NMR, FTIR-ATR and HS-SPME/GC–MS. Food Chem. 2019, 291, 187–198. [Google Scholar] [CrossRef] [PubMed]
- Aleixandre-Tudo, J.L.; Castello-Cogollos, L.; Aleixandre, J.L.; Aleixandre-Benavent, R. Chemometrics in food science and technology: A bibliometric study. Chemom. Intell. Lab. Syst. 2022, 222, 104514. [Google Scholar] [CrossRef]


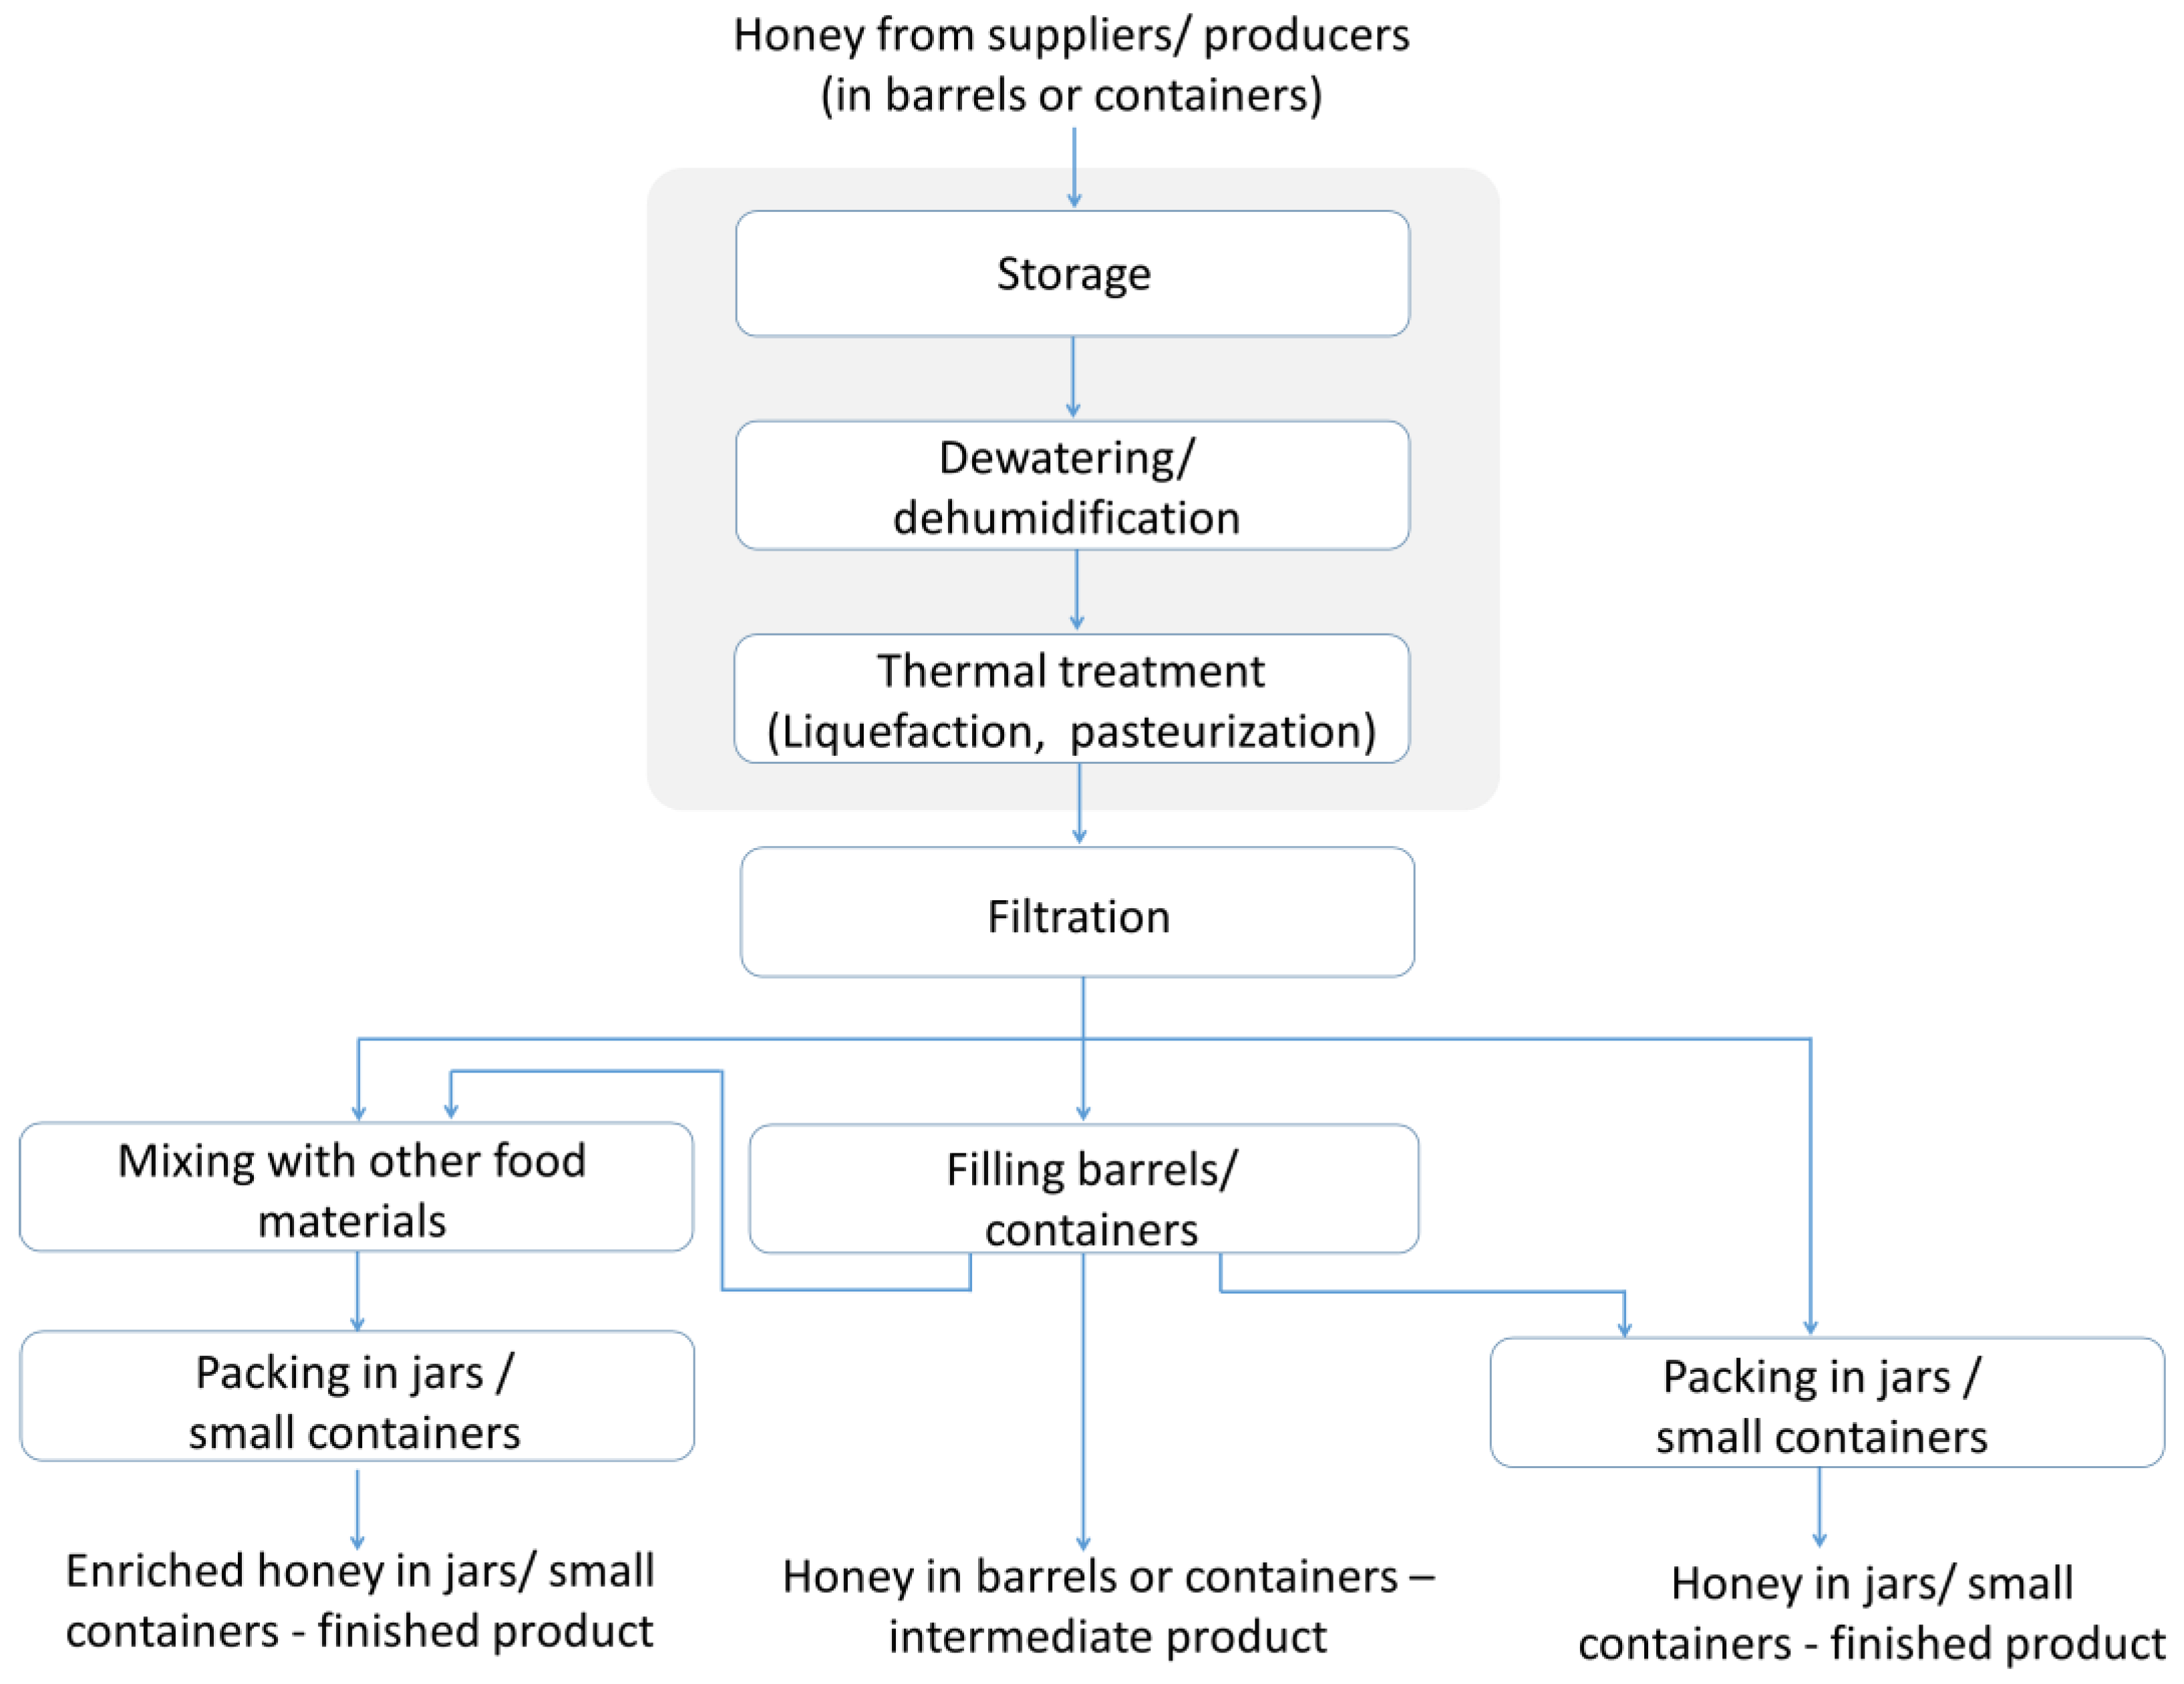
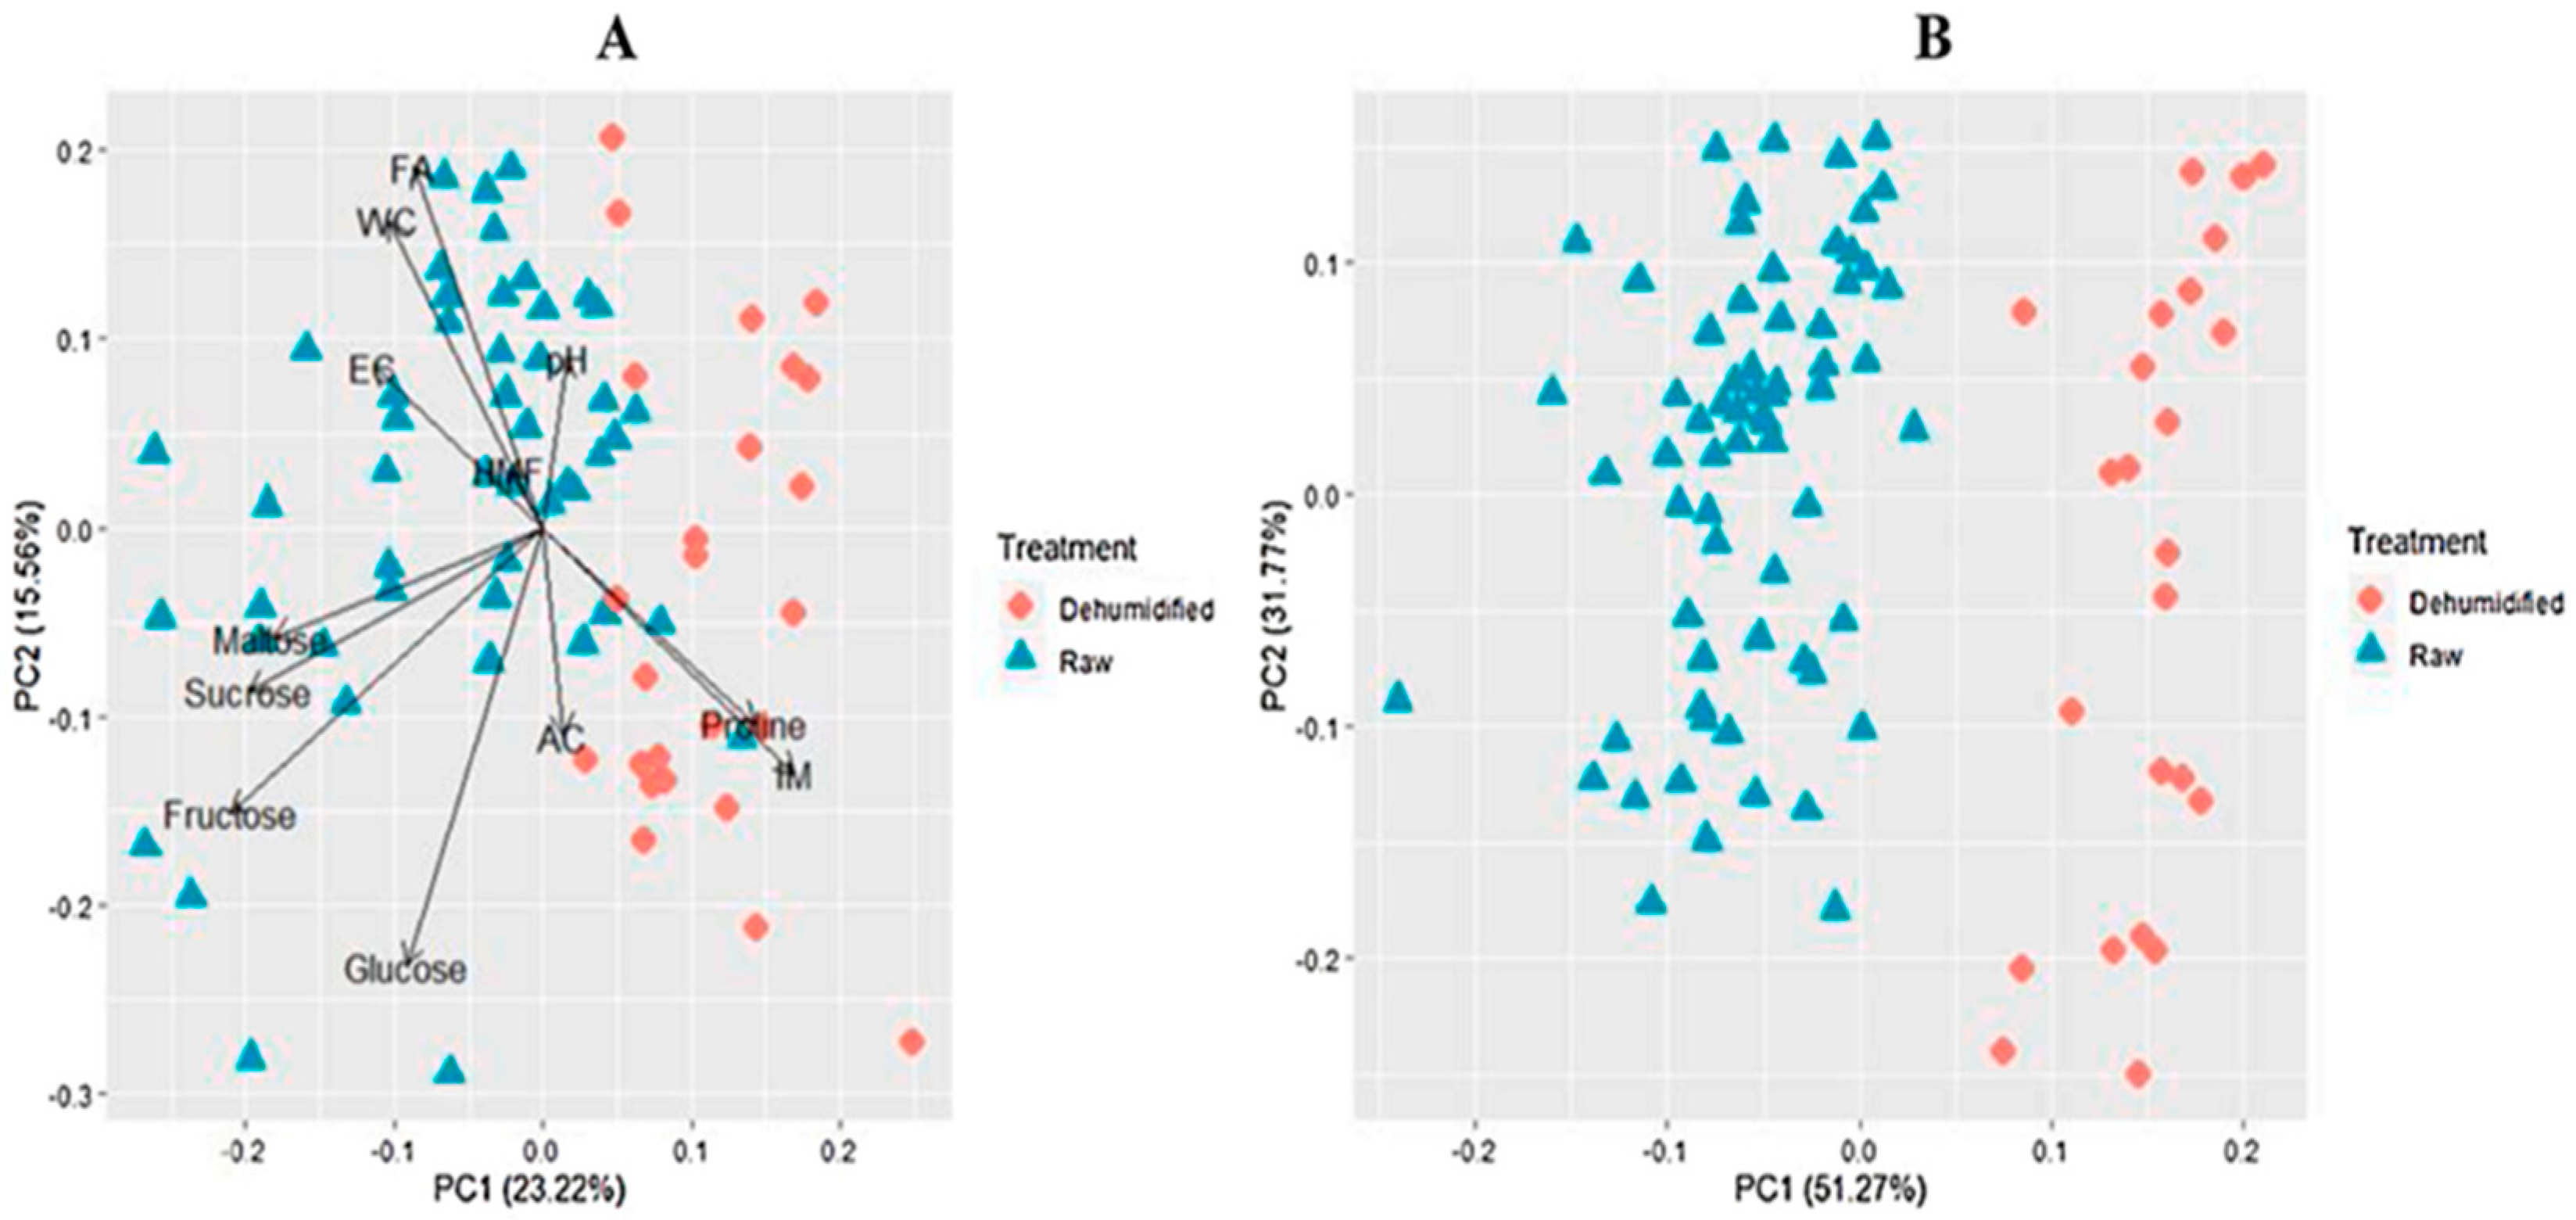
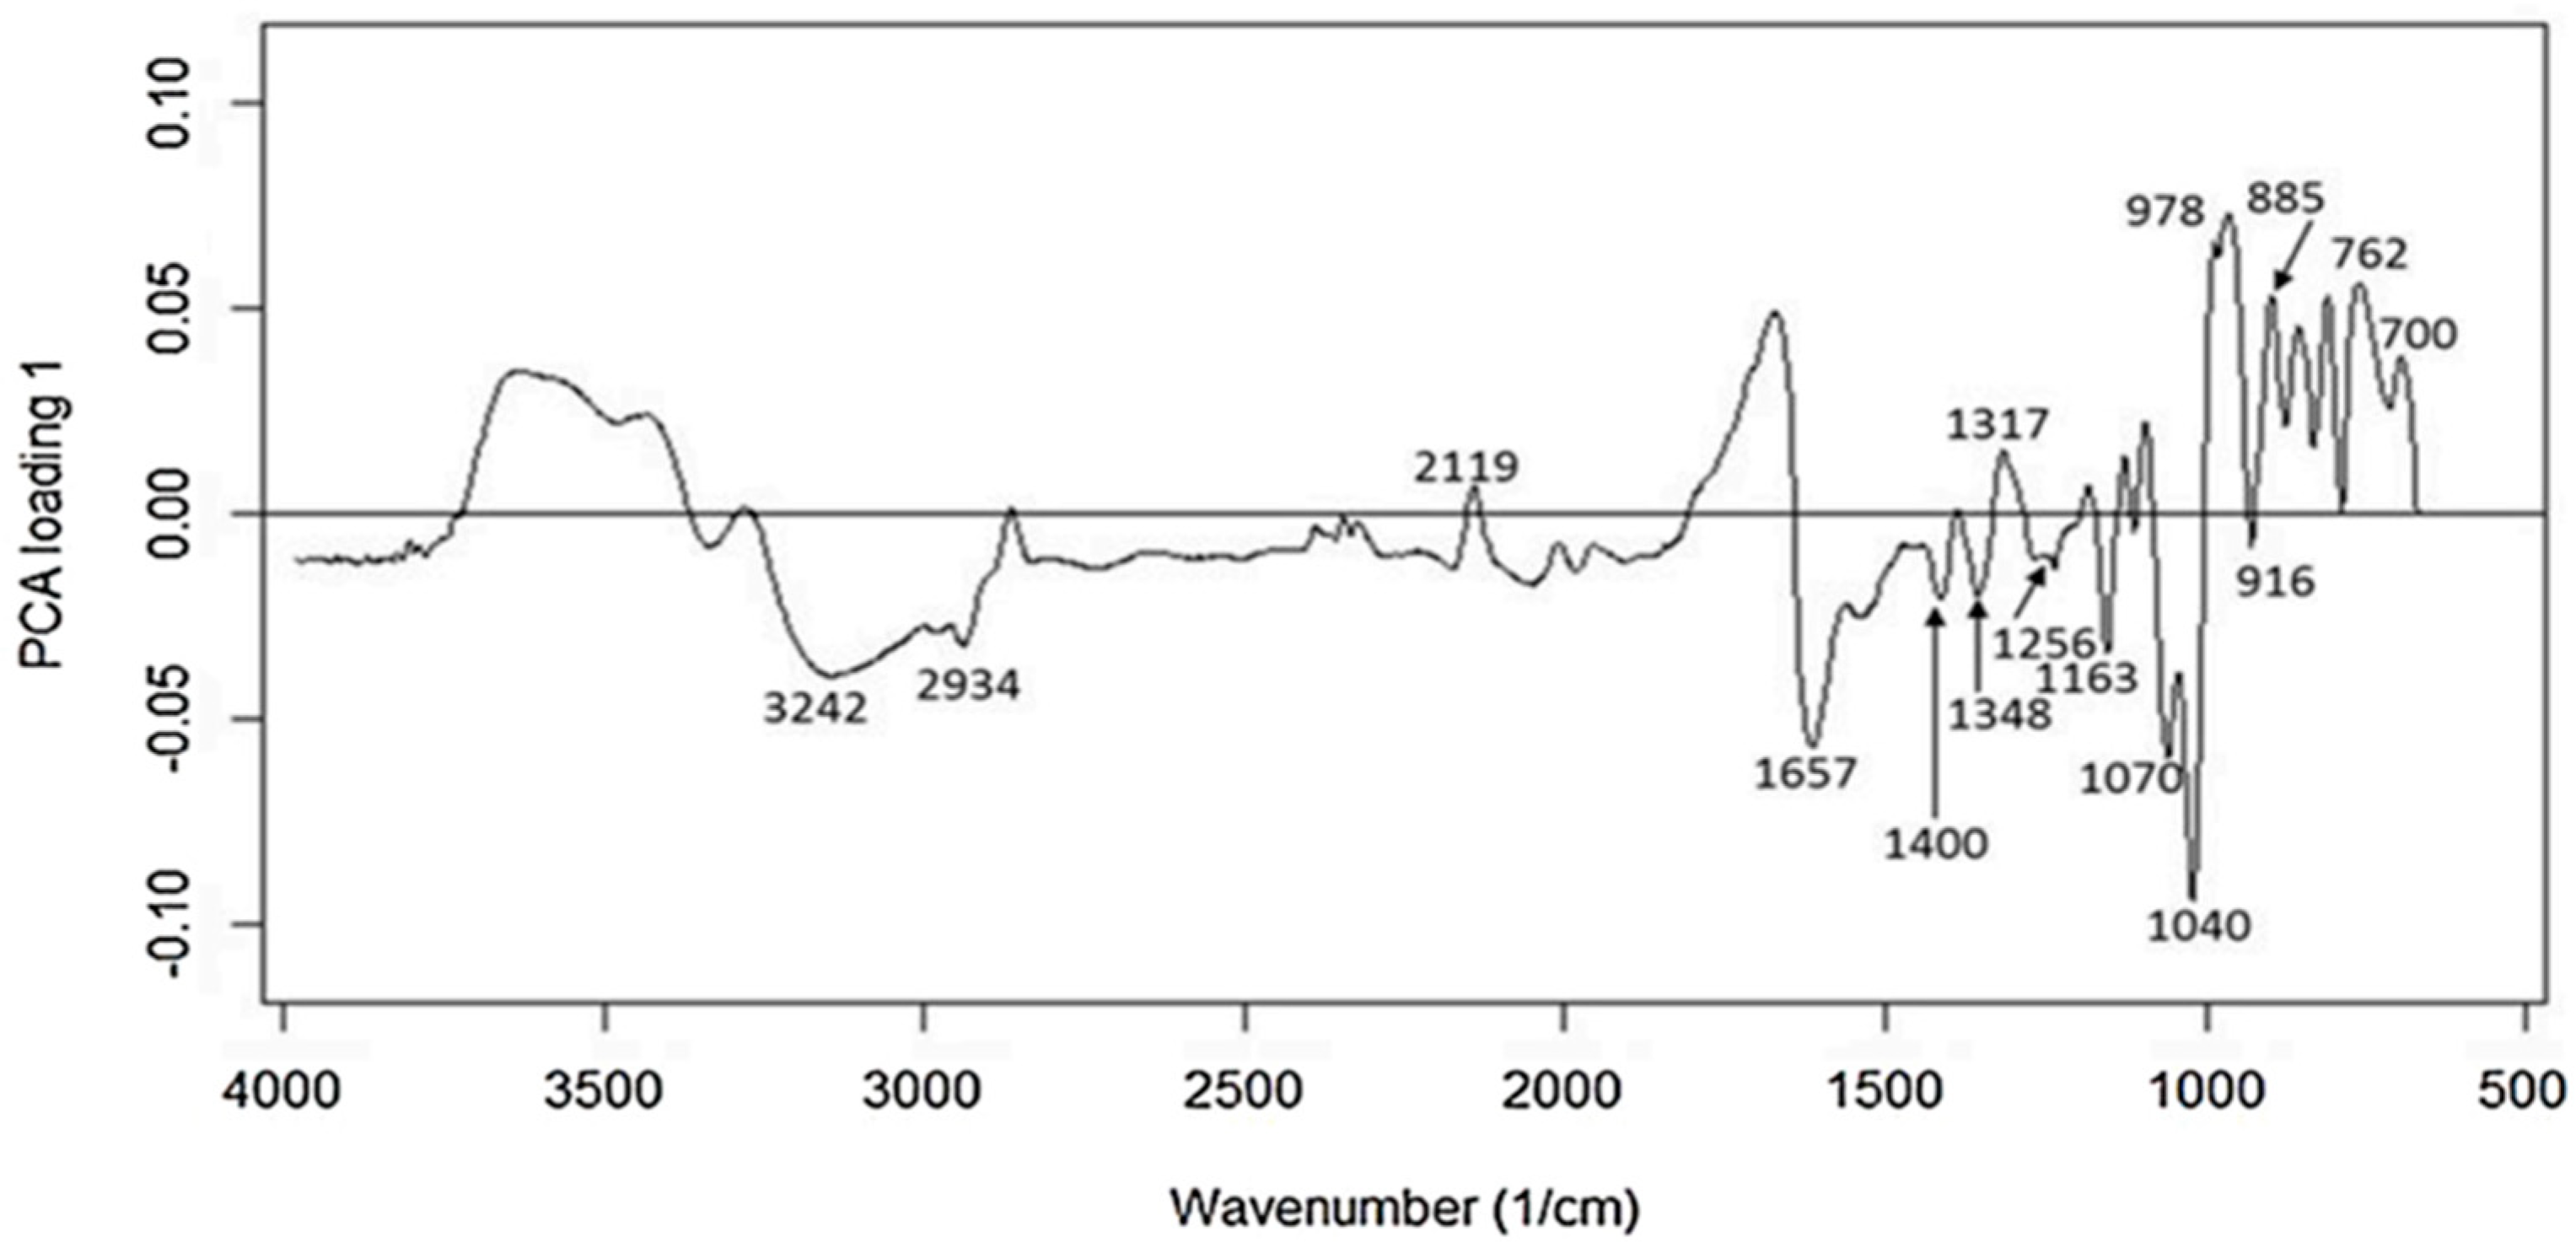
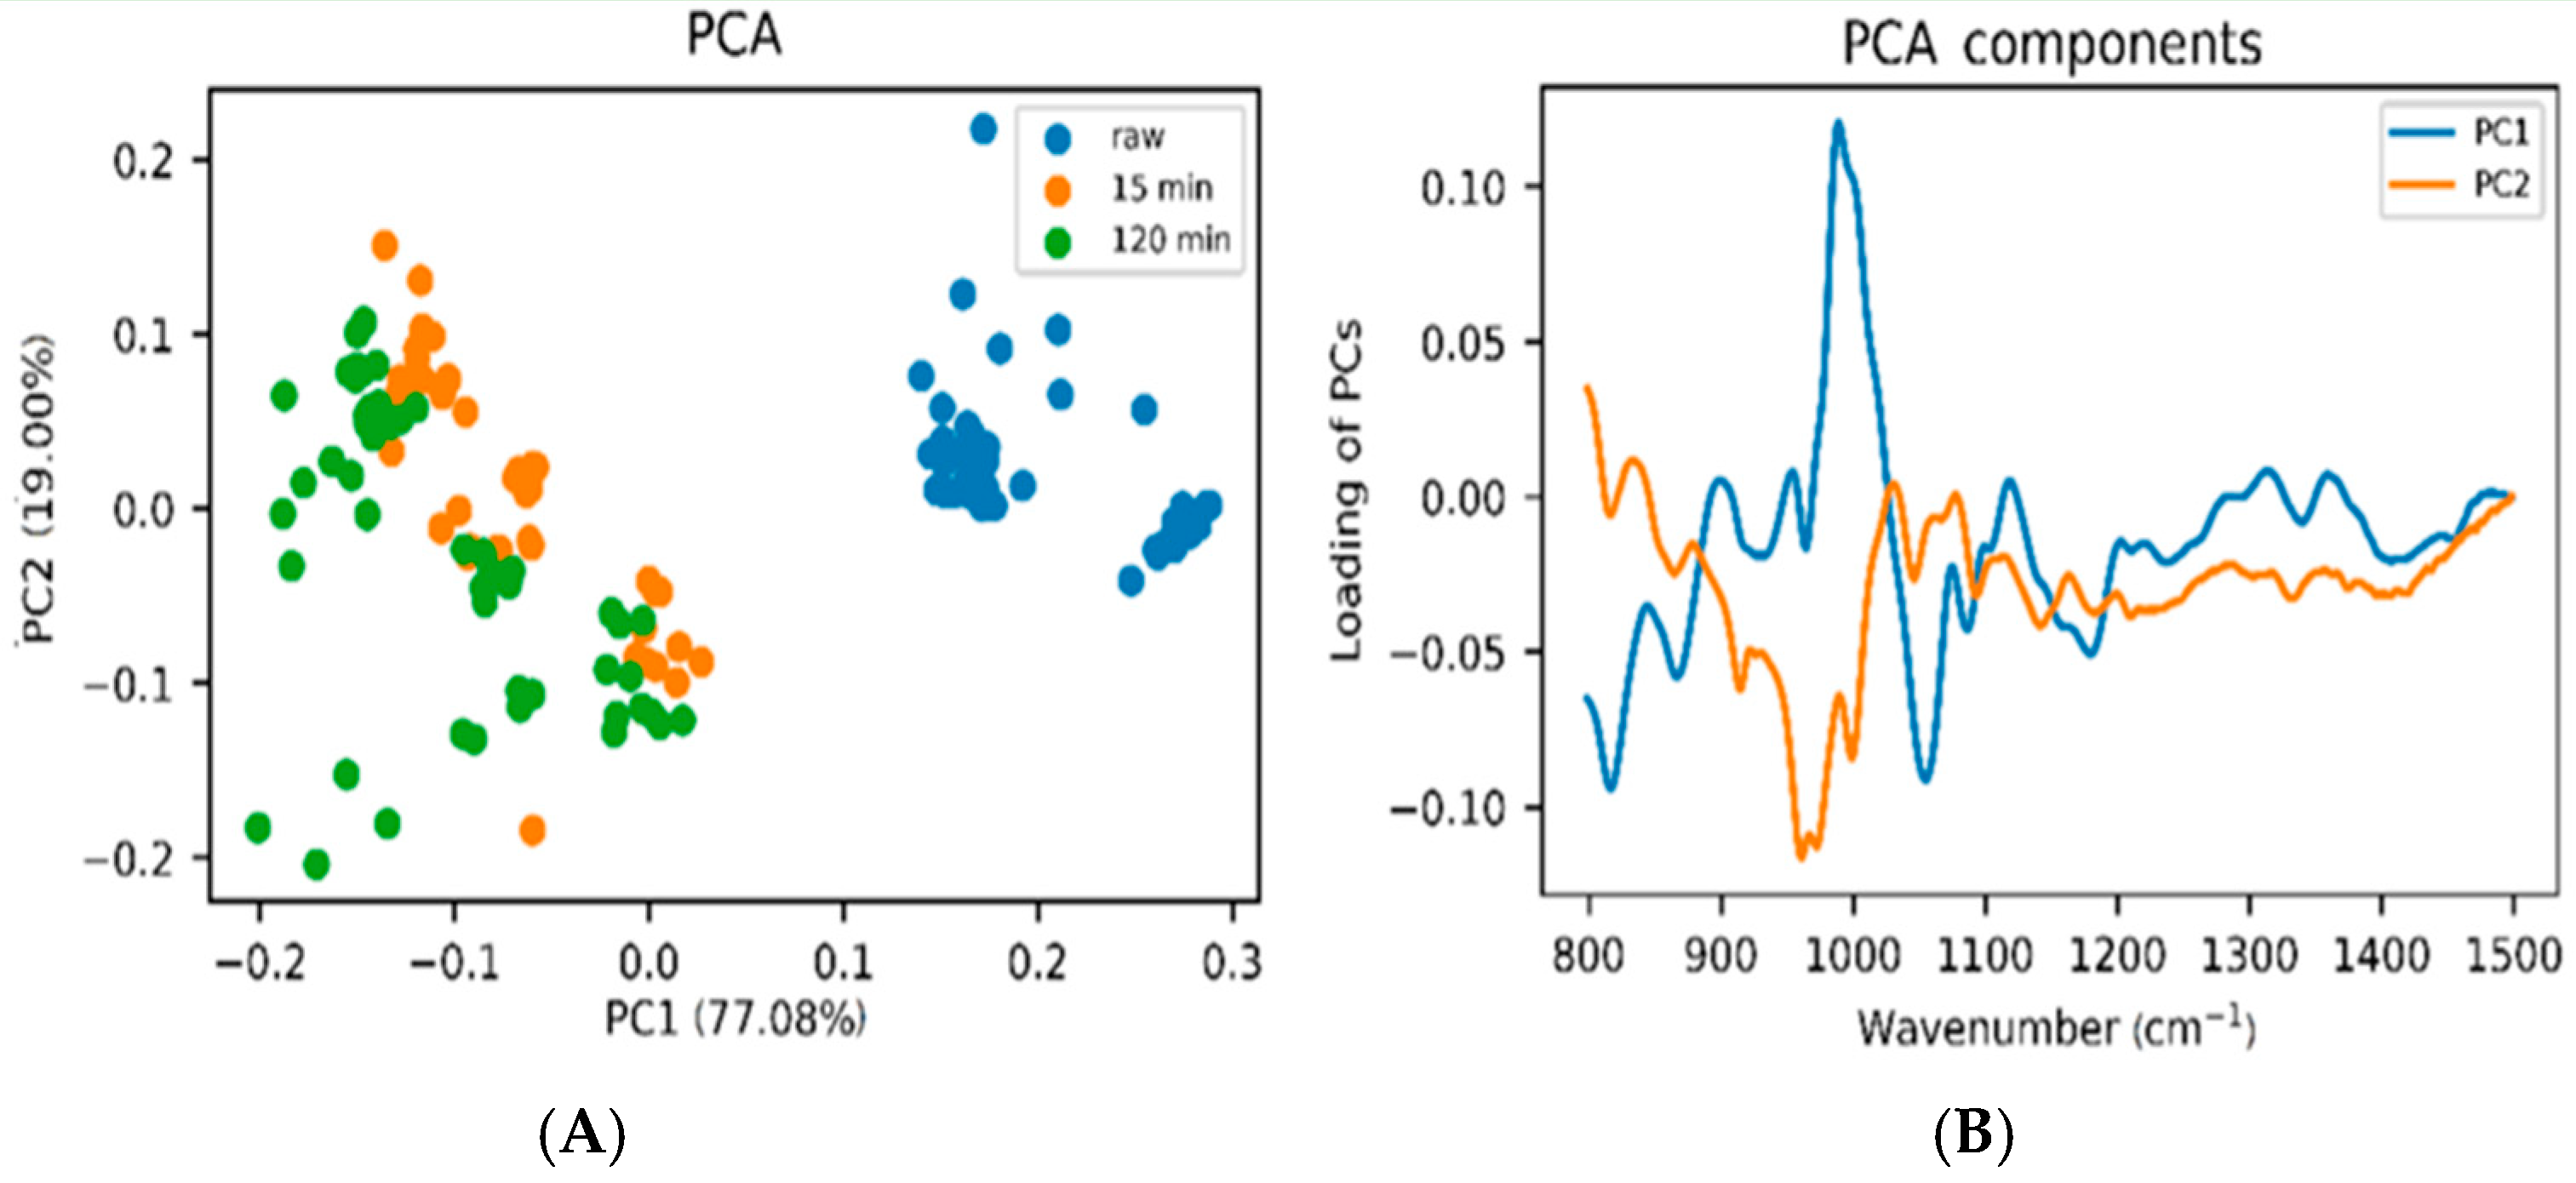
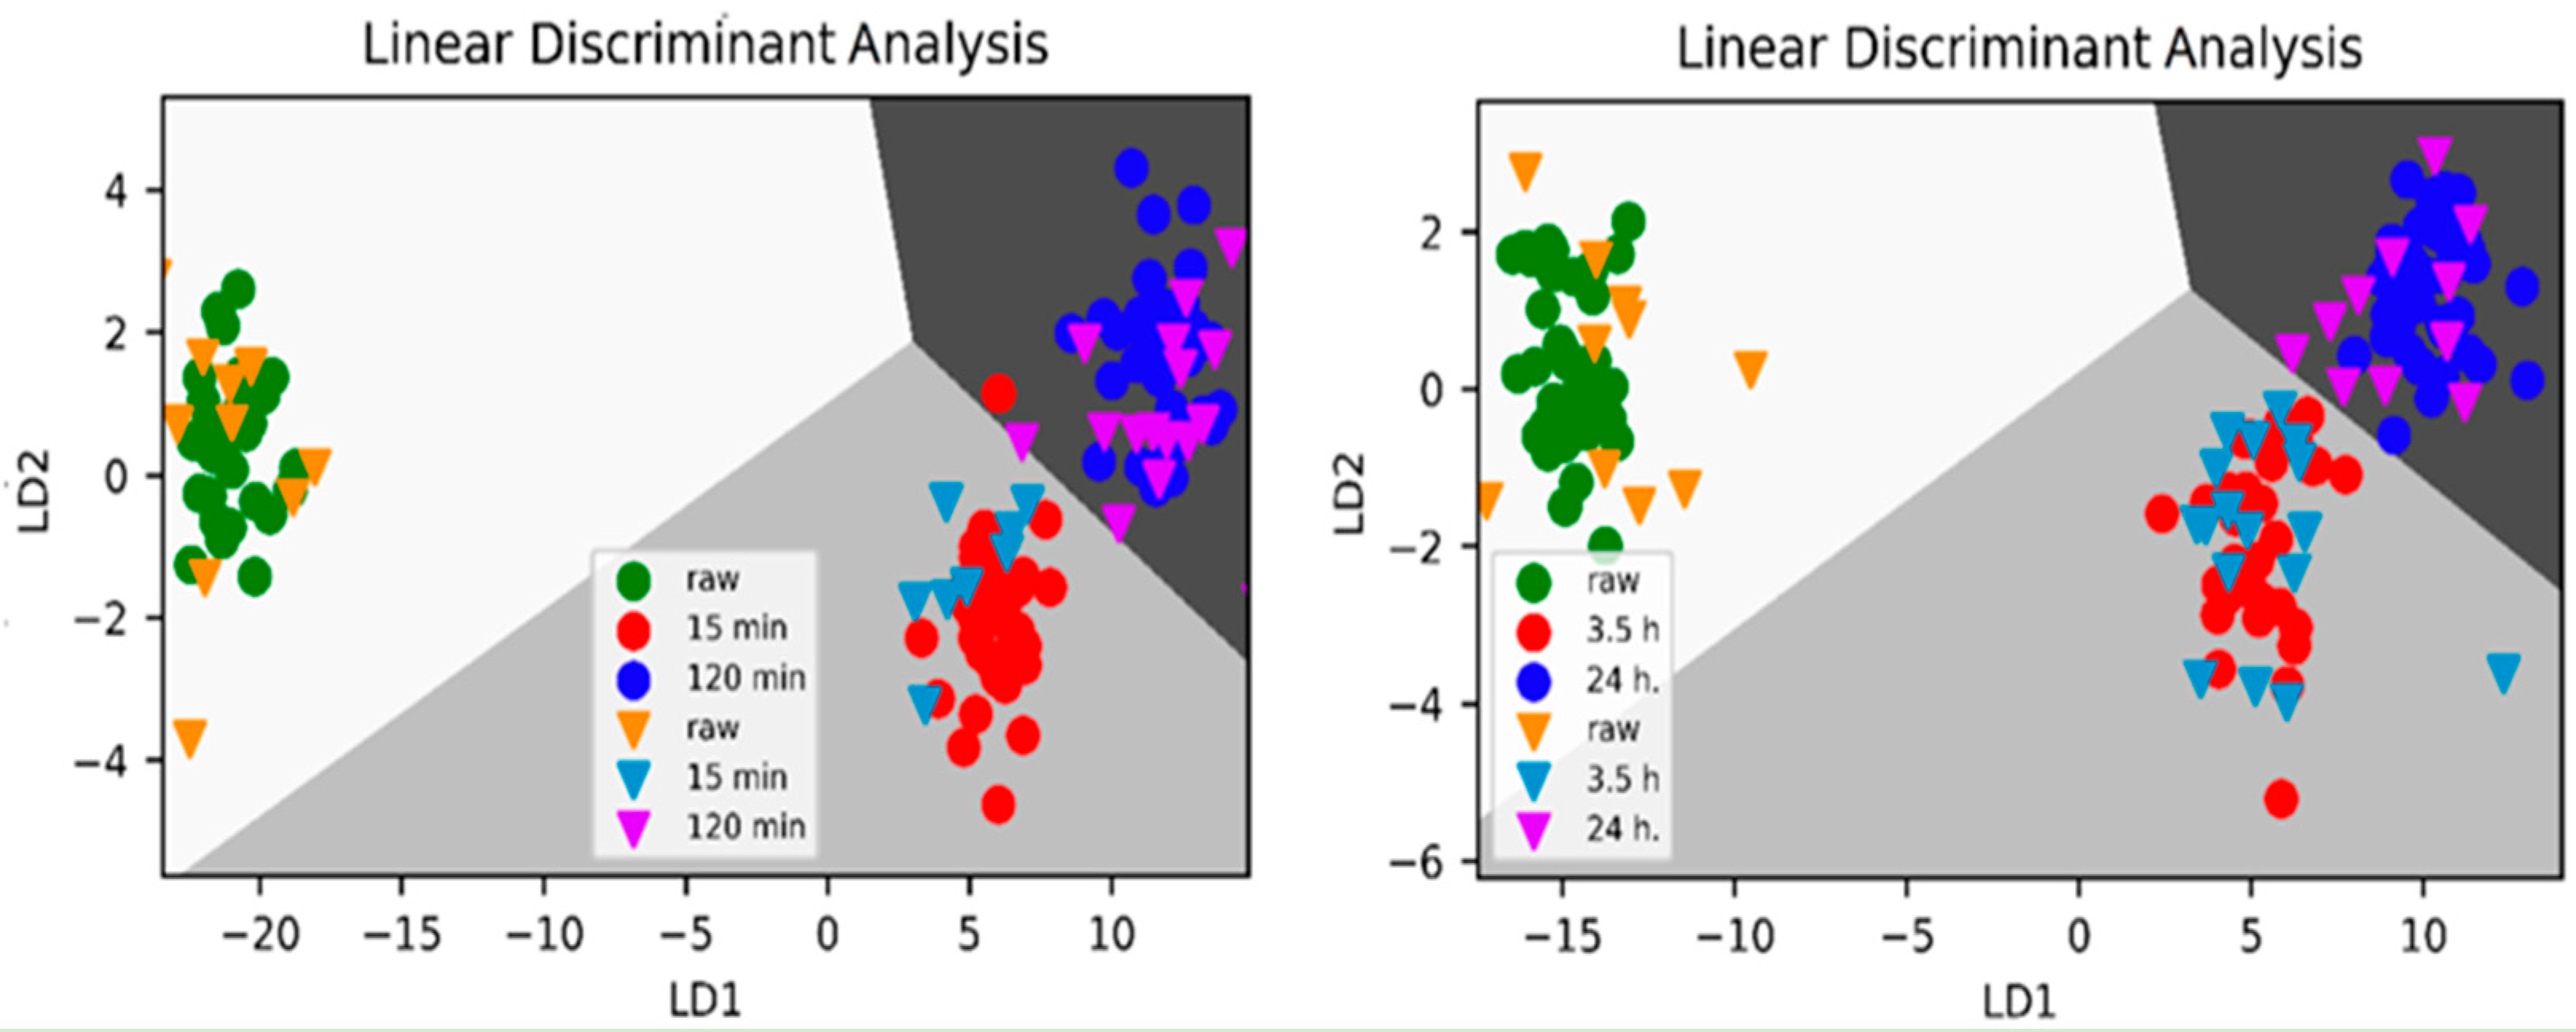
| Method | Device and Conditions | Reference |
|---|---|---|
| Use of dry air | Heating in a desiccant honey dehydrator (with silica gel desiccant bed) with dehumidified air at 35 °C or 45 °C | [99] |
| Heating of containers (having hot-water jacket) combined with treatment with dried air (until 40 °C) | [100] | |
| Desiccant-bed silica gel heating and drying the air, with recirculation at 40–55 °C up to 36 h | [101] | |
| Dehydrator system with control of temperature, drying air speed, relative humidity and honey exposure surface | [102] | |
| Vertical centrifugal honey-dehydrator with an external electric heat source and a closed air circuit and heat pump | [103] | |
| Vacuum drying | Use of Low Temperature Vacuum Drying (LTVD) (30 °C) with induced nucleation technique | [104] |
| Ultrasonic vacuum drying at 40 kHz 80 W | [105] |
| Chemometrics | Group Known a Priori | Independent Variables | Dependent Variable | Source Data | Output | Reference |
|---|---|---|---|---|---|---|
| ANOVA MANOVA | no | Categorical | Continuous | IPC-MS | Geographical origin | [139] |
| (HS-SPME/GC-MS) | Significant VOC for geographical origin | [145] | ||||
| PARAFAC | Categorical | Continuous | Fluorescence spectrometry data | Adulterants | [134] | |
| CA | no | DLLME-GC-MS | Geographic grouping of pollutants in honey | [128] | ||
| DLLME-GC-MS | Anthropic grouping of pollutants in honey | [129] | ||||
| IPC-MS | Geographical origin | [139] | ||||
| GC-MS | Relevant physico-chemical parameters and VOC | [169] | ||||
| PCA | no | Continuous | Continuous | DLLME-GC-MS | Geographic grouping of pollutants in honey | [128] |
| Vitamin B2 and Cu, antioxidant activity | Honey type | [131] | ||||
| HPLC data + ATLD | Honey type | [138] | ||||
| IPC-MS | Geographical origin | [139] | ||||
| (HS-SPME/GC-MS) | Significant groups of geographical origin | [145] | ||||
| SWATH-MS | Honey adulteration, geographical and botanical origin | [138] | ||||
| GC-MS | Relevant physico-chemical parameters and VOC | [169] | ||||
| Raman spectra tSNE | botanical origin and the quantity of adulterants | [177] | ||||
| LDA | yes | Continuous | Categorical | IPC-MS | Geographical origin | [139] |
| FTIR spectra with pre-processing | Botanical origin | [143] | ||||
| (HS-SPME/GC-MS) | Geographical origin | [145] | ||||
| Fluorescence spectrometry data | Adulterants | [134] | ||||
| PCA of MALDI-ToF-MS | Botanical origin | [162] | ||||
| PCA of MIR spectra | Botanical origin | [162] | ||||
| Gold nanoparticle sensor array | Botanical origin | [170] | ||||
| Physico-chemical and rheological parameters | Botanical origin | [173] | ||||
| PCA of Raman spectra | Quantity and type of multiple adulterants | [175] | ||||
| PLS | yes | Continuous | Continuous | FTIR spectra with pre-processing | pH, electrical conductivity, free acidity, 5-HMF, fructose, glucose and sucrose | [143] |
| Raman spectra | Botanical origin and the quantity of adulterants | [177] | ||||
| PLS-DA | yes | Continuous | Categorical | 1H NMR spectra with pre-processing | Geographical and botanical origin | [149] |
| 1H NMR spectra | Honey adulteration | [155] | ||||
| SWATH-MS | Honey adulteration, geographical and botanical origin | [138] | ||||
| Differential pulse voltammetry using NADES | Alteration after heat treatment | [158] | ||||
| ATR–FTIR spectra with pre-treatment | Adulteration and botanical origin | [166] | ||||
| GCMS | Biological origin | [169] | ||||
| Gold nanoparticle sensor array | Botanical origin | [170] | ||||
| Raman spectra | Quantity and type of multiple adulterants | [175] | ||||
| kNN | yes | Categorical | Categorical | PCA of MALDI-ToF-MS | Botanical origin | [162] |
| PCA of MIR spectra | Botanical origin | [162] | ||||
| Raman spectra | Quantity and type of multiple adulterants | [175] | ||||
| SIMCA | yes | Continous | Categorical | PARAFAC of fluorescence spectra | Geographical and botanical origin | [161] |
| MALDI-ToF-MS | Botanical origin | [162] | ||||
| MIR spectra | Botanical origin | [162] | ||||
| SVM | yes | Continuous | Continuous | ATR–FTIR spectra with pre-treatment | Adulteration and botanical origin | [166] |
| GCMS | Biological origin | [169] | ||||
| Gold nanoparticle sensor array | Botanical origin | [170] | ||||
| PCA and tSNE of Raman spectra | Botanical origin and the quantity of adulterants | [175] | ||||
| ANN | yes | Continuous | Continuous | Raman spectra | Maltose, fructose and sucrose content | [172] |
| Physico-chemical and rheological parameters | Botanical origin | [173] | ||||
| Raman spectra | Botanical origin and the quantity of adulterants | [175] |
| Quality Characteristics Analyzed | Analytical Method(s) | Chemometric Method(s) | Reference |
|---|---|---|---|
| Water content, EC, AC, pH and FA, HMF, IM, proline, sugar profile (fructose, glucose, maltose and sucrose) | Digital refractometer, EC meter, electrical furnace, pH meter, spectrophotometer, HPLC-RID and ATR-FTIR | PCA | [199] |
| Free amino acids, color and 5-HMF | HPLC-DAD and colorimeter | PCA, HCA and OPLS-DA | [257] |
| Water content, pH, sugar content (glucose, fructose, and sucrose) and HMF | Refractometry, pH meter, GC-FID, UHPLC-PAD and ATR-FTIR | PCA and LDA | [221] |
| EC, water content, pH and HMF | pH meter, EC meter and 1H-NMR | PCA, PLS-DA, OPLS-DA and HCA | [29] |
| Glucose, fructose and sucrose content, pH, water content, aw, refraction index, Brix concentration, FA, ash content, EC and color parameters | Chromatography, pH meter, refractometer, conductivity meter and colorimeter | PCA and LDA | [173] |
| Water content, electric conductivity, pH, free acidity and lactones, diastase index, UV/Vis spectrophotometer, color and NIR measurements | Refractometer, conductivity meter, pH meter, UV/Vis spectrophotometer, UHPLC-RID, visible spectrophotometer and NIR spectrometer | PCA, PLS-DA and SVM | [247] |
| Reduction of water content and volatile components by evaluating H-bonds forming or collapsing in the vibrations of H-bonded groups due to thermal hydration | NIR | Synchronous 2D correlation analysis | [248] |
| N-(1-deoxy-1-fructosyl) phenylalanine (Fru-Phe), an Amadori compound which is produced in the first stages of the Maillard reaction due to thermal hydration | UHPLC-Q-TOF-MS, HR-MS and NMR | PCA | [262] |
| Spectral regions related to age, temperature, and syrup adulteration of honey | NIR | ASCA | [219] |
| HMF, diastase activity and phenolic content | UV–visible spectrometry and chromatography | PCA and HCA | [240] |
| Physico-chemical properties (liquefaction time, diastase number, color and viscosity and HMF formation) | Rheometer, spectrophotometer, HPLC | PCA | [112] |
| Water content, acidity, water activity, glucose, fructose, sucrose, glucose/water ratio, glucose/fructose ratio, textural parameters (hardness, springiness, cohesiveness, adhesiveness, viscosity, chewiness and gumminess), microbial number and content of crystals | Refractometer, HPLC, UV-VIS spectrophotometer, colorimeter, texture analyzer, stereomicroscope | PCA | [115] |
Disclaimer/Publisher’s Note: The statements, opinions and data contained in all publications are solely those of the individual author(s) and contributor(s) and not of MDPI and/or the editor(s). MDPI and/or the editor(s) disclaim responsibility for any injury to people or property resulting from any ideas, methods, instructions or products referred to in the content. |
© 2023 by the authors. Licensee MDPI, Basel, Switzerland. This article is an open access article distributed under the terms and conditions of the Creative Commons Attribution (CC BY) license (https://creativecommons.org/licenses/by/4.0/).
Share and Cite
Tarapoulouzi, M.; Mironescu, M.; Drouza, C.; Mironescu, I.D.; Agriopoulou, S. Insight into the Recent Application of Chemometrics in Quality Analysis and Characterization of Bee Honey during Processing and Storage. Foods 2023, 12, 473. https://doi.org/10.3390/foods12030473
Tarapoulouzi M, Mironescu M, Drouza C, Mironescu ID, Agriopoulou S. Insight into the Recent Application of Chemometrics in Quality Analysis and Characterization of Bee Honey during Processing and Storage. Foods. 2023; 12(3):473. https://doi.org/10.3390/foods12030473
Chicago/Turabian StyleTarapoulouzi, Maria, Monica Mironescu, Chryssoula Drouza, Ion Dan Mironescu, and Sofia Agriopoulou. 2023. "Insight into the Recent Application of Chemometrics in Quality Analysis and Characterization of Bee Honey during Processing and Storage" Foods 12, no. 3: 473. https://doi.org/10.3390/foods12030473