Article

Structural Equation Modeling (SEM) and Temporal Dominance of Sensations (TDS) in the Evaluation of DOC Douro Red Wine’s Sensory Profile

1
Center for Computational and Stochastic Mathematics (CEMAT), Department of Mathematics, University of Trás-os-Montes and Alto Douro, Apt. 1013, 5001-801 Vila Real, Portugal
2
University of Trás-os-Montes e Alto Douro, Apt. 1013, 5001-801 Vila Real, Portugal
3
CQ-VR, Chemistry Research Center, Department of Biology and Environment, School of Life Sciences and Environment, University of Trás-os-Montes and Alto Douro, Apt. 1013, 5001-801 Vila Real, Portugal
*
Author to whom correspondence should be addressed.
Foods 2022, 11(8), 1168; https://doi.org/10.3390/foods11081168
Submission received: 12 March 2022 / Revised: 5 April 2022 / Accepted: 13 April 2022 / Published: 18 April 2022
(This article belongs to the Section Drinks and Liquid Nutrition)

Abstract

:
In the Portuguese Douro region, several DOC (Denomination of Controlled Origin) Douro red wines are produced and, due to the peculiar characteristics of the three Douro sub-regions, present particular imprinted terroirs, that can be perceived when tasted. Considering the DOC Douro wine’s sensory profile and terroir, this study aimed to analyze the sensory characteristics of red wines produced in the three Douro sub-regions (Baixo Corgo, Cima Corgo, and Douro Superior) by a single point sensory technique, a Quantitative Descriptive Analysis—QDA® and also applying a temporal method-TDS (Temporal Dominance of Sensations). The use of QDA and TDS methods proved to be efficient in the wine’s sensory profile characterizing. The QDA® method allowed a detailed classification of attributes; however, the TDS method proved to be much more efficient. Moreover, the wines of the three sub-regions presented profiles with characteristics very similar in olfactory and taste/flavor aspects, pointing out a huge relation between the characteristics of the three sub-regions and the grape varieties present in the wines. Globally, the olfactory profile of wines is characterized by Fruity, Floral, and Balsamic aromatic notes, while the taste/flavor profile stands out, highlighting Astringency and Acidity and, again, Fruity as the main in-mouth aroma. It was also possible to conclude that TDS is a fast method that is easy to apply and has excellent results in the evaluation of the olfactory and taste/flavor profile of wines and, with a larger set of samples, it would be possible to obtain characteristic TDS curves for each Douro sub-region, providing a wine’s fingerprint that could be used for authentication and traceability purposes.

Graphical Abstract

1. Introduction

In wine production, quality and style are considered to be impacted by the place where the vineyards grow, and this relationship between the sensory and chemical attributes and the place of origin is called ‘terroir’ [1]. The imprinted “terroir” can be derived from a diverse range of factors related to the physical environment, such as climate, topography, soil, and geology, as well as human intervention, including viticulture and oenological decisions and practices [2].
The Douro region, Figure 1, in the north of Portugal, is the first demarcated and regulated wine region in the world since 1756. The region has a total area of about 250,000 hectares, of which 43,708 hectares with vineyards. It is divided into three sub-regions, Baixo Corgo, Cima Corgo, and Douro Superior. In 2001, the region received the World Heritage badge awarded by the United Nations Educational, Science and Culture Organization (UNESCO) [3].
The vinicultural zone covers the steep slopes along the banks of the lower reaches of the Douro River (Figure 1), which is one of the longest on the Iberian Peninsula. The Douro River finds its source in northern Spain, where it is called Duero. It flows through the vineyards of Ribera del Duero before finding the Portuguese border and becoming the Douro. The Douro’s most unifying peculiarity is its mountainous terrain. Typically, however, the vineyards stretch up the steep, dry slopes on either side of the river and its myriad tributaries on narrow rocky terraces.
The three sub-regions express different aspects of the area’s hot continental climate (Table 1).
In the Douro region, in addition to the famous Port wine, several red table wines, also denominated DOC Douro red wines, are produced and, due to the peculiar characteristics of the three Douro sub-regions, present particular imprinted terroirs that can be perceived when tasted. The DOC Douro red wines tend to be robust and full-bodied and often spend some time aging in oak. The same red grape varieties that are present in Port wines are typically used for the dry wines, being the more important ones, the Touriga Nacional, Touriga Franca, and Tinta Roriz (also called Tempranillo in Spain), either in a blend or bottled alone. Young wines are often characterized by distinctive aromas: “caramel”, “honey”, “red-fruit” (e.g., red and black currant, cherry), “floral” (such as rose, violet), “nutty” (almond and hazelnut are the most cited), “balsamic”, and “resinous” [5]. Many of these descriptors appear on the wine labels and are mentioned in wine-related magazines such as the Portuguese Revista de Vinhos, or the international Wine Enthusiast and Wine Spectator magazines.
The characterization of the sensory profile of wines from a given region is a recurrent theme and has been addressed in several investigations [2,6,7]. Furthermore, descriptions of the sensory attributes of wine, usually generated by wine specialists, are widely used to guide consumer purchases [8]. Currently, descriptive analysis is based on the methods of Quantitative Descriptive Analysis (QDA®), used worldwide, and considered a reference for robust, reliable, and valid sensory analyses to measure sensory properties among a set of samples [9]. A recent study by Guld et al. [10] pointed to the QDA® method as the most sensitive and detailed sensory analysis in wines compared to the OIV system of 100 points. However, the QDA® process is time-consuming and expensive, as participants or panelists must be selected and trained, which can take several months [11].
Compared to traditional sensory descriptive analysis, the Temporal Dominance of Sensations (TDS) method can be seen as faster and less expensive, as it does not require any training step [12]. Relatively new in the sensory field, it consists of describing the temporal evolution of the different sensations developed during food and drink consumption [13]. Moreover, TDS is better than temporal dominance methods due to the possibility of consecutively recording several sensory attributes over time, identifying one specific attribute as “dominant” [14]. The method fills the gap between static multidimensional sensory profiles and time-intensity (TI) one-dimensional dynamics, offering a way to simultaneously evaluate multiple attributes, dynamically, over time [15].
Considering the DOC Douro wine’s sensory profile and terroir, this investigation aimed to analyze the sensory characteristics of red wines produced in the three Douro sub-regions (Baixo Corgo, Cima Corgo, and Douro Superior) by a single point sensory technique—QDA®- and also applying a temporal method-TDS, intending to verify if there are specific sensory profiles related to each of the sub-regions.
A Structural Equation Modeling (SEM) tool for the QDA® data analysis was used. This statistical analysis is mainly used in ecology and forestry data analysis [16,17], psychology and other social sciences [18], and network meta-analysis [19]. Recently was used in the study of the sensory profile of Vinho Verde monovarietal wines [20]. This technique simultaneously combines confirmatory factor analysis (measurement model) and regression analysis (structural model), allowing (i) taking measurement error into account; (ii) incorporating unobserved variables with multiple indicators; (iii) modeling and testing complex patterns of relationships and, (iv) testing local and global assessment and specific assumptions about parameters [21].

2. Materials and Methods
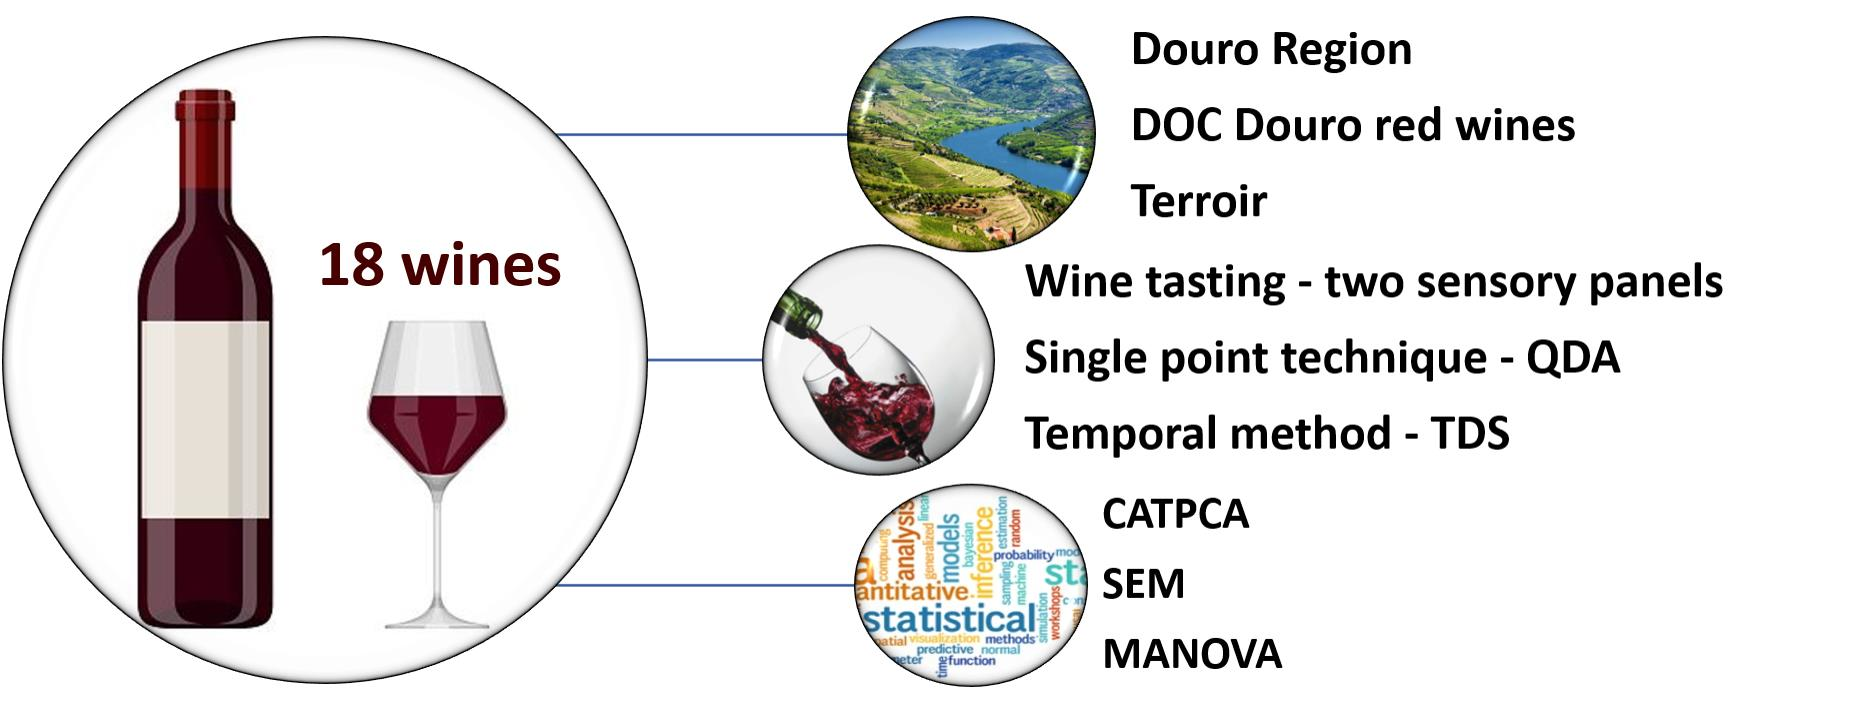
2.1. Wines

Seeking a representative number of samples, eighteen wines from different producers were used, six distinct samples representing each of the three sub-regions of the DDR (Baixo Corgo, Cima Corgo, and Douro Superior), Table 2. The choice of the wines followed six criteria:
  • Have the DOC Douro (Designation of Origin Certification);
  • Be classified as red, dry, and still wine;
  • Contain mandatorily, but not exclusively, in the composition of the blend the grape varieties Touriga Franca, Touriga Nacional, and Tinta Roriz;
  • Be produced between 2015 and 2017;
  • Bottled in a 750 mL container and properly labeled and available for marketing;
  • With or without aging in oak barrels.
Most of the wines were directly awarded to the respective producers between April and December of 2019; others were purchased in specialty stores. All bottles were stored in an environment conducive to their conservation, in a horizontal position, at room temperature (20 ± 2 °C), and without light incidence. Table 1 shows the relationship and codification of wines together with some analytical data according to the technical data sheet provided by the producers.

2.2. Choice of Attributes

2.2.1. For QDA®

The list of attributes selected for the development of the QDA® tasting sheet (Supplemental Table S1) was adapted according to the works of Böhm [22], Almeida [23]; Stone and Sidel [24], and WSET Levels 3 and 4 Systematic Approach to Tasting Wine®¹ [25,26].
The attribute’s intensities were scored on a five-point scale (ranging from 1, lowest intensity, to 5, highest intensity), adapted from Monteiro et al. [27].

2.2.2. For TDS

For the TSD, the list of olfactory attributes and gustatory attributes (Table 3) was obtained according to the highest citation frequency, by the tasters, in the sensory evaluations of QDA®.

2.3. Selection and Training of Tasters

Recruitment was undertaken through direct contact and referrals at the University of Trás-os-Montes and Alto Douro (UTAD). The selection of panels followed the procedures established according to the ABNT NBR ISO 8586 [28] standard. For the panel of trained tasters (PP1—trained panelists), twelve participants were selected between twenty candidates, seven women and five men, with ages between twenty-one and forty-seven years old. In the second panel (PP2—expert panelists), six tasters were recruited because they had previous experience in sensory panels. This panel was formed by three women, two sommelières with professional training and a master’s degree in enology and viticulture, and three men, all enologists, aged between twenty-five and forty-seven years old. All recruited panelists, trained and experts, answered the questionnaire for the selection, with the following criteria for approval:
  • Not having health problems or food allergies that did not allow them the consumption of alcoholic beverages;
  • Having participated in wine sensory panels previously;
  • Be a frequent consumer of red wine;
  • Having interest and availability to attend training sessions and tests.
The selected candidates participated in three training sessions lasting approximately two hours and thirty minutes each. The sessions were held in a tasting room with adequate conditions according to ISO 8589 [29]. Table 4 lists the content taught in the training sessions.

2.4. Tasting Procedure

2.4.1. For QDA®

The sessions were held in the sensory analysis laboratory in the Enology Building at the University of Trás-os-Montes and Alto Douro (UTAD). The laboratory complies with all ISO 8589 [29] regulatory requirements, giving the panel an appropriate environment; such conditions are critical to ensure the quality and reliability of the results.
The tasters had at room temperature mineral water and dried unsalted biscuits to clean the palate and taste buds between the tasting of each wine, as well as spatters and napkins.
The wines were prepared in a support room, properly enveloped and coded with random three-digit codes so as not to identify the labels, and opened thirty minutes in advance of the tasting. Ten minutes before the start, without the presence of the tasters, fifty milliliters (50 mL) of each wine were served in ISO 3591 [30] tasting glasses, at room temperature (20 ± 2 °C), coded, and randomly arranged.
As soon as the tasters entered the test room, they were directed to their places, where they were instructed to sign the attendance list and fill out their data in the paper tasting forms, and then start the tasting.
Three sessions were performed for three days in a row. For PP1, in each session, six wines from the same sub-region were analyzed. For PP2, in each session, six wines were evaluated, two from each sub-region. The sessions of the panel of trained tasters (PP1) lasted approximately forty-five minutes, while those of PP2 lasted thirty minutes.

2.4.2. For TDS

In TDS sessions, expert tasters (PP2 panel) used laptops with the free SensoMaker® software (version 1.91, 2017, Universidade Federal de Lavras UFLA, Lavras, MG, Brazil) for data acquisition and analysis.
TDS evaluations were performed in three sessions, one per day. The sessions were composed of two types of analysis, olfactory and gustatory, evaluated sequentially. In each of the analyses, the tasters evaluated six wines, two from each subregion. The tasters followed the TDS assessment protocol (Table 5), and the sessions lasted approximately fifteen minutes.

2.5. Data Analysis

The homogeneity and performance of the trained panel (PP1) and the specialists (PP2) were evaluated by factor analysis (FA), on the correlation matrix, with the extraction of factors by the component method. The common factors retained were those that had an eigenvalue greater than one. To evaluate the validity of FA, the KMO criterion and Bartlett’s test of sphericity were used [21,32].
Structural equation modeling (SEM) was used to characterize the sensory profile of the wines of each of the three sub-regions of the DDR. For the estimation of the parameters, we used the maximum likelihood method, which provided the standardized estimates of the coefficients (an estimate higher than 0.5 in absolute value indicates a strong association). The existence of outliers was evaluated by the square distance of Mahalanobis (D2), and the normality of the variables was evaluated by the skewness (Sk) and kurtosis (Ku) coefficients. Comparative Fit Index (CFI), Goodness of Fit Index (GFI), Root-Mean-Square Error of Approximation (RMSEA), and χ2 statistics were used to determine the adequacy of the models. A CFI > 0.90, GFI > 0.90, and RMSEA < 0.05 with 90% CI < 0.10 are acceptable indices of fit for the model, and χ2/df < 2 is considered to be good [21].
Multivariate analysis of variance (MANOVA) was performed to evaluate the significance of the sub-regions on the quantitative parameters of TDS curves for olfactory and gustatory attributes. When MANOVA detected statistically significant effects, univariate analysis of variance (ANOVA) was performed, followed, whenever possible, by Tukey’s post-hoc test.
All statistical analyses were performed using SPSS 27.0 (IBM SPSS 27.0, Chicago, IL, USA) and AMOS (v. 22, SPSS, An IBM Company, Chicago, IL, USA) software.

3. Results

3.1. Panels (PP1 and PP2) Performance Assessment

The results obtained for the PP1 panel (Table 6) indicate good data adequacy [KMO = 0.9 and Bartlett’s test (p < 0.001)]. According to the rule of eigenvalue greater than 1 (λ = 10.766), the relational structure is explained by one factor, which explains 89.716% of the variability. Table 6 shows the factorial weights, communalities, eigenvalue, and percentage of variance explained for the factor.
As can be seen, all tasters present high loadings, which indicates similar behavior between them. Additionally, the communality value for each of the tasters is high, indicating that the component is adequate to describe the factorial structure among the tasters.
Regarding the PP2 panel (Table 7), as it was observed for the PP1, the FA is also adequate [KMO = 0.849, and Bartlett’s test (p < 0.001)]. The relational structure of the classifications is explained by one factor that presents an eigenvalue of 5.530 and explains 92.163% of the total variability.
The results obtained indicate a homogeneous behavior on the part of the panel of expert tasters (PP2). Moreover, the high value of the communalities is an indicator of the suitability of the component to describe the factorial structure among the expert tasters.

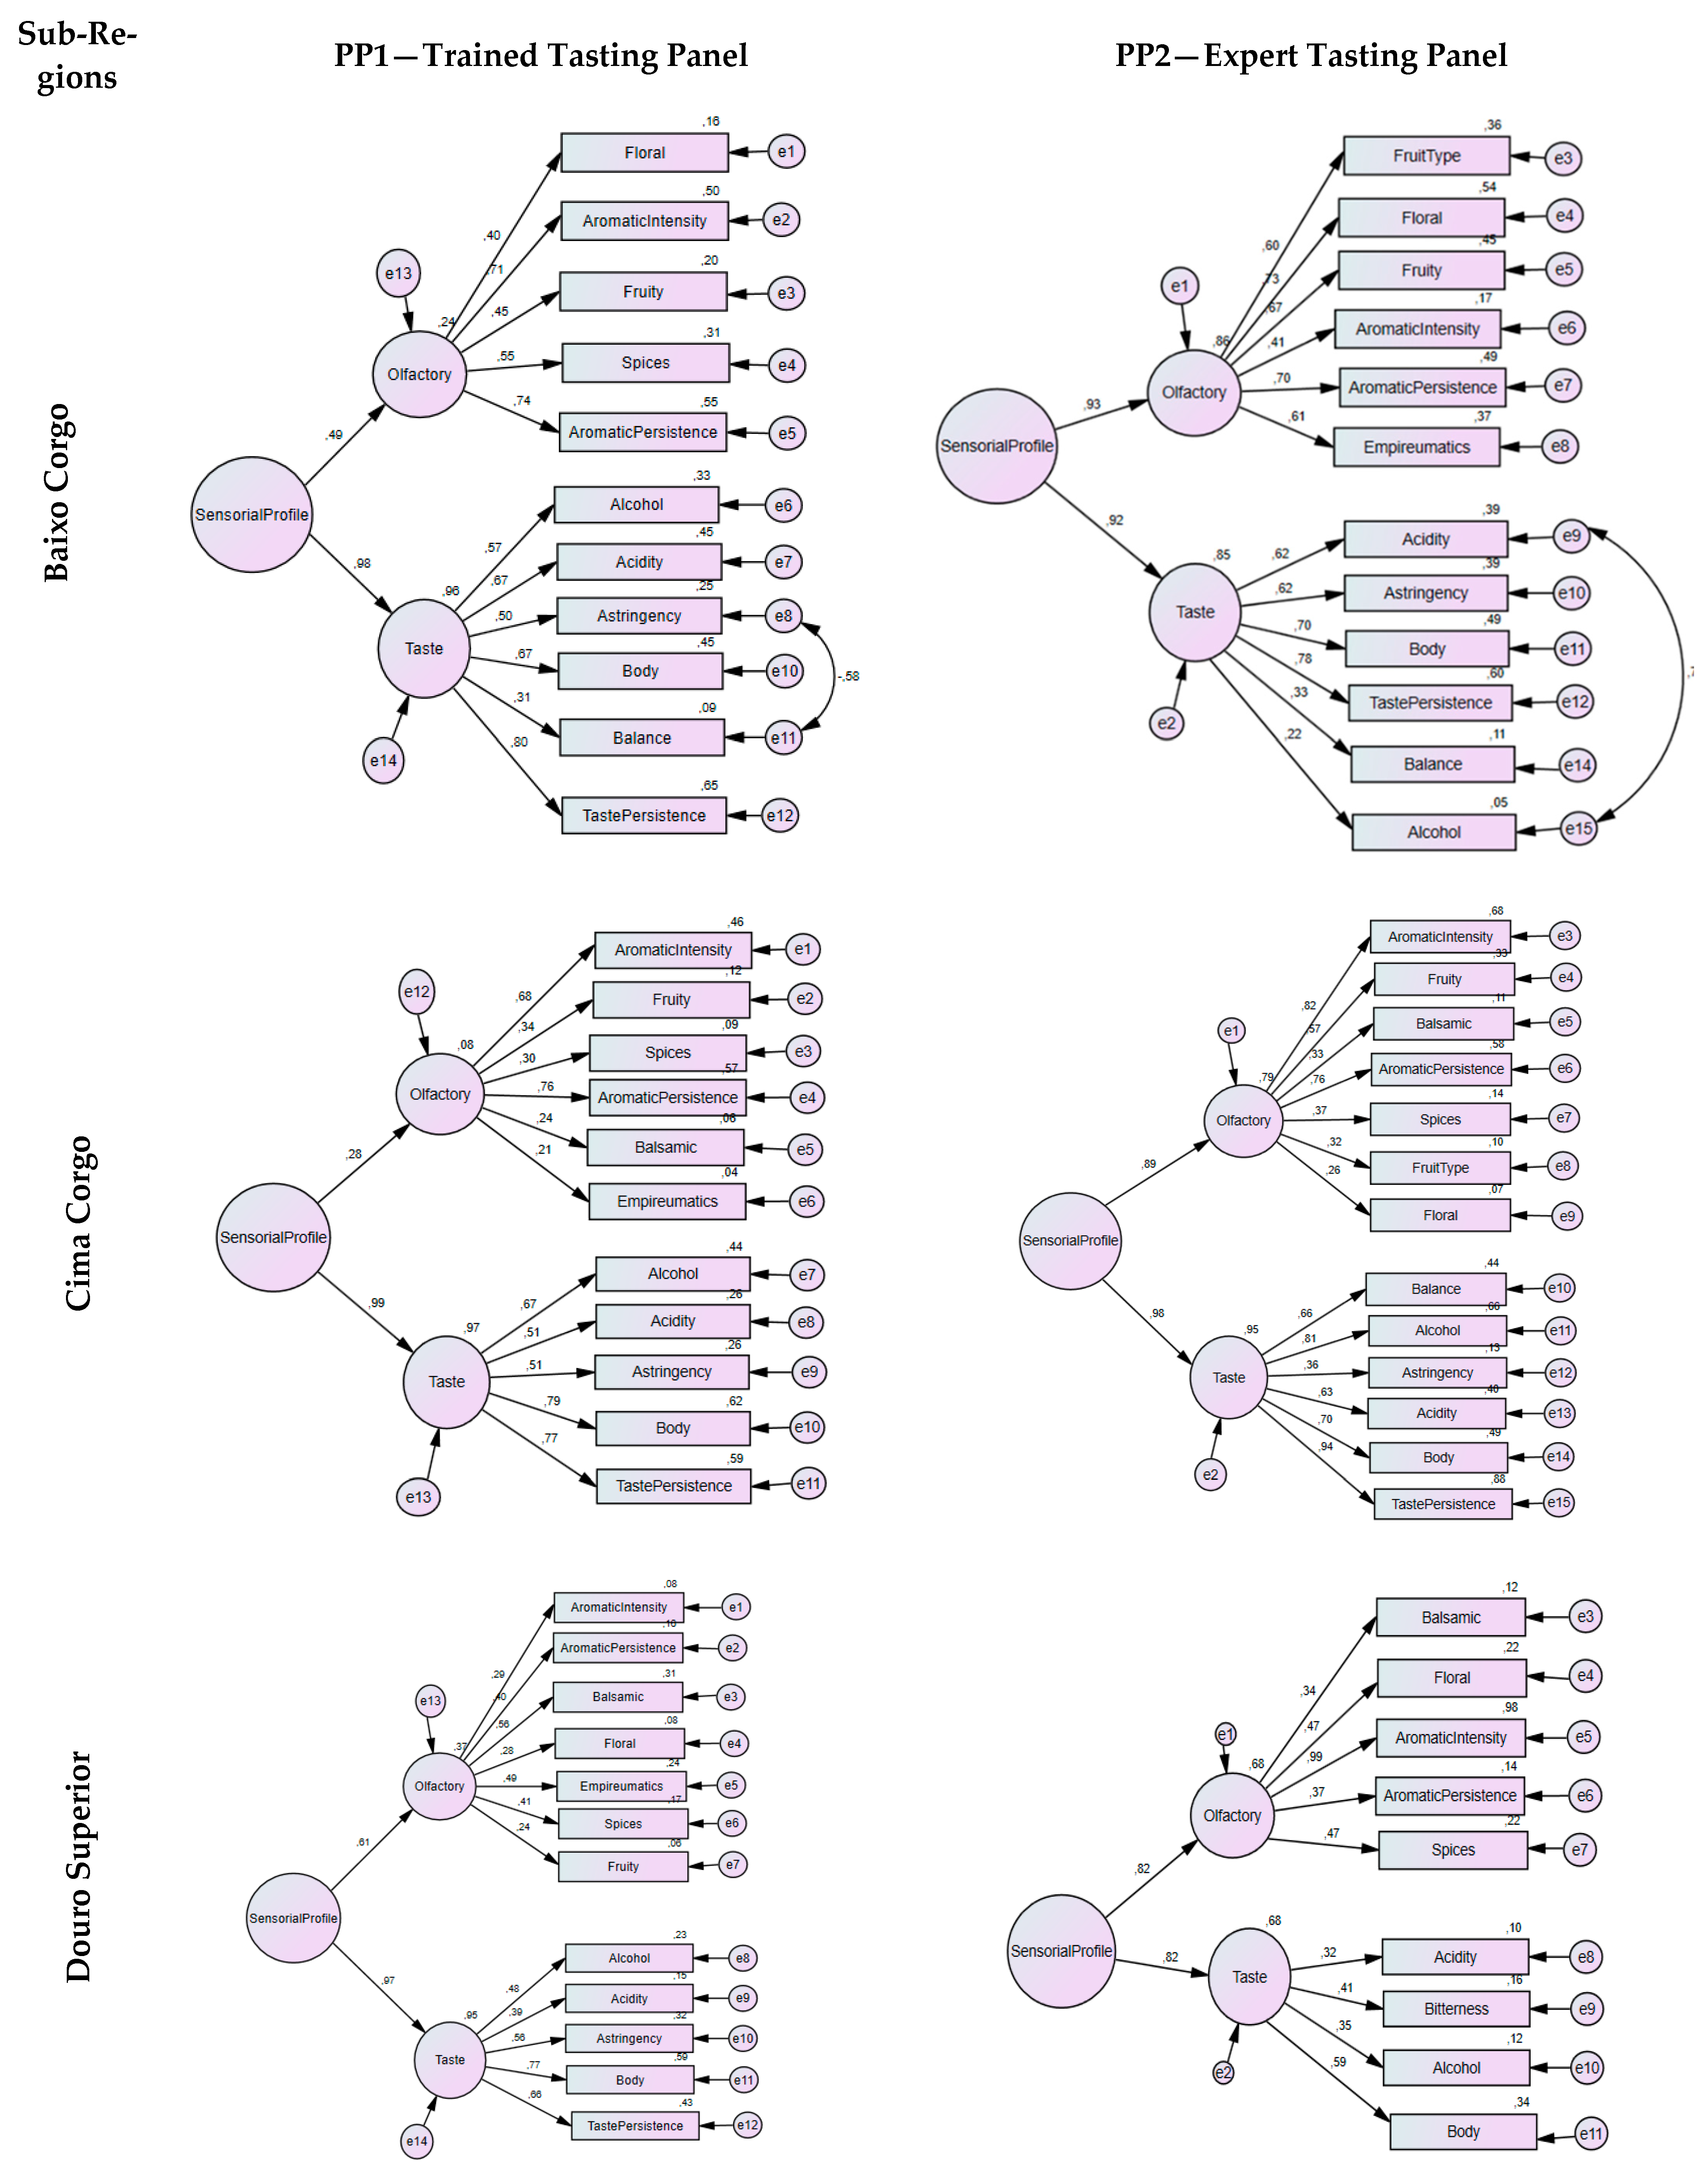
3.2. Sensory Profile of Wines Data Analysis by SEM

After QDA analysis, a structural equations modeling methodology, SEM, was applied for the sensory profile characterization of the wines studied. Figure 2 shows the schematic representation and values of the standardized factor weights and the individual reliability of each of the items in the final second-order CFA model for the sensory profile of the wines. As can be seen, the measurement model of sensory attributes under study, for PP1 panel, revealed a good measurement fit for the sub-regions Baixo Corgo (χ2/df = 1.002; CFI = 1; GFI = 0.907; RMSEA = 0.005; P[rmsea < 0.05] = 0.744), Cima Corgo (χ2/df = 1.655; CFI = 0.814; GFI = 0.876; RMSEA = 0.092; P[rmsea < 0.05] = 0.045), and Douro Superior (χ2/df = 1.743; CFI = 0.681; GFI = 0.831; RMSEA = 0.102; P[rmsea < 0.05] = 0.012). Most descriptors have high factor weights and the taste/flavor sensation is the strongest in all models. Regarding the sensory profile of wines by expert tasters (PP2 panel), the results obtained for Baixo Corgo, Cima Corgo, and Douro Superior showed an acceptable measurement fit (χ2/df = 1.931; CFI = 0.741; GFI = 0.797; RMSEA = 0.163; P[rmsea < 0.05] = 0.003), (χ2/df = 1.647; CFI = 0.744; GFI = 0.0.706; RMSEA = 0.136; P[rmsea < 0.05] = 0.005), (χ2/df = 1.305; CFI = 0.825; GFI = 0.855; RMSEA = 0.093; P[rmsea < 0.05] = 0.263), respectively. We can also observe that most of the descriptors have high factorial weights and that both sensations manifest themselves equally in the sensory profile characterization.
In Figure 2, concerning the PP1 (trained tasting panel), we can also verify that, for Baixo Corgo, the olfactory attributes that contribute the most to the olfactory discrimination of wines are, Aromatic Persistence, Aromatic Intensity, Spices, Fruity, and Floral, ordered according to the standardized estimated values. Regarding the taste/flavor attributes: Taste persistence, Acidity, and Body with the same contribution, Alcohol, Astringency, and Balance, are those who contribute the most.
For the Cima Corgo sub-region, the olfactory attributes that contribute the most, ordered according to factor weights, are Aromatic Persistence, Aromatic Intensity, Fruity, Spices, Balsamic, and Empireumatic. In the taste/flavor attributes, we can find Taste Persistence, Body, Alcohol, Astringency, and Acidity.
Different characteristics present in the wines from the Douro Superior sub-region. In the olfactory group, we find Balsamic, Empireumatic, Spices, Aromatic Persistence, Aromatic Intensity, Floral, and Fruity, and among the taste/flavor attributes are Body, Taste Persistence, Astringency, Alcohol, and Acidity (Figure 2).
When the analysis was performed by a panel of experts (PP2), Figure 2, in the Baixo Corgo sub-region, the olfactory attributes, ordered according to factor weights, are Aromatic Persistence, Floral, Fruity, Empireumatic, Aromatic Intensity, and Spices, while, for taste/flavor, are Taste Persistence, Body, Astringency, and Acidity.
The wines from the Cima Corgo sub-region are characterized by the olfactory attributes of Aromatic intensity, Aromatic persistence, Fruity, Spices, Balsamic, Floral, and Empireumatic and by the taste/flavor attributes of Taste Persistence, Alcohol, Body, Balance, Acidity, and Astringency. In comparison, the sensory profile of Douro Superior sub-region wines is most characterized by Aromatic intensity, Floral, Aromatic Persistence, Balsamic (olfactory characteristics), Body, Taste Persistence, and Balance (taste/flavor attributes), Figure 2.

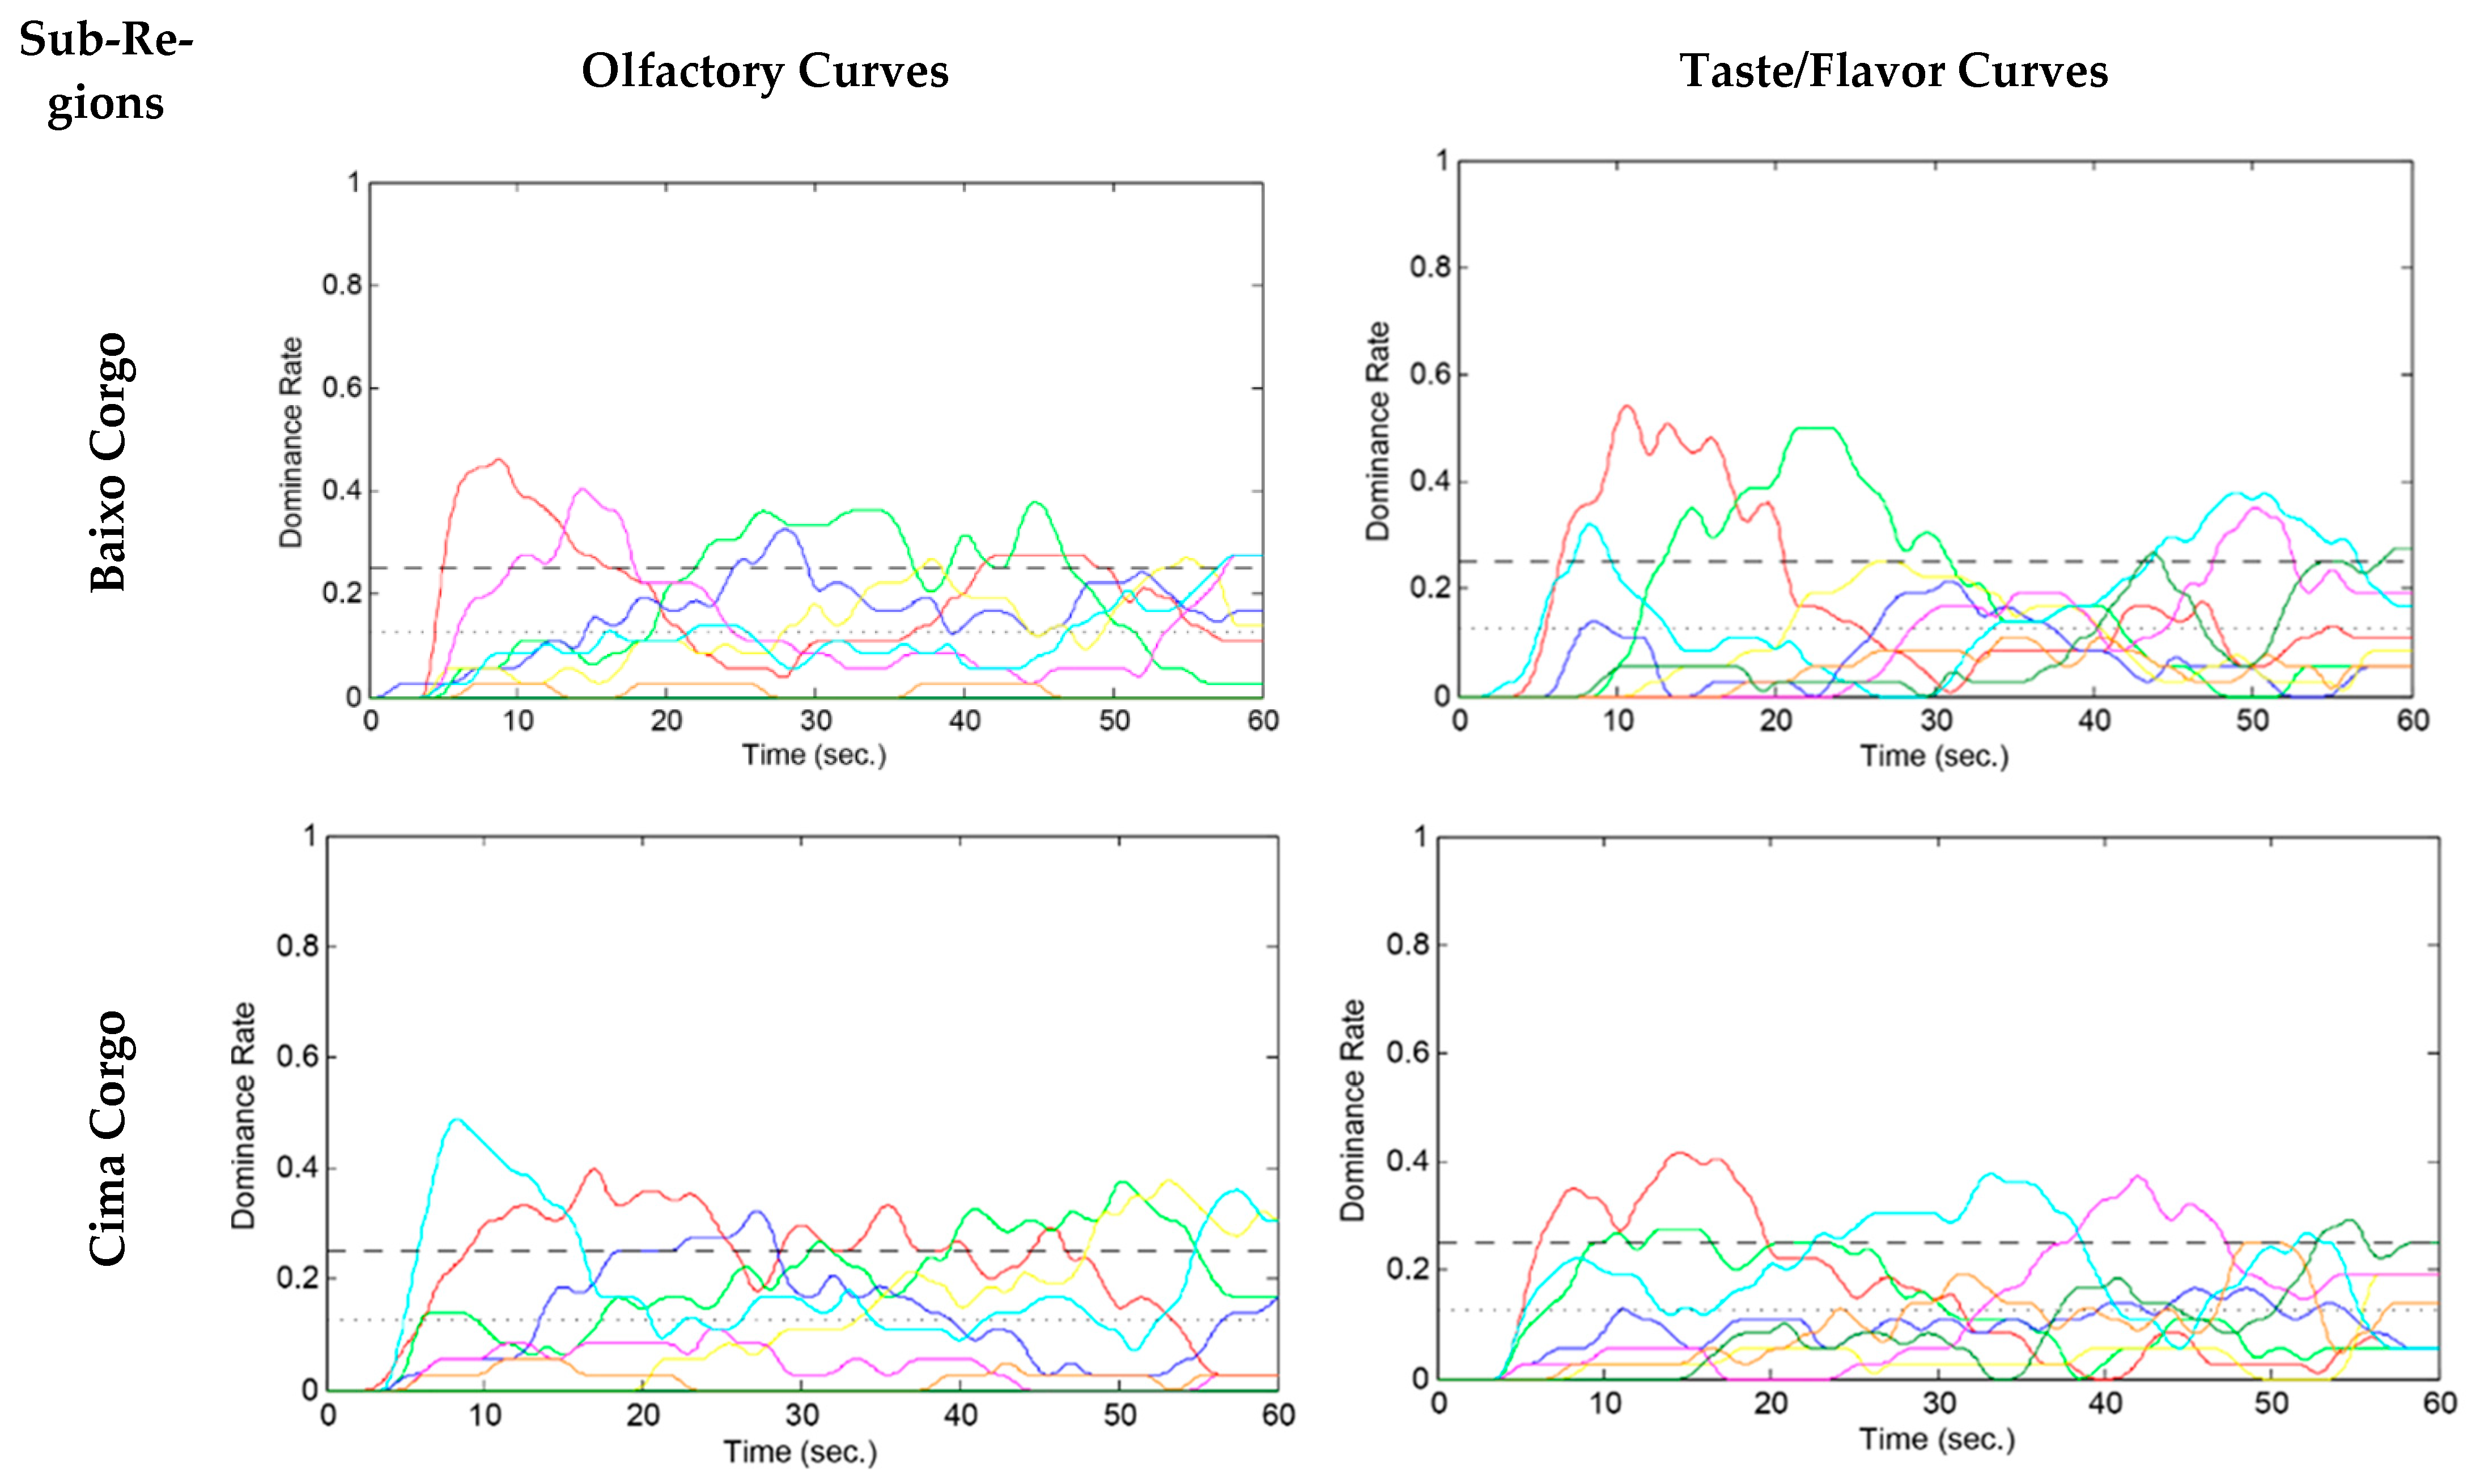
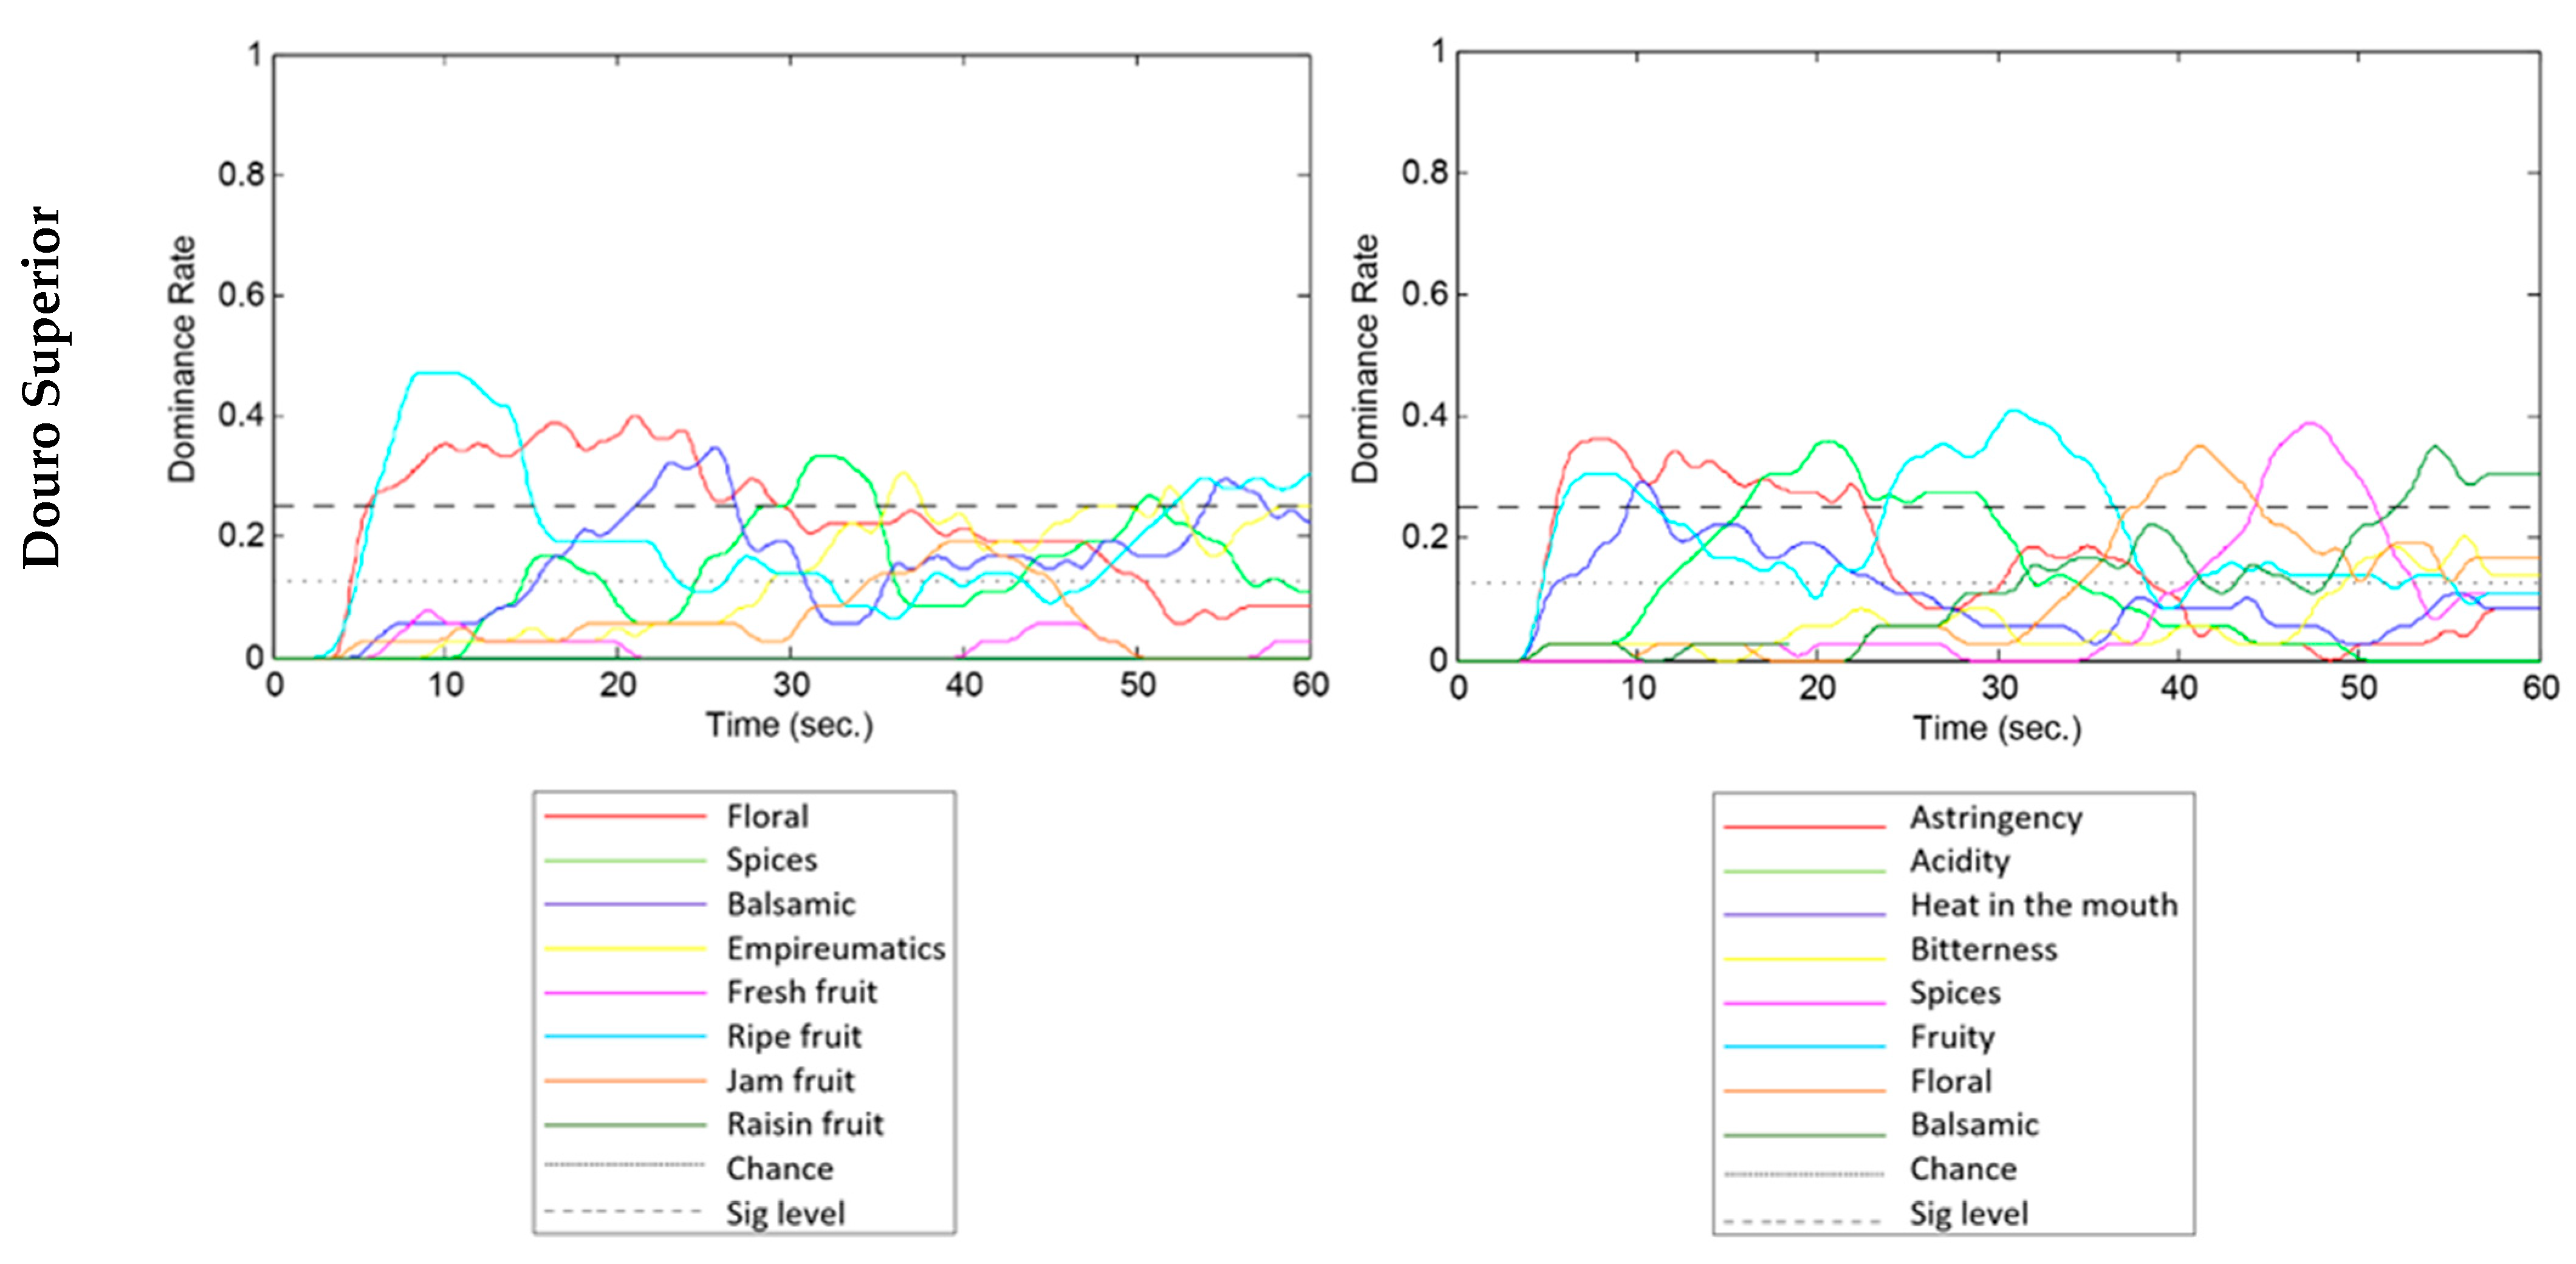
3.3. Sensory Profile of Wines Applying the TDS Evaluation

As it was mentioned before, TDS was performed using laptops with the free SensoMaker software (version 1.91, 2017) for data acquisition and analysis. The software output shows the Temporal Dominance of Sensation curves (Figure 3), along with some quantitative parameters of TDS curves such as DRmax (highest maximum dominance rate); T max (level line of significance), and T 90% max (maximum dominance rate), Table 8.
For each evaluated wine and each time, dominant rates were calculated by attributes [33]. These rates are obtained by dividing the number of citations of an attribute by the number of panelists and the number of replications. Since one panelist can have only a single dominant attribute at each time, the sum of the dominance rates over attributes is equal to one at each time; the higher the dominant index, the better the agreement among panelists. The graphics represent two other lines: (i) the “chance level” represents the dominance rate that an attribute can obtain by chance (1/number of attributes), and (ii) the “significance level line”, based on a binomial test, wish expresses the smallest value of the proportion being significantly higher than the chance level [33]. When the TDS curves go from between the chance and the significance levels to above the latter, they are consistent at the panel level [34].
In the olfactory evaluation of wines from the Baixo Corgo sub-region, according to the graphic representation of the TDS curves (Figure 3), six attributes overlapped with the significance level line, according to the perception of the tasters: Floral, Fresh Fruit, Spices, Balsamic, Ripe Fruit, and Empireumatic. The Floral attribute recorded the highest maximum dominance rate (DR max) with the representativeness of 46.09% of the evaluations, at 8.7 s (seconds) of the test, followed by attributes Fresh fruit (DR max 40.45%) at 14.3 s, Spices (DR max 37.88%) at 44.8 s, Balsamic (DR max 32.58%) at 28 s, Ripe fruit (DR max 27.78%) at 58.5 s and Empireumatic (DR max 27.02%) at 55s. The Spices attribute stood out with the largest range of the maximum dominance rate (T 90% max) lasting 20.1 s. As for the taste/flavor evaluation, the following attributes: Astringency, Fruity, Acidity, Bitterness, Balsamic, and Spices, overlapped the level line of significance and were ordered according to the perception of the tasters. The highest maximum dominance rate was recorded by the attribute Astringency (DR max 54.29%) at 10.6 s of the evaluation, followed by attributes: Acidity (DR max 50%) at 21.5 s, Fruity (DR max 38.13%) at 49 s, Spices (DR max 35.10%) at 50.2 s, Balsamic (DR max 27.78%) at 59.6 s and Bitterness (DR max 25%) at 26.5s. However, the Balsamic attribute was the one that printed the longest time interval of the maximum dominance rate (T 90% max) with a duration of 16.9 s (Table 8).
In the olfactory evaluation of wines from the Cima Corgo sub-region, according to the interpretation of the TDS curves, the attributes: Ripe Fruit, Floral, Balsamic, Spices, and Empyreumatic, overlapped the line of significance level and were ordered according to the perception of the tasters. The highest maximum dominance rate was obtained by the attribute Ripe fruit (DR max 48.86%) at 8.3 s of the evaluation, successively by Floral (DR max 38.95%) at 16.9 s, Empyreumatic (DR max 37.88%) at 53.2 s, Spices (DR max 37.75%) at 50.3 s, and Balsamic (DR max 32.32%) at 27.2 s. The Floral attribute was expressed with the longest time interval of the dominance rate (T 90% max) with a duration of 4.8 s. Regarding the taste/flavor evaluation, the following attributes: Astringency, Acidity, Fruity, Spices, Floral, and Balsamic, overlapped the significance level line and were ordered according to the perception of the tasters. The highest maximum dominance rate was recorded by the attribute Astringency (DR max 41.67%) at 14.5 s of the evaluation, followed by Fruity attributes (DR max 37.88%) at 33.2s, Spices (DR max 37.37%) at 42 s, Balsamic (DR max 29.42%) at 54.7 s, Acidity (DR max 27.78%) at 13.5 s, and Floral (DR max 25%) at 48.5 s. The Acidity attribute was the one that printed the longest time interval of the maximum dominance rate (T 90% max) with a duration of 6.8s (Table 8).
In the olfactory evaluation of wines from the Douro Superior sub-region, according to the interpretation of the TDS curves (Figure 3), the attributes: Floral, Ripe Fruit, Balsamic, Spices, and Empyreumatic, overlapped the line of significance level and were ordered according to the perception of the tasters. The highest maximum dominance rate was obtained by the attribute Ripe fruit (DR max 47.22%) at 8.5 s of the evaluation, successively by Floral (DR max 40.15%) at 21 s, Balsamic (DR max 34.85%) at 25.6 s, Spices (DR max 33.33%) at 31.5 s, and Empyreumatic (DR max 30.56%) at 36.5 s. The same was expressed with the longest time interval of the dominance rate (T 90% max) with a duration of 16.5 s. Regarding taste/flavor evaluation, the attributes of Astringency, Fruity, Heat, Acidity, Floral, Spices, and Balsamic, overlapped the significance level line and were ordered according to the tasters’ perception. The highest maximum dominance rate was recorded by the Fruity attribute (DR max 40.91%) at 31 s of the evaluation, followed by the attributes Spices (DR max 38.89%) at 47.5 s, Astringency (DR max 36.11%) at 7.5 s, Acidity (DR max 36.11%) at 20.5 s Floral (DR max 35.10%) at 4.2 s, Balsamic (DR max 34.97%) at 54.3 s, and Heat (DR max 29.34%) at 10.3 s. The Astringency attribute was the one that recorded the longest time interval of the maximum dominance rate (T 90% max) with a duration of 7.9 s (Table 8).

3.4. MANOVA Applied to TDS Data

To evaluate whether the sub-region had a statistically significant effect on the quantitative parameters (DR max, T max, and T 90% max), and concerning the olfactory characteristics, a MANOVA was performed for each of the attributes. The results obtained (Table 9) revealed statistically significant differences for the attributes Fresh fruitWilks = 0.389, F(6, 26) = 2.618, p = 0.04) and Ripe fruitWilks = 0.344, F(6, 26) = 3.054, p = 0.021). Regarding the Fresh fruit attribute, ANOVA revealed statistically significant differences for the DR max (F(2, 15) = 9.064, p = 0.02) and T max (F(2, 15) = 5.613, p = 0.015) parameters. Tukey’s post-hoc tests indicated significant differences for the DR max parameter between the Baixo Corgo and Cima Corgo sub-regions (p = 0.011) and Baixo Corgo and Douro Superior (p = 0.002). As for the T max parameter, the significant differences are between the Baixo Corgo and Douro Superior sub-regions (p = 0.017). Regarding the Mature Fruit attribute, ANOVA indicated statistically significant differences only for the T max parameter (F(2, 15) =9.219, p = 0.002). Tukey’s post-hoc tests indicated that these differences occur between the sub-regions Baixo Corgo and Cima Corgo (p = 0.004) and Baixo Corgo and Douro Superior (p = 0.008).
Concerning the gustatory analysis (taste/flavor), a MANOVA was also performed for each of the attributes. The results obtained (Table 10) indicate significant statistical differences for the Floral retro-nasal attribute (λWilks = 0.363, F(6, 26) = 2.861, p = 0.028). The univariate variance analysis revealed statistically significant differences for the DR max parameter (F(2, 15) = 4.565, p = 0.028). The Tukey post-hoc test indicated significant differences between the Baixo Corgo and Douro Superior sub-regions (p = 0.025).

4. Discussion

4.1. QDA® of the Wines Sensory Profile

In the olfactory profile, the aromatic attributes, Floral, Fruity, Balsamic, Spices, and Empyreumatic obtained a higher citation frequency rate both for PP1 and PP2 (Figure 2) in the evaluation of the wines of the three sub-regions. Except for Empyreumatic, which may be due to aromas related to the stage of wines in wooden containers, as well as furfurylthiol, a compound associated with the aroma of coffee [35], all other attributes have been already described by Böhm [22] and Almeida [23] in wines from Touriga Franca, Touriga Nacional, and Tinta Roriz grape varieties.
The SEM model (Figure 2), a statistical technique that proved to be valid and robust in the treatment of sensory data [20,36], was the technique of choice for our work. The model showed that, in the 2nd order factor analysis (Figure 2), the attributes Aromatic Intensity and Aromatic Persistence also contribute, in a representative way, to the sensory profile character of the wines of the three sub-regions, and converge between the PP1 and PP2 panels. Moreover, regarding the olfactory examination, for PP2, the Type of Fruit perception presented itself as Fresh, with a strong tendency towards Ripe only in the sub-region Baixo Corgo. In the other sub-regions, the attribute was registered as Ripe for both panels. Additionally, the descriptors mentioned could be placed on the bottle label, helping the consumers in the choice of the wine when purchasing.
Regarding the taste/flavor profile, it should be reported that, in the SEM 2nd order factor analysis, the taste/flavor attributes were the ones that presented the highest weight in all models.
The use of Factor Analysis (FA) allowed for verifying the homogeneity of the two panels. All tasters present high factor weights, which indicates a similar behavior. For the panel of trained tasters (PP1), the factor explains 89.716% of the total variance, while 92.163% is the percentage for specialists (PP2). In addition, the communality value for each of the tasters is high, indicating that the component is suitable for describing the latent factorial structure among the tasters. In other words, both panels were able to characterize the wines with a high level of objectivity.

4.2. TDS Curves and Wines Subregions Discrimination

The TDS technique consists of identifying and rating sensations perceived as dominant repeatedly until the perception end. It is important to note that the discussion of the results obtained is based on the results of the attributes that emerged above the significance level, both in the olfactory and taste/flavor evaluation. Pineau et al. [33] and Meillon et al. [34] studied the simultaneous evolution of several attributes over time and integrated the different perceptions into the temporal dominance of sensations (TDS) method, proving that, indeed, this method can be used to describe the temporality of wine sensations, and is an adequate methodology to identify wine quality descriptors.
In the olfactory evaluation, it was noticed that equally, for the three sub-regions of the DDR, the Floral, Fruity, and Balsamic attributes were expressed in the first part of the evaluations (Figure 3). As it was mentioned before, these attributes are described by Rogerson et al. [5], Böhm [22], and Almeida [23] as characteristics in the wines made from Touriga Franca, Touriga Nacional, and Tinta Roriz grape varieties. These grape varieties make part of the blend of the wines evaluated. Spices and Empyreumatic were expressed in the second part of the evaluations, according to the time of the maximum dominance rate (T max) of each attribute and can be related to aromas obtained after the wine stage in wooden containers [37,38]. Floral and the attributes related to the “type of fruit” stood out as the first two aromatic notes perceived by the tasters in the evaluations. Floral was revealed as an “attack note” in the wines of Baixo Corgo and Ripe fruit in the wines of Cima Corgo and Douro Superior sub-region.
Regarding the characterization of the “type of fruit”, in the Baixo Corgo sub-region, the attribute Fresh fruit with 40.54% of the evaluations was the one that recorded the highest maximum dominance rate. The Tukey Post-hoc tests indicated significant differences for this parameter between the sub-regions Baixo Corgo and Cima Corgo (p = 0.011), Baixo Corgo and Douro Superior (p = 0.002). However, in Cima Corgo and Douro Superior, it was the Ripe Fruit attribute that obtained the highest DR max, respectively, with 48.86% and 47.22% of the evaluations.
The Spices attribute obtained the longest time interval of the maximum dominance rate (T 90% max 20.15 s) in the evaluation of Baixo Corgo, while Ripe Fruit with 4.8 s in Cima Corgo and Empyreumatic with 16.5 s in the Douro Superior.
Regarding the taste/flavor evaluation, parity was shown between the sub-regions regarding the attributes Astringency and Acidity, being the first two to be identified and recorded in the first part of the tasting. Being that astringency is a highly relevant and dynamic attribute of wine quality, the TDS method is a sensory tool that can be applied to evaluate astringency over time [39]. Nevertheless, our results are divergent from what was obtained by the authors Etaio et al. [40] in their study to sensorily describe the red wines of the Rioja Alavesa region (the Spain Douro Region), where they report the same attributes as dominant, but, in the second moment of the evaluations.
Baixo Corgo wines recorded the highest maximum dominance rate (54.29%) for the attribute Astringency, followed by Cima Corgo (24.67%) and Douro Superior (36.11%). According to Meillon et al. [41], the decrease in alcohol concentration increases the domain of astringency. However, for Chacón-Vozmediano and co-authors [42], the quality of polyphenols, which confer the characteristic of astringency of wines, is associated with the degree of maturation and water feeding of grapevines. Excess water results in coarse polyphenols. That said, we highlight the correlation between the results indicated, the rainfall index, and the incidence of solar radiation in each sub-region (Table 1, in the introduction). Baixo Corgo also presented the highest DR max (50%) in the Acidity attribute. However, the attribute Heat (DR max 29.34%), related to alcohol perception, was pointed only in Douro Superior, which follows Jones [43] and Jones et al. [44]. The mentioned author states that the climate highly influences the characteristics of wines; wines from regions with a fresh climate present with pungent acidity, while alcohol is shown from high to very high for wines from hot and very hot regions. Vierra [45] also describes examples of the climatic relationship between the rise of alcohol, the decrease in acids, and the rise of pH in wines in his research.
The attributes, Fruity, Spices, and Balsamic, were recorded in the second part of the evaluations, contrary to the results obtained by the authors Medel-Marabolí et al. [15], in wines from Carmenère, Malbec, and Sangiovese grape varieties, where the Fruity aroma was recorded for the first time around initial 10 s of the evaluation. Fruity presented higher evidence (DR max) in Douro Superior with 40.91% of the evaluations.
The attribute Floral, with a 35.10% of maximum dominance rate, presented significant differences between the Baixo Corgo and Douro Superior sub-regions (p = 0.025).
Balsamic with 16.9 s in Baixo Corgo, Acidity with 6.8 s in Cima Corgo, and Astringency with 7.9 s in the Douro Superior, were the attributes that recorded the longest time interval of the maximum dominance rate (T 90% max).

5. Conclusions

The use of quantitative descriptive analysis and temporal dominance of sensations methods proved to be efficient in the wine’s sensory profile characterization. The QDA® method, as described by other authors, was completed and detailed regarding the classification of attributes; thus, it is understood as an assertive choice for the same selection of attributes used in the TDS. Regarding the time required for the application of each of the methods, from training to the duration of each session, the TDS method proved to be much more efficient. TDS is a fast method that is easy to apply and has excellent results in the evaluation of the olfactory and taste/flavor profile of wines; however, it presents some limitations: (i) it restricts the evaluation of the wine’s visual characteristics and (ii) it is only focused on dominant sensations; thus, it is not possible to obtain information on all product attributes.
The wines of the three sub-regions have profiles with characteristics very similar in, olfactory, and taste/flavor aspects, pointing out a huge relation between the characteristics of the three sub-regions, Baixo Corgo, Cima Corgo, and Douro Superior, and the grape varieties Touriga Franca, Touriga Nacional, and Tinta Roriz. We can say that, globally, the olfactory profile of wines is characterized by Fruity, Floral, and Balsamic aromatic notes, while the taste/flavor profile stands out, highlighting Astringency and Acidity and again Fruity as the main in-mouth aroma. The descriptors mentioned could be a guide for consumers. When placed on the bottle label, it can help the consumers in their choice of wine when purchasing.
Regarding the behavior of the panelists, by the QDA® method, it was noticed that, when compared to those trained, the specialists (experts) expressed more detailed results in the classification of qualitative attributes, such as Type of Fruit. Factor Analysis (FA) indicated homogeneity of the panels. For trained tasters, the factor explains 89.716% and, for the specialists, 92.163% of the total variance of data. The value of individual communality is high, revealing that the component is adequate to describe the latent factorial structure among the tasters. For all the sub-regions, the structural equation modeling (SEM) evidenced good adequacy.
Concerning the TDS, the expert tasters were at ease in carrying out the evaluations, both concerning the suggested evaluation protocol and the interface of the data acquisition software, which indicates that the methodology used in the training sessions was efficient. The use of multivariate analysis of variance followed by univariate analysis of variance revealed statistically significant differences, this being more relevant for the DR max parameter and higher maximum dominance rate.
Concerning a future perspective, the present work paves the way for new approaches that can contribute to the improvement and complement the study of the sensory profile of commercial wines through the methodologies used. As an example, we propose the highest number of samples aiming at increasing the relevance of results and integrating methods in the search for a rapid, detailed, less expensive, and at the same time, assertive evaluation. With a larger set of samples, it would be possible to obtain characteristic TDS curves for each Douro sub-region, providing a fingerprint for the wine that could be used for authentication and traceability purposes.

Supplementary Materials

The following supporting information can be downloaded at: https://www.mdpi.com/article/10.3390/foods11081168/s1, Table S1: List of descriptors used for the sensory profile of DOC Douro red wines.

Author Contributions

Conceptualization, E.C. and A.V.; methodology, E.C. and A.V.; software, E.A.; formal analysis, E.C., E.A. and A.V.; investigation, E.C., E.A. and A.V.; writing—original draft preparation, E.A.; writing—review and editing, E.C. and A.V.; supervision, A.V. All authors have read and agreed to the published version of the manuscript.

Funding

This research was funded by National Funds FCT Portuguese Foundation for Science and Technology—Portugal and COMPETE under the projects UIDB/00616/2020, UIDP/00616/2020, and UIDB/04621/2020 and UIDP/04621/2020 of CEMAT/IST-ID; and by the e-Flavor Project, operation POCI-01-0247-FEDER-049337 financed by the FEEI, under the Competitiveness and Internationalization Operational Program.

Institutional Review Board Statement

Not applicable.

Informed Consent Statement

Informed consent was obtained from all subjects involved in the study.

Data Availability Statement

Data is contained within the article or Supplementary Material.

Acknowledgments

The authors would like to thank the Chemistry Center (CQ-VR) and the Center for Computational and Stochastic Mathematics (CEMAT), for their financial support. The authors also like to acknowledge the tasting panels that participated in the work (PP1—Ana Catarina Almeida, Ana Marta Vieira, André Alves, Diogo Pinto Martins, Eduarda Santos Lopes, Gonçalo das Neves Diniz, Joana Monteiro, Maria Araújo Rodrigues, Roberta Banchieri Ortolan, Rui Baltasar Barbosa, Sara Marques Gomes and Tiago Alexandre Tavares; PP2—Fábio Giroto Maravilha, José Diogo de Carvalho, Luís Filipe Rebelo, Maria Gabriela Freitas, Roberta Banchieri Ortolan and Sara Marques Gomes) and the companies that supplied the wines (Quinta do Crasto, Quinta dos Murças, Quinta Dona Doroteia, Quinta Alta, Esmero Sociedade de Vinhos, Aneto Wines, Quinta da Barca, Mãos & Irmãos—R4, Quinta do Côtto, Quinta Seara d’Ordens, Quinta do Roncão, Negreiros Wines, Quinta Maritávora, Quinta da Sequeira and Quinta da Cuca).

Conflicts of Interest

The authors declare no conflict of interest.

References

  1. van Leeuwen, C.; Roby, J.-P.; de Rességuier, L. Soil-related terroir factors: A review. OENO One 2018, 52, 173–188. [Google Scholar] [CrossRef] [Green Version]
  2. Pearson, W.; Schmidtke, L.M.; Francis, I.L.; Carr, B.T.; Blackman, J.W. Characterising inter-and intra-regional variation in sensory profiles of Australian Shiraz wines from six regions. Aust. J. Grape Wine Res. 2020, 26, 372–384. [Google Scholar] [CrossRef]
  3. Instituto da Vinha e do Vinho (IVDP). I.P. Estatística. 2019. Available online: https://www.ivdp.pt/consumidor/estatistica (accessed on 30 May 2020).
  4. Magalhães, N.P. Caracterização e condução de castas tintas na região demarcada do Douro. Douro—Estudos e Documentos 2003, 7, 163–174. [Google Scholar]
  5. Rogerson, F.S.S.; Castro, H.; Fortunato, N.; Azevedo, Z.; Macedo, A.; De Freitas, V.A.P. Chemicals with Sweet Aroma Descriptors Found in Portuguese Wines from the Douro Region:  2,6,6-Trimethylcyclohex-2-ene-1,4-dione and Diacetyl. J. Agric. Food Chem. 2001, 49, 263–269. [Google Scholar] [CrossRef]
  6. Canuti, V.; Cantu, A.; Picchi, M.; Lerno, L.A.; Tanabe, C.K.; Zanoni, B.; Ebeler, S.E. Evaluation of the Intrinsic and Perceived Quality of Sangiovese Wines from California and Italy. Foods 2020, 9, 1088. [Google Scholar] [CrossRef]
  7. Gonzaga, L.S.; Capone, D.L.; Bastian, S.E.; Danner, L.; Jeffery, D.W. Sensory typicity of regional Australian Cabernet Sauvignon wines according to expert evaluations and descriptive analysis. Food Res. Int. 2020, 138, 109760. [Google Scholar] [CrossRef]
  8. Lesschaeve, I. The use of sensory descriptive analysis to gain a better understanding of consumer wine language. In Proceedings of the 3rd International Wine Business and Marketing Research Conference, Montpellier, France, 6–8 July 2006; Unité Mixte de Recherche MOISA, Academy of Wine Business Research: Montpellier, France, 2006. [Google Scholar]
  9. Varela, P.; Ares, G. Sensory profiling, the blurred line between sensory and consumer science. A review of novel methods for product characterization. Food Res. Int. 2012, 48, 893–908. [Google Scholar] [CrossRef]
  10. Guld, Z.; Nyitrainé Sárdy, D.; Gere, A.; Rácz, A. Comparison of sensory evaluation techniques for Hungarian wines. J. Chemom. 2020, 34, e3219. [Google Scholar] [CrossRef] [Green Version]
  11. Lawless, H.T.; Heymann, H. Sensory Evaluation of Food: Principles and Practices; Springer Science & Business Media: New York, NY, USA, 2010. [Google Scholar]
  12. Pineau, N.; Schlich, P. Temporal dominance of sensations (TDS) as a sensory profiling technique. In Rapid Sensory Profiling Techniques; Woodhead Publishing: Cambridge, UK, 2015; pp. 269–306. [Google Scholar]
  13. Kawasaki, H.; Sekizaki, Y.; Hirota, M.; Sekine-Hayakawa, Y.; Nonaka, M. Analysis of binary taste-taste interactions of MSG, lactic acid, and NaCl by temporal dominance of sensations. Food Qual. Prefer. 2016, 52, 1–10. [Google Scholar] [CrossRef]
  14. Lorido, L.; Estévez, M.; Ventanas, S. Fast and Dynamic Descriptive Techniques (Flash Profile, Time-Intensity and Temporal Dominance of Sensations) for Sensory Characterization of Dry-Cured Loins. Meat Sci. 2018, 145, 154–162. [Google Scholar] [CrossRef]
  15. Medel-Marabolí, M.; López-Solís, R.; Valenzuela-Prieto, D.; Vargas-Silva, S.; Obreque-Slier, E. Limited relationship between temporality of the sensory perception and phenolic composition of red wines. LWT 2021, 142, 111028. [Google Scholar] [CrossRef]
  16. Fan, Y.; Chen, J.; Shirkey, G.; John, R.; Wu, S.R.; Park, H.; Shao, C. Applications of structural equation modeling (SEM) in ecological studies: An updated review. Ecol. Process. 2016, 5, 1–12. [Google Scholar] [CrossRef] [Green Version]
  17. Lam, T.Y.; Maguire, D.A. Structural equation modeling: Theory and applications in forest management. Int. J. For. Res. 2012, 16, 263953. [Google Scholar] [CrossRef] [Green Version]
  18. MacCallum, R.C.; Austin, J.T. Applications of structural equation modeling in psychological research. Annu. Rev. Psychol. 2000, 51, 201–226. [Google Scholar] [CrossRef] [PubMed]
  19. Tu, Y.-K.; Wu, Y.-C. Using structural equation modeling for network meta-analysis. BMC Med. Res. Methodol. 2017, 104, 1471–2288. [Google Scholar] [CrossRef] [Green Version]
  20. Vilela, A.; Marques, C.; Correia, E. Structural Equation Modelling (SEM) applied to sensory profile of Vinho Verde monovarietal wines. Food Res. Int. 2018, 111, 650–660. [Google Scholar] [CrossRef]
  21. Marôco, J. Análise de Equações Estruturais: Fundamentos Teóricos, Software & Aplicações; ReportNumber Lda: Pêro-Pinheiro, Portugal, 2014. [Google Scholar]
  22. Böhm, J. O Grande Livro das Castas: Portugal Vitícola; Chaves Ferreira Publicações: Lisboa, Portugal, 2007. [Google Scholar]
  23. Almeida, J.N. Enciclopédia Vinhos de Portugal. O Vinho do Porto/Vinhos do Douro. In As Castas do Douro; Chaves Ferreira Publicações: Lisboa, Portugal, 1998. [Google Scholar]
  24. Stone, H.; Sidel, J.L. Sensory Evaluation Practices, 3rd ed.; Wiley-Blackwell: Oxford, UK, 2004. [Google Scholar]
  25. WSET Level 3 Systematic Approach to Tasting Wine® (Version 2, 2016). Available online: https://www.wsetglobal.com/media/3119/wset_l3_wines_sat_en_jun-2016.pdf (accessed on 20 May 2019).
  26. WSET Level 4 Systematic Approach to Tasting Wine® (Issue 1, 2019). Available online: https://www.wsetglobal.com/media/7071/wset_l4wines_sat_en_may2019.pdf (accessed on 20 May 2019).
  27. Monteiro, B.; Vilela, A.; Correia, E. Sensory profile of pink port wines: Development of a flavour lexicon. Flavour Fragr. J. 2014, 29, 50–58. [Google Scholar] [CrossRef]
  28. ABNT NBR ISO 8586. Análise Sensorial—Guia Geral Para a Seleção, Treinamento e Monitoramento de Avaliadores Selecionados e de Especialistas ou Experts. 2016. Available online: https://www.target.com.br/produtos/normas-tecnicas/43936/nbriso8586-analise-sensorial-guia-geral-para-a-selecao-treinamento-e-monitoramento-de-avaliadores-selecionados-e-de-especialistas-ou-experts (accessed on 20 May 2019).
  29. ISO 8589; Sensory Analysis—General Guidance for the Design of Test Rooms; ISO/TC 34/SC 12 Sensory Analysis. International Organization for Standardization: Geneva, Switzerland, 2007.
  30. ISO 3591; Sensory Analysis—Apparatus—Wine-Tasting Glass; ISO/TC 34/SC 12 Sensory Analysis. International Organization for Standardization: Geneva, Switzerland, 1977.
  31. Pessina, R. Temporal Dominance of Taste and Flavour of Wine. Ph.D. Thesis, ENSBANA, Dijon/Università Degli Studi, Foggia, Italy, 2006. Available online: http://www.sudoc.fr/109217985 (accessed on 20 May 2019).
  32. Hair, J.; Anderson, R.E.; Tatham, R.L.; Black, W. Multivariate Data Analysis: A Global Perspective, 7th ed.; Upper Saddle River: Prentice-Hall, NJ, USA, 2009. [Google Scholar]
  33. Pineau, N.; Schlich, P.; Cordelle, S.; Mathonnière, C.; Issanchou, A.; Imbert, A.; Rogeaux, M.; Etiévant, P.; Köster, E. Temporal dominance of sensations: Construction of the TDS curves and comparison with time-intensity. Food Qual. Prefer. 2009, 20, 450–455. [Google Scholar] [CrossRef]
  34. Meillon, S.; Urbano, C.; Schlich, P. Contribution of the Temporal Dominance of Sensations (TDS) method to the sensory description of subtle differences in partially dealcoholized red wines. Food Qual. Prefer. 2009, 20, 490–499. [Google Scholar] [CrossRef]
  35. González, V. La base química del aroma del vino: Un viaje analítico desde las moléculas hasta las sensaciones olfato-gustativas. Rev. De La Real Acad. De Cienc. 2007, 62, 7–36. [Google Scholar]
  36. Ketkaew, C.; Wongthahan, P.; Sae-Eaw, A. How sauce color affects consumer emotional response and purchase intention: A structural equation modeling approach for sensory analysis. Br. Food J. 2021, 123, 2152–2169. [Google Scholar] [CrossRef]
  37. Canas, S. Phenolic composition and related properties of aged wine spirits: Influence of barrel characteristics. A review. Beverages 2017, 3, 55. [Google Scholar] [CrossRef] [Green Version]
  38. Freitas, V.A.P.; Fernandes, A.; Oliveira, J.; Teixeira, N.; Mateus, N. A review of the current knowledge of red wine colour. OENO One 2017, 51, 1–15. [Google Scholar] [CrossRef]
  39. Medel-Marabolí, M.; Romero, J.L.; Obreque-Slier, E.; Contreras, A.; Peña-Neira, A. Effect of a commercial tannin on the sensorial temporality of astringency. Food Res. Int. 2017, 102, 341–347. [Google Scholar] [CrossRef]
  40. Etaio, I.; Meillon, S.; Pérez-Elortondo, F.J.; Schlich, P. Dynamic sensory description of Rioja Alavesa red wines made by different winemaking practices by using Temporal Dominance of Sensations. J. Sci. Food Agric. 2016, 96, 3492–3499. [Google Scholar] [CrossRef] [Green Version]
  41. Meillon, S.; Viala, D.; Medel, M.; Urbano, C.; Guillot, G.; Schlich, P. Impact of partial alcohol reduction in Syrah wine on perceived complexity and temporality of sensations and link with preference. Food Qual. Prefer. 2010, 21, 732–740. [Google Scholar] [CrossRef]
  42. Chacón-Vozmediano, J.L.; Martínez-Gascueña, J.; García-Romero, E.; Gómez-Alonso, S.; García-Navarro, F.J.; Jiménez-Ballesta, R. Effects of Water Stress on the Phenolic Compounds of ‘Merlot’ Grapes in a Semi-Arid Mediterranean Climate. Horticulturae 2021, 7, 161. [Google Scholar] [CrossRef]
  43. Jones, G.V. Climate change and the global wine industry. In Proceedings of the 13th Australian Wine Industry Technical Conference, Adelaide, Australia, 28 June–2 August 2007. [Google Scholar]
  44. Jones, G.V.; Reid, R.; Vilks, A. Climate, grapes, and wine: Structure and suitability in a variable and changing climate. In The Geography of Wine; Springer: Dordrecht, The Netherlands, 2012; pp. 109–133. [Google Scholar]
  45. Vierra, G. Pretenders at the table: Are table wines no longer food-friendly? Wine Bus. Mon. 2004, 11, 1–7. [Google Scholar]
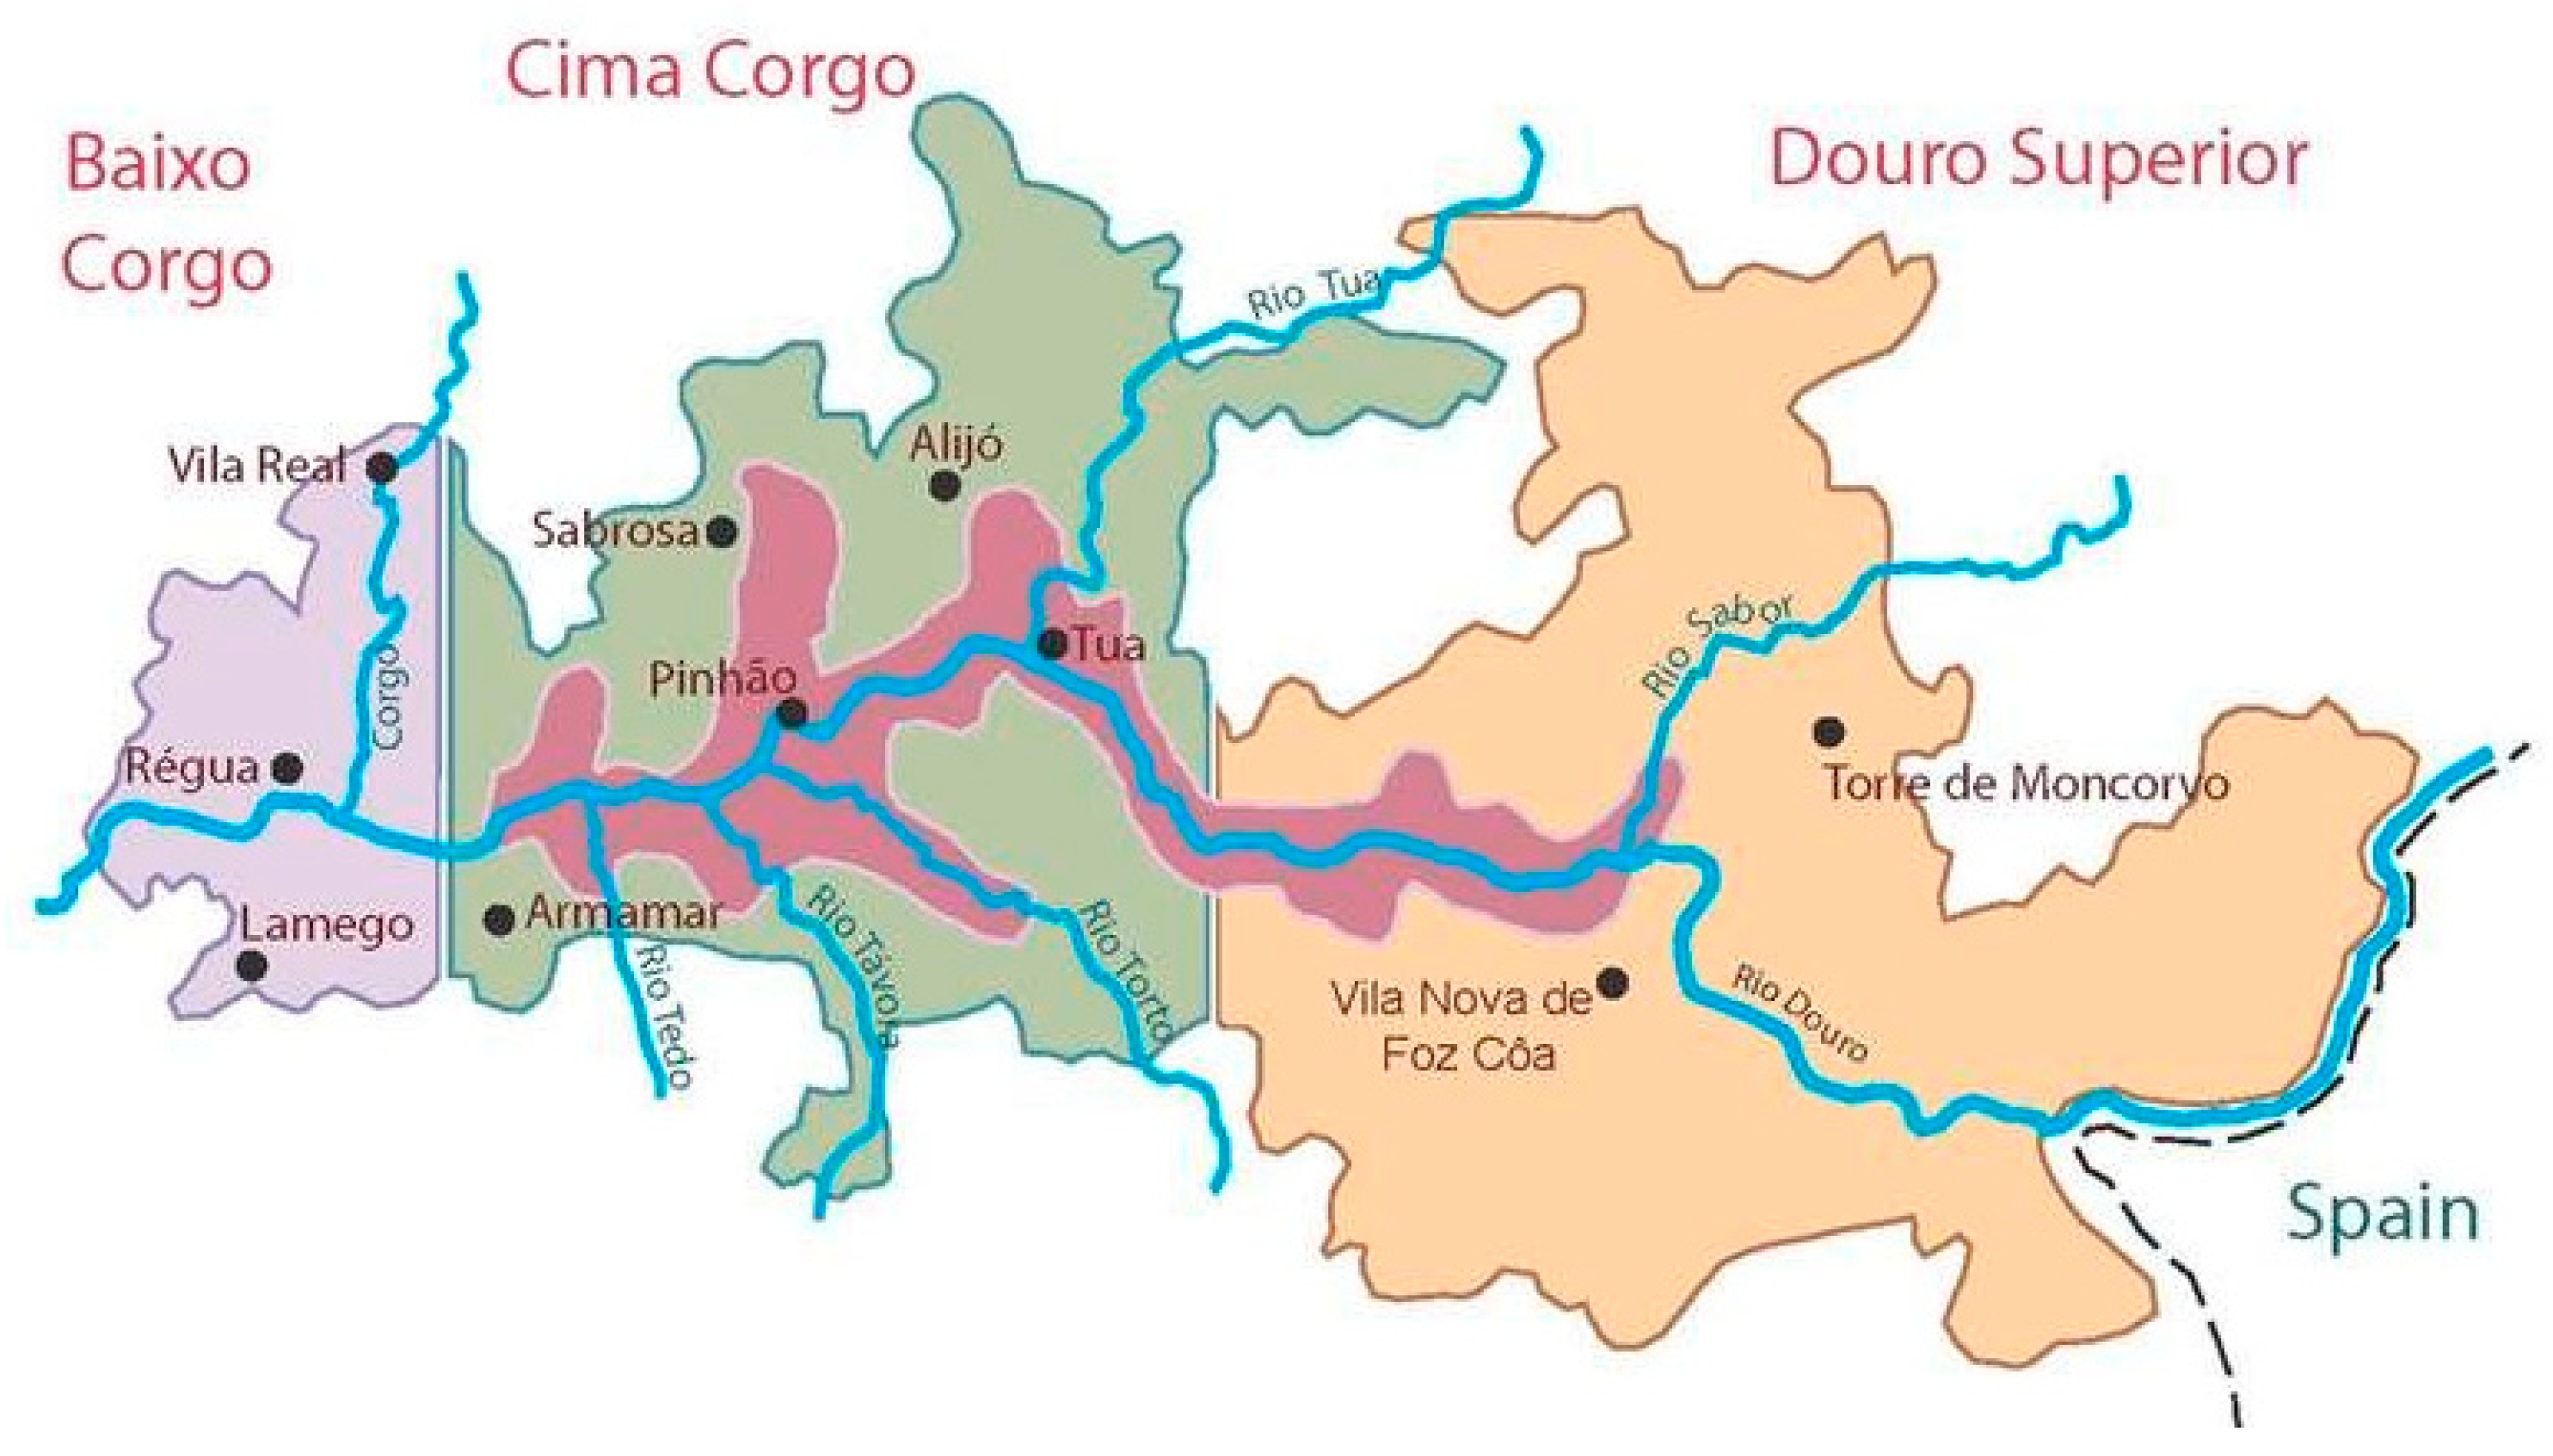
Figure 1. Sub-regions of the Demarcated Douro Region, Portugal.
Foods 11 01168 g001
Figure 2. SEM schematic representation, standardized coefficients, and the individual reliability of each of the items in the final second-order model for the sensory profile of the wines of each of the three DDR sub-regions, for both tasting panels, PP1 and PP2.
Foods 11 01168 g002
Figure 3. TDS curves of olfactory and gustatory attributes of the wines evaluated by the PP2 tasting panel. For each attribute, a colored line is presented in each graphic.
Foods 11 01168 g003aFoods 11 01168 g003b
Table 1. Climatic characteristics of the DDR (Demarcated Douro Region) sub-regions. Adapted from Magalhães [4].
Sub-RegiãoAltitude (m) 1 Lowest Quota IV IX t a
(Day) 2
R (mm) 3Climate Classification
Baixo-Corgo1001.776949Humid
Cima-Corgo1301.926672Dry sub-humid
Douro Superior1502.241407semi-arid
1 Altitude in meters; 2 Incidence of annual solar radiation in hours; 3 Average annual rainfall in millimeters.
Table 2. List of wines used in the application of the QDA® and TDS methodologies.
Sub-RegionSCTSSCDPProduction YearGrapesAged in OakABV
(% Vol.)
Total Acidity
(g/L)
pHResidual Sugar
(g/L)
Baixo Corgo249BC012015TN, TR, TC, TFNI145.33.56NI
124BC022015TN, TF, TRFob; 12 months145.43.650.6
704BC032015TF, TR, TNFob, Aob; 06 months144.83.670.7
680BC042015TF, TR, TA, AB, TFe, TNFob, 18 months145.83.560.7
106BC052016TN, TF, S, TC, TRpartial; Fob, Pob;
12 months
13.55.33.750.6
684BC062016TN, TR, TF, OVNI14NININI
Cima Corgo251CC012015TF, TN, TRFob; 12 months1453.72
526CC022015TF, TN, TR, TCFob; 12 months144.83.71.5
713CC032016TN, TF, TRFob; 09 months155.343.730.6
860CC042017TF, TN, TRpartial (65%); Fob, Aob; 14 months145.23.620.6
506CC052017TN, TF, TR, TBpartial (15%); Fob; 06 months144.93.731.8
735CC062017TF, TN, TR, TC, TFraConcrete tanks; Fob; 09 months13.55.53.680.6
Douro Superior497DS012015TN, TF, TRpartial (50%); Fob; 12 months1453.410.6
951DS022016TN, TF, TR, TB, TCpartial; Fob;
10 months
145.43.75NI
895DS032016TN, TF, TR, TBFob; 10 months145.23.650.6
593DS042016TR, TF, TN, OVFob; 12 months13.573.730.6
682DS052016TN, TF, TRpartial; Aob;
06 months
145.33.70.7
849DS062017TN, TF, TR, TA, TBFob; 12 months144.13.662.2
SCTS—Sample code in test sessions; SCDP—Sample code in data processing; BC—Baixo Corgo; CC—Cima Corgo; DS—Douro Superior; ABV (% vol.)—Alcoholic strength by volume; pH—Hydrogen potential; Total Acidity—expressed in g/L of tartaric acid; Residual sugar—sugar content, expressed in g/L of glucose + fructose; TF—Touriga Franca; TN—Touriga Nacional; TFe—Touriga Fêmea; TR—Tinta Roriz; TC—Tinto Cão; TA—Tinta Amarela; TB—Tinta Barroca; TFra—Tinta Francisca; AB—Alicante Bouschet; S—Sousão; OV—Old Vines; ob—Oak barrels; Pob—Portuguese oak barrel; Fob—French oak barrel; Aob –American oak barrel; partial—when the wine batch has not been fully staged in wooden containers; NI—no information.
Table 3. List of attributes designated for application of the TDS methodology.
Olfactory Analysis (OA)Taste/Flavor Analysis (TA)
BalsamicAcidity
EmpireumaticAstringency
SpicesBitterness
FloralBalsamic
Fresh fruitHeat
Ripe fruitSpices
Fruit in jamFloral
Dried fruitFruity
Table 4. Diagram of the content explained in the training sessions for the application of the QDA® and TDS methods.
Training SessionQDA®TDS
Session 01Presentation of the research;
Sensory tasting sheet to adapt to attributes and use of the tasting sheet
Introduction to the TDS method and its application;
Presentation of data acquisition software;
Familiarization test with the user interface of the data acquisition software, according to the print of the screens
Training of the TDS Evaluation Protocol (OA, TA) (Table 5) with two samples of random red wines.
Session 02Stimulation of olfactory perception through containers containing spices, fresh and dried fruits, and essences; Second sensory test to adapt to attributes and use of the tasting sheet
Stimulation of olfactory perception through containers with spices, fresh and dried fruits, and essences;
Training of the TDS evaluation protocol with two samples of random red wines.
Session 03Explanation of doubts;
Stimulation of gustatory perception by tasting samples of adulterated wines reinforcing the understanding of attributes such as heat (sensation caused by alcohol), sweetness, acidity, bitterness, astringency, and mouth volume;
Third sensory test to adapt to attributes and use of the tasting sheet
Clarification of doubts;
Stimulation of gustatory perception by tasting samples of adulterated wines reinforcing the understanding of attributes such as heat (sensation caused by alcohol), sweetness, acidity, bitterness, astringency, and mouth volume;
Third training of the TDS evaluation protocol with two samples of random red wines.
Table 5. TDS assessment protocol. Adapted from Pessina [31].
TDS Olfactory Assessment Protocol (OA)TDS Taste/Flavor Assessment Protocol (TA)
StageTime (s)InstructionsStageTime (s)Instructions
1-Remove the lid from the cup and hold it with your left hand.1-Remove the lid from the cup and hold it with your left hand.
2−5’With the right hand start the evaluation by clicking the cursor in Start and shake the cup clockwise for 4’. If you have difficulty shaking the glass, use the table as a support base.2−5’With the right hand start the evaluation by clicking with the cursor in Start; bring the wine to the mouth and make it evenly distributed, then discard. Do not evaluate this first contact with the wine.
30’Smell the glass continuously for 8’ and at the same time click on one of the listed attributes that correspond to the most dominant at the moment. Click on a new attribute whenever you feel dominance change.30’Take the wine to the mouth and keep it for 4’; have it distributed evenly and at the same time click on one of the listed attributes that match the most dominant at the moment. Click on a new attribute whenever you feel dominance change. Wine can be swallowed or discarded.
4from 9’ to 11’Distance the cup from the nose; inhale and exhale for 2’; then re-smell the cup to continue the assignment of dominance by 7’.4from 5’ to 14’Continue the evaluation and attribution of the dominant sensations by 9′.
5from 18’ to 22’Shake the glass clockwise for 4’. Then re-smell the glass to continue the assignment of dominance by 7’.5from 15’ to 19’Repeat Step 3.
6from 29’ to 31’Repeat Step 4.6from 20’ to 29’Repeat Step 4.
7from 38’ to 42’Shake the glass clockwise for 4’. Then re-smell the cup to continue the assignment of dominance by 6’.7from 30’ to 34’Repeat Step 3.
8from 48’ to 52’Distance the cup from the nose; inhale and exhale for 2’; then re-smell the cup to continue the assignment of dominance by 8’.8from 35’ to 44’Repeat Step 4.
960’End of evaluation.9from 45’ to 49’Repeat Step 3.
10from 50’ to 59’Repeat Step 4.
1160’End of evaluation.
Table 6. Component loadings, communalities, eigenvalue, and explained variance for PP1.
TastersComponent LoadingsCommunalities
Taster 10.9360.875
Taster 20.9400.884
Taster 30.9100.829
Taster 40.9150.837
Taster 50.9750.950
Taster 60.9600.921
Taster 70.9500.902
Taster 80.9530.909
Taster 90,9430.889
Taster 100.9380.880
Taster 110.9310.866
Taster 120.9540.911
Eigenvalue10.766
Explained variance89.716%
Table 7. Component loadings, communalities, eigenvalue and explained variance for PP2.
TastersComponent LoadingsCommunalities
Taster 10.9290.862
Taster 20.9740.949
Taster 30.9440.890
Taster 40.9690.940
Taster 50.9720.945
Taster 60.9720.944
Eigenvalue5.530
Explained variance92.163%
Table 8. Quantitative parameters of the TDS curves—Olfactory and taste/flavor analysis of the wines from the three sub-regions of the DDR. s—time in seconds.
Quantitative Parameters of TDS Curves
Olfactory Analysis
FloralSpicesBalsamicEmpyreumaticFresh fruitRipe fruitFruit in jamDried fruit
Baixo CorgoDR max46.09%37.88%32.58%27.02%40.45%27.78%2.78%0%
T max8.7 s44.8 s28 s55 s14.3 s58.5 s7.5 s0 s
T 90% max3.5 s20.1 s2.1 s20 s2.4 s2.9 s37.8 s0 s
Cima CorgoDR max38.95%37.75%32.32%37.88%11.11%48.86%5.56%0%
T max16.9 s50.3 s27.2 s53.2 s24.5 s8.3 s11.5 s0 s
T 90% max4.8 s2.2 s1.8 s4 s1.4 s2.8 s4.2 s0 s
Douro
Superior
DR max40.15%33.33%34.85%30.56%7.58%47.22%19.44%0%
T max21 s31.5 s25.6 s36.5 s9 s8.5 s39.5 s0 s
T 90% max9 s3.5 s3.6 s16.5 s1 s5.1 s3.3 s0 s
Taste/flavor analysis
AstringencyAcidityHeatBitternessSpicesFruityFloralBalsamic
Baixo CorgoDR max54.29%50%21.46%25%35.10%38.13%11.11%27.78%
T max10.6 s21.5 s31 s26.5 s50.2 s49 s34.5 s59.6 s
T 90% max3.8 s4 s3.6 s3.8 s2.8 s4.5 s7.4 s16.9 s
Cima CorgoDR max41.67%27.78%16.67%19.44%37.37%37.88%25.00%29.42%
T max14.5 s13.5 s45.5 s56.5 s42 s33.2 s48.5 s54.7 s
T 90% max4.4 s6.8 s5.2 s4 s2 s4.1 s3.8 s2.4 s
Douro
Superior
DR max36.11%36.11%29.34%20.40%38.89%40.91%35.10%34.97%
T max7.5s20.5 s10.3 s55.9s47.5 s31 s41.2 s54.3 s
T 90% max7.9 s2.6 s1.4 s4.7 s3 s3.6 s2.5 s1.8 s
Table 9. Mean (M), standard deviation (SD), and multivariate significance of the TDS parameters—Olfactory analysis.
AttributesBaixo CorgoCima CorgoDouro Superiorp
M ± SDM ± SDM ± SD
FloralDR max0.647 ± 0.090.72 ± 0.1580.667 ± 0.183
T max20.500 ± 20.72626.750 ± 13.84221.667 ± 9.7040.688
T90% max3.583 ± 3.9322.733 ± 3.27011.350 ± 14.967
SpicesDR max0.594 ± 0.1760.611 ± 0.090.500 ± 0.182
T max30.133 ± 14.26139.850 ± 18.22828.000 ± 13.8820.267
T90% max6.817 ± 9.66812.483 ± 17.46716.400 ± 20.025
BalsamicDR max0.528 ± 0.1640.576 ± 0.1460.492 ±0.107
T max31.017 ± 19.70430.500 ± 15.61140.583 ± 15.7000.660
T90% max13.517 ± 18.0925.250 ± 7.9697.800 ± 12.495
EmpyreumaticDR max0.417 ± 0.1390.558 ± 0.1190.576 ± 0.085
T max39.017 ± 15.59247.950 ± 12.29444.767 ± 11.4000.323
T90% max14.417 ± 12.0274.200 ± 5.5513.950 ± 2.421
Fresh FruitDR max0.528 ± 0.1250.167 ± 0.2580.083 ± 0.139
T max18.167 ± 9.0486.000 ± 10.1643.000 ± 4.6580.040
T90% max10.800 ± 17.4781.067 ± 1.7288.333 ± 15.726
Ripe FruitDR max0.361 ± 0.1250.631 ± 0.2760.545 ± 0.197
T max46.533 ± 18.47812.083 ± 7.82615.383 ± 17.4010.021
T90% max15.600 ± 18.74620.100 ± 20.71821.467 ± 23.627
Fruit in jamDR max0.056 ± 0.0860.083 ± 0.1390.250 ± 0.139
T max4.333 ± 7.56011.850 ± 23.84027.083 ± 15.2720.147
T90% max7.600 ± 15.1201.517 ± 2.3607.033 ± 3.690
Table 10. Mean (M), standard deviation (SD), and multivariate significance of the TDS parameters—Taste/flavor analysis.
AttributesBaixo CorgoCima CorgoDouro Superiorp
M ± SDM ± SDM ± SD
AstringencyDR max0.768 ± 0.160.667 ± 0.1820.661 ± 0.177
T max14.050 ± 4.41512.000 ± 4.18316.833 ± 10.0730.700
T90% max2.717 ± 1.3923.467 ± 2.0625.217 ± 5.206
AcidityDR max0.703 ± 0.1640.513 ± 0.1200.583 ±0.175
T max21.050 ± 5.11214.500 ± 4.88919.333 ± 4.8750.341
T90% max2.200 ± 1.4035.233 ± 7.4114.583 ± 2.126
HeatDR max0.371 ± 0.1690.328 ± 0.1750.447 ± 0.252
T max32.550 ± 18.88324.350 ± 21.20514.950 ± 5.4360.435
T90% max7.750 ± 12.26312.583 ± 15.0738.500 ± 15.590
BitternessDR max0.361 ± 0.2220.250 ± 0.2040.278 ± 0.172
T max27.933 ± 19.07636.367 ± 28.87040.450 ± 24.0900.225
T90% max7.867 ± 5.6082.983 ± 2.3699.533 ± 8.267
SpicesDR max0.528 ± 0.1640.482 ± 0.1380.495 ± 0.236
T max42.517 ± 13.47145.982 ± 10.03348.800 ± 6.8590.790
T90% max10.817 ± 10.6538.167 ± 8.3385.383 ± 7.129
FruityDR max0.649 ± 0.1480.576 ± 0.1000.667 ± 0.105
T max28.033 ± 19.06324.583 ± 10.05226.517 ± 19.2280.458
T90% max2.633 ± 1.6454.767 ± 3.1685.150 ± 3.210
FloralDR max0.278 ± 0.090.444 ± 0.2020.528 ±0.125
T max40.350 ± 13.52539.017 ± 16.11046.683 ± 9.1590.028
T90% max3.517 ± 1.99010.817 ± 14.3524.133 ±1.893
BalsamicDR max0.409 ± 0.1930.406 ± 0.1180.566 ± 0.129
T max53.300 ± 7.76746.817 ± 17.88848.400 ± 12.6230.538
T90% max12.750 ± 18.70716.100 ± 15.6265.383 ± 6.097
Publisher’s Note: MDPI stays neutral with regard to jurisdictional claims in published maps and institutional affiliations.

