
The Improvement of Dispersion Stability and Bioaccessibility of Calcium Carbonate by Solid/Oil/Water (S/O/W) Emulsion

Abstract
:1. Introduction
2. Materials and methods
2.1. Materials
2.2. S/O/W Emulsion Preparation
2.3. Particle Size, Zeta-Potential, and Physical Stability Measurements
2.4. Viscosity Measurements
2.5. Microstructure
2.5.1. Confocal Laser Scanning Microscopy (CLSM)
2.5.2. Cryo-Scanning Electron Microscopy (Cryo-SEM)
2.6. Interfacial Behavior of Interaction between NaCas and GEL
2.6.1. Oil-phase Purification
2.6.2. Interfacial Tension
2.6.3. Rheological Properties of Interfacial Membrane Expansion
2.7. Simulated Gastrointestinal Tract (GIT) Model
2.8. Calcium Bioaccessibility
2.9. Statistical Analysis
3. Results and Discussion
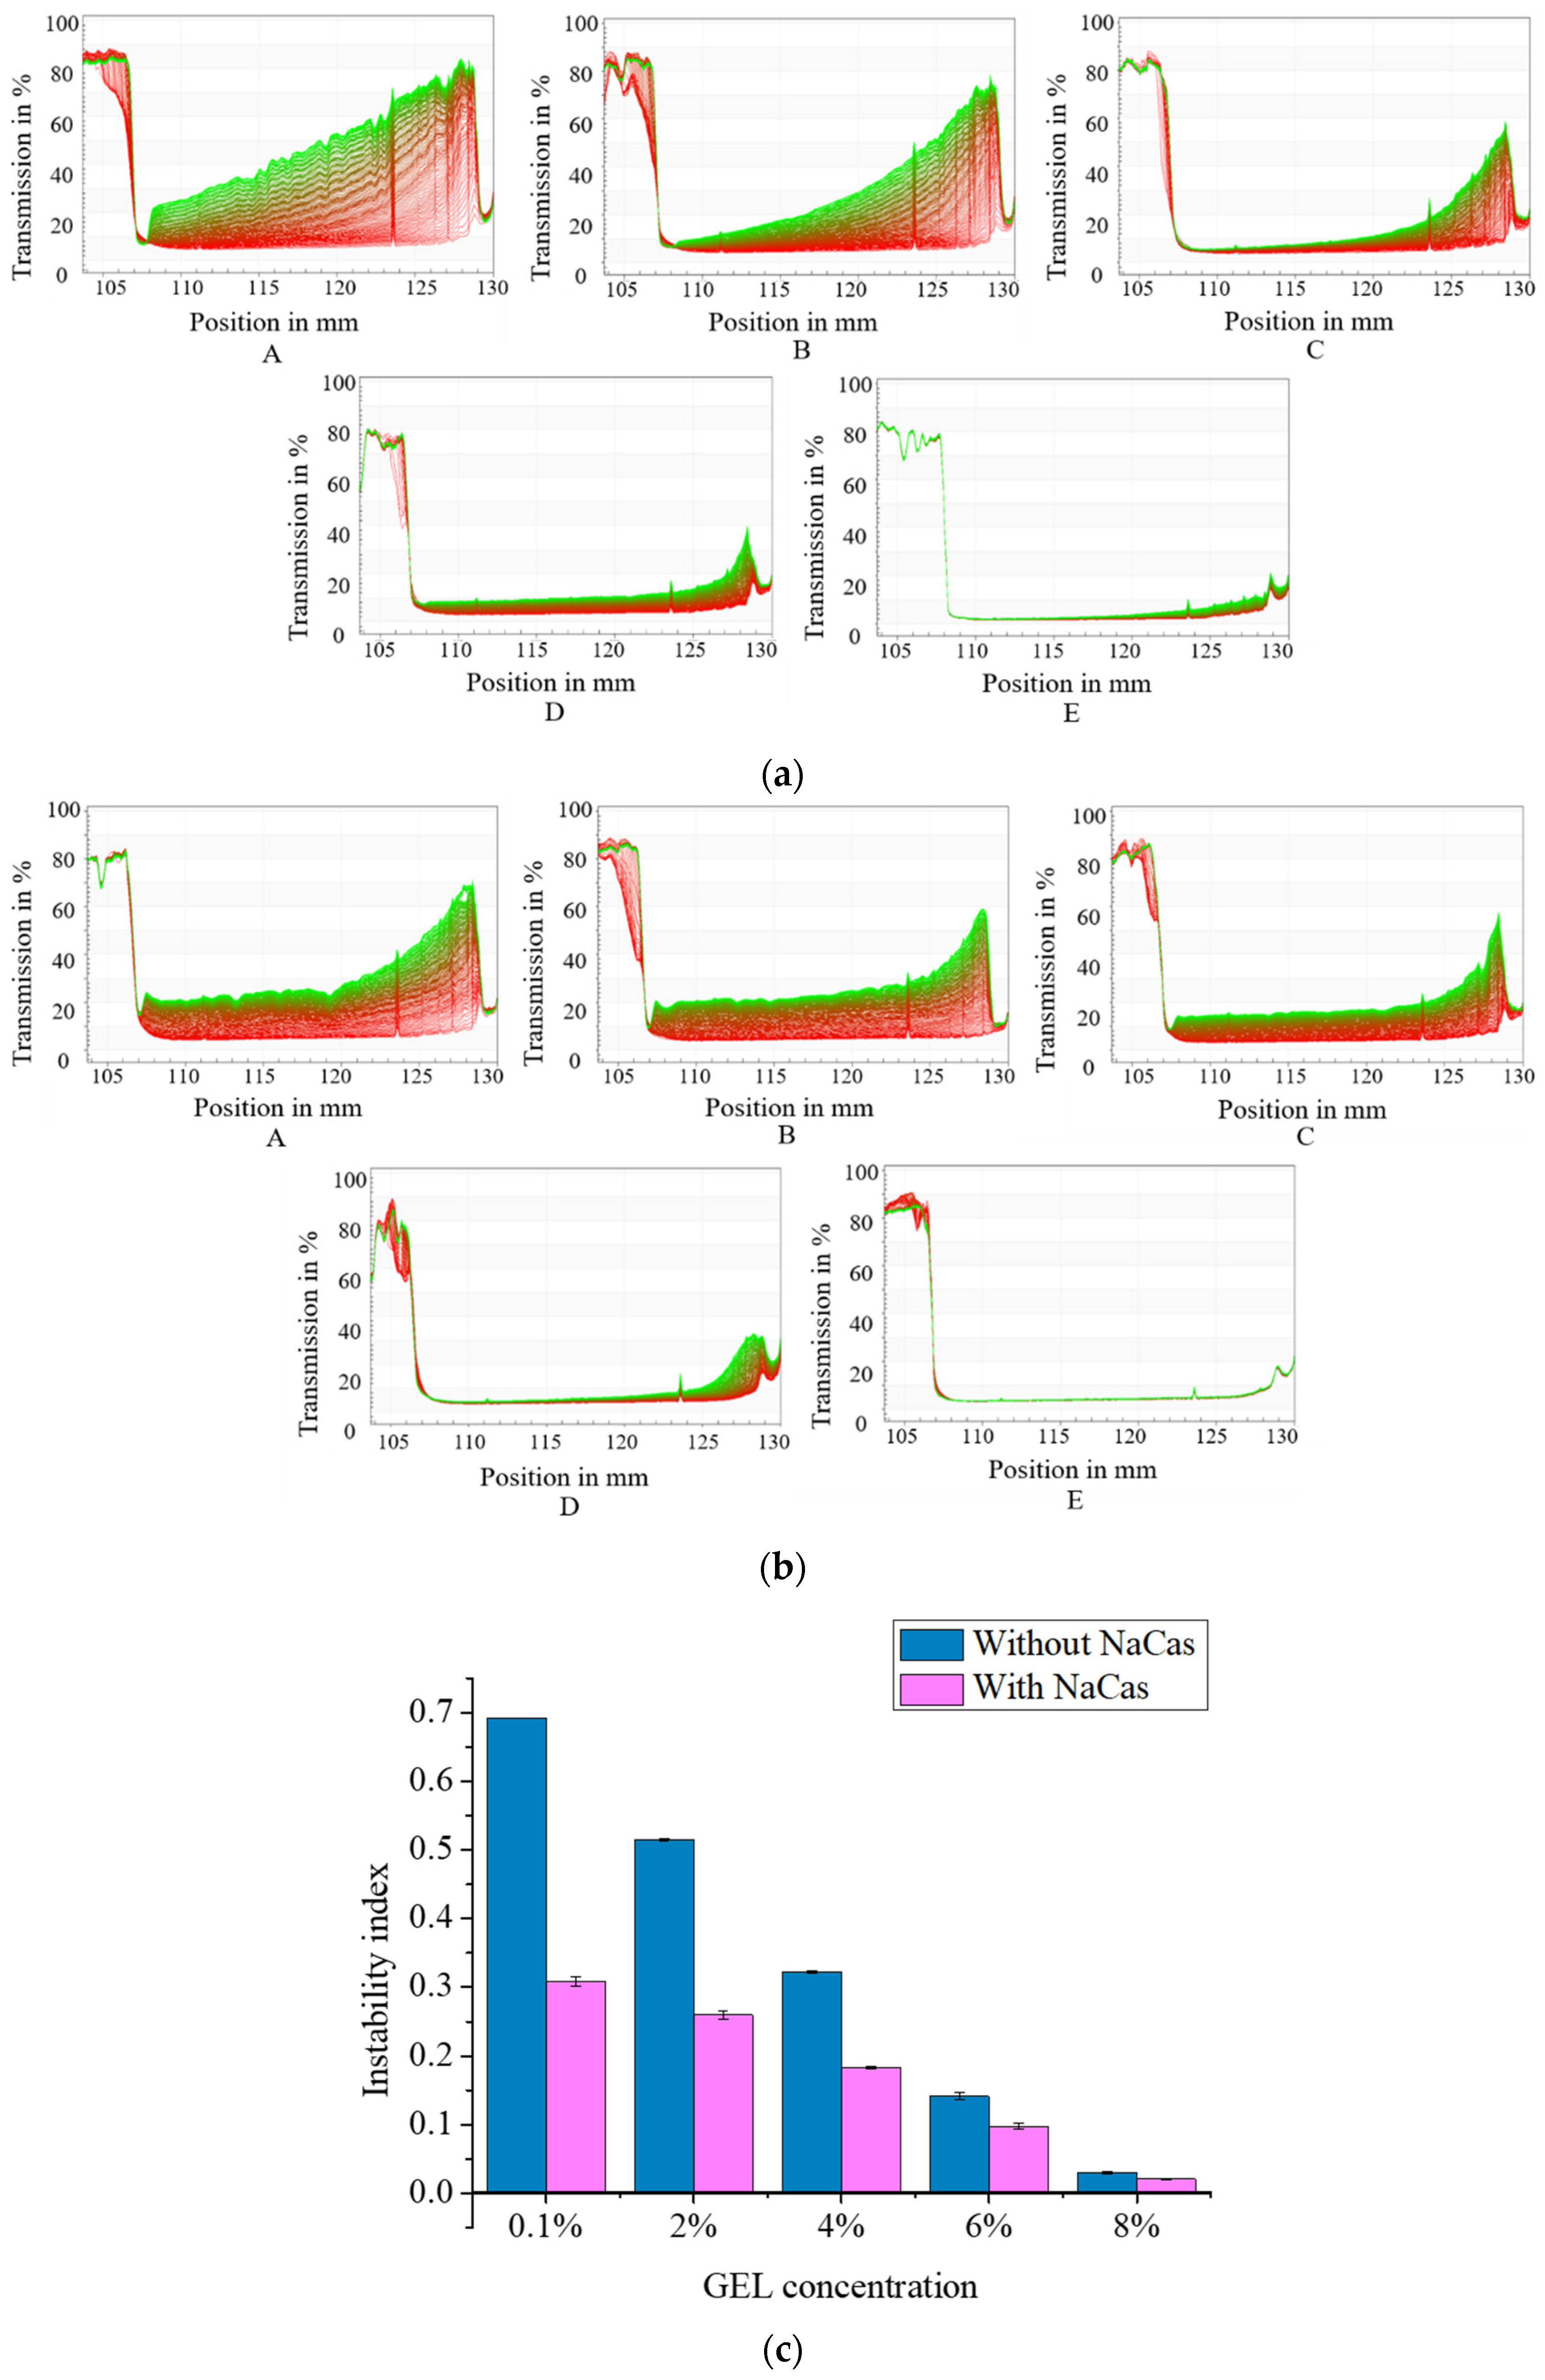
3.1. Physical Stability
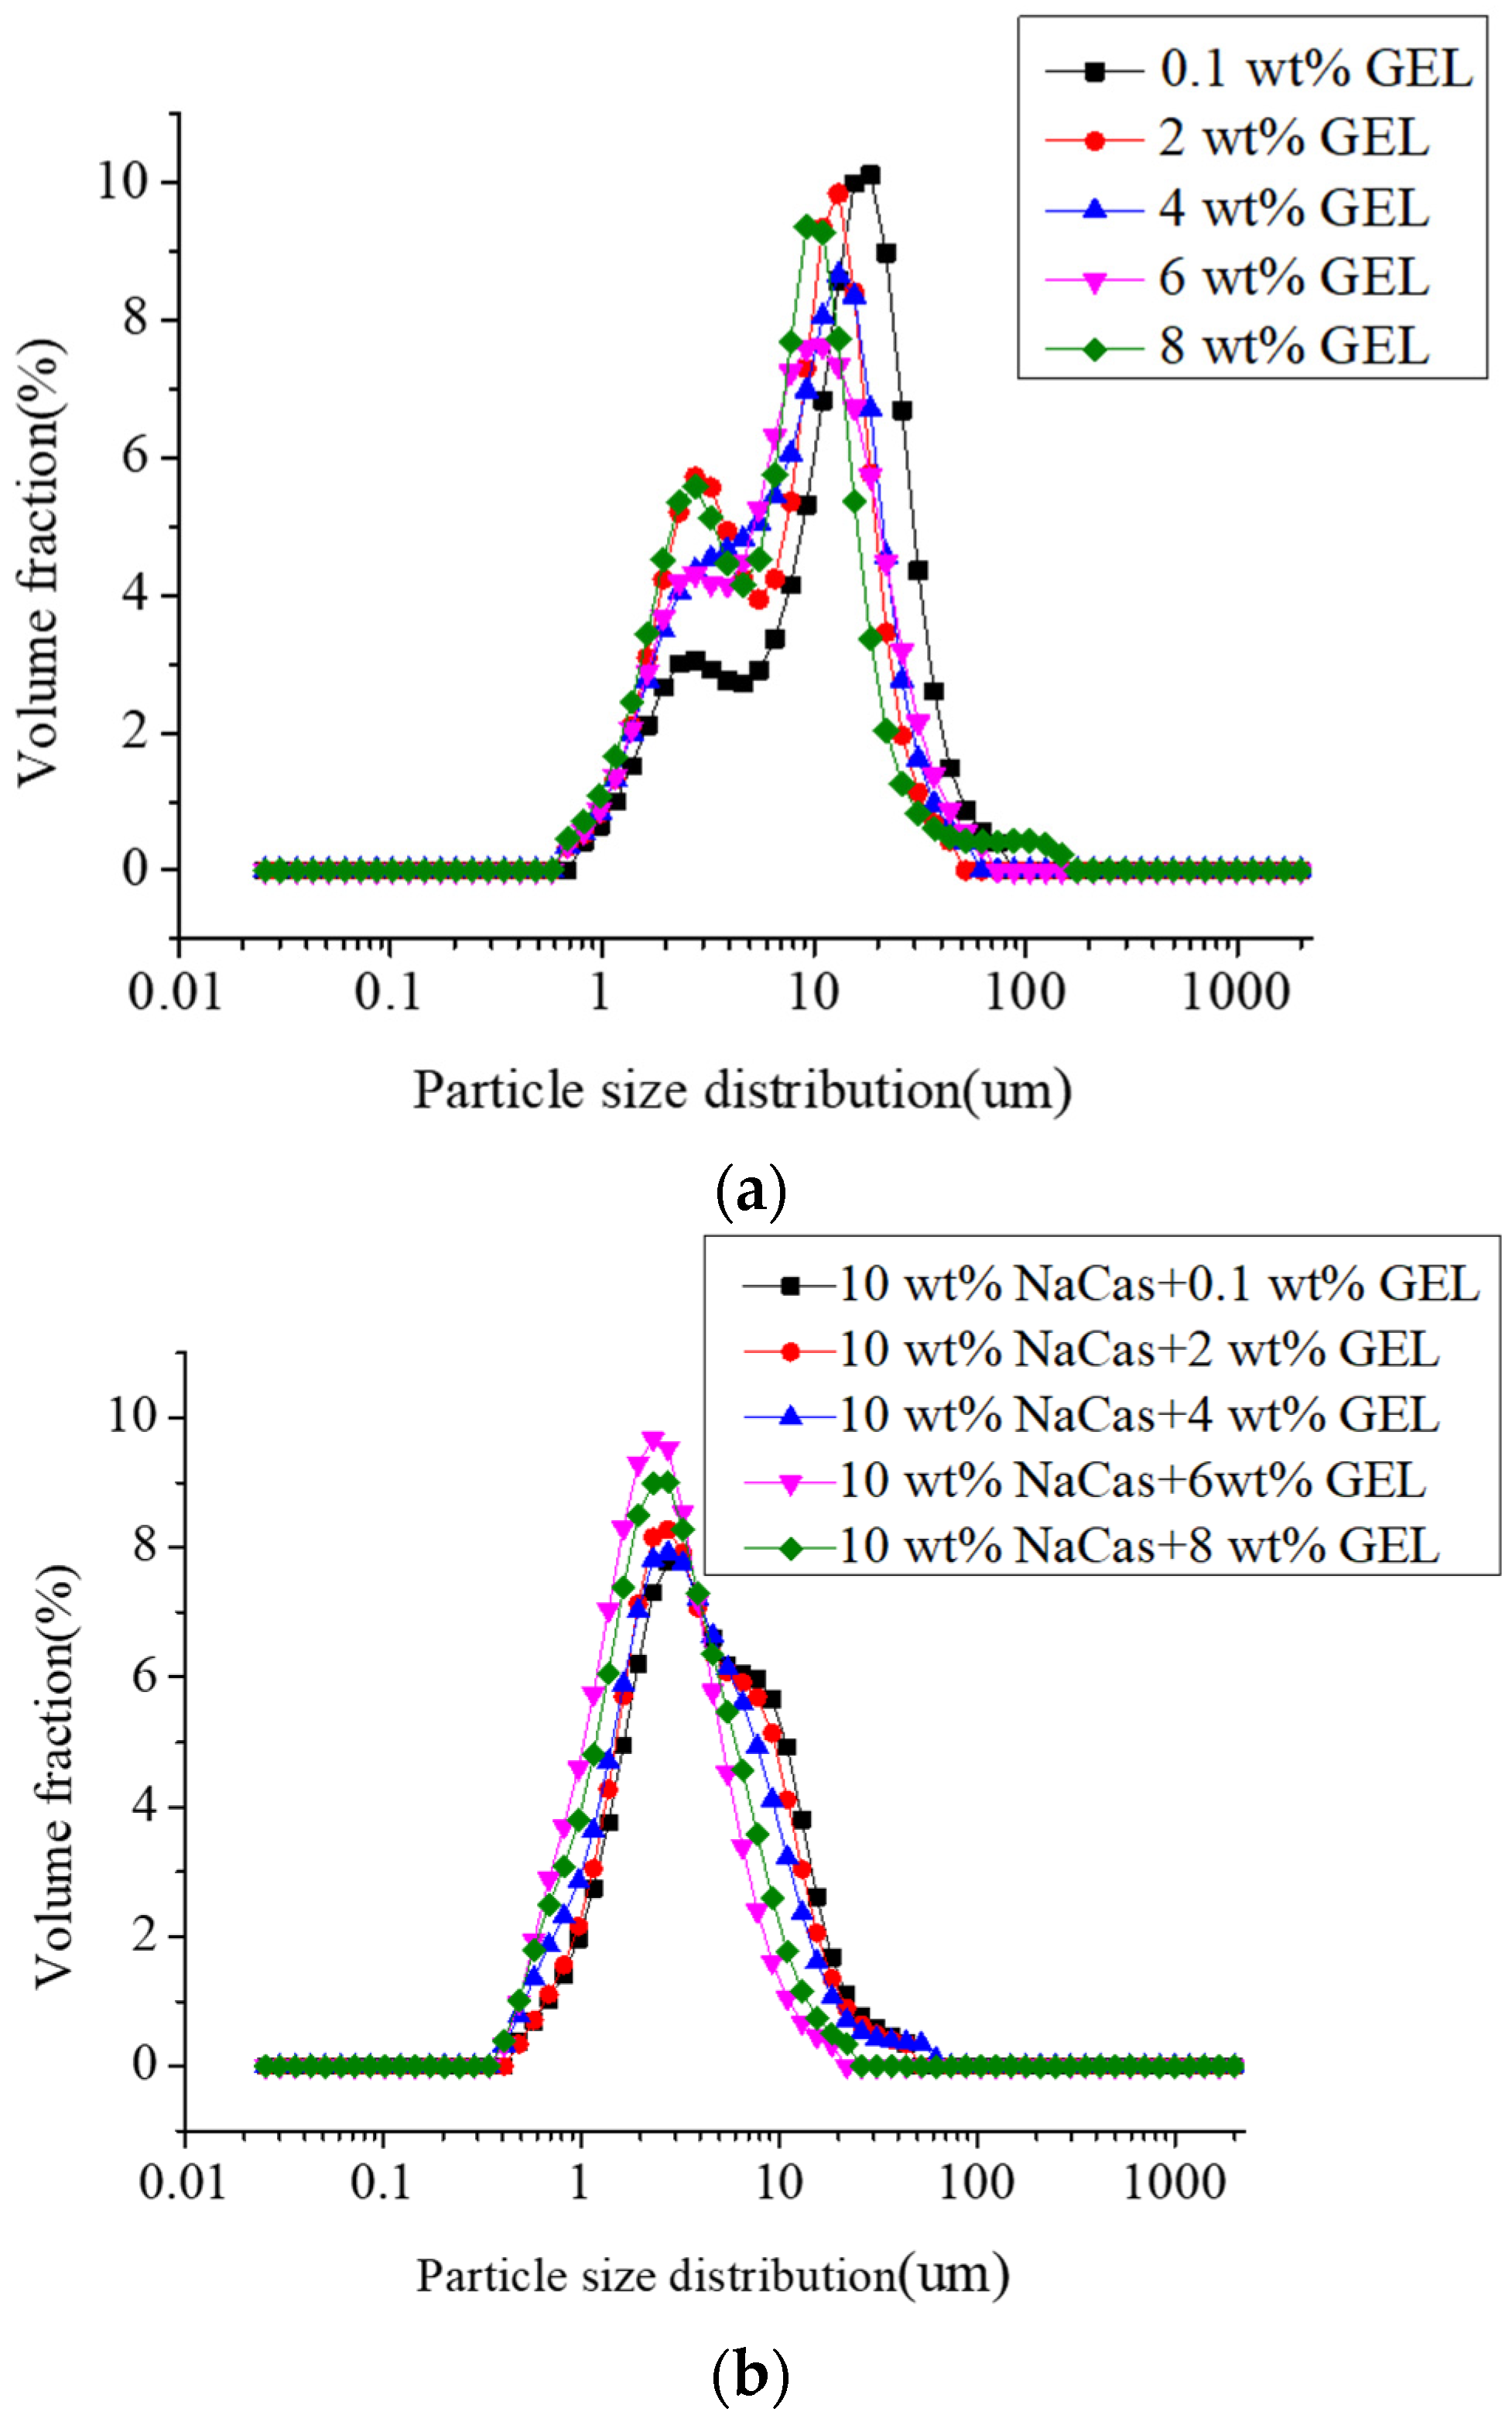
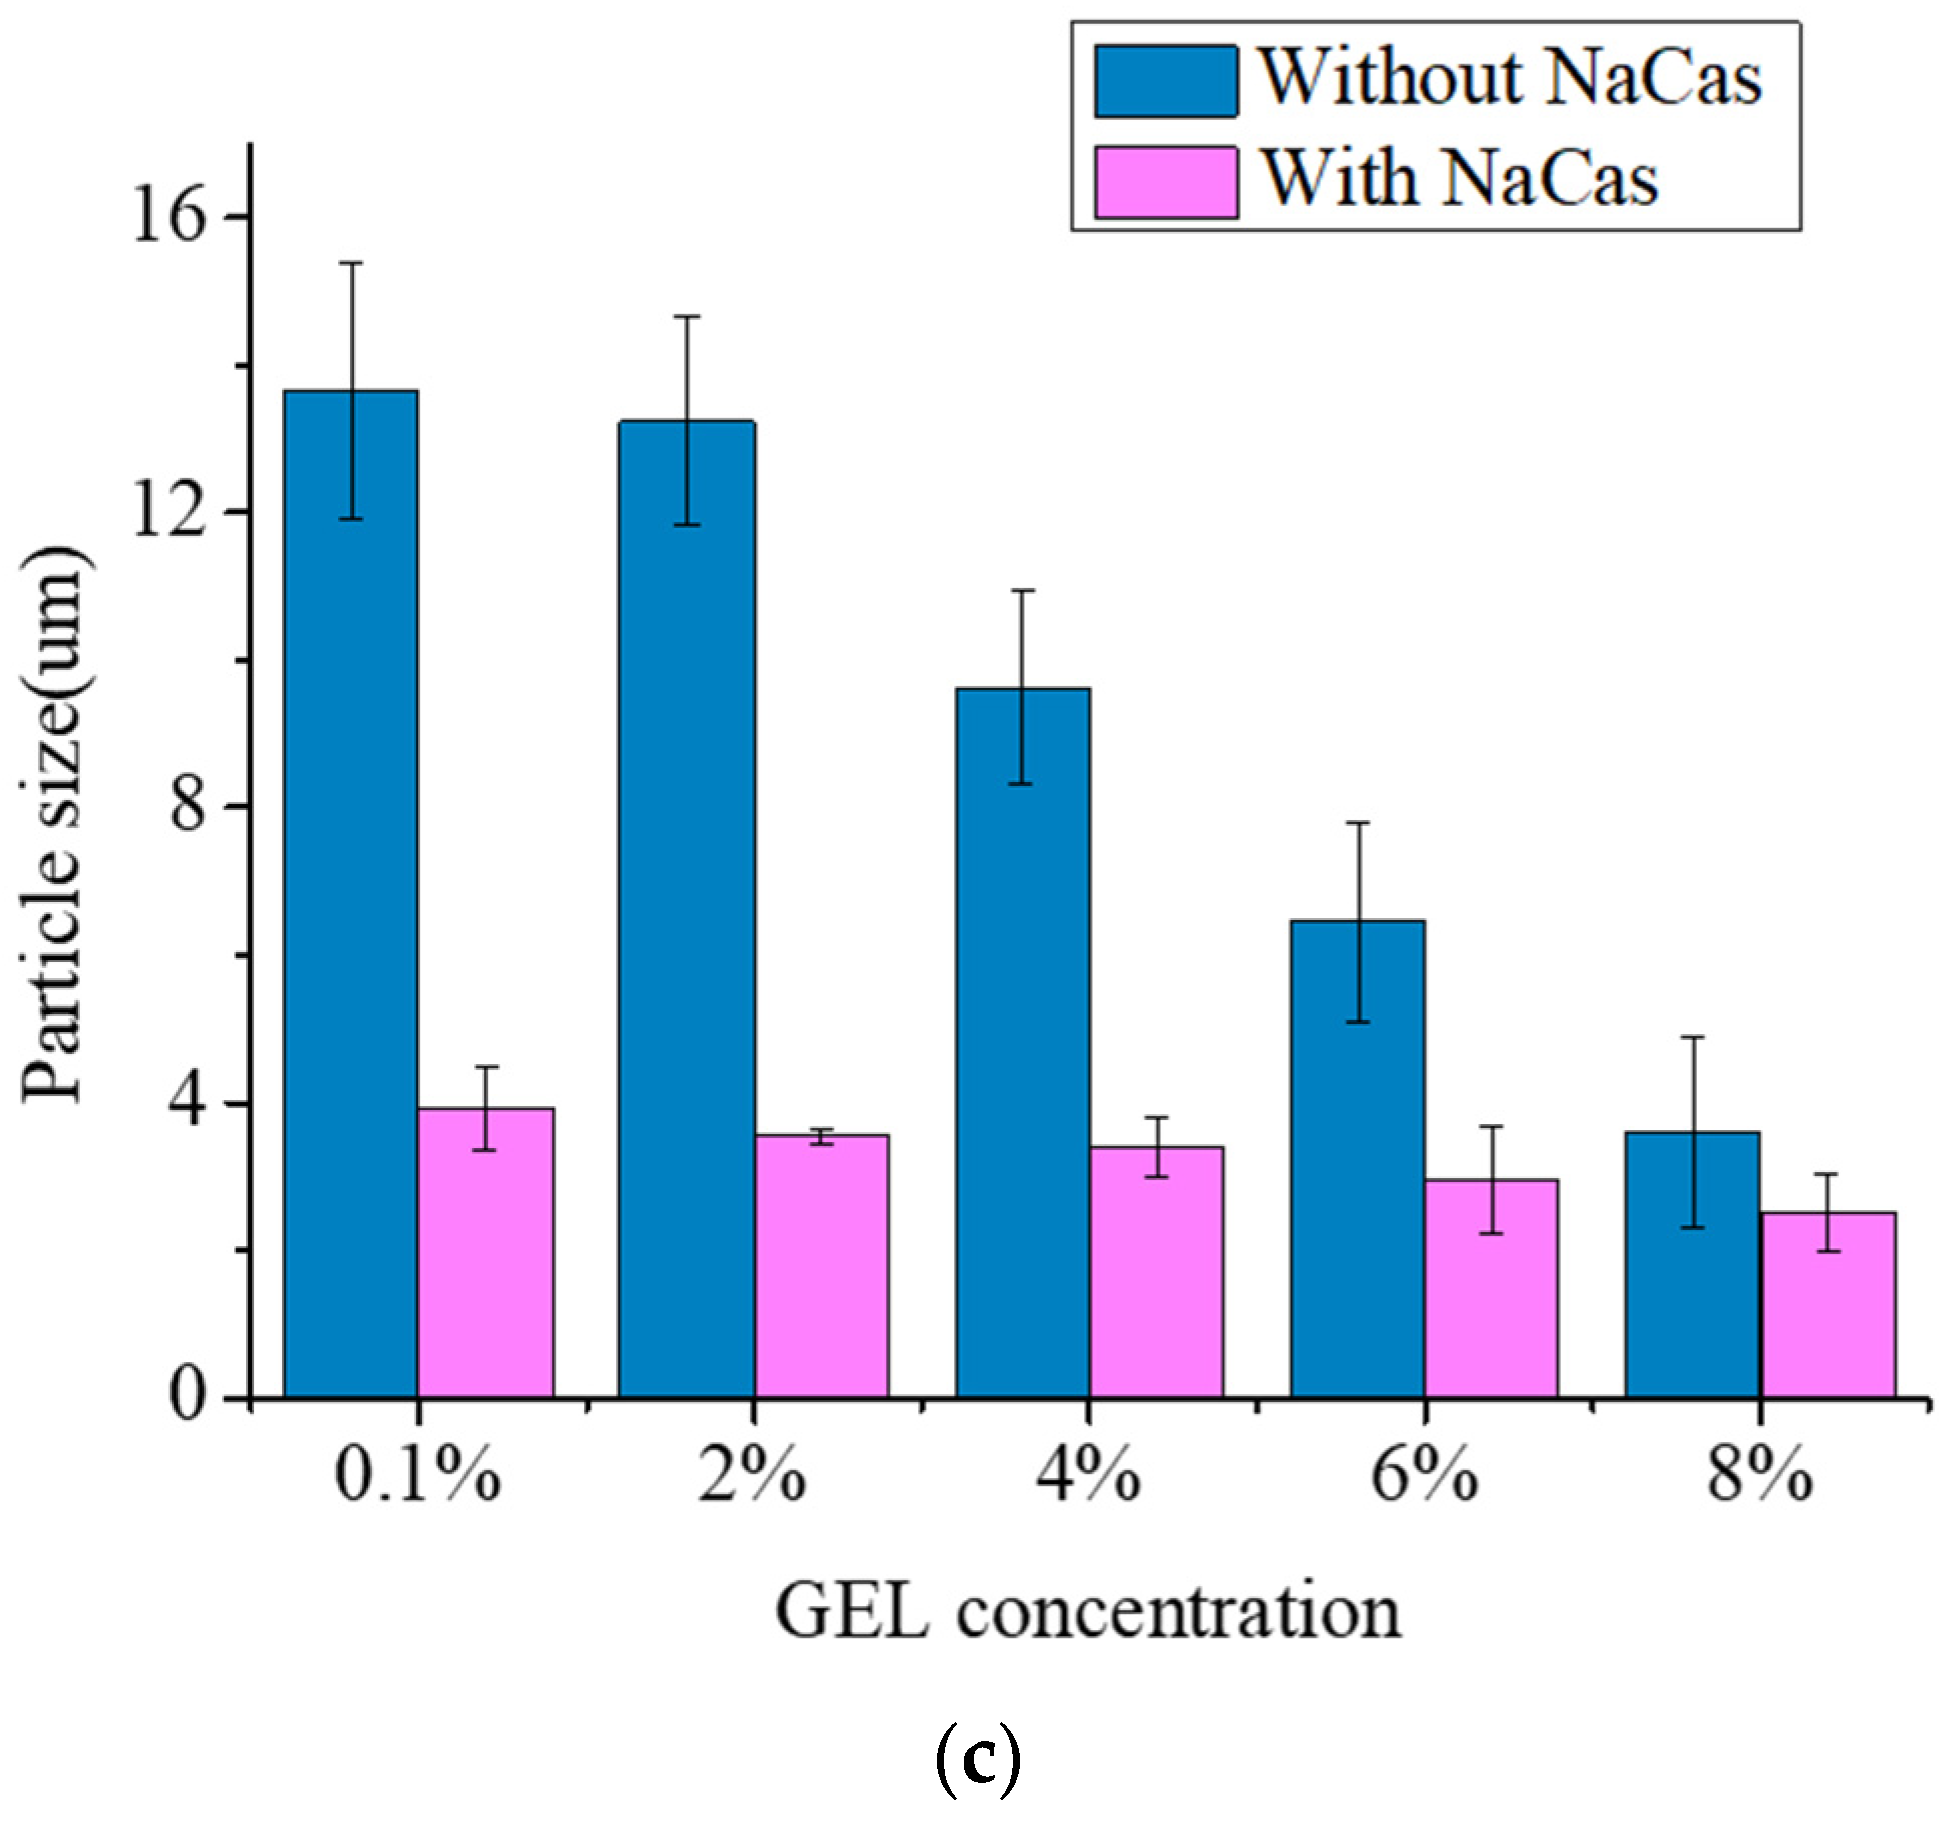
3.2. Particle Size
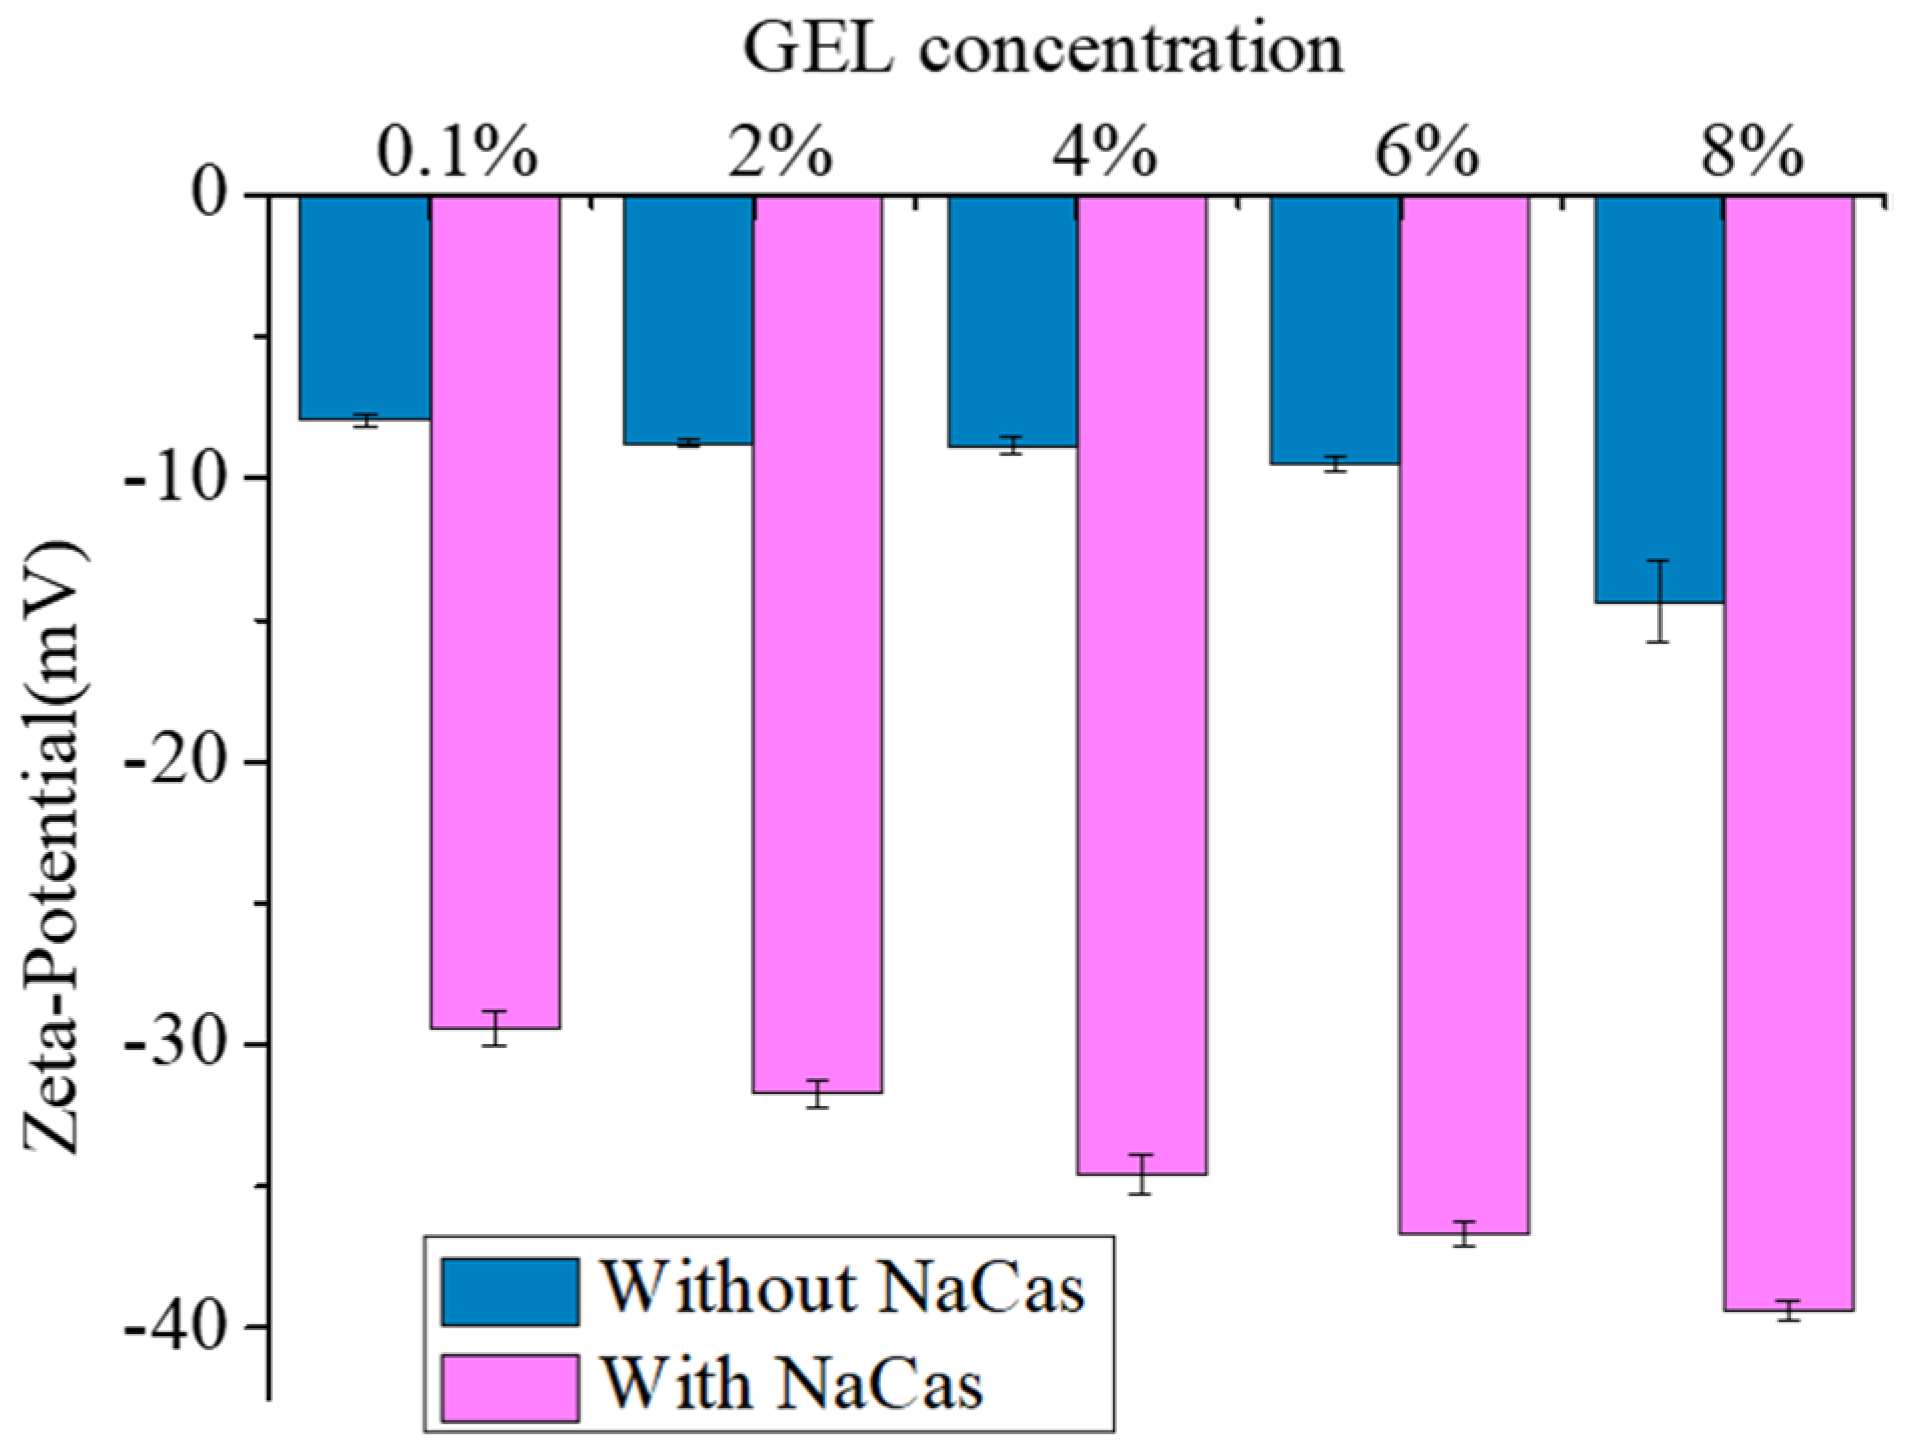
3.3. Zeta-Potential
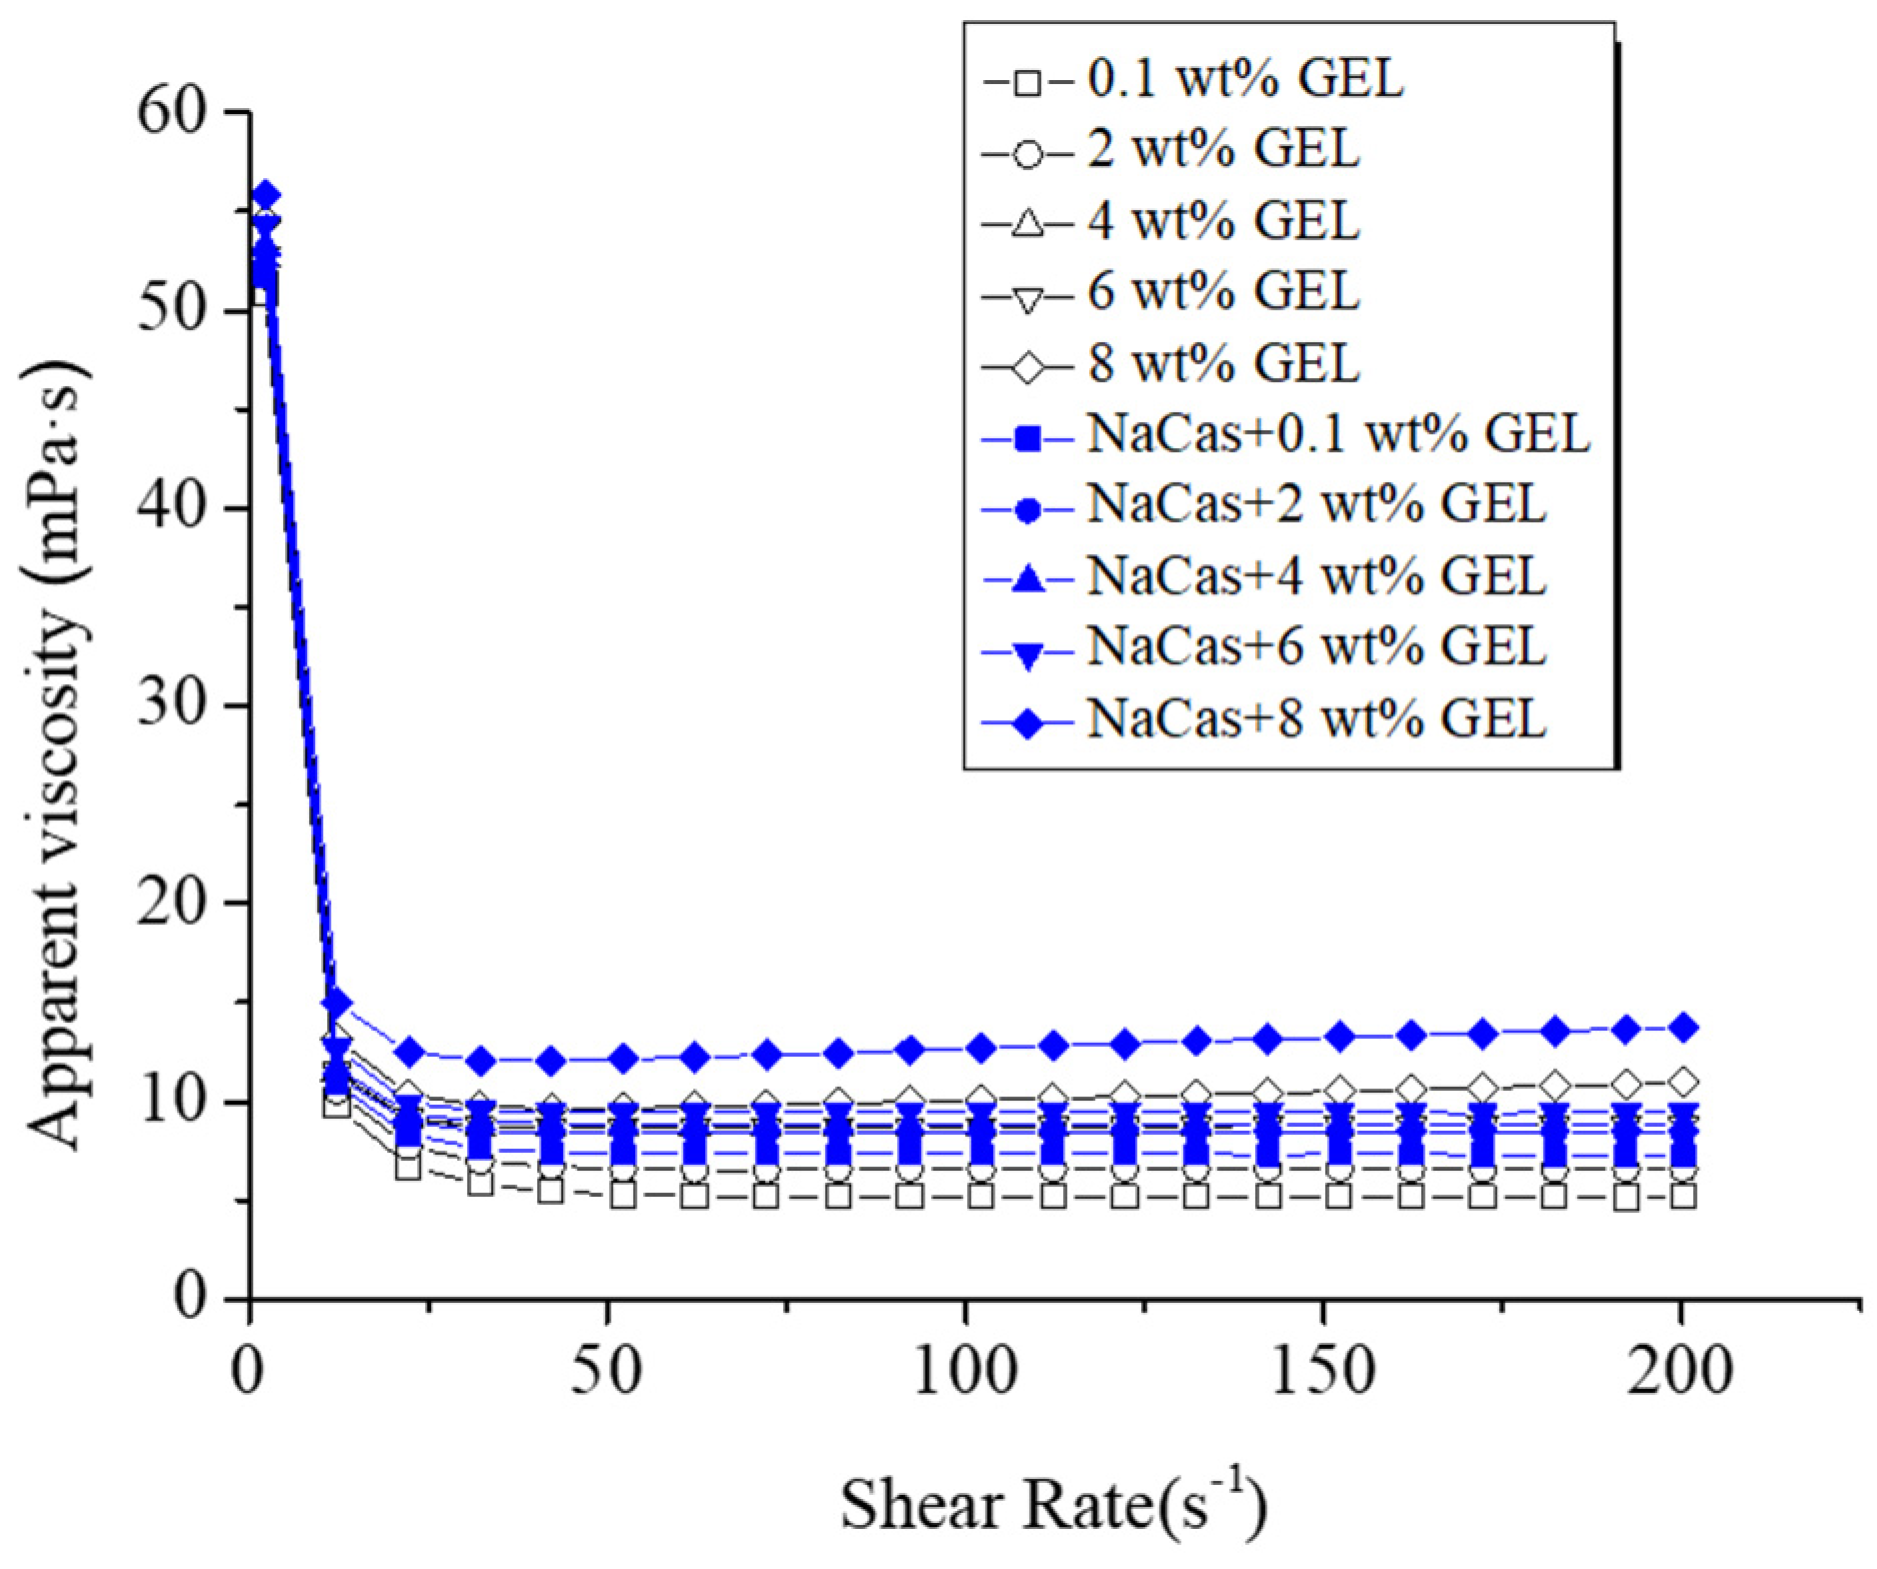
3.4. Viscosity Analysis
3.5. Microstructure Analysis
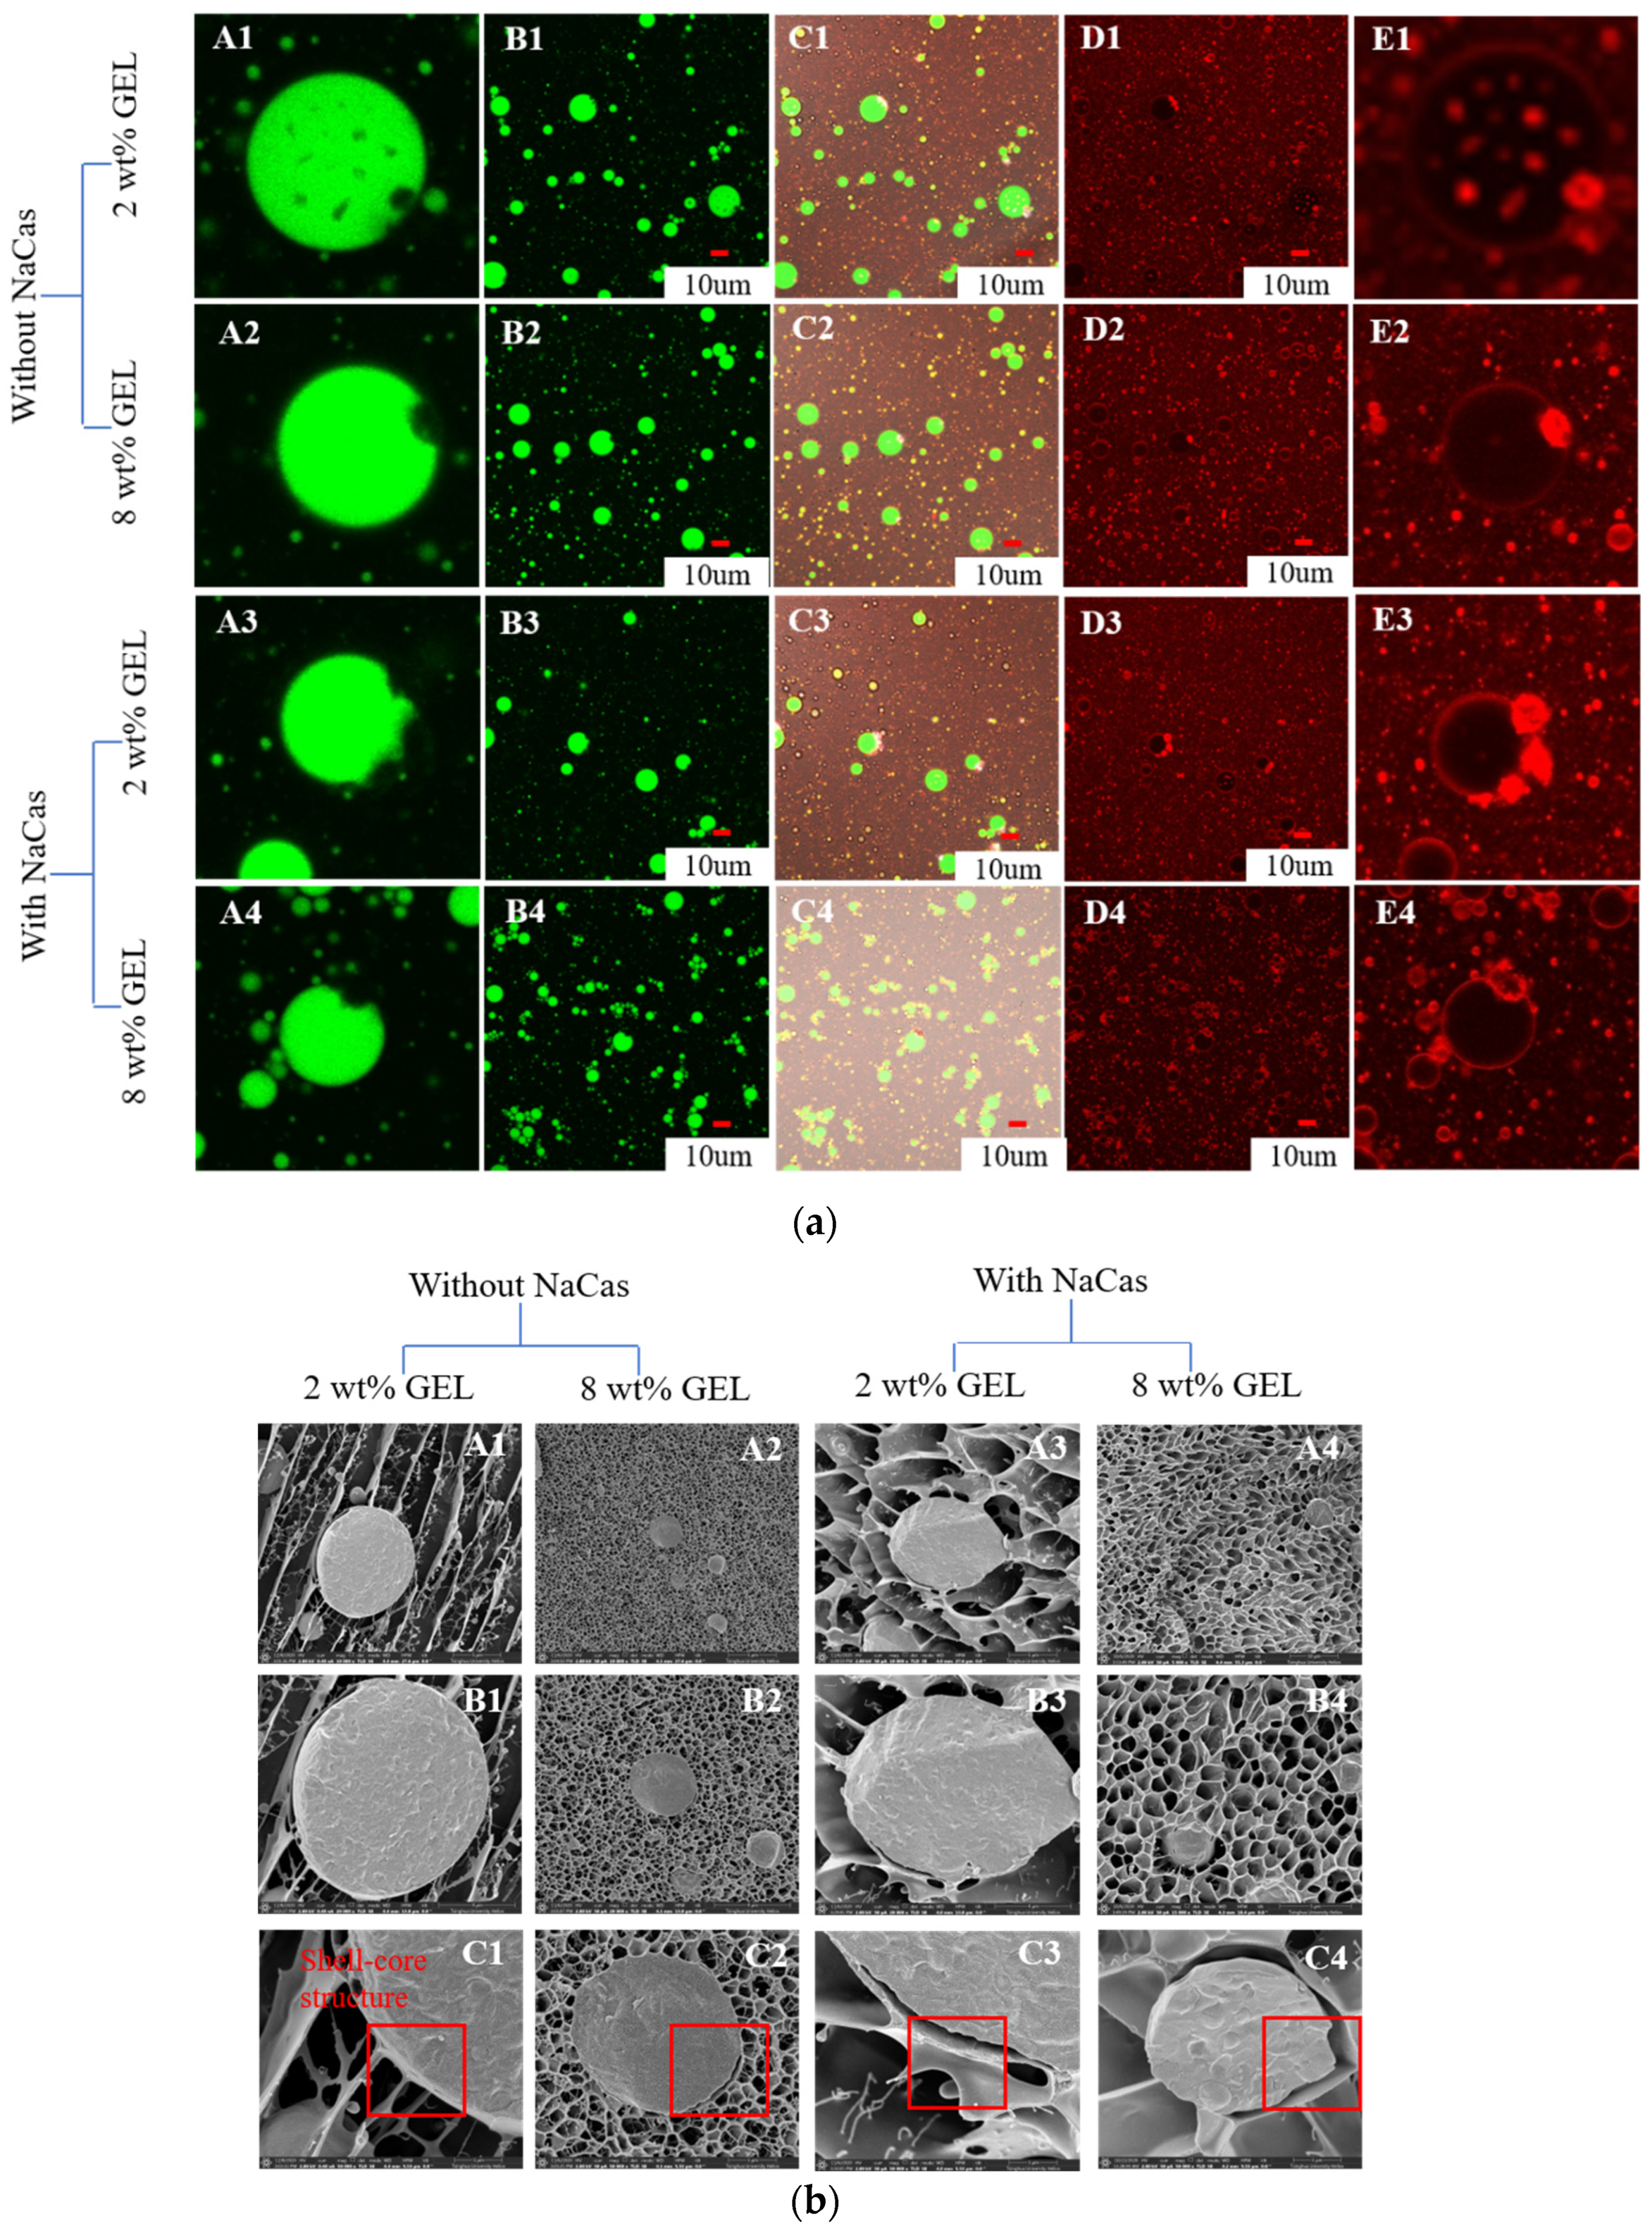
3.5.1. CLSM
3.5.2. Cryo-SEM
3.6. Interface Adsorption Characteristics
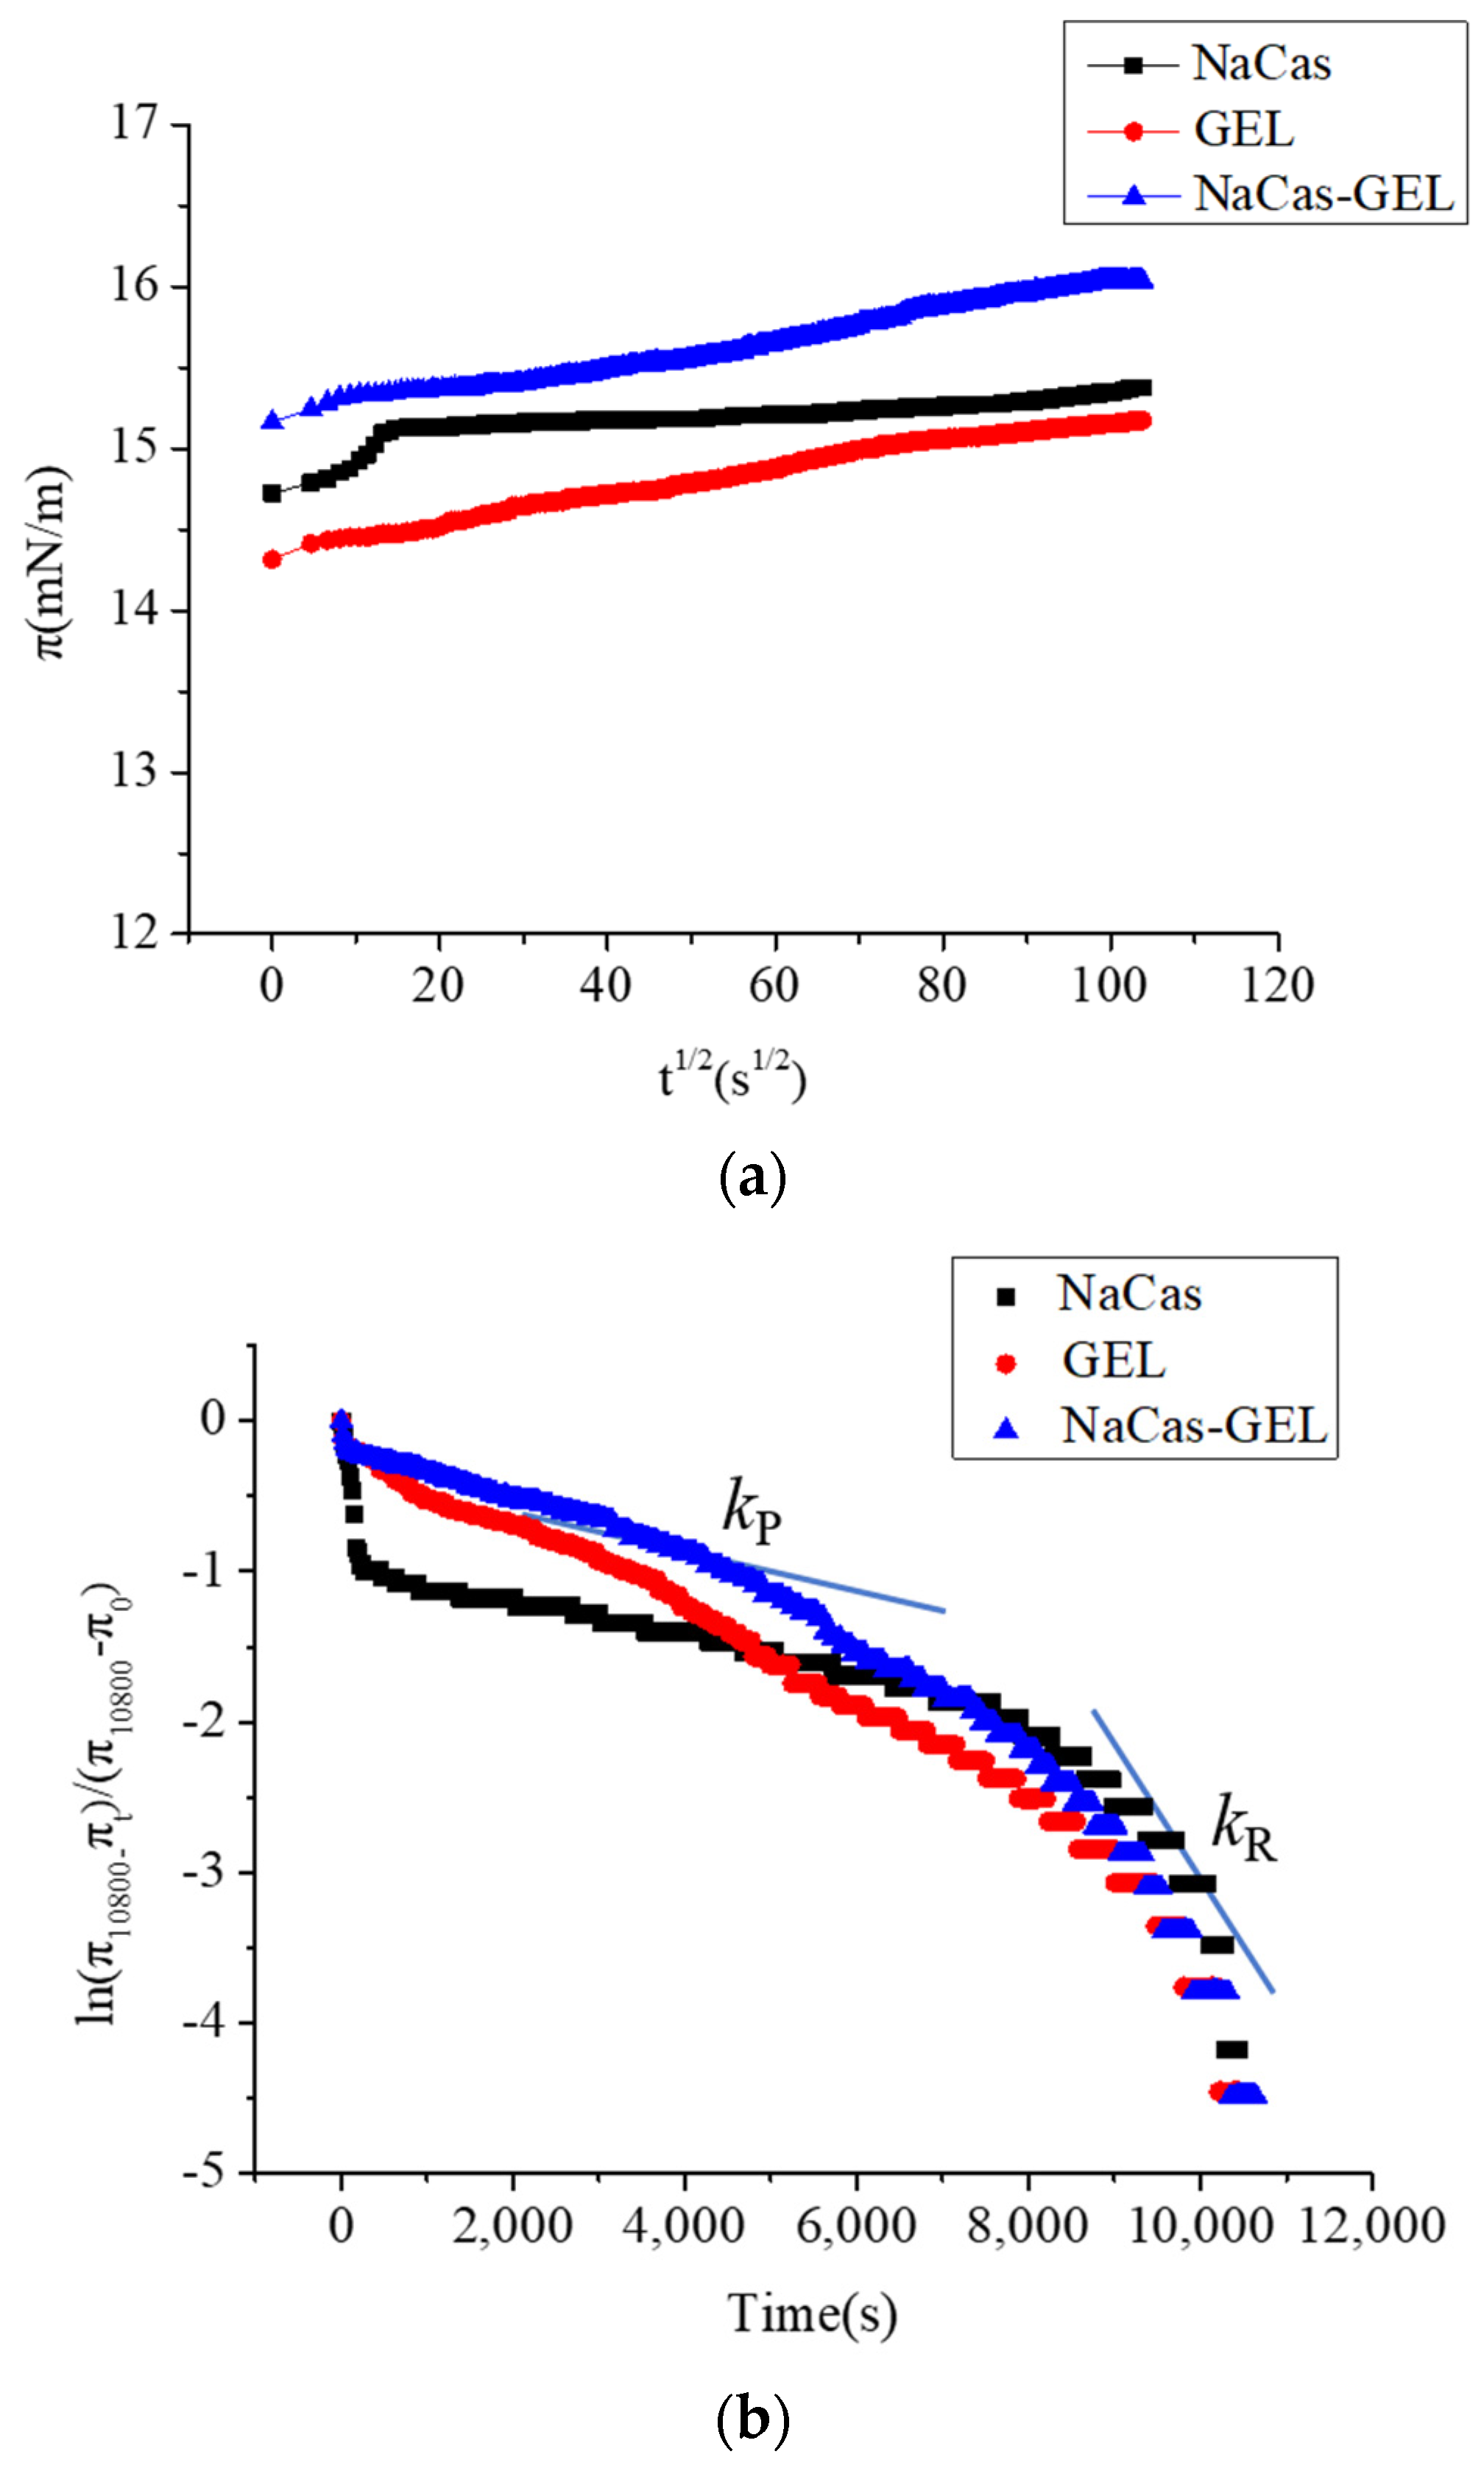
3.6.1. Interfacial Tension
3.6.2. Rheological Properties of Interface Expansion
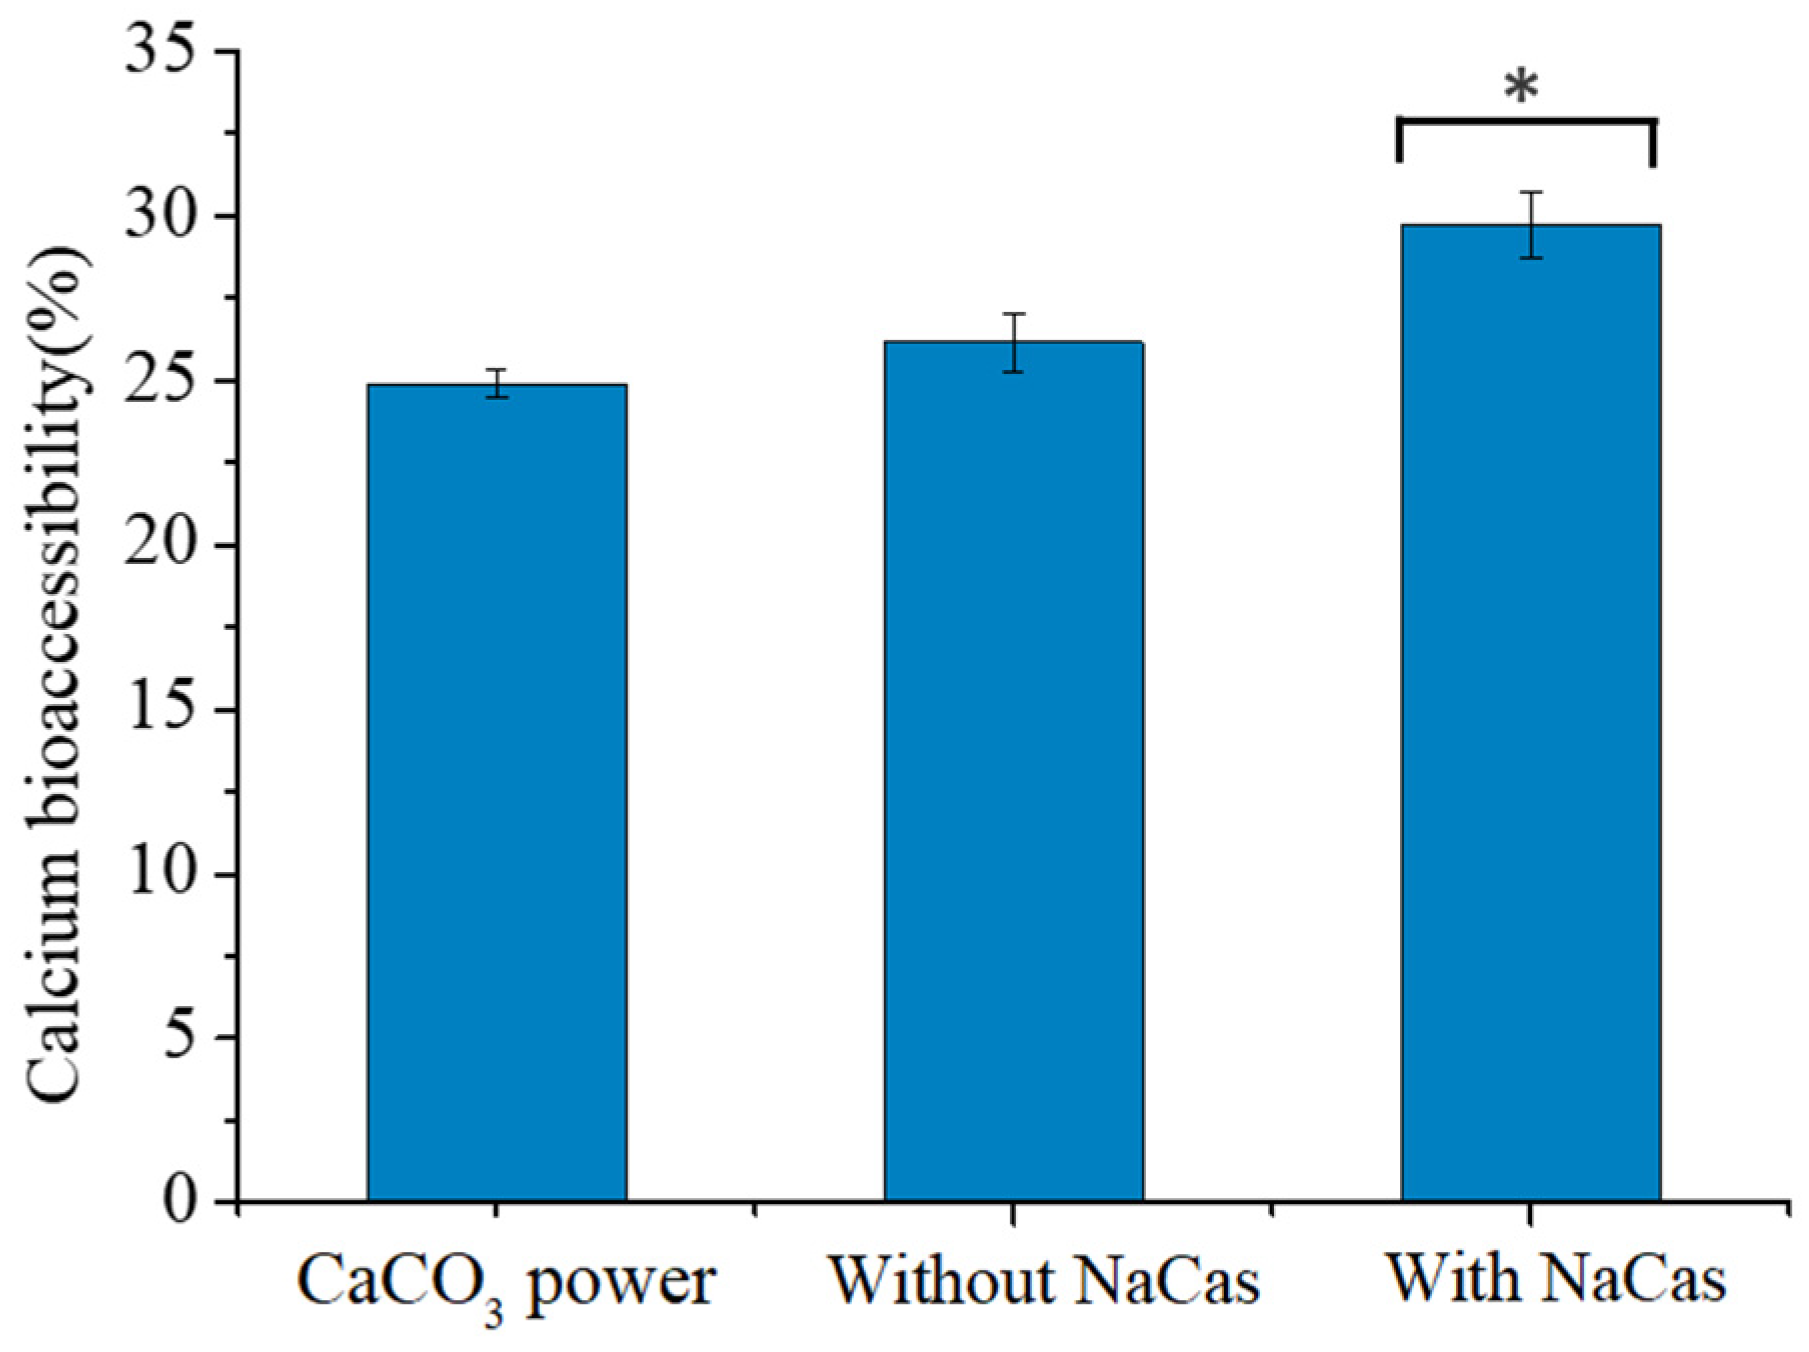
3.7. Calcium Bioaccessibility
4. Conclusions
Author Contributions
Funding
Data Availability Statement
Conflicts of Interest
References
- Torres, O.; Murray, B.; Sarkar, A. Emulsion microgel particles: Novel encapsulation strategy for lipophilic molecules. Trends Food Sci. Technol. 2016, 55, 98–108. [Google Scholar] [CrossRef]
- McClements, D.J.; Decker, E.A.; Weiss, J. Emulsion-based delivery systems for lipophilioc bioactive components. J. Food Sci. 2007, 72, 109–124. [Google Scholar] [CrossRef] [PubMed]
- Weiss, J.; Decker, E.A.; McClements, D.J.; Kristbergsson, K.; Helgason, T.; Awad, T. Solid lipid nanoparticles as delivery systems for bioactive food components. Food Biophys. 2008, 3, 146–154. [Google Scholar] [CrossRef]
- Velikov, K.P.; Pelan, E. Colloidal delivery systems for micronutrients and nutraceuticals. Soft Matter 2008, 4, 1964–1980. [Google Scholar] [CrossRef]
- Jimenez-Colmenero, F. Potential applications of multiple emulsions in the development of healthy and functional foods. Food Res. Int. 2013, 52, 64–74. [Google Scholar] [CrossRef]
- Li, Z.Y.; Ling, L.; Wang, J.F. Functional factors in functional food. Food Sci. 2005, 8, 604–607. [Google Scholar]
- Li, X.; Wei, W.; Ma, G.H.; Hu, L. Research progress of sustained-release microspheres preparation. J. Beijing Univ. Chem. Technol. 2017, 44, 1–11. [Google Scholar]
- Wang, N.; Wang, Y.X.; Qin, P.Y.; Wei, W.; Ma, G.H. Preparation of PLGA microspheres loaded with tripriline acetate by fast membrane emulsification. Chin. J. Process Eng. 2013, 13, 862–869. [Google Scholar]
- Wei, Y.; Wang, Y.; Kang, A.; Wang, W.; Ho, S.V.; Gao, J.; Ma, G.; Su, Z. A novel sustained-release formulation of recombinant human growth hormone and its pharmacokinetic, pharmacodynamic and safety profiles. Mol. Pharm. 2012, 9, 2039–2048. [Google Scholar] [CrossRef]
- Morita, T.; Sakamura, Y.; Horikiri, Y.; Suzuki, T.; Yoshino, H. Protein encapsulation into biodegradable microspheres by a novel S/O/W emulsion method using poly(ethylene glycol) as a protein micronization adjuvant. J. Control. Release 2000, 69, 435–444. [Google Scholar] [CrossRef]
- Takai, C.; Hotta, T.; Shiozaki, S.; Matsumoto, S.; Fukui, T. Key techniques to control porous microsphere morphology in S/O/W emulsion system. Colloids Surf. A Physicochem. Eng. Asp. 2011, 373, 152–157. [Google Scholar] [CrossRef]
- Qu, B.; Zhong, Q. Casein-maltodextrin conjugate as an emulsifier for fabrication of structured calcium carbonate particles as dispersible fat globule mimetics. Food Hydrocoll. 2017, 66, 61–70. [Google Scholar] [CrossRef] [Green Version]
- Liang, Y.; Gillies, G.; Matia-Merino, L.; Ye, A.; Patel, H.; Golding, M. Structure and stability of sodium-caseinate-stabilized oil-in-water emulsions as influenced by heat treatment. Food Hydrocoll. 2017, 66, 307–317. [Google Scholar] [CrossRef]
- Martiel, I.; Sagalowicz, L.; Mezzenga, R. Viscoelasticity and interface bending properties of lecithin reverse wormlike micelles studied by diffusive wave spectroscopy in hydrophobic environment. Langmuir 2014, 30, 10751–10759. [Google Scholar] [CrossRef] [PubMed]
- Wu, J.; Zhong, Q. Encapsulation of konjac glucomannan in oil droplets to reduce viscosity of aqueous suspensions and gradually increase viscosity during simulated gastric digestion. J. Food Eng. 2016, 175, 104–107. [Google Scholar] [CrossRef] [Green Version]
- Celus, M.; Kyomugasho, C.; Salvia-Trujillo, L.; Van Audenhove, J.; Van Loey, A.M.; Grauwet, T.; Hendrickx, M.E. Interactions between citrus pectin and Zn2+ or Ca2+ and associated in vitro Zn2+ bioaccessibility as affected by degree of methylesterification and blockiness. Food Hydrocoll. 2018, 79, 319–330. [Google Scholar] [CrossRef]
- Cong, L.; Lu, G.H. Correct selection and rational application of calcium preparation. Chin. J. Mod. Pharm. Appl. 2010, 4, 128. [Google Scholar]
- Jiang, J.L.; Wang, L.C.; Wu, H.; Liu, R. Research progress of calcium preparation. Sci. Technol. Food Ind. 2012, 33, 379–382+387. [Google Scholar]
- Lakkis, J.M.; Maria, G. Microcapsules Containing Salts for Food Products: Spain. EP2292102 A1, 10 March 2011. [Google Scholar]
- Lu, X.P. How to scientifically supplement calcium and iron for babies. Fash. Parent. 2011, 06, 108–109. [Google Scholar]
- Xiao, S.; Huang, L.X.; Guo, F. Determination of microencapsulated milk calcium supplement. Sci. Technol. Food Ind. 2013, 34, 295–298. [Google Scholar]
- Paques, J.P.; Leonard, M.C.; Cees, J.M.; van der Linden, E. Nanospheres of alginate prepared through w/o emulsification and internal gelation with nanoparticles of CaCO3. Food Hydrocoll. 2014, 40, 182–188. [Google Scholar] [CrossRef]
- Guo, X.; Li, X.Y.; Chan, L.; Huang, W.; Chen, T. Edible CaCO3 nanoparticles stabilized Pickering emulsion as calcium-fortified formulation. J. Nanobiotechnol. 2021, 19, 359–374. [Google Scholar] [CrossRef]
- Hemar, Y.; Cheng, L.J.; Oliver, C.M.; Sanguansri, L.; Augustin, M. Encapsulation of resveratrol using water-in-oil-in-water double emulsions. Food Biophys. 2010, 5, 120–127. [Google Scholar] [CrossRef]
- Koberstein-Hajda, A.; Dickinson, E. Stability of water-in-oil-in-water emulsions containing faba bean proteins. Food Hydrocoll. 1996, 10, 251–254. [Google Scholar] [CrossRef]
- Su, J.; Flanagan, J.; Hemar, Y.; Singh, H. Synergistic effects of polyglycerol ester of polyricinoleic acid and sodium caseinate on the stabilisation of water–oil–water emulsions. Food Hydrocoll. 2006, 20, 261–268. [Google Scholar] [CrossRef]
- Li, A.Z.; Shao, X.H.; Liu, L.T. Influence factors on performance of gelatin-chitosan composite packaging film. Food Oil 2009, 7, 17–18. [Google Scholar]
- Feng, X.; Dai, H.; Ma, L.; Fu, Y.; Yu, Y.; Zhou, H.; Guo, T.; Zhu, H.; Wang, H.; Zhang, Y. Properties of Pickering emulsion stabilized by food-grade gelatin nanoparticles: Influence of the nanoparticles concentration. Colloids Surf. B Biointerfaces 2020, 196, 198–216. [Google Scholar] [CrossRef]
- Oppermann, A.; Renssen, M.; Schuch, A.; Stieger, M.; Scholten, E. Effect of gelation of inner dispersed phase on stability of (w(1)/o/w(2)) multiple emulsions. Food Hydrocoll. 2015, 48, 17–26. [Google Scholar] [CrossRef]
- Perez-Moral, N.; Watt, S.; Wilde, P. Comparative study of the stability of multiple emulsions containing a gelled or aqueous internal phase. Food Hydrocoll. 2014, 42, 215–222. [Google Scholar] [CrossRef]
- Surh, J.; Decker, E.A.; McClements, D.J. Properties and stability of oil-in-water emulsions stabilized by fish gelatin. Food Hydrocoll. 2006, 20, 596–606. [Google Scholar] [CrossRef]
- Dickinson, E. Interfacial structure and stability of food emulsions as affected by protein-polysaccharide interactions. Soft Matter 2008, 4, 932–942. [Google Scholar] [CrossRef] [PubMed]
- Guo, Y.; Wu, C.; Du, M.; Lin, S.; Xu, X.; Yu, P. In-situ dispersion of casein to form nanoparticles for Pickering high internal phase emulsions. Lebensm. Und Technol. Food Sci. Technol. 2021, 139, 110538. [Google Scholar] [CrossRef]
- Zhu, Y.; Chen, X.; McClements, D.J.; Zou, L.; Liu, W. pH-, ion- and temperature-dependent emulsion gels: Fabricated by addition of whey protein to gliadin-nanoparticle coated lipid droplets. Food Hydrocoll. 2018, 77, 870–878. [Google Scholar] [CrossRef]
- Chang, F.F.; Li, Z.F.; Zhang, T.; Han, Y.M.; Jin, L.E. In-situ assembly of gelatin-glycerin-sodium caseinate composite membrane and its analysis. Polym. Mater. Sci. Eng. 2013, 29, 155–158,163. [Google Scholar]
- Xun, Q.N.; Lei, Q.; Bao, J.Q.; Huang, Z.Y. Study on packaging performance of gelatin -sodium caseinate edible membrane. Packag. Eng. 2013, 34, 40–45. [Google Scholar]
- Phawaphuthanon, N.; Yu, D.; Ngamnikom, P.; Shin, I.-S.; Chung, D. Effect of fish gelatine-sodium alginate interactions on foam formation and stability. Food Hydrocoll. 2019, 88, 119–126. [Google Scholar] [CrossRef]
- Gaonkar, A.G. Interfacial tensions of vegetable oil/water systems: Effect of oil purification. J. Am. Oil Chem. Soc. 1989, 66, 1090–1092. [Google Scholar] [CrossRef]
- Minekus, M.; Alminger, M.; Alvito, P.; Balance, S.; Bohn, T.; Bourlieu, C.; Carrière, F.; Boutrou, R.; Corredig, M.; Dupont, D.; et al. A standardised static in vitro digestion method suitable for food-an international consensus. Food Funct. 2014, 5, 1113–1124. [Google Scholar] [CrossRef] [Green Version]
- Lorieau, L.; Le Roux, L.; Gaucheron, F.; Ligneul, A.; Hazart, E.; Dupont, D.; Floury, J. Bioaccessibility of four calcium sources in different whey-based dairy matrices assessed by in vitro digestion. Food Chem. 2018, 245, 454–462. [Google Scholar] [CrossRef]
- Xiao, J.; Lu, X.X.; Huang, Q.R. Double emulsion derived from kafirin nanoparticles stabilized Pickering emulsion: Fabrication, microstructure, stability and in vitro digestion profile. Food Hydrocoll. 2017, 62, 230–238. [Google Scholar] [CrossRef]
- Lueamsaisuk, C.; Lentle, R.; MacGibbon, A.; Matia-Merino, L.; Golding, M. The effect of lactoferrin on physical changes in phospholipid stabilised emulsions during neonatal in vitro gastric digestion: Does synergism of pepsin and lipase promote lipolysis in protein-stabilised emulsions. Food Hydrocoll. 2015, 43, 785–793. [Google Scholar] [CrossRef]
- Torcello-Gomez, A.; Foster, T.J. Instant polysaccharide-based emulsions: Impact of microstructure on lipolysis. Food Funct. 2017, 8, 2231–2242. [Google Scholar] [CrossRef] [PubMed]
- Heyer, P.; Laeuger, J. Correlation between friction and flow of lubricating greases in a new tribometer device. Lubr. Sci. 2009, 21, 253–268. [Google Scholar] [CrossRef]
- Liu, L.Y. Interaction between Sodium Caseinate and Polysaccharide and Its Effect on the Stability of Emulsion. Ph.D. Thesis, South China University of Technology, Guangzhou, China, 2011. [Google Scholar]
- Galazka, V.B.; Dickinson, E.; Ledward, D.A. Emulsifying properties of ovalbumin in mixtures with sulphated polysaccharides: Effects of pH, ionic strength, heat and high-pressure treatment. J. Sci. Food Agric. 2020, 80, 1219–1229. [Google Scholar] [CrossRef]
- Liu, L.; Zhao, Q.; Liu, T.; Zhao, M. Dynamic surface pressure and dilatational viscoelasticity of sodium caseinate/xanthan gum mixtures at the oil-water interface. Food Hydrocoll. 2011, 25, 921–927. [Google Scholar] [CrossRef]
- Patino, J.M.R.; Nino, M.R.R.; Sanchez, C.C. Adsorption of whey protein isolate at the oil-water interface as a function of processing conditions: A rheokinetic study. J. Agric. Food Chem. 1999, 47, 2241–2248. [Google Scholar] [CrossRef]
- Nino, M.R.R.; Sanchez, C.C.; Ruiz-Henestrosa, V.P.; Patino, J.M.R. Milk and soy protein films at the air-water interface. Food Hydrocoll. 2005, 19, 417–428. [Google Scholar]
- Macritchie, F. Proteins at interfaces. Adv. Protein Chem. 1978, 32, 283–326. [Google Scholar]
- Tang, C.H.; Shen, L. Role of conformational flexibility in the emulsifying properties of bovine serum albumin. J. Agric. Food Chem. 2013, 61, 3097–3110. [Google Scholar] [CrossRef]
- Tang, C.H.; Shen, L. Dynamic adsorption and dilatational properties of BSA at oil/water interface: Role of conformational flexibility. Food Hydrocoll. 2015, 43, 388–399. [Google Scholar] [CrossRef]
- Graham, D.E.; Phillips, M.C. Proteins at liquid interfaces: III. Molecular structures of adsorbed films. J. Colloid Interface Sci. 1979, 70, 427–439. [Google Scholar] [CrossRef]
- Patino, J.; Ortiz, S.; Sánchez, C.; Niño, M.; Añón, M. Dynamic properties of soy globulin adsorbed films at the air–water interface. J. Colloid Interface Sci. 2003, 268, 50–57. [Google Scholar] [CrossRef] [PubMed]
- Zhang, J.; Zhang, W.-G.; Hao, J.; Li, X.-Y.; Xu, D.-X.; Cao, Y.-P. In vitro digestion of solid-in-oil-in-water emulsions for delivery of CaCO3. Food Hydrocoll. 2022, 129, 107605. [Google Scholar] [CrossRef]
- Astwood, J.D.; Leach, J.N.; Fuchs, R.L. Stability of food allergens to digestion in vitro. Nat. Biotechnol. 1996, 14, 1269–1273. [Google Scholar] [CrossRef] [PubMed]


Publisher’s Note: MDPI stays neutral with regard to jurisdictional claims in published maps and institutional affiliations. |
© 2022 by the authors. Licensee MDPI, Basel, Switzerland. This article is an open access article distributed under the terms and conditions of the Creative Commons Attribution (CC BY) license (https://creativecommons.org/licenses/by/4.0/).
Share and Cite
Zhang, J.; Li, G.; Cao, Y.; Xu, D. The Improvement of Dispersion Stability and Bioaccessibility of Calcium Carbonate by Solid/Oil/Water (S/O/W) Emulsion. Foods 2022, 11, 4044. https://doi.org/10.3390/foods11244044
Zhang J, Li G, Cao Y, Xu D. The Improvement of Dispersion Stability and Bioaccessibility of Calcium Carbonate by Solid/Oil/Water (S/O/W) Emulsion. Foods. 2022; 11(24):4044. https://doi.org/10.3390/foods11244044
Chicago/Turabian StyleZhang, Jie, Gongwei Li, Yanping Cao, and Duoxia Xu. 2022. "The Improvement of Dispersion Stability and Bioaccessibility of Calcium Carbonate by Solid/Oil/Water (S/O/W) Emulsion" Foods 11, no. 24: 4044. https://doi.org/10.3390/foods11244044