Article

Street Food in Malaysia: What Are the Sodium Levels?

by
Hasnah Haron
1,*,
Zainorain Natasha Zainal Arifen
1,
Suzana Shahar
2,
Hamdan Mohamad
3,
Siti Farrah Zaidah Mohd Yazid
3,
Viola Michael
4,
Rabindra Abeyasinghe
5,
Tanaka Taketo
5 and
Kathy Trieu
6
1
Nutritional Sciences Programme, Centre for Healthy Ageing and Wellness (H-Care), Faculty of Health Sciences, Universiti Kebangsaan Malaysia, Kuala Lumpur 50300, Malaysia
2
Dietetic Programme, Centre for Healthy Ageing and Wellness (H-Care), Faculty of Health Sciences, Universiti Kebangsaan Malaysia, Kuala Lumpur 50300, Malaysia
3
Non-Communicable Disease Section, Disease Control Division, Ministry of Health, Malaysia, Putrajaya 62584, Malaysia
4
Enforcement Section, Allied Health Sciences Division, Ministry of Health, Malaysia, Putrajaya 62050, Malaysia
5
Representative Office for Malaysia, Brunei Darussalam, and Singapore, World Health Organization, Cyberjaya 63000, Malaysia
6
The George Institute for Global Health, Newtown, NSW 2042, Australia
*
Author to whom correspondence should be addressed.
Foods 2022, 11(23), 3791; https://doi.org/10.3390/foods11233791
Submission received: 5 October 2022 / Revised: 14 November 2022 / Accepted: 21 November 2022 / Published: 24 November 2022
(This article belongs to the Special Issue Food Components in Health Promotion and Disease Prevention)

Abstract

:
Street food is a major source of food in middle- and low-income countries as it is highly accessible and inexpensive. However, it is usually perceived as unhealthy due to the high levels of sodium, sugar, and fat content. However, there is little analytical data on the sodium levels in the street foods of Malaysia. This study started with a survey to determine the most frequently available street foods in every state in Malaysia, followed by food sampling and the analysis of sodium (reported mg/100 g sample). Street food in the snack category contained the highest amount of sodium (433 mg), followed by main meals (336.5 mg) and desserts (168 mg). Approximately 30% of the local street food in this study was deep-fried. Snacks from processed food (8%) contained high sodium content (500–815 mg). Fried noodles and noodle soup contained the highest amount of sodium (>2000 mg sodium) based on per serving. Most main dishes that use a variety of sauces contained high amounts of sodium. These findings were recorded in the Malaysian Food Composition Database. Moreover, this study could raise awareness and serve as baseline data for future interventions on the sodium content in the street foods of Malaysia.

Graphical Abstract

1. Introduction

According to the World Health Organization Report [1], non-communicable diseases (NCD) account for more than 70% of all deaths globally. Additionally, the number of NCD deaths is rising, and is expected to reach 52 million by 2030 [2]. In Malaysia, approximately 85,000 deaths were due to NCDs [1]. The Malaysian Community Salt Study [3], a population-based survey, reported that Malaysian adults consume a high amount of salt daily (7.9 g/day). This amount exceeds the recommended maximum salt intake of 5 g/day by the World Health Organization [4], resulting in hypertension, which affects one in three Malaysian adults [5]. Hypertension increases the risk of stroke, heart disease, and chronic kidney disease [6,7,8].
Due to the high burden of disease associated with excess salt intake, the Ministry of Health Malaysia (MOH) developed a national salt reduction strategy in 2010, to reduce daily salt intake by 30% by 2025 [9]. A proposed approach is the monitoring of sodium content in foods, which is then recorded in the available Malaysian Food Composition Database (MyFCD). This information is critical for food and health education, food research, and change monitoring. Since the implementation of the salt reduction strategy, sodium intake is monitored from the nutrition labels of packaged foods [9]. Nevertheless, little is known about the sodium content in local street foods [10]. This information is important because street foods are an increasingly common food source due to their accessibility, convenience, low cost, availability, and wide range of options [11]. Thus, this study aimed to determine the most frequently available street foods in every state in Malaysia and their sodium content. This data will be useful in developing effective strategies to reduce the salt content in local street foods.

2. Materials and Methods

Malaysia comprises 13 states and 3 federal territories (Kuala Lumpur, Labuan, and Putrajaya). The total population of Malaysia in 2022 is estimated at 32.7 million as compared to 32.6 million in 2021, with an annual population growth rate of 0.2%. The highest percentage distribution by ethnic group is Bumiputra (69.9%), followed by Chinese (22.8%), Indians (6.6%), and others (0.7%) [12]. In 2021, 77.7% of Malaysia’s total population lived in urban areas and cities [13]. There is currently no specific legislation for street foods and their sodium content. Street food stalls are randomly distributed throughout the cities and villages.
Data collection was carried out in two phases. Phase I was a survey to determine the most frequently available street food in all 13 states and the federal territory of Kuala Lumpur. This survey started in early 2020 but was stopped due to a series of nationwide lockdowns. The survey resumed in December 2020 when the government allowed interstate travel once more. This was followed by Phase II, where street foods in all states of Malaysia were sampled from May to December 2021. The analysis of the sodium content in all samples started in early 2022. The flowchart of the whole study is illustrated in Figure S1. The procedures in this study were approved by the Research Ethics Committee of the National University of Malaysia with reference number UKM PPI/111/8/JEP-2020-433.

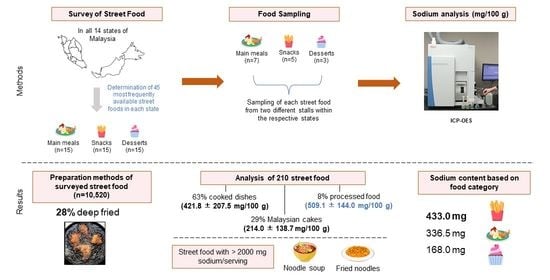
2.1. Phase I: Survey of Street Foods in All States of Malaysia

Phase I of this study was a field survey of locally available street foods conducted in 13 states and the federal territory of Kuala Lumpur in Malaysia. Street food is described as ready-to-eat food and beverages made and sold by vendors and hawkers, especially in the street and other similar public places. Based on the definition by the Food & Agriculture Organization (FAO) [14], street food can be distinguished from formal food service operations (e.g., cafes and restaurants) and includes foods from pushcarts, bicycles, baskets, balancing poles, or stalls without four permanent walls. The criteria for the street food stall to be selected in the study was one that did not have a fixed building or was confined within four walls (based on the definition by the FAO). This included individual stalls and stalls in the day and night markets. For each state, the operational night and morning markets were identified from the city council websites. A few night or morning markets in every state were surveyed.
A survey form (Table S1) was used to record information about all street foods available from each location, such as the state, district, name of the street food, category of the street food (e.g., main meal, snack, or dessert), and the preparation method. The total frequency of each street food surveyed in each state was determined. The top 15 most frequently available street foods among each of the categories for every state were then identified and listed. The street foods selected were also based on the expected sodium content (e.g., desserts composed mostly of sugar were not included).

2.2. Phase II: Food Sampling

2.2.1. Sampling the Three Categories of Street Food Samples for Each State

A total of 15 frequently available street foods (7 main meals, 5 snacks, and 3 desserts), determined from the survey in Phase I, were sampled from every state. A total of 210 street food samples from all 14 states in Malaysia were analyzed for their sodium contents. The sampling of the street food was carried out according to a local method [15]. Each type of street food selected for sodium analysis was purchased from two different stalls within the same state. Since food sampling was carried out during the COVID-19 pandemic, the operating hours of street food stalls were affected and some of the stalls ceased operation. Thus, this study was limited by the availability of food. After purchasing the street food samples, they were stored in an ice box and transported (5 °C for 1.5 h) to the laboratories to protect the food from spoilage.

2.2.2. Preparation of Street Food Samples for Sodium Analysis

Preparation and analysis of street food samples were conducted in the food analysis laboratory based on the method in [15]. Each sample was weighed together with the packaging still intact using the top pan balance. Inedible portions (e.g., bones) were identified and removed. Following this, the same type of street food that was purchased from two different stalls was mixed and homogenized in a food processor. The homogenized samples were then kept in an airtight container and stored in a −20 ℃ freezer, before preparation for sodium analysis. Approximately 1–3 g samples were weighed into a 50 mL polypropylene tube, and 30 mL of 30% nitric acid was added into the tube for wet digestion. The closed tube was placed on a hot block at 95 °C for 1.5 h. The tube was then cooled to room temperature and topped up to 50 mL with deionized water. The stock standard used for sodium analysis had a concentration of 10,000 ppm. A series of intermediate standards (i.e., 0.1, 0.5, 1.0, 2.0, 5.0, 10, 20, 30, 50, and 100 ppm) were prepared from the stock standard. Each intermediate standard was prepared in a 1 L volumetric flask with diluted nitric acid. The sodium content was then analyzed in duplicates using inductively coupled plasma–optical emission spectrometry (Agilent Technologies, Santa Clara, CA, USA, 5100 ICP-OES) based on the protocol in [16]. Each sample was analyzed in duplicate and reported as mean ± standard deviation. The LOD and LOQ of this instrument were 0.0454 and 0.1610 mg/kg, respectively.

2.2.3. Sodium Content Classification

There is no classification standard for high sodium ready-to-eat foods (i.e., street foods) in Malaysia. The sodium classification in Malaysia is meant for packaged foods with nutritional labeling. These packaged foods can be classified as low sodium (<120 mg/100 g sample), very low sodium (<40 mg/100 g sample), or sodium-free (5 mg/100 g sample). Hence, this study utilized the UK’s traffic light labeling scheme for classifying low sodium (<120 mg/100 g sample), medium sodium (between 120 and 600 mg/100 g sample), and high sodium (>600 mg/100 g sample) foods [17]. This classification is in line with the classifications used by the Food and Drugs (Composition and Labeling) Regulations in Hong Kong [18] and China (GB/T 23789-2009) [19].

2.3. Statistical Analyses

Here, IBM (Armonk, NY, USA) Statistical Package for Social Sciences (SPSS) version 25.0 was used to analyze the data. For Phase I, a descriptive test was performed to analyze the 15 most common street foods in Malaysia and sort them by food categories. The test included the preparation method, type, and category of the selected street foods. For Phase II, a descriptive test was used to analyze the average sodium content found in the selected street foods. Inferential statistical analysis, such as the one-way ANOVA test, was used to compare the average sodium content between the selected foods according to the food category and group. If the food groups and categories had unequal sample sizes and both one-way ANOVA and homogeneity of variance were significant, a Games–Howell post hoc test was performed to identify the specific differences between the three groups and categories.

3. Results

A total of 68 districts with 380 street food locations were surveyed. The highest number of locations surveyed (184 locations) was in Johor, whereas the lowest (4 locations) was in Kelantan. Among the total 10,520 types of street food surveyed in all states of Malaysia, the most common category of street food was snacks (40%), followed by main meals (37%), and then desserts (23%) (Table 1). Based on the survey, the main cooking method for street foods was deep-frying (28%), followed by steaming (13.3%), pan frying (11.1%), boiling (10.5%), grilling (9.4%), stir-frying (7.3%), stewing (6.1%), fermenting (5.3%), baking (4.9%), simmering (2.3%), roasting (9.4%), braising (9.4%), smoking (0.1%), and blanching (0.1%)
A total of 210 samples were analyzed. There were 41 types of street foods from more than 1 state and 53 types of street foods from 1 particular state. The sodium content of similar street foods was averaged. The study reported the average sodium content in all 94 types of street foods as being in the range of 3.9–815.0 mg/100 g sample. Explanation on each street food can be found in Table S2.
The average sodium content of street foods between the East Coast and West Coast of Malaysia was compared based on the food categories (21 and 63 main meals, 15 and 42 snacks, and 9 and 27 desserts, respectively). The sodium content in all three food categories between the two coasts was not significantly different (p > 0.05). On both coasts, snacks had the highest sodium content (411–506 mg/100 g sample), followed by main meals (327–392 mg/100 g sample), and then desserts (186–191 mg/100 g sample).
The average sodium content of street foods between West and East Malaysia was compared based on the food categories (84 and 14 main meals, 57 and 12 snacks, and 36 and 7 desserts, respectively). The average sodium content in the snack category for both West and East Malaysia had the highest sodium content (450–481 mg/100 g sample), followed by main meals (376–404 mg/100 g sample), and then desserts (92–190 mg/100 g sample). The sodium content in the snacks and main meal categories between the two regions was not significantly different (p > 0.05). However, only desserts in West Malaysia reported significantly higher sodium content (190 mg/100 g sample) as compared to East Malaysia (92 mg/100 g sample) (p < 0.05).
Table 2 displays the average sodium content for each food category and food group. For food categories, snacks contained the highest average amount of sodium, followed by main meals and desserts. Both main meals and snacks contained significantly higher sodium contents when compared to desserts (p < 0.05). For food groups, processed foods contained the highest average amount of sodium compared to cooked dishes and local cakes. Most of the street foods were cooked dishes (63%).
Table 3 shows the sodium content in processed foods prepared as street foods. Only 8% of the street foods were prepared using processed foods, and most of the processed foods had medium to high sodium contents (451–815 mg sodium/100 g sample). Fried fish balls, fried chicken with cheese, fried crab meatballs, fried sausages, and fried chicken balls were categorized as processed foods prepared as street foods that contain high amounts of sodium (605–815 mg/ 100 g sample). The other street food samples in the snack category with high sodium content were fish-based snacks or keropok lekor (780.4 ± 109.5 mg/100 g sample) and seaweed pickles (761.0 ± 42.4 mg/100 g sample).
Table 4 shows that 46% of the main meal category consisted of noodles and rice, such as fried noodles, noodles with gravy, fried rice, and other cooked rice, which contained medium to high amounts of sodium. Noodle-based dishes, such as soto, fried noodles, bakso, and noodle soup contained more than 2000 mg sodium per serving. Fried kuey teow, char kuey teow, and noodles with curry or soy sauce gravy contained almost 2000 mg sodium per serving. Laksa (rice-based noodles with gravy made from fish) from Penang and Perak also contained almost 2000 mg sodium per serving.
Table 5 displays the rest of the street foods that contained medium sodium content (121.5–586.5 mg/100 g sample). This included 19 snacks, 15 desserts, and 7 main meals. There were 17 low sodium street foods (<120 mg/100 g sample) in this study. Most of the low sodium street foods (82.4%) were in the dessert category (Table 5).

4. Discussion

The highest percentage of street food surveyed in this study was from Selangor (22%), followed by Kuala Lumpur (20%). This could be attributed to Selangor having the highest population in 2022 [12]. Furthermore, Selangor and Kuala Lumpur were surveyed before the first nationwide lockdown in March 2021, when most street food stalls were still operating as usual. Main meals (37%) and snacks (40%) were the most common street food categories available in this study. This was similar to another study in Harare, Zimbabwe, where main meals (70.8%) and snacks (20.8%) were the most common [20]. Almost half of the main meals sampled in this study consisted of rice or noodle dishes. Rice is the staple food for half the world’s population, and it is cultivated predominantly in Asia [21].
The majority of street foods in this study were cooked foods (63%), and deep-frying was the most common street food preparation method. Deep-fat frying may be defined as immersing foodstuff in edible oil or fat at 150–200 °C [22]. Deep-fat frying is one of the most well-accepted methods in both local and international food preparation because of its convenience and highly stimulating properties (e.g., aroma and taste) to consumers [23].
There was no difference in the sodium contents of main meals and snacks between the different coasts or parts of Malaysia. This could be due to the same preparation methods being used for the common street foods. In the present study, 41 types of street foods were found across Malaysia. Nasi lemak, fried vermicelli, fried mihun, and fried chicken were frequently available across 12, 11, and 10 of the surveyed states, respectively. This was in line with a previous study, where nasi lemak and fried bihun were among the top 10 most consumed breakfast foods among adults in Malaysia [24].
Street foods with high amounts of sodium (605–805 mg/100 g sample) included processed foods, such as sausages, fish balls, chicken balls, and crab meat. The highest sodium content was found in fish balls. Fish balls are made from processed fish and can be eaten alone (fried) or in soups (boiled). The high sodium content in commercial fish balls accounts for the additional salt or sodium polyphosphate in preservatives and flavor enhancers [25]. Processed foods made from fish and chicken have sodium levels in the range of 479–500 mg/100 g sample, as listed on the nutrition labels [26].
The other street food in the snack category (452–584 mg sodium/100 g sample) included processed foods, such as beef burgers, nuggets, and sausages with cheese. Keropok lekor contained the second-highest sodium content in the snack category. It is a traditional fish-based snack from Terengganu and is popular on the East Coast of Peninsular Malaysia. Keropok lekor is commonly sold in all states of Malaysia, especially at roadside stalls and night markets [27]. In Phase I of this study, keropok lekor was frequently available in seven states, such as Johor, Sabah, Sarawak, Federal Territory of Kuala Lumpur, Negeri Sembilan, Terengganu, and Pahang. It is made from a mixture of minced/processed fish, sago flour, salt, monosodium glutamate, sugar, and ice-cold water [28]. The main source of sodium in the making of keropok lekor are salt and monosodium glutamate [29].
Seaweed pickle is very popular among the Bajau, and it was only collected in Sabah. Since it is harvested from the sea, the sea salt resulted in the high sodium content of the seaweed pickle. Normally, the seaweed pickle is served as a side dish to be taken with rice. Fried chicken with cheese was the fourth highest street food with a sodium content in this range. The average sodium content in 112 cheese products sold in major supermarkets in Malaysia was reported to be relatively high (856.54 mg/100 g sample) [26].
Fried noodles contained a high sodium content due to the ingredients used in the preparation stage. Fried noodles are often cooked with many sauces, especially soy sauce, thick soy sauce, oyster sauce, and chili sauce which contribute to high sodium content [30,31,32]. The sauces were added to add more flavor to the food and to make it more palatable to eat [33,34]. Additionally, the noodles contain a relatively high amount of salt in themselves [35,36]. Kolo mee or mi kolok is a signature dish from Sarawak. It has a high sodium content, which may be attributed to the sweet and salty soy sauce used in the dish. In Malaysia, the addition of salt and salty sauces to foods has been identified as the major source of sodium in the Malaysian diet [37].
In this study, 35% of main meals contained sodium content exceeding the recommended intake of 2000 mg sodium/day. However, the percentage is lower compared to the 62.6% of main meal dishes in 192 restaurants in China [38]. Soto is mainly composed of broth, meat, and vegetables, with a high sodium content (>3000 mg) per serving. Other noodle-based dishes, such as bakso (noodles with meatballs), noodle soup, fried kuey teow, and char kuey teow also contained high amounts of sodium (2000–2500 mg) per serving. This could be linked to the sauces (e.g., soy sauce and oyster sauce) used in their preparation. Soy sauce has been reported as one of the main sources of sodium during the preparation of ready-to-eat dishes in China [38]. Laksa uses fish-based broth that contains 1800–1900 mg sodium per serving, which could also be due to the use of shrimp paste.
Other rice-based dishes, such as nasi tomato (rice cooked with tomato paste), contained the highest sodium content, followed by nasi minyak (rice cooked with ghee and other condiments) and nasi lemak (rice cooked with coconut milk) with fried chicken (1400–1900 mg/serving). A normal set of nasi lemak (rice and condiment only) contained 643 mg sodium per serving. Nasi kerabu, a blue-colored rice dish that is eaten with dried fish or fried chicken (a source of sodium) and crackers (another source of sodium), contained 1000 mg of sodium per serving.
In the dessert category, apam balik contained medium sodium content. Apam balik is a popular Malaysian traditional cake and is included as a Malaysian Heritage Food [39,40]. Apam balik, apam balik with egg, and apam balik with cheese contained 581, 600, and 1343 mg sodium per serving, respectively. The sodium content is directly associated with the use of sodium bicarbonate in its preparation. The addition of cheese to the snack and dessert categories increased the sodium content to the range of 35–55%.
Street foods with a sodium content of less than 120 mg sodium/100 g sample were found mainly in the dessert category. Kamaruzaman et al. stated that as many as 70 types of traditional Malay cakes are still popularized in Malaysia [41]. The basic ingredients used to produce traditional sweet cakes are sugar, coconut milk, brown sugar, and Malacca sugar [42]. Thus, not as much salt is used in dessert preparation as compared to main meals and snacks. Snacks that are popular among the Chinese population, such as chee cheong fun (rice noodle roll) and beh hua chee (fried dough), also fall in this range (120 mg sodium/100 g sample).
The data on the sodium content in street food can be updated in the Malaysian Food Composition Database (MyFCD). This ensures that the nutrients contained in these street foods are known to the public, and that healthier food selections can be made. Apart from that, these findings justify the importance of salt reduction during the preparation of street foods and look into the use of salt substitutes, such as potassium chloride. Studies have demonstrated that replacing salt with sodium-reduced and potassium-enriched salt substitutes is better for the general population [43]. This study can serve as a foundation for future related studies.

5. Conclusions

Local street food in the snack and main meal categories contained significantly higher amounts of sodium than in dessert foods. Main meal street foods (e.g., noodle soup and fried noodles) and processed foods that were used in the preparation of street foods contain high amounts of sodium per serving, which exceeded the recommended daily sodium intake. Keropok lekor is one of the high-salt snack which is available in most states that should be targeted for reformulation and monitored over time. It is vital to disseminate information on the high sodium content of local street food to the public through advertisements and social media. The public needs to be informed about the sodium content in a single serving of street food to limit their sodium intake to 2000 mg daily. This practice will help reduce the sodium consumption in the Malaysian population and subsequently, will reduce the prevalence of NCDs.

Supplementary Materials

The following supporting information can be downloaded at: https://www.mdpi.com/article/10.3390/foods11233791/s1, Figure S1: Flowchart of data collection in Phase I and Phase II, Table S1: Streetfood Survey Form, Table S2: Explanation of each street food.

Author Contributions

Conceptualization, H.H. and K.T.; Data curation, H.H. and T.T.; Formal analysis, H.H. and Z.N.Z.A.; Funding acquisition, V.M., R.A. and K.T.; Investigation, H.H., Z.N.Z.A., H.M. and K.T.; Methodology, H.H. and Z.N.Z.A.; Project administration, H.H.; Resources, R.A. and T.T.; Supervision, H.H.; Validation, Z.N.Z.A.; Writing—original draft, H.H.; Writing—review and editing, Z.N.Z.A., S.S., H.M., S.F.Z.M.Y., V.M. and K.T. All authors have read and agreed to the published version of the manuscript.

Funding

This research was funded by the World Health Organization LINK grant (NNN-2020-045).

Institutional Review Board Statement

The study was conducted in accordance with the Declaration of Helsinki, and approved by the Research Ethics Committee of the National University of Malaysia with reference number UKM (PPI/111/8/JEP-2020-433, Date of approval: 10 March 2022–9 March 2025).

Data Availability Statement

Data is contained within the article or supplementary material.

Acknowledgments

The authors would like to acknowledge all representatives from local universities (USM, UMT, UNISZA, IIUM, UMS, UUM) and MARDI Sarawak who have helped with food sampling and preparation before analyses. We would also like to thank Jacqueline Lo Ying Ru from the World Health Organization, who was involved at the beginning of the study.

Conflicts of Interest

The authors declare no conflict of interest.

References

  1. World Health Organization. Noncommunicable Diseases. Available online: https://www.who.int/health-topics/noncommunicable-diseases (accessed on 4 October 2022).
  2. European Commission. Noncommunicable Diseases—NCDs. Available online: https://knowledge4policy.ec.europa.eu/foresight/topic/shifting-health-challenges/non-communicable-diseases-ncds_en (accessed on 4 October 2022).
  3. Institute for Public Health (IPH). Population-Based Salt Intake Survey to Support the National Salt Reduction Programme For Malaysia (Malaysian Community Salt Survey—MyCoSS). Available online: https://iku.moh.gov.my/images/IKU/Document/SALT-FULL_Report.pdf (accessed on 4 October 2022).
  4. World Health Organization. Guideline: Sodium Intake for Adults and Children; World Health Organization: Geneva, Switzerland, 2012. [Google Scholar]
  5. Institute for Public Health (IPH). National Health and Morbidity Survey 2019 (NHMS 2019). Vol. I: Non-Communicable Diseases, Risk Factors & Other Health Problems; Institute for Public Health: Shah Alam, Malaysia, 2019. [Google Scholar]
  6. O’Seaghdha, C.M.; Perkovic, V.; Lam, T.H.; McGinn, S.; Barzi, F.; Gu, D.F.; Cass, A.; Suh, I.; Muntner, P.; Giles, G.G.; et al. Blood pressure is a major risk factor for renal death: An analysis of participants from the Asia-Pacific region. Hypertension 2009, 54, 509–515. [Google Scholar] [CrossRef] [Green Version]
  7. O’Donnell, M.J.; Xavier, D.; Liu, L.; Zhang, H.; Chin, S.L.; Rao-Melacini, P.; Rangarajan, S.; Islam, S.; Pais, P.; McQueen, M.J.; et al. Risk factors for ischaemic and intracerebral haemorrhagic stroke in 22 countries (the INTERSTROKE study): A case-control study. Lancet 2010, 376, 112–123. [Google Scholar] [CrossRef] [PubMed]
  8. Fuchs, F.D.; Whelton, P.K. High blood pressure and cardiovascular disease. Hypertension 2020, 75, 285–292. [Google Scholar] [CrossRef]
  9. Ministry of Health Malaysia. Reducing Salt Intake in Malaysia: An Interim Evaluation of What Works; Ministry of Health Malaysia: Putrajaya, Malaysia, 2019. [Google Scholar]
  10. Steyn, N.P.; McHiza, Z.; Hill, J.; Davids, Y.D.; Venter, I.; Hinrichsen, E.; Opperman, M.; Rumbelow, J.; Jacobs, P. Nutritional contribution of street foods to the diet of people in developing countries: A systematic review. Public Health Nutr. 2014, 17, 1363–1374. [Google Scholar] [CrossRef] [PubMed] [Green Version]
  11. Khongtong, J.; Ab Karim, S.; Othman, M.; Bolong, J. Consumption pattern and consumers’ opinion toward street food in Nakhon Si Thammarat province. Thail. Int. Food Res. J. 2014, 21, 125–130. [Google Scholar]
  12. Department of Statistics Malaysia, Current Population Estimates, Malaysia 2022. Available online: https://www.dosm.gov.my/v1/index.php?r=column/pdfPrev&id=dTZXanV6UUdyUEQ0SHNWOVhpSXNMUT09 (accessed on 11 November 2022).
  13. Statista 2022. Available online: https://www.statista.com/statistics/455880/urbanization-in-malaysia (accessed on 8 November 2022).
  14. Food & Agriculture Organization. Selling Street and Snack Foods. Food and Agriculture Organization: Rome, Italy; Available online: http://www.fao.org/3/i2474e/i2474e.pdf (accessed on 11 June 2020).
  15. Tee, E.S.; Isma, M.N.; Nasir, M.A.; Khatijah, I. Nutrient Composition of Malaysian Foods, 4th ed.; Institute for Medical Research: Kuala Lumpur, Malaysia, 1997; ISBN 967-99909-8-2. [Google Scholar]
  16. Chevallier, E.; Chekri, R.; Zinck, J.; Guérin, T.; Noël, L. Simultaneous determination of 31 elements in foodstuffs by ICP-MS after closed-vessel microwave digestion: Method validation based on the accuracy profile. J. Food Compos. Anal. 2015, 41, 35–41. [Google Scholar] [CrossRef]
  17. Guide To Creating A Front-Of-Pack Nutrition Label. 2013. Available online: https://www.gov.uk/government/uploads/system/uploads/attachment_data/file/207588/FINAL_VERSION_OF_THE_2013_FOP_GUIDANCE_-_WEB.pdf (accessed on 10 May 2022).
  18. Wong, A.S.C.; Coyle, D.H.; Wu, J.H.Y.; Louie, J.C.Y. Sodium concentration of pre-packaged foods sold in Hong Kong. Public Health Nutr. 2020, 23, 2804–2810. [Google Scholar] [CrossRef] [PubMed]
  19. National Standards of the People’s Republic of China. Foods with Low-Sodium Content; General Administration of Quality Supervision, Inspection and Quarantine of the People’s Republic of China, Standardization Administration of The People’s Republic of China: Beijing, China, 2009; 448p. [Google Scholar]
  20. Njaya, T. Operations of street food vendors and their impact on sustainable urban life in high density suburbs of Harare, in Zimbabwe. Asian J. Econ. Model. 2014, 2, 18–31. [Google Scholar] [CrossRef]
  21. Radin, F.; Mou, L.T.; Rahmat, S.R.; Gunaratne, M.S. Paddy, rice and food security in Malaysia: A review of climate change impacts. Cogent Soc. Sci. 2020, 6, 1818373. [Google Scholar]
  22. Rossi, M.; Alamprese, C.; Ratti, S. Tocopherols and tocotrienols as free radical scavengers in refined vegetable oils and their stability during deep-fat frying. Food Chem. 2007, 102, 812–817. [Google Scholar] [CrossRef]
  23. Bordin, K.; Tomihe Kunitake, M.; Kazue Aracava, K.; Silvia Favaro Trindade, C. Changes in food caused by deep fat frying—A review. Arch. Latinoam. Nutr. 2013, 63, 5–13. [Google Scholar] [PubMed]
  24. Tarmizi, S.F.M.; Daud, N.M.; Rahman, H.A. Malaysian ready-to-eat cooked dishes: Consumption patterns among adults and nutrient composition of selected highly consumed dishes. Malays. Appl. Biol. 2020, 49, 61–70. [Google Scholar] [CrossRef]
  25. Huda, N.; Alistair, T.L.J.; Lim, H.W.; Nopianti, R. Some quality characteristics of Malaysian commercial fish sausage. Pak. J. Nutr. 2012, 11, 798–803. [Google Scholar] [CrossRef] [Green Version]
  26. Haron, H.; Hiew, I.; Shahar, S.; Michael, V.; Ambak, R.A. Survey on salt content labeling of the processed food available in Malaysia. Int. J. Environ. Res. Public Health 2020, 17, 2469. [Google Scholar] [CrossRef] [PubMed] [Green Version]
  27. Wan Md. Hatta, W.N.N.M. The Authentic of ‘Keropok lekor’ Process. Arts Des. Stud. 2015, 27, 1–6. [Google Scholar]
  28. Murad, N.S.; Ismail, M.A.; Nor-Khaizura, M.A.R.; Ismail-Fitry, M.R. The effect of mixing time and mixing sequence during processing on the physicochemical and sensory properties of keropok lekor. J. Sci. Technol. 2017, 9, 88–95. [Google Scholar]
  29. Zim, A.F.M.I.U.; Akter, A.; Ali, M.S.; Anik, W.A.; Ahmed, S.; Zamri, A.I.B. Proximate composition, texture analysis and sensory evaluation of keropok lekor formulated with herbs and spices. Food Res. 2019, 3, 635–639. [Google Scholar] [CrossRef]
  30. Ahmad, M.H.; Man, C.S.; Othman, F.; He, F.J.; Salleh, R.; Noor, N.S.M.; Kozil, W.N.K.W.; MacGregor, G.; Aris, T. High sodium food consumption pattern among Malaysian population. J. Health Popul. Nutr. 2021, 40, 4. [Google Scholar] [CrossRef]
  31. Shahar, S.; You, Y.X.; Zainuddin, N.S.; Michael, V.; Ambak, R.; Haron, H.; He, F.J.; MacGregor, G.A. Sodium content in sauces—A major contributor of sodium intake in Malaysia: A cross-sectional survey. Br. Med. J. Open 2019, 9, e025068. [Google Scholar] [CrossRef] [Green Version]
  32. Tan, W.L.; Azlan, A.; Noh, M.F.M. Sodium and potassium contents in selected salts and sauces. Int. Food Res. J. 2016, 23, 2181–2186. [Google Scholar]
  33. Spence, C. The psychology of condiments: A review. Int. J. Gastron. Food Sci. 2018, 11, 41–48. [Google Scholar] [CrossRef]
  34. Thomas, A.; Boobyer, C.; Borgonha, Z.; van den Heuvel, E.; Appleton, K.M. Adding flavours: Use of and attitudes towards sauces and seasonings in a sample of community-dwelling UK older adults. Foods 2021, 10, 2828. [Google Scholar] [CrossRef]
  35. Hou, G.G. Asian Noodle Manufacturing: Ingredients, Technology, and Quality; Elsevier: Amsterdam, The Netherlands, 2020. [Google Scholar]
  36. Wieser, H.; Koehler, P.; Scherf, K.A. Wheat-An Exceptional Crop: Botanical Features, Chemistry, Utilization, Nutritional and Health Aspects. Elsevier: Amsterdam, The Netherlands, 2020. [Google Scholar]
  37. Khor, G.L.; Hsu-Hage, B.H.; Wahlqvist, M.L. Dietary practices in nutritional transition: The case of Malaysian urban Chinese. Ecol. Food Nutr. 1998, 36, 463–489. [Google Scholar] [CrossRef] [Green Version]
  38. Du, W.; Wang, H.; Zhang, J.; Wei, N.; Li, Y.; Tan, M.; Zhang, P.; He, F.J. Sodium content of restaurant dishes in China: A cross-sectional survey. Nutr. J. 2022, 21, 10. [Google Scholar] [CrossRef]
  39. Caliskan, A.; Abdullah, N.; Ishak, N. Chemical properties of leftover coconut pulp gluten free flour. Asian J. Arts 2020, 2, 33–43. [Google Scholar]
  40. Omar, S.R.; Omar, S.N. Malaysian heritage food (MHF): A review on its unique food culture, tradition and present lifestyle. Int. J. Herit. Art Multimed. 2018, 1, 1–15. [Google Scholar]
  41. Kamaruzaman, M.Y.B.; Ab Karim, S.; Ishak, F.A.B.C.; Arshad, M.M.B. The diversity of traditional Malay kuih in Malaysia and its potential. J. Ethn. Foods 2020, 7, 22. [Google Scholar] [CrossRef]
  42. Raji, M.N.A.; Ab Karim, S.; Ishak, F.A.C.; Arshad, M.M. Past and present practices of the Malay food heritage and culture in Malaysia. J. Ethn. Foods 2017, 4, 221–231. [Google Scholar] [CrossRef]
  43. Marklund, M.; Singh, G.; Greer, R.; Cudhea, F.; Matsushita, K.; Micha, R.; Brady, T.; Zhao, D.; Huang, L.; Tian, M.; et al. Estimated population wide benefits and risks in China of lowering sodium through potassium enriched salt substitution: Modeling study. BMJ 2020, 369, m824. [Google Scholar] [CrossRef]
Table 1. The total number of street foods surveyed in this study by food category, districts, and locations of every state.
Regions CoastsStatesNumber of
Districts Surveyed
Number of Locations SurveyedStreet Foods CategoryTotal Street Food by States
Main MealsSnacksDesserts
West
Malaysia
West CoastSelangor71779210005532345
Federal Territory of Kuala
Lumpur
7148839353282146
Negeri Sembilan16333305164802
Melaka 15203480156839
Johor 8194207220143570
Kedah 3111186435217
Perlis 28424720109
Perak 1140906537192
Penang 4341134443200
East CoastTerengganu 7104955043961395
Pahang 814362356241959
Kelantan 2492102172366
East
Malaysia
Not
applicable
Sabah 48545528137
Sarawak3151035783243
Total 6838038874234239910520
Table 2. The average sodium content in different street food categories and groups.
Food CategoryPercentage (%) Average Sodium Content (mg/100 g)
Snacks40433.0 ± 198.1 a
Main meals 37336.5 ± 148.2 a
Desserts 23168.0 ± 134.7 b
Food GroupPercentage (%)Average sodium content (mg/100 g)
Processed foods8509.1 ± 144.0 a
Cooked dishes 63421.8 ± 207.5 a
Local cakes29214.0 ± 138.7 b
a,b Different letters indicate significant differences across the column (p < 0.05), based on the Games–Howell post hoc test.
Table 3. Sodium content in processed food prepared as street food.
NoName of Street Food (n = Number of States in Which the Street Food Was
Sampled)
Street Food Categorymg Sodium/100 g (Mean ± std dev)mg Sodium/
Serving (Household Measurement)
1Fried fish ball (n = 3)Snack815.0 ± 47.71530.9 (6 pieces)
2Fried chicken with cheese (n = 1)Snack706.0 ± 24.01087.2 (1 piece)
3Fried crab meatball (n = 2)Snack690.5 ± 18.4553.6 (6 pieces)
4Fried sausage (n = 3)Snack690.3 ± 74.4683.4 (3 pieces)
5Fried chicken ball (n = 1)Snack605.5 ± 12.0601.3 (6 pieces)
6Beef burger (n = 1)Main meal584.0 ± 2.8584.0 (1 piece)
7Fried sausage with cheese (n = 1)Snack563.0 ± 9.9802.3 (3 pieces)
8Chicken nuggets (n = 5)Snack519.1 ± 73.8327.0 (3 pieces)
9Pizza (n = 1)Snack485.0 ± 12.75432.0 (1 whole regular)
10Chicken burger (n = 3)Main meal451.8 ± 102.0682.3 (1 piece)
Table 4. Sodium content in noodle and rice-based street food with high (>600 mg/ 100 g sample) and medium (120–599 mg/100 g sample) sodium contents.
High Sodium Content (>600 mg/100 g)
No.Name of Street Food (n = Number of States in Which the Street Food Was Sampled)Street Food Categorymg Sodium/100 g
(Mean ± Std Dev)
mg
Sodium/
Serving (Household Measurement)
1Fried noodles (n = 10)Main meal704.2 ± 225.42185.5 (1 plate)
2Kolo mee (n = 1)Main meal625.0 ± 1.41152.5 (1 bowl)
Medium Sodium Content (120–599 mg/100 g)
No.Name of Street Food (n = Number of States in Which the Street Food Was Sampled)Street Food Categorymg Sodium/100 g
(Mean ± Std Dev)
mg
Sodium/
Serving (Household Measurement)
1Bakso (n = 1)Main meal468.5 ± 3.52576.8 (1 bowl)
2Fried kuey teow (n = 7)Main meal437.1 ± 78.61477.8 (1 plate)
3Noodle soup (n = 1)Main meal431.0 ± 29.72249.8 (1 bowl)
4Char kuey teow (n = 2)Main meal418.3 ± 127.61565.5 (1 plate)
5Fried vermicelli @ fried mihun (n = 11) Main meal398.6 ± 133.6797.2 (1 plate)
6Soto (n = 1)Main meal377.0 ± 21.23168.7 (1 bowl)
7Fried rice (n = 2)Main meal374.8 ± 38.5749.5 (1 plate)
8Vermicelli soup @ mihun sup (n = 3)Main meal360.0 ± 78.82162.6 (1 bowl)
9Nasi lemak with fried chicken (n = 4)Main meal349.1 ± 76.21431.5 (1 plate)
10Nasi tomato (n = 1)Main meal345.5 ± 2.11935.7 (1 plate)
11Noodles with gravy (curry/soy sauce) (n = 4)Main meal336.6 ± 248.41830.8 (1 bowl)
12Nasi lemak (n = 12)Main meal321.7 ± 104.7643.4 (1 plate)
13Kuey teow soup (n = 1)Main meal307.0 ± 2.82076.4 (1 bowl)
14Laksa (Penang style) (n = 5)Main meal306.6 ± 93.11966.6 (1 bowl)
15Nasi minyak (n = 2)Main meal304.0 ± 46.01128.2 (1 plate)
16Nasi kerabu (n = 2)Main meal298.5 ± 64.3916.1 (1 plate)
17Chicken rice (n = 3)Main meal298.5 ± 25.1746.3 (1 plate)
18Laksa (Perak style) (n = 1)Main meal288.0 ± 0.01789.9 (1 bowl)
19Glutinous rice with rendang (meat cooked with spices) (n = 1)Main meal285.5 ± 17.7467.7 (1 set)
20Chicken porridge (n = 2)Main meal272.5 ± 0.7452.4 (1 bowl)
21Rice porridge (n = 3)Main meal245.5 ± 49.7407.5 (1 bowl)
22Glutinous rice with fried fish (n = 1)Main meal216.0 ± 8.5335.1 (1 pack)
23Spaghetti bolognese (n = 1)Main meal215.5 ± 13.41131.4 (1 plate)
24Laksam (n = 1)Main meal185.5 ± 0.7519.7 (1 bowl)
Table 5. Other street foods with medium (120–599 mg/100 g sample) and low (<120 mg/100 g sample) sodium contents.
Street Foods with Medium Sodium Content (120–599 mg/100 g Sample)
No.Name of Street Food (n = Number of States in Which the Street Food Was Sampled)Street Food Categorymg Sodium/100 g
(Mean ± Std Dev)
mg Sodium/Serving (Household
Measurement)
1Apam balik with cheese (n = 1)Dessert586.5 ± 12.01343.1 (1 piece)
2Kebab (n = 2)Main meal531.5 ± 89.1616.5 (1 piece)
3Kerepek (n = 1)Snack512.5 ± 61.571.8 (1 piece)
4Takoyaki (n = 4)Snack502.4 ± 95.3926.0 (6 pieces)
5Fried chicken (n = 10)Snack464.9 ± 118.3715.9 (1 piece)
6Fried chicken (non-meat parts) (n = 1)Snack461.5 ± 72.8113.1 (4 small pieces)
7Roti john (n = 2)Main meal412.0 ± 59.4696.3 (3 pieces)
8Satay (n = 2)Snack395.3 ± 177.8296.4 (5 sticks)
9Satar (n = 1)Snack390.5 ± 0.7338.3 (3 pieces)
10Kuih kacang (n = 1)Dessert384.5 ± 16.3339.9 (3 pieces)
11Cakoi (n = 2)Snack376.3 ± 223.1508.4 (3 pieces)
12Fried popiah (n = 1)Snack350.0 ± 7.1147.0 (1 piece)
13Pulut panggang (n = 1)Snack349.5 ± 3.5174.8 (1 piece)
14Putu piring (n = 1)Dessert334.5 ± 57.3184.0 (1 piece)
15Kuih bom (n = 1)Dessert327.0 ± 4.2143.9 (1 piece)
16Curry puff (n = 8)Snack305.0 ± 87.0146.5 (1 piece)
16Banana fritters with cheese (n = 1) Dessert293.0 ± 4.2193.4 (3 pieces)
17Murtabak (n = 2)Snack292.3 ± 188.4825.6 (1 piece)
18Jering rebus (n = 1)Snack291.5 ± 0.7145.8 (4 pieces)
19Kuih seri muka (n = 2) Dessert271.3 ± 73.2260.4 (1 piece)
20French fries with sauce (n = 1)Snack262.0 ± 7.1175.5 (1 small serving)
21Apam balik telur (n = 1)Snack262.0 ± 2.8600.0 (1 large piece)
22Roti canai (flat bread) (n = 2)Main meal262.0 ± 154.9220.1 (1 piece)
23Kuih akok (n = 2)Dessert259.3 ± 20.2375.3 (4 pieces)
24Donut (n = 4)Dessert254.9 ± 158.1188.6 (1 piece)
25Apam balik (n = 4)Dessert253.9 ± 76.1581.4 (1 large piece)
26Kuih cara berlauk ayam (n = 1)Snack246.5 ± 3.5310.6 (4 small pieces)
27Net crepes (Roti jala) (n = 2)Main meal240.8 ± 1.1584.9 (1 pack)
28Kuih tepung gomak (n = 1)Snack235.0 ± 12.7276.7 (4 pieces)
29Grilled chicken (small pieces) (n = 1)Snack229.5 ± 4.9581.0 (4 small pieces)
30Corn (savory) (n = 2)Snack220.9 ± 242.01361.3 (1 sheaf)
31Egg tart (n = 1)Dessert204.5 ± 9.2242.9 (1 piece)
32Kuih puteri ayu (n = 1)Dessert194.0 ± 2.8276.2 (4 pieces)
33Banana fritters (n = 4)Dessert160.3 ± 66.8105.8 (3 pieces)
34Chee cheong fun (n = 1)Snack146.0 ± 1.4826.0 (1 plate)
35Beh hua chee (n = 1)Snack138.5 ± 12.0305.4 (3 pieces)
36Kuih sagu (n = 1)Dessert138.0 ± 0.093.8 (1 piece)
37Kuih cek mek molek (n = 1)Dessert125.5 ± 0.7128.9 (4 pieces)
38Popcorn (n = 1)Dessert121.5 ± 6.4245.4 (1 container)
Street Foods with Low Sodium Content (<120 mg/100 g Sample)
No.Name of Street Food (n = Number of States in Which the Street Food Was Sampled)Street Food Categorymg Sodium/100 g
(Mean ± Std Dev)
mg Sodium/Serving (Household Measurement)
1Kuih keria (n = 1)Dessert119.5 ± 2.137.0 (1 piece)
2Cubed rice with peanut gravy (nasi impit) (n = 1)Main meal117.5 ± 0.758.8 (8 cubes)
3Kuih lepat (n = 2)Dessert109.2 ± 44.3126.6 (1 piece)
4Kuih calak kuda (n = 1)Dessert104.0 ± 0.099.8 (4 pieces)
5Kuih buah Melaka (n = 1)Dessert89.9 ± 0.613.5 (1 piece)
6Kuih lapis (n = 2)Dessert89.6 ± 93.989.6 (1 piece)
7Cekodok (n = 1)Dessert84.7 ± 33.025.4 (3 pieces)
8Steamed baozi with sweet fillings (n = 2)Dessert69.1 ± 27.534.6 (1 piece)
9Peneram (n = 1)Dessert59.1 ± 1.618.9 (5 small pieces)
10Cendol (n = 2)Dessert56.9 ± 2.8431.7 (1 bowl)
11Kuih apam (n = 1)Dessert56.1 ± 1.322.4 (3 pieces)
12Kuih jelurut (n = 1)Dessert49.8 ± 2.1101.6 (4 pieces)
13Tau fu fa (n = 1)Dessert6.4 ± 0.423.6 (1 container)
14Kuih penjaram (n = 1)Dessert5.3 ± 0.19.1 (4 pieces)
15Kuih angku (n = 1)Dessert5.2 ± 0.614.1 (4 pieces)
16Putu (n = 1)Main meal4.1 ± 0.27.2 (1 piece)
17Sianglag (n = 1)Main meal3.9 ± 0.74.9 (1 pack)
Publisher’s Note: MDPI stays neutral with regard to jurisdictional claims in published maps and institutional affiliations.

