

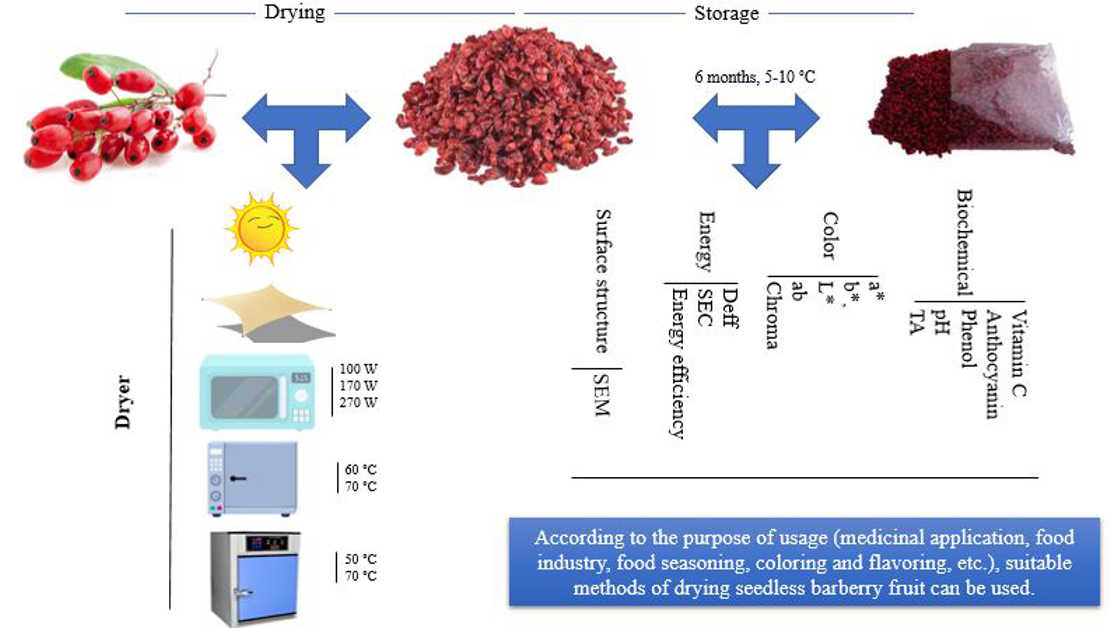
Interaction of Different Drying Methods and Storage on Appearance, Surface Structure, Energy, and Quality of Berberis vulgaris var. asperma
 , ,
, ,  and
and
Abstract
:
1. Introduction
2. Materials and Methods
2.1. Treatments
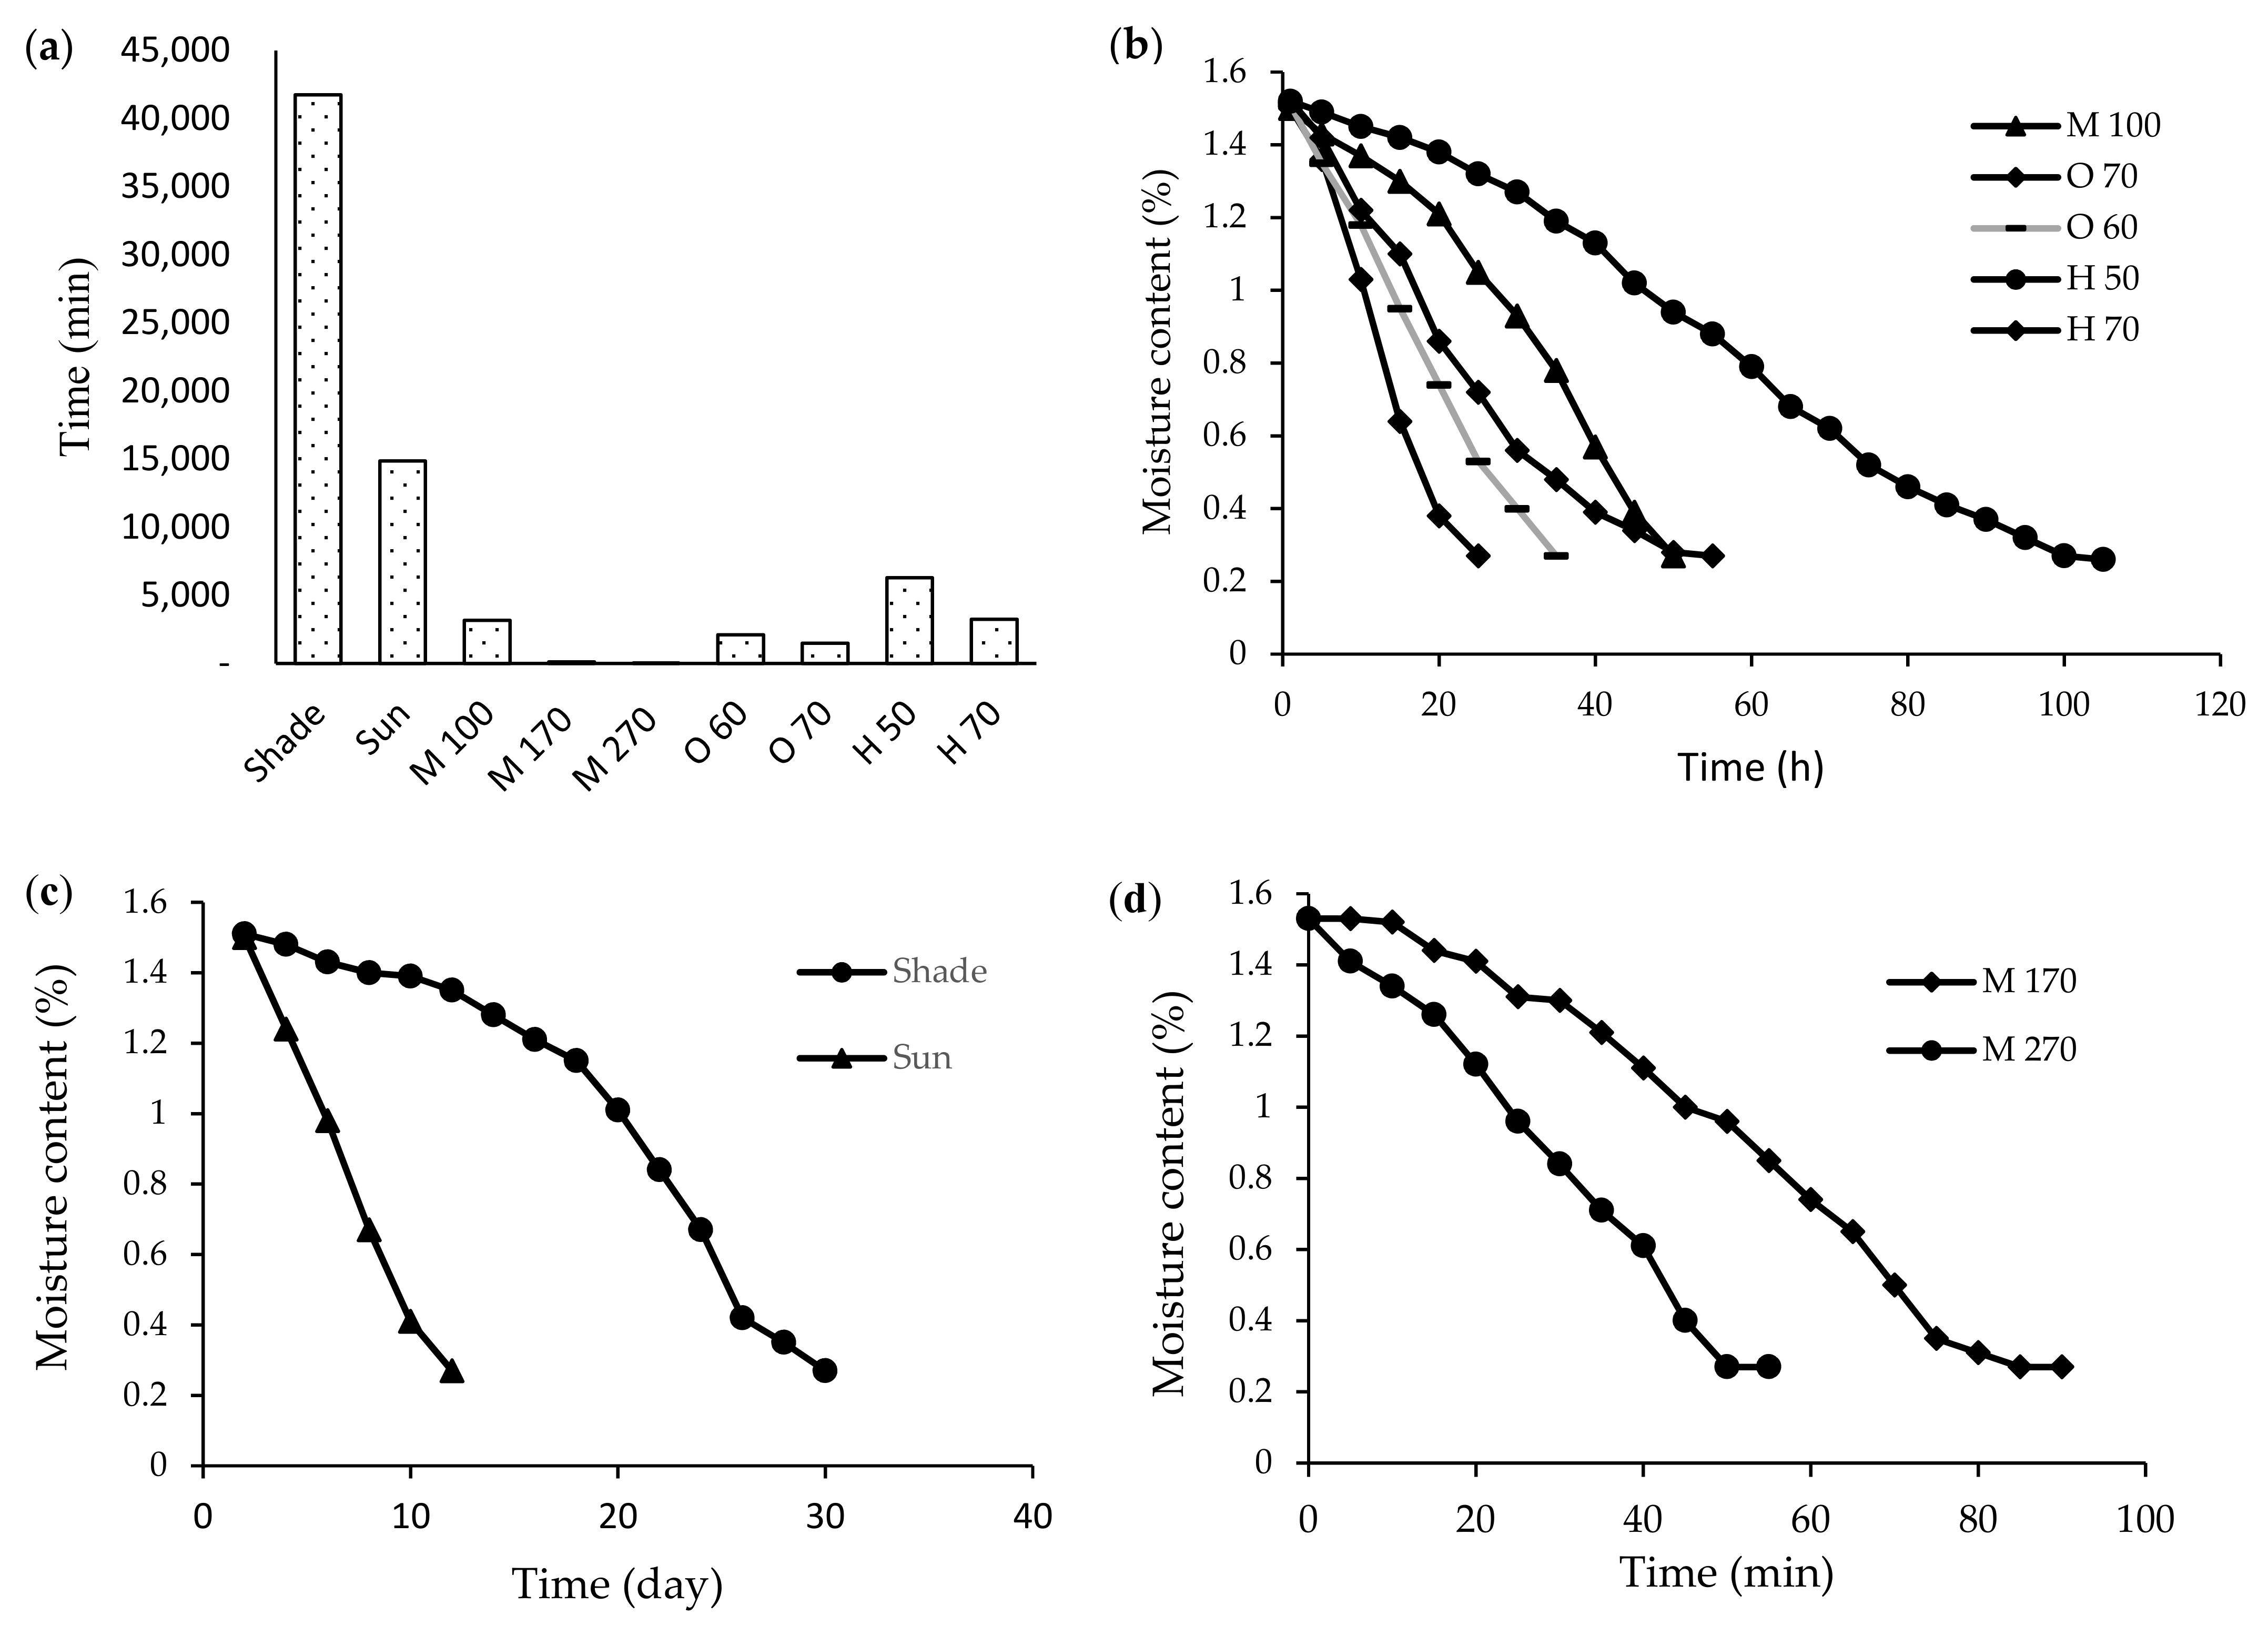
2.2. Drying Time
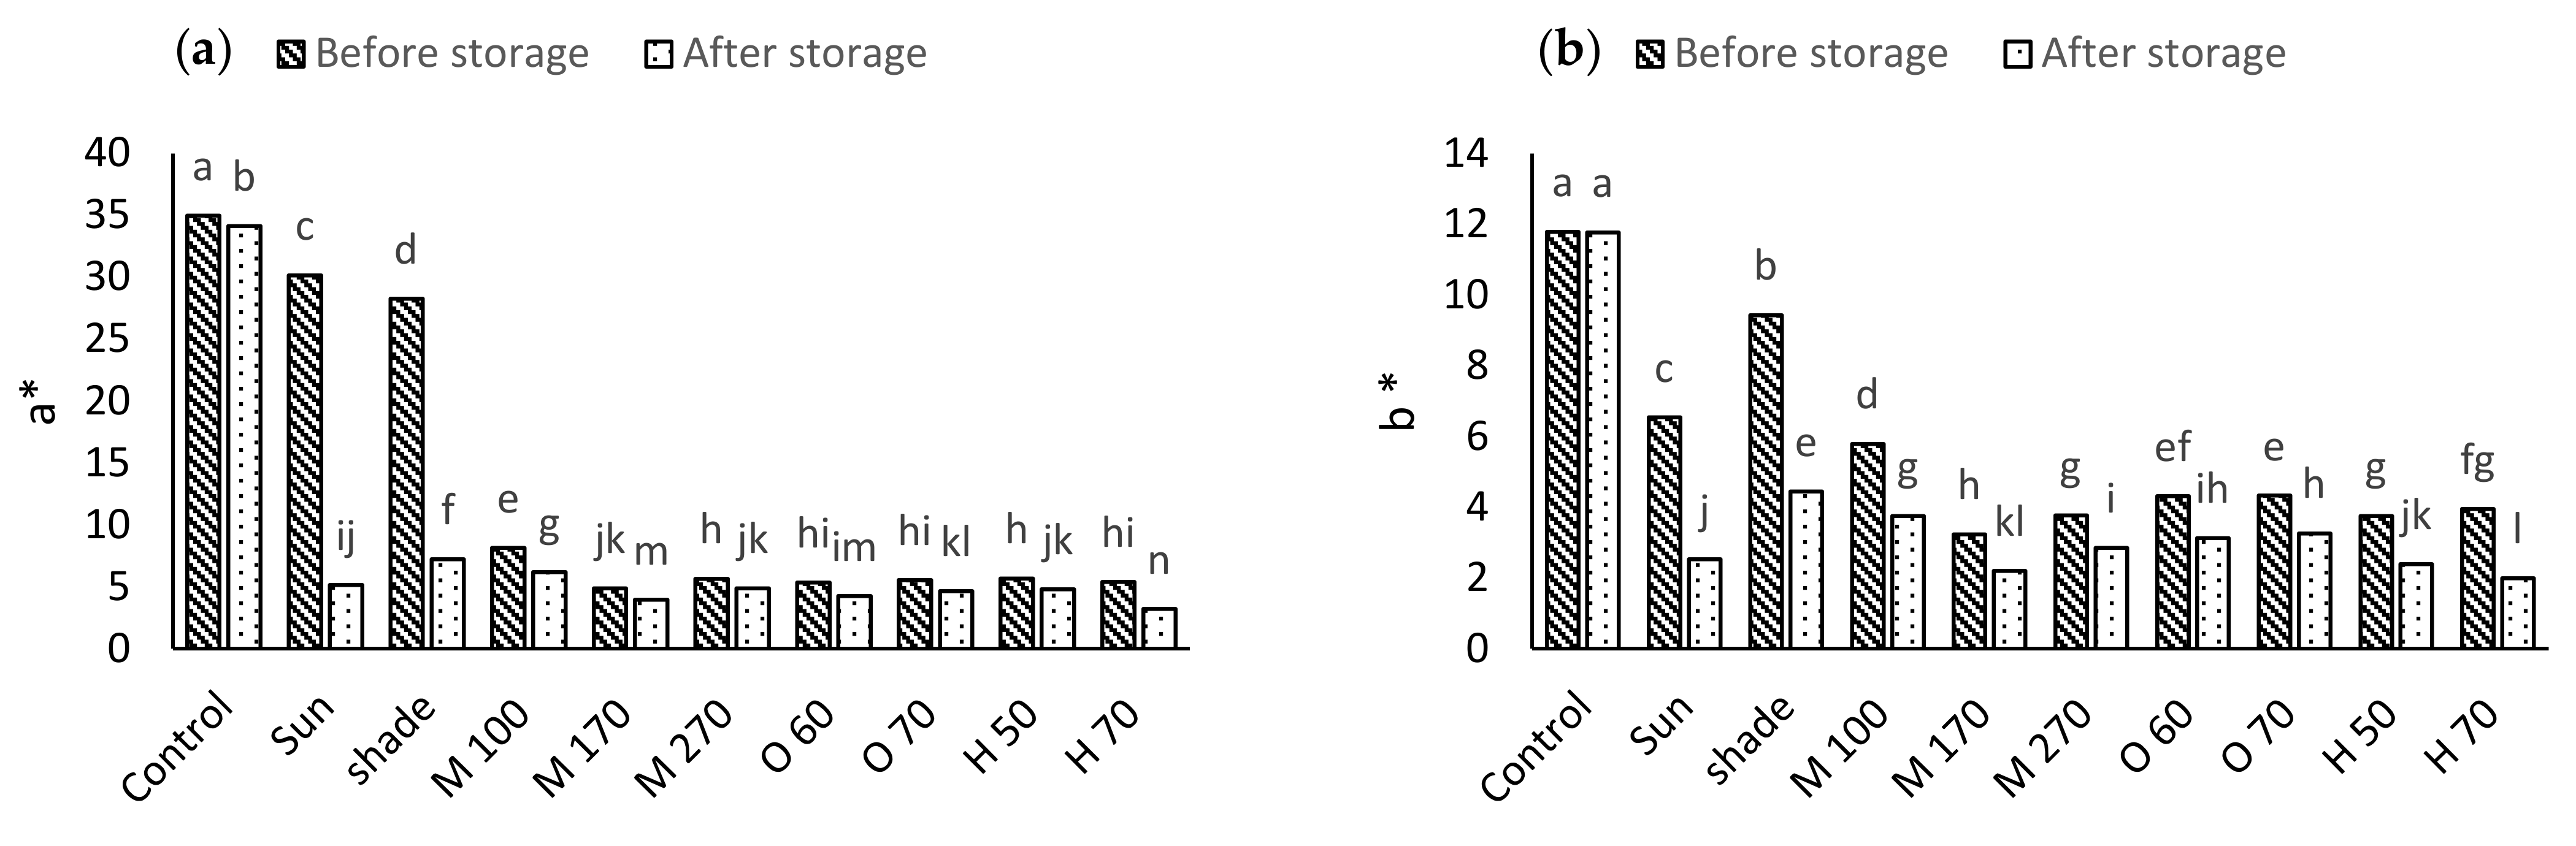
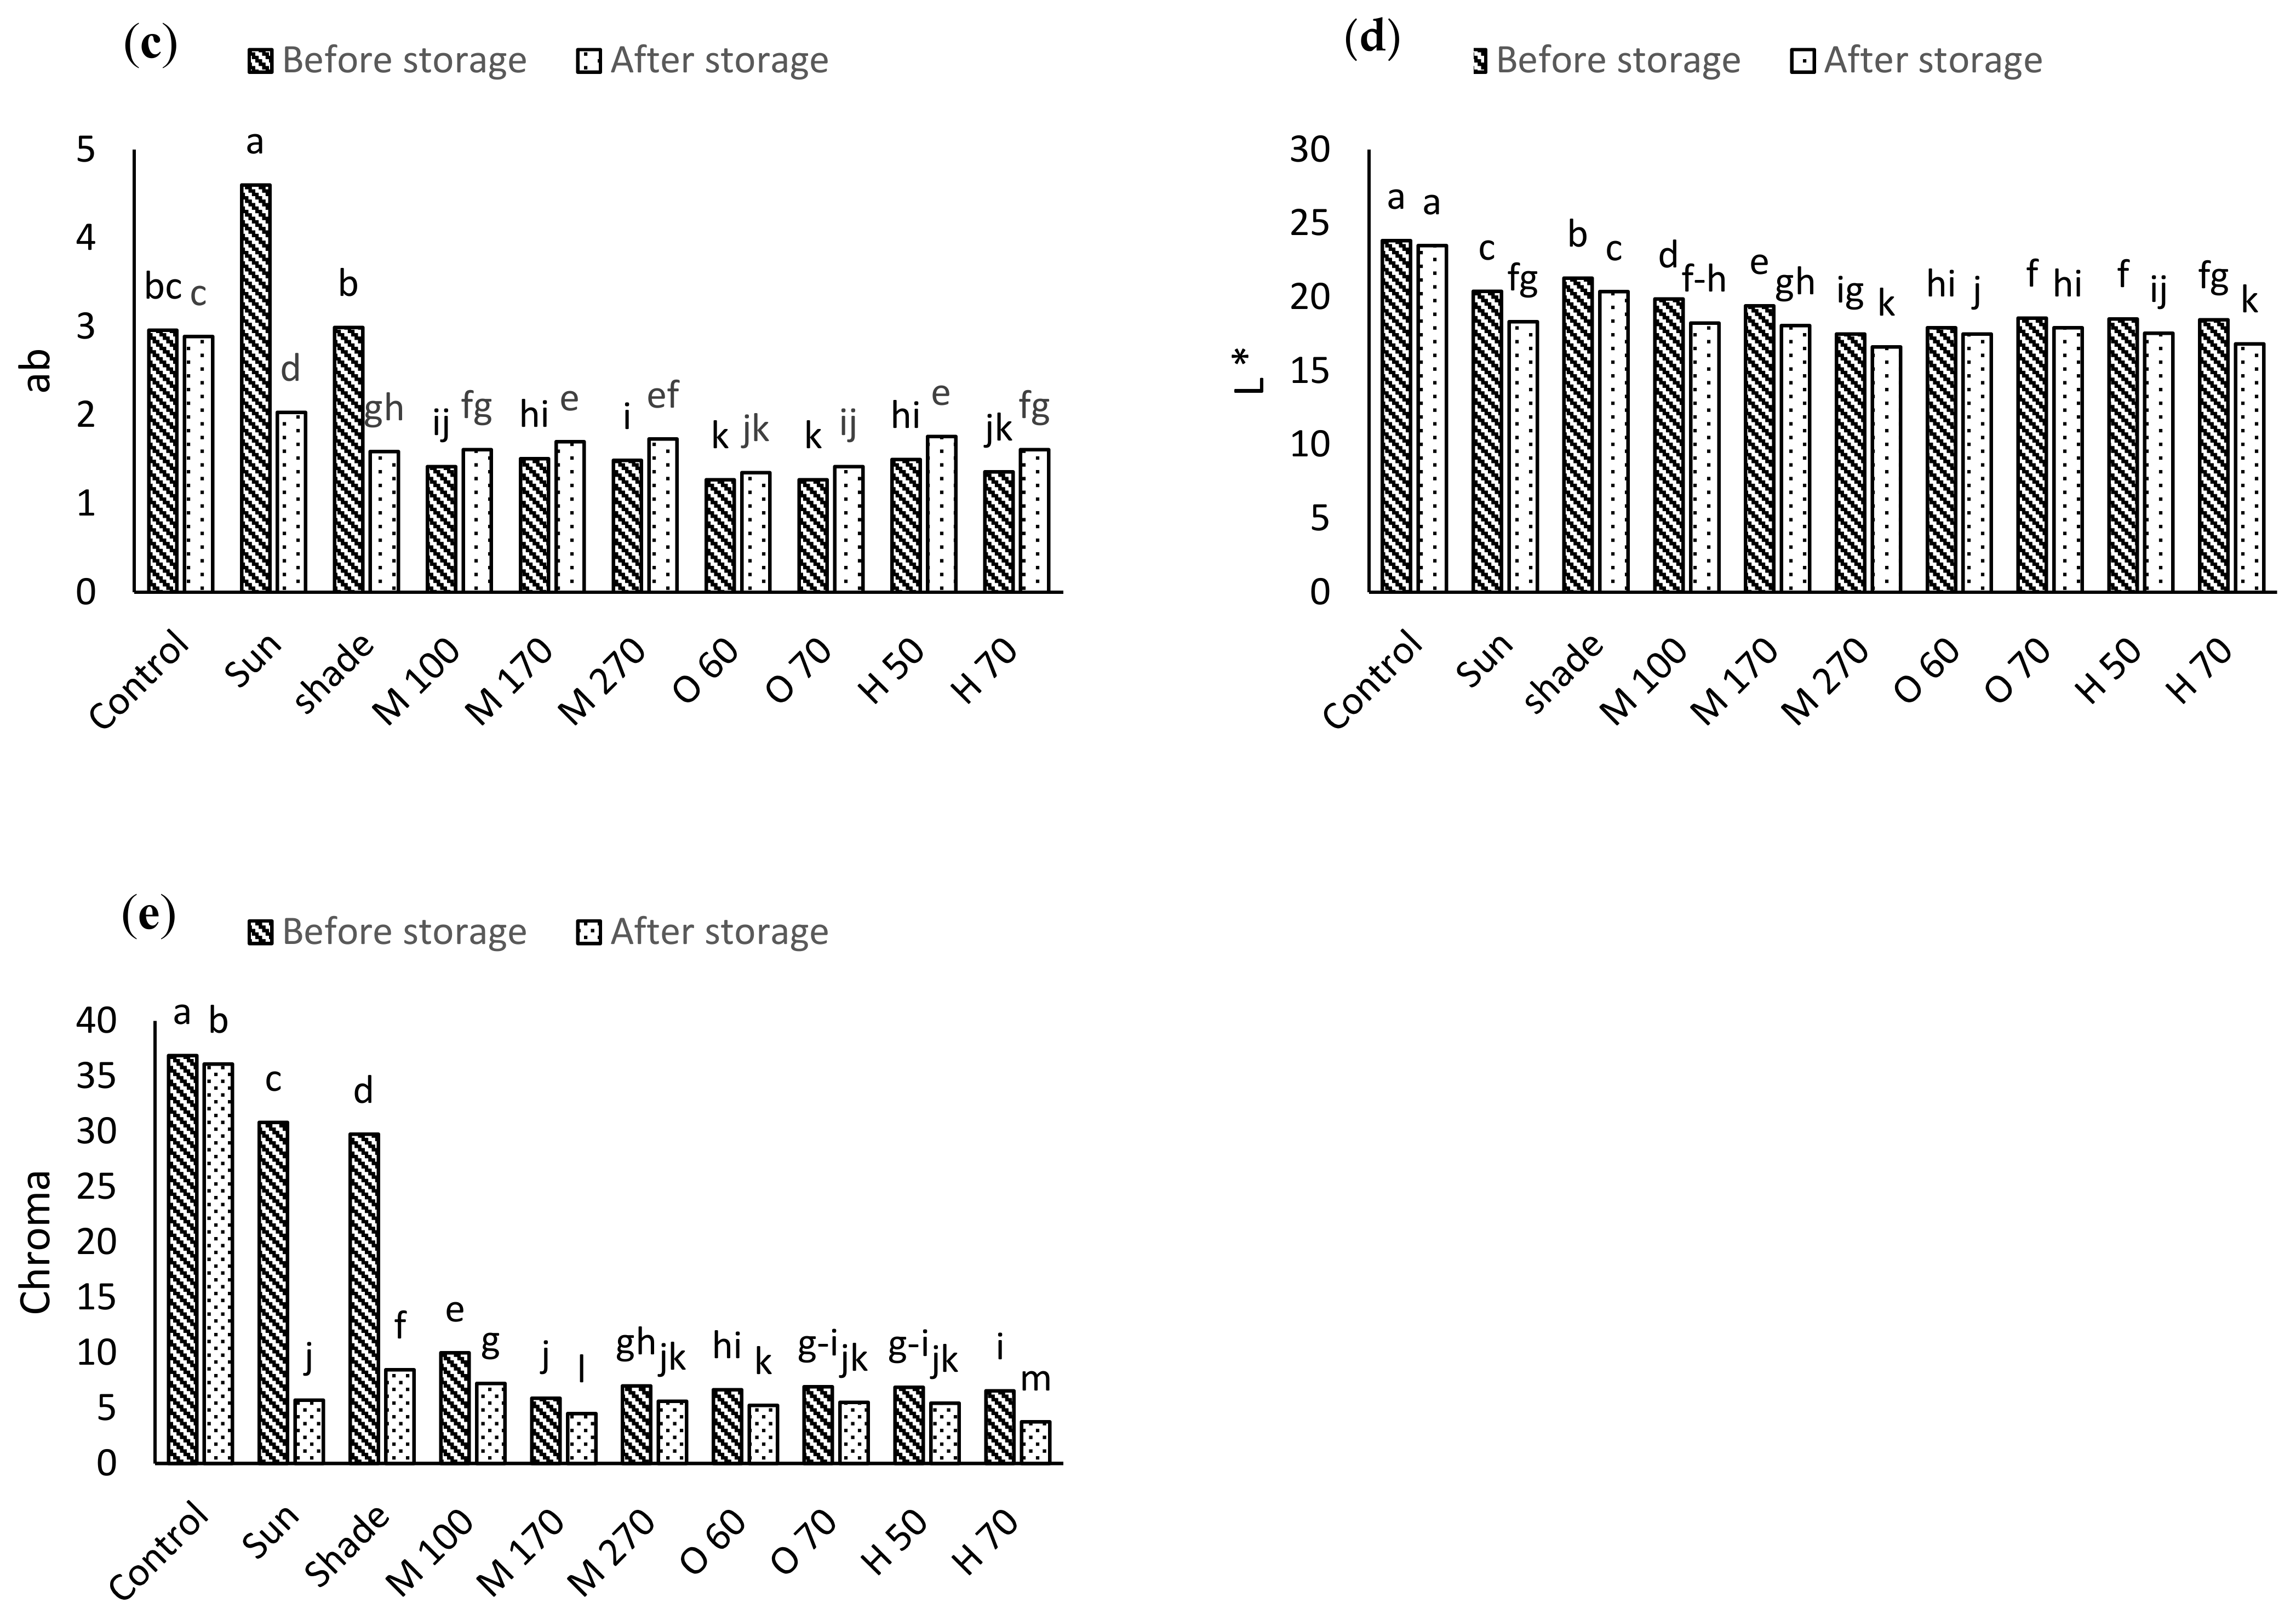
2.3. Color
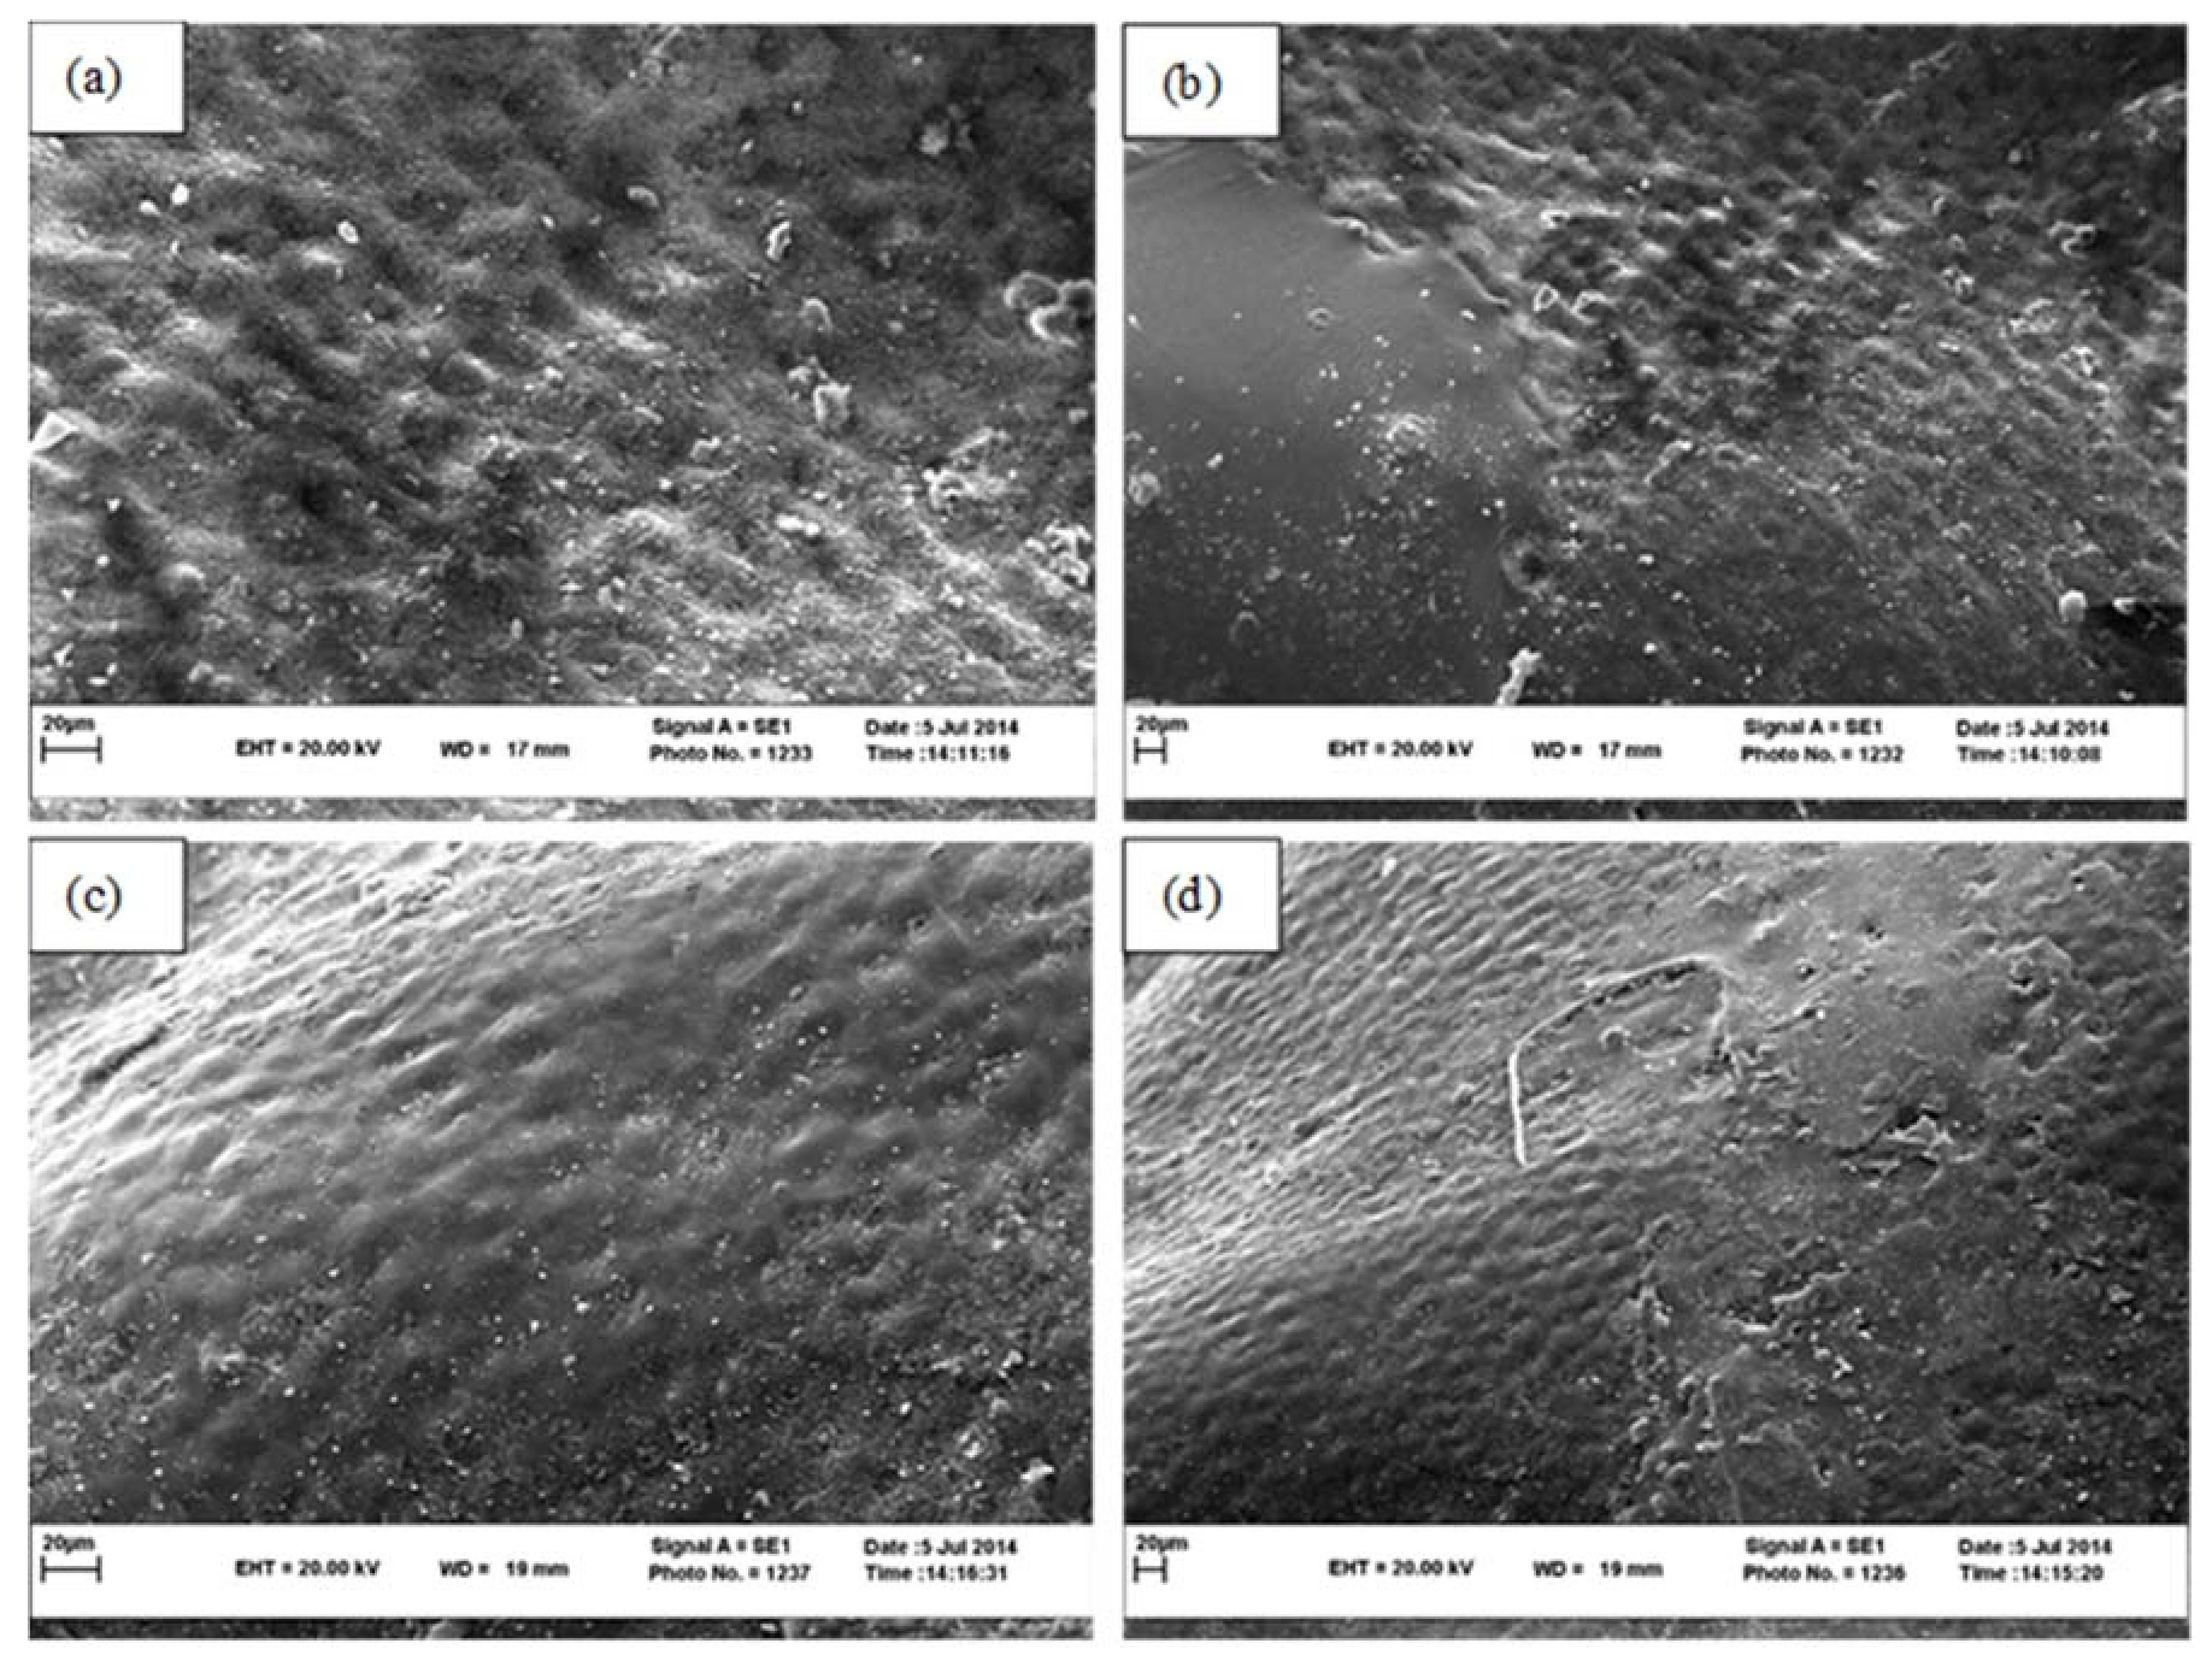
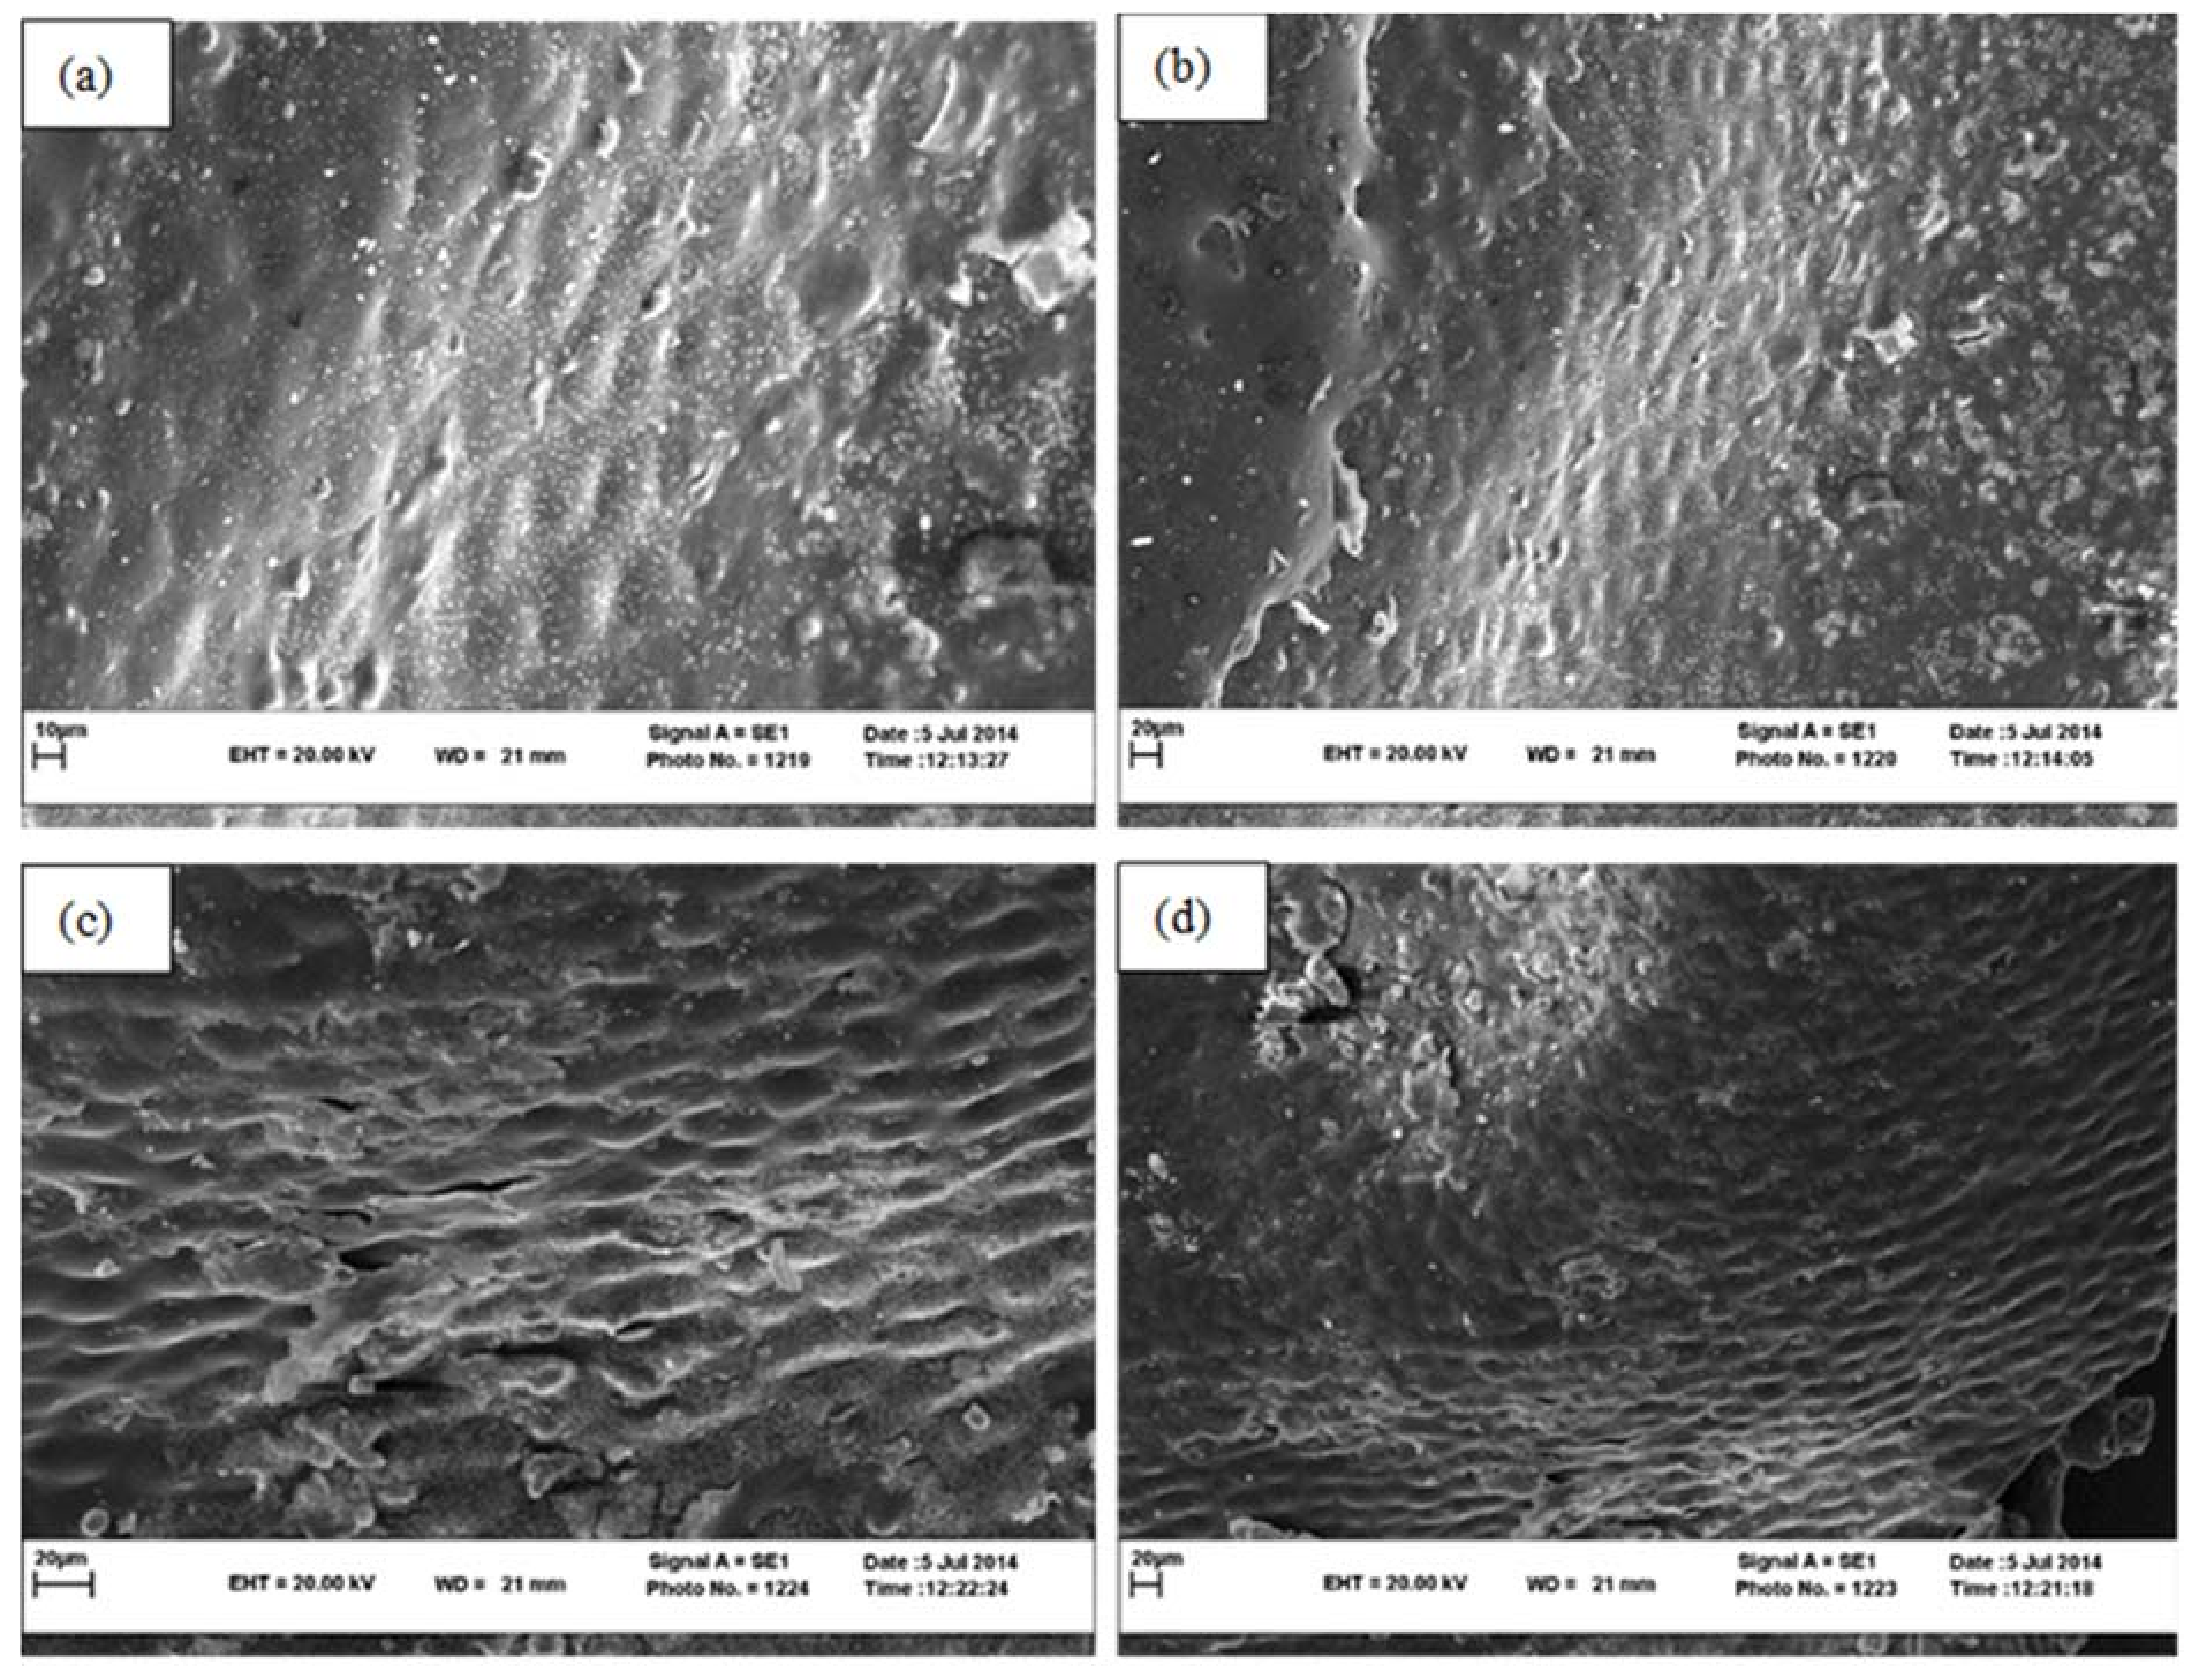
2.4. SEM Imaging
2.5. Anthocyanin Content
2.6. Total Phenol Content (TPC)
2.7. pH, TSS, and Titratable Acidity (TA)
2.8. Vitamin C Content
2.9. Effective Moisture Diffusivity Coefficient
2.10. Specific Energy Consumption (SEC)
2.11. Energy Efficiency (EE)
hf.g = (2.503 × 10³ − 2.386 (Tabs − 273.16), 337.72 < Tabs < 533.16
2.12. Statistical Analysis
3. Results and Discussion
3.1. Drying Time
3.2. Color
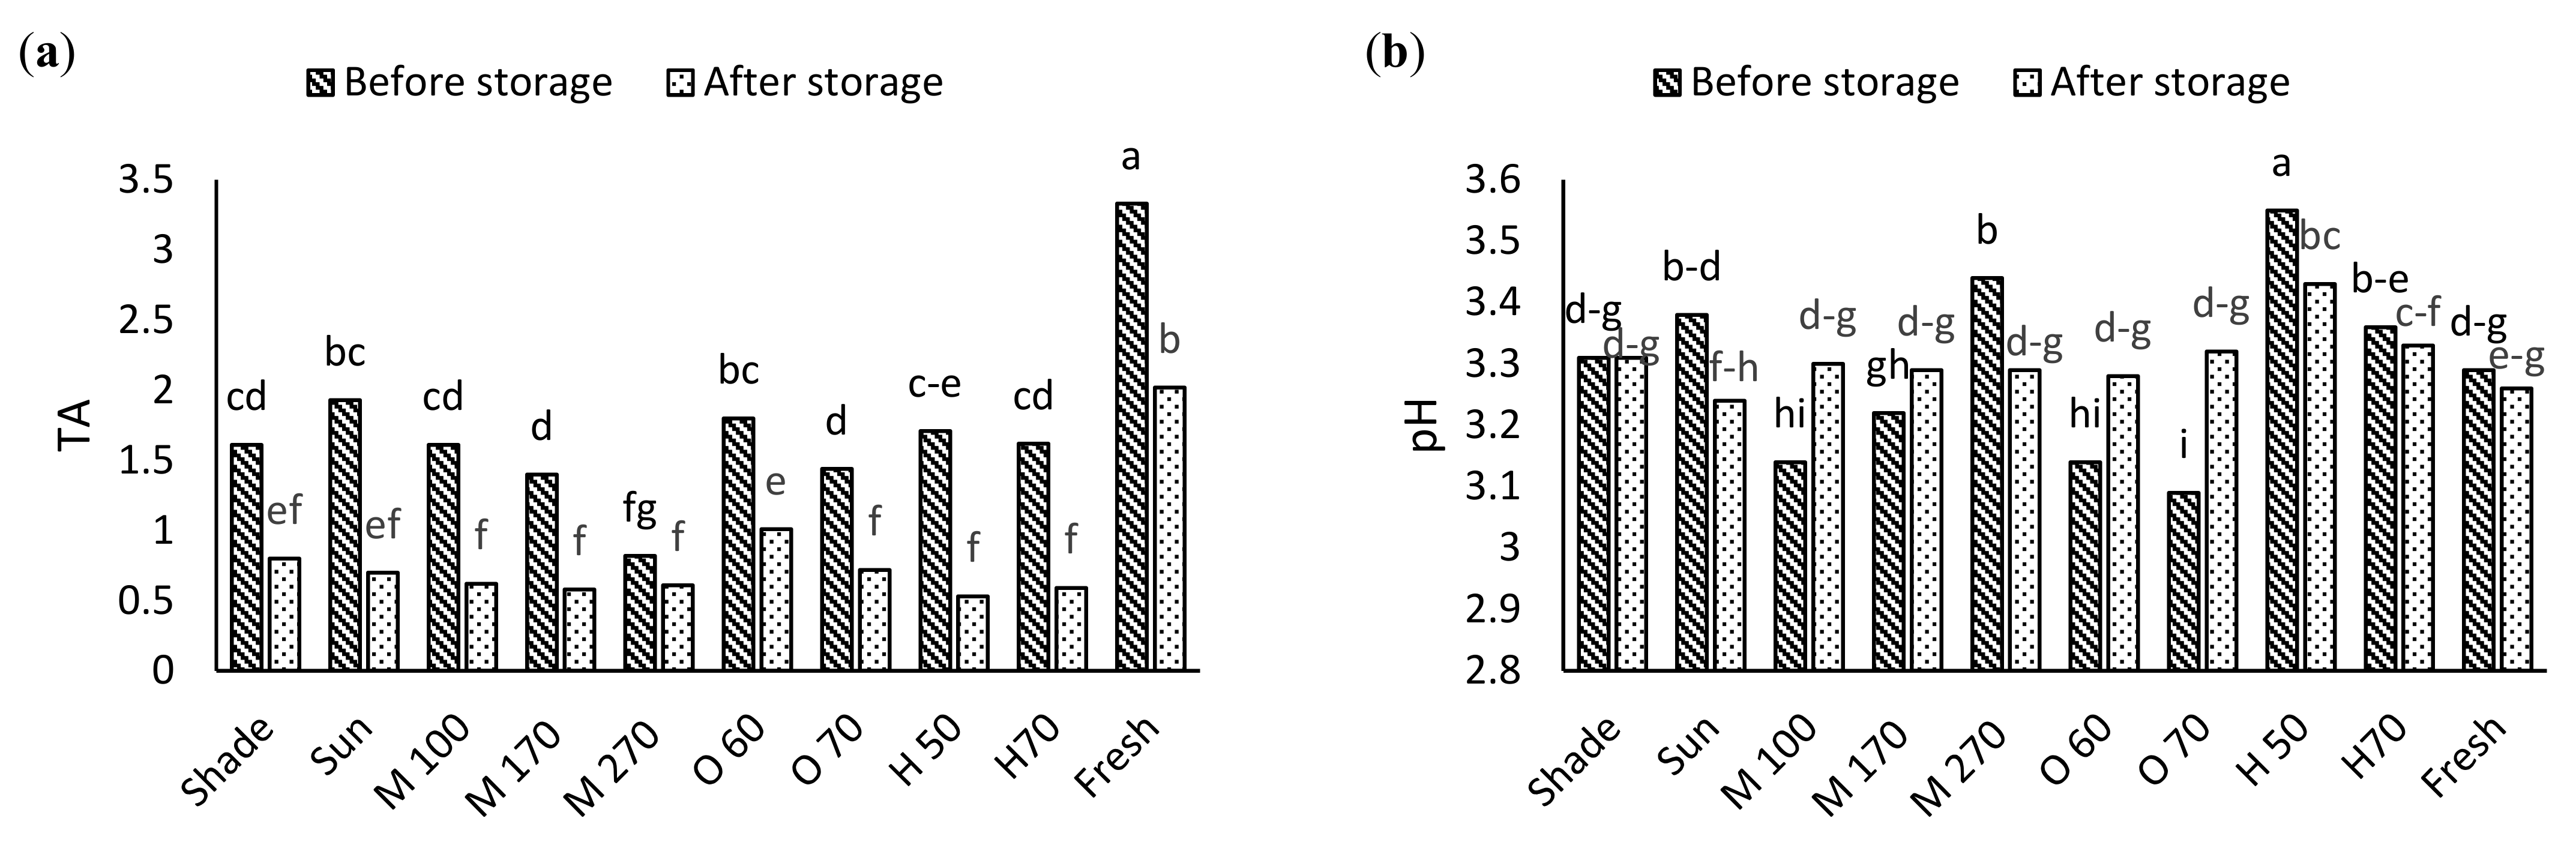
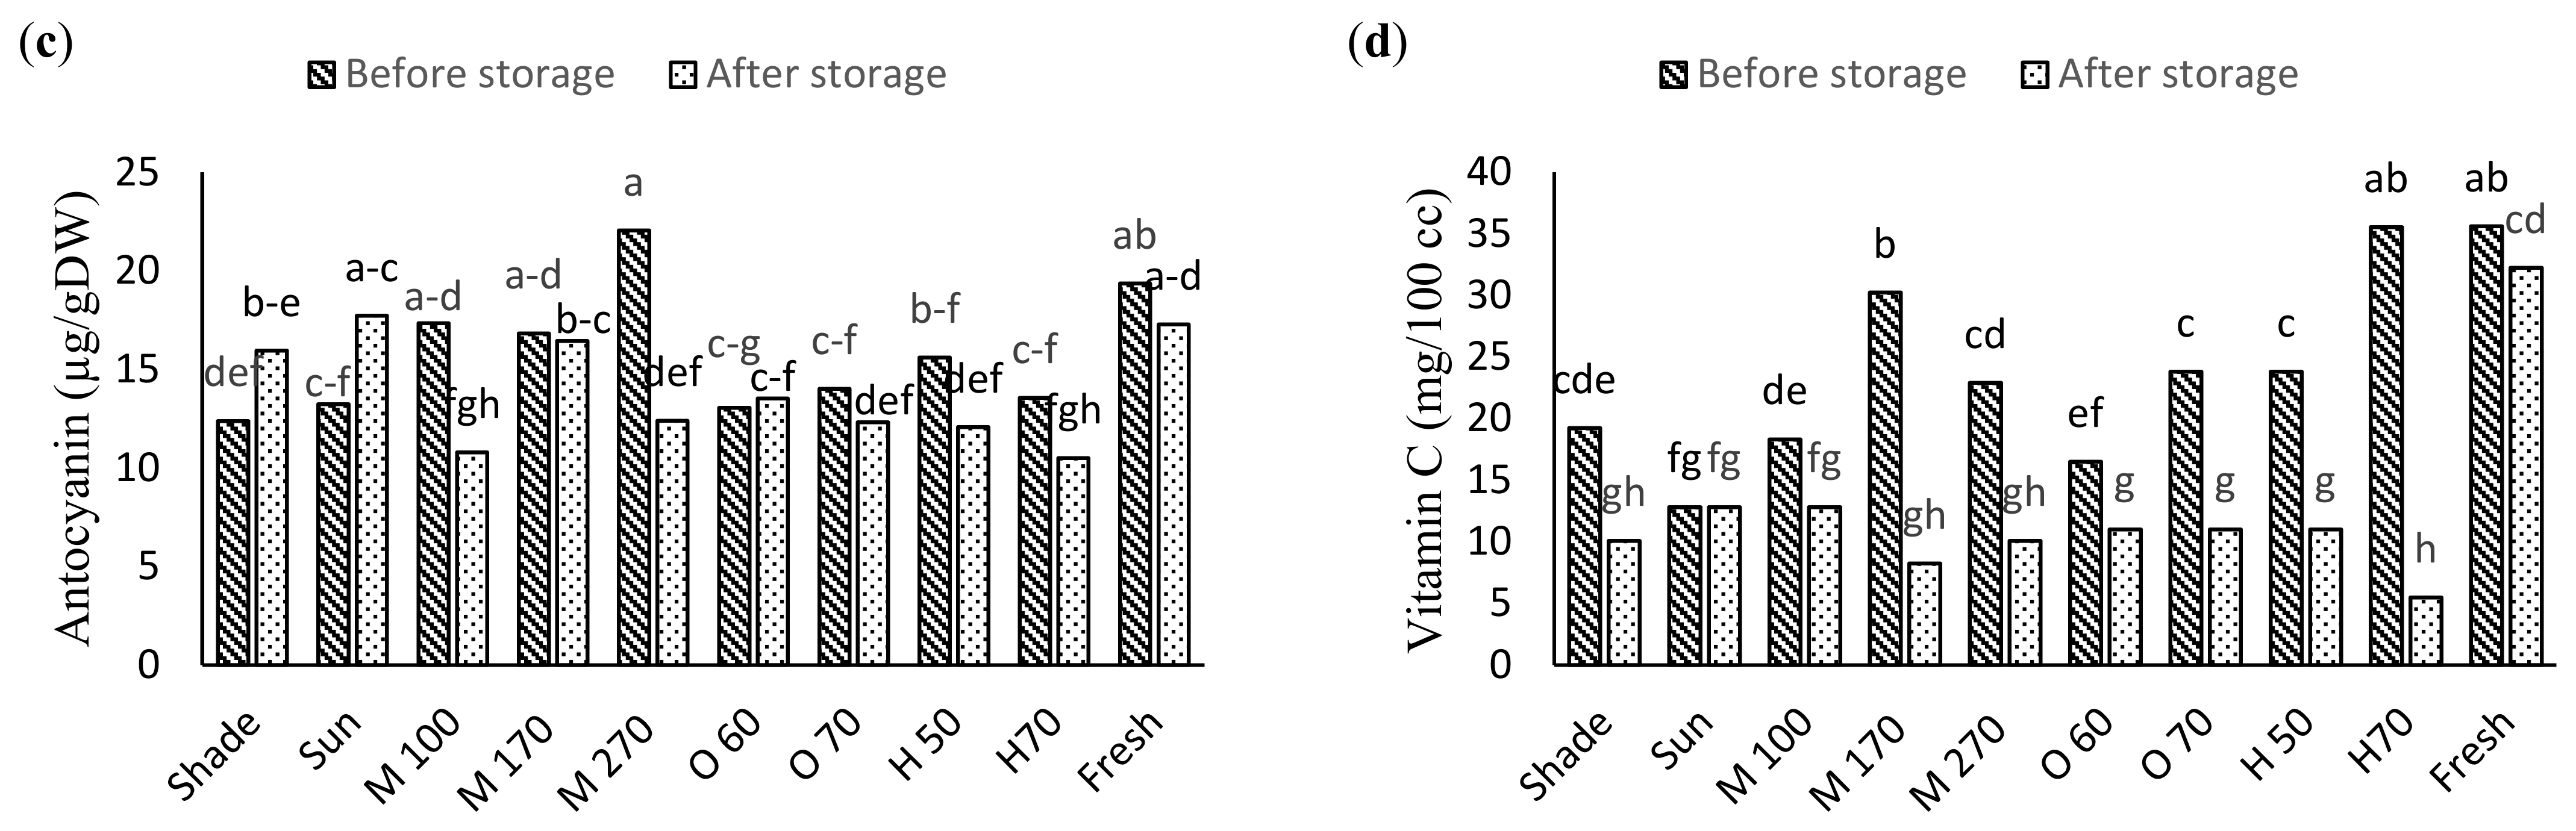
3.3. Biochemical Traits
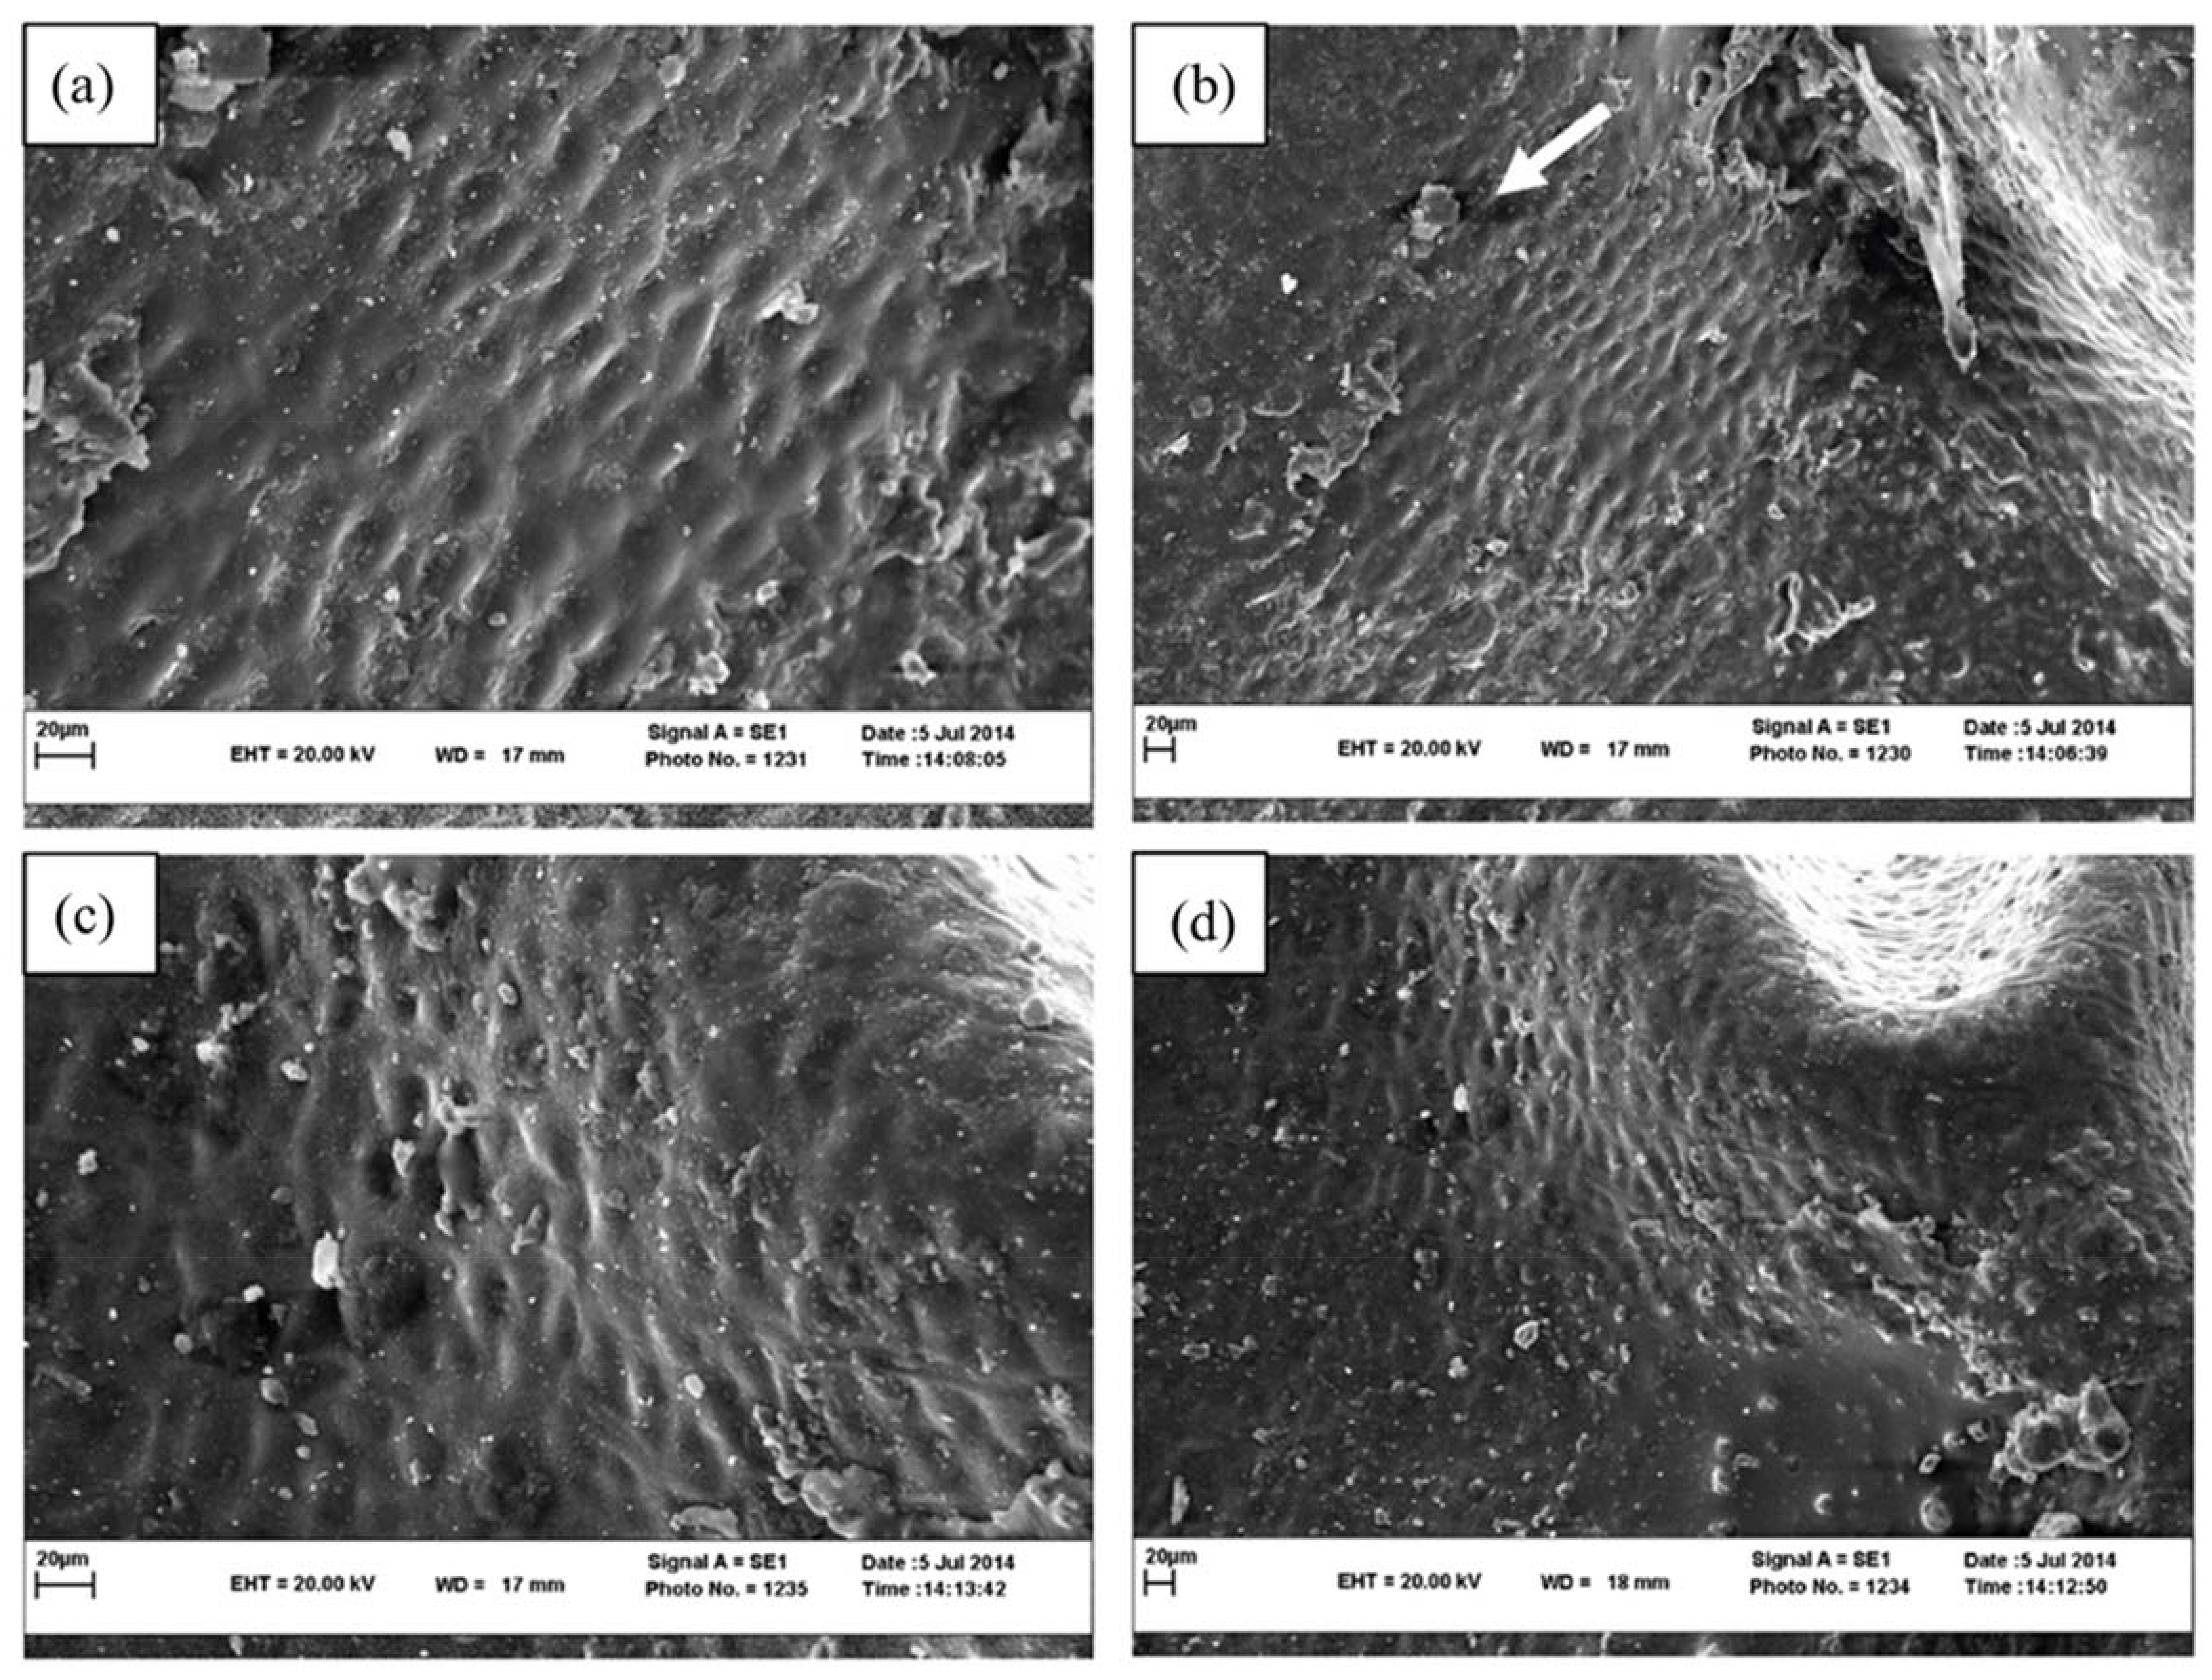
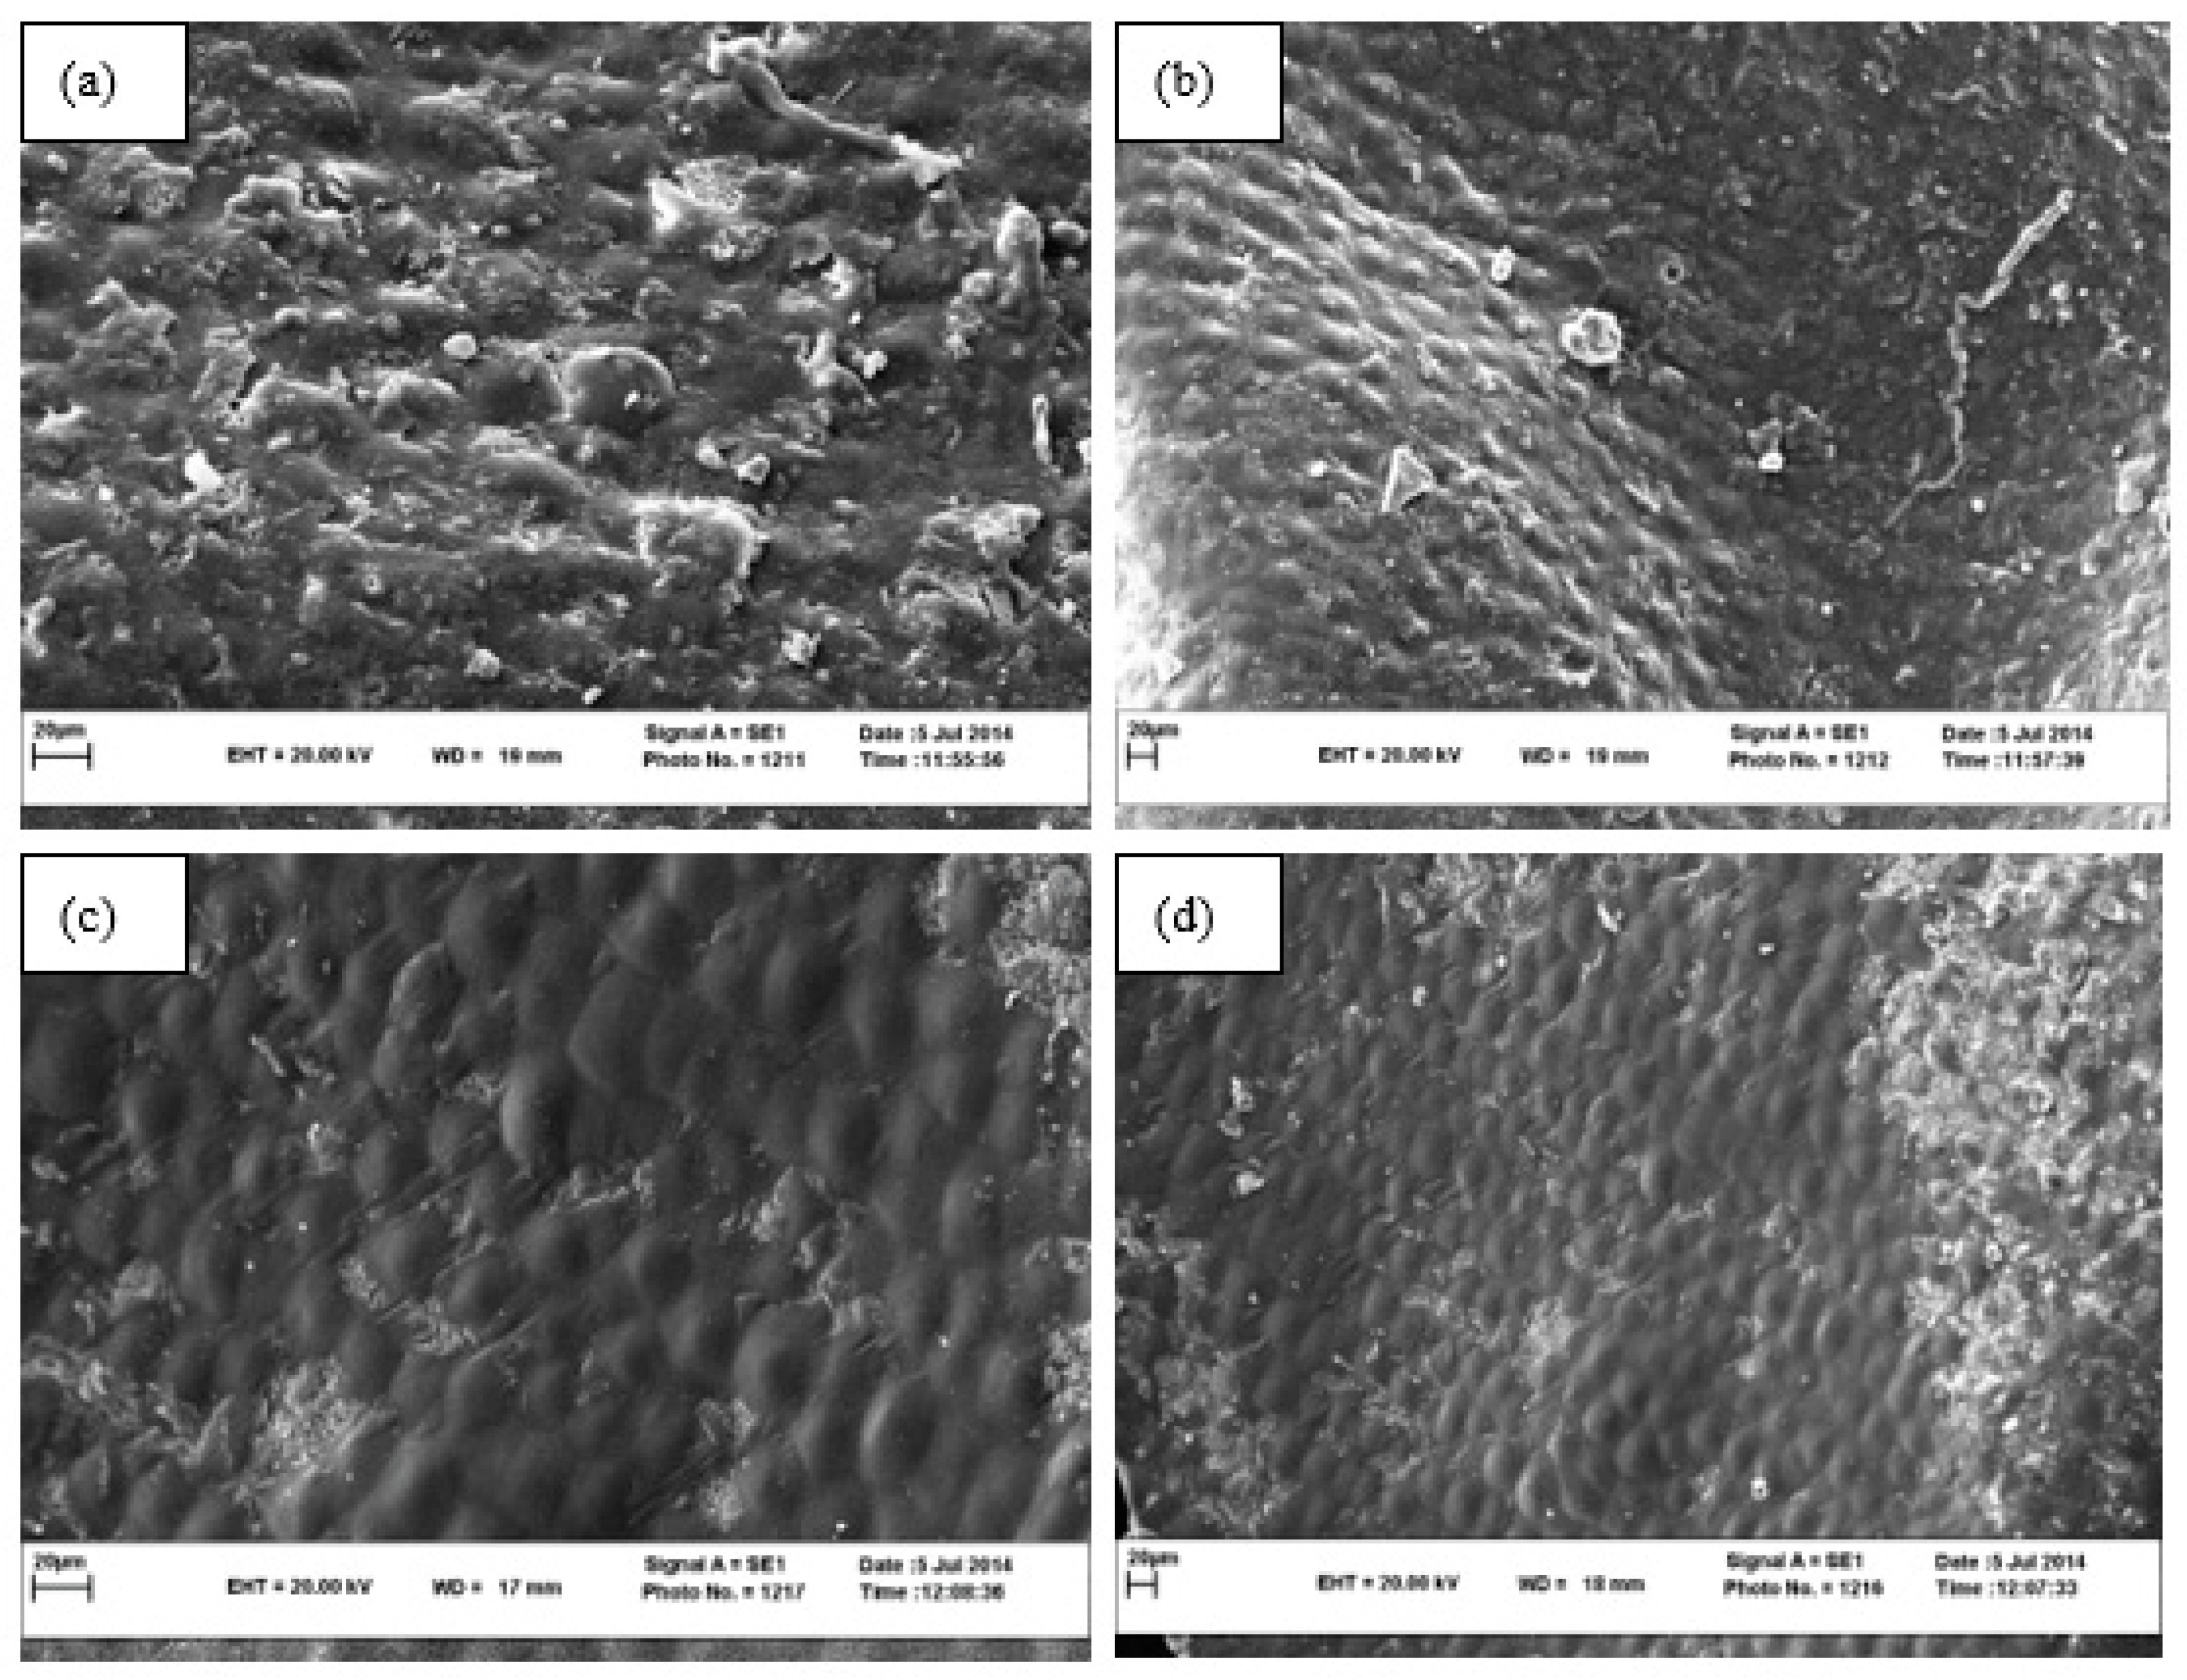
3.4. Surface Structure by SEM Image
3.5. Effective Moisture Diffusivity (Deff)
3.6. Specific Energy Consumption (SEC)
3.7. Energy Efficiency (EE)
4. Conclusions
Author Contributions
Funding
Data Availability Statement
Conflicts of Interest
References
- Rahimi-Madiseh, M.; Lorigoini, Z.; Zamani-Gharaghoshi, H.; Rafieian-Kopaei, M. Berberis vulgaris: Specifications and traditional uses. Iran. J. Basic Med. Sci. 2017, 20, 569. [Google Scholar] [PubMed]
- Neag, M.A.; Mocan, A.; Echeverría, J.; Pop, R.M.; Bocsan, C.I.; Crişan, G.; Buzoianu, A.D. Berberine: Botanical occurrence, traditional uses, extraction methods, and relevance in cardiovascular, metabolic, hepatic, and renal disorders. Front. Pharmacol. 2018, 9, 557. [Google Scholar] [CrossRef] [PubMed]
- Alemardan, A.; Asadi, W.; Rezaei, M.; Tabrizi, L.; Mohammadi, S. Cultivation of Iranian seedless barberry (Berberis integerrima ‘Bidaneh’): A medicinal shrub. Ind. Crop Prod. 2013, 50, 276–287. [Google Scholar] [CrossRef]
- Xu, Y.; Xiao, Y.; Lagnika, C.; Song, J.; Li, D.; Liu, C.; Jiang, N.; Zhang, M.; Duan, X. A comparative study of drying methods on physical characteristics, nutritional properties and antioxidant capacity of broccoli. Dry. Technol. 2020, 38, 1378–1388. [Google Scholar] [CrossRef]
- Wang, R.; Ding, S.; Zhao, D.; Wang, Z.; Wu, J.; Hu, X. Effect of dehydration methods on antioxidant activities, phenolic contents, cyclic nucleotides, and volatiles of jujube fruits. Food Sci. Biotechnol. 2016, 25, 137–143. [Google Scholar] [CrossRef]
- Choo, C.O.; Chua, B.L.; Figiel, A.; Jałoszyński, K.; Wojdyło, A.; Szumny, A.; Łyczko, J.; Chong, C.H. Hybrid drying of Murraya koenigii leaves: Energy consumption, antioxidant capacity, profiling of volatile compounds and quality studies. Processes 2020, 8, 240. [Google Scholar] [CrossRef]
- Osae, R.; Zhou, C.; Tchabo, W.; Xu, B.; Bonah, E.; Alenyorege, E.A.; Ma, H. Optimization of osmosonication pretreatment of ginger (Zingiber officinale Roscoe) using response surface methodology: Effect on antioxidant activity, enzyme inactivation, phenolic compounds, and physical properties. J. Food Process Eng. 2019, 42, e13218. [Google Scholar] [CrossRef]
- Wang, W.; Yan, Z.; Yao, H.; Li, P.; Peng, W.; Su, W.; Wang, Y. Extraction and purification of pedunculoside from the dried barks of Ilex rotunda using crystallization combined with polyamide column chromatography. Sep. Sci. Technol. 2021, 56, 1710–1720. [Google Scholar] [CrossRef]
- Bhattacharya, M.; Punathil, L.; Basak, T. A theoretical analysis on the effect of containers on the microwave heating of materials. Int. Communic. Heat. Mass Transfer. 2017, 82, 145–153. [Google Scholar] [CrossRef]
- Zhang, M.; Tang, J.; Mujumdar, A.; Wang, S. Trends in microwave-related drying of fruits and vegetables. Trend. Food Sci. Technol. 2006, 17, 524–534. [Google Scholar] [CrossRef]
- Omari, A.; Behroozi-Khazaei, N.; Sharifian, F. Drying kinetic and artificial neural network modeling of mushroom drying process in microwave-cabinet dryer. J. Food Process. Eng. 2018, 41, e12849. [Google Scholar] [CrossRef]
- Wang, J.-G.; Liu, H.; Zhou, R.; Liu, X.; Wei, B. Onion-like nanospheres organized by carbon encapsulated few-layer MoS2 nanosheets with enhanced lithium storage performance. J. Power Sources 2019, 413, 327–333. [Google Scholar] [CrossRef]
- Heidari, S.; Azizi, M.; Soltani, F.; Hadian, J. Foliar application of Ca (NO3)2 and KNO3 affects growth, essential oil content, and oil composition of French tarragon. Ind. Crops Prod. 2014, 62, 526–532. [Google Scholar] [CrossRef]
- Onu, C.E.; Igbokwe, P.K.; Nwabanne, J.T.; Nwajinka, C.O.; Ohale, P.E. Evaluation of optimization techniques in predicting optimum moisture content reduction in drying potato slices. Artif. Intell. Agri. 2020, 4, 39–47. [Google Scholar] [CrossRef]
- Osae, R.; Essilfie, G.; Alolga, R.N.; Bonah, E.; Ma, H.; Zhou, C. Drying of ginger slices—Evaluation of quality attributes, energy consumption, and kinetics study. J. Food Process. Eng. 2020, 43, e13348. [Google Scholar] [CrossRef]
- Kahraman, O.; Malvandi, A.; Vargas, L.; Feng, H. Drying characteristics and quality attributes of apple slices dried by a non-thermal ultrasonic contact drying method. Ultrason. Sonochem. 2021, 73, 105510. [Google Scholar] [CrossRef]
- Nozad, M.; Khojastehpour, M.; Tabasizadeh, M.; Azizi, M.; Miraei Ashtiani, S.-H.; Salarikia, A. Characterization of hot-air drying and infrared drying of spearmint (Mentha spicata L.) leaves. Food Measure. Charact. 2016, 10, 466–473. [Google Scholar] [CrossRef]
- Tekin, Z.H.; Başlar, M.; Karasu, S.; Kilicli, M. Dehydration of green beans using ultrasound-assisted vacuum drying as a novel technique: Drying kinetics and quality parameters. J. Food Process Preserv. 2017, 41, e13227. [Google Scholar] [CrossRef]
- Ebadi, M.T.; Azizi, M.; Sefidkon, F.; Ahmadi, N. Influence of different drying methods on drying period, essential oil content and composition of Lippia citriodora Kunth. J. Appl. Res. Med. Aromat. Plants 2015, 2, 182–187. [Google Scholar] [CrossRef]
- Ebadi, M.T.; Sefidkon, F.; Azizi, M.; Ahmadi, N. Packaging methods and storage duration affect essential oil content and composition of lemon verbena (Lippia citriodora Kunth). Food Sci. Nut. 2017, 5, 588–595. [Google Scholar] [CrossRef]
- Doymaz, İ.; Kocayigit, F. Drying and rehydration behaviors of convection drying of green peas. Dry. Technol. 2011, 29, 1273–1282. [Google Scholar] [CrossRef]
- Kaveh, M.; Taghinezhad, E.; Witrowa-Rajchert, D.; Imanian, K.; Khalife, E.; Nowacka, M. Use of ultrasound pre-treatment before microwave drying of kiwifruits–An optimization approach with response surface methodology. J. Food Process. Preserv. 2022, 46, e16714. [Google Scholar] [CrossRef]
- Li, Y.; Yang, H.; Yang, H.; Wang, J.; Chen, H. Assessment of drying methods on the physiochemical property and antioxidant activity of Cordyceps militaris. Food Measure. 2019, 13, 513–520. [Google Scholar] [CrossRef]
- Szychowski, P.J.; Lech, K.; Sendra-Nadal, E.; Hernández, F.; Figiel, A.; Wojdyło, A.; Carbonell-Barrachina, Á.A. Kinetics, biocompounds, antioxidant activity, and sensory attributes of quinces as affected by drying method. Food Chem. 2018, 255, 157–164. [Google Scholar] [CrossRef] [PubMed]
- Ye, L.; EL-Mesery, H.S.; Ashfaq, M.M.; Shi, Y.; Zicheng, H.; Alshaer, W.G. Analysis of energy and specific energy requirements in various drying process of mint leaves. Case Stud. Therm. Eng. 2021, 26, 101113. [Google Scholar] [CrossRef]
- Aghbashlo, M.; Samimi-Akhijahani, H. Influence of drying conditions on the effective moisture diffusivity, energy of activation and energy consumption during the thin-layer drying of berberis fruit (Berberidaceae). Energy Conver. Manag. 2008, 49, 2865–2871. [Google Scholar] [CrossRef]
- McGuire, R.G. Reporting of objective color measurements. HortScience 1992, 27, 1254–1255. [Google Scholar] [CrossRef]
- Sung, H.; Ferlay, J.; Siegel, R.L.; Laversanne, M.; Soerjomataram, I.; Jemal, A.; Bray, F. Global cancer statistics 2020: GLOBOCAN estimates of incidence and mortality worldwide for 36 cancers in 185 countries. CA A Cancer J. Clin. 2021, 71, 209–249. [Google Scholar] [CrossRef]
- Wagner, G.J. Content and vacuole/extravacuole distribution of neutral sugars, free amino acids, and anthocyanin in protoplasts. Plant Physiol. 1979, 64, 88–93. [Google Scholar] [CrossRef]
- Samadi, S.; Saharkhiz, M.J.; Azizi, M.; Samiei, L.; Ghorbanpour, M. Multi-walled carbon nanotubes stimulate growth, redox reactions and biosynthesis of antioxidant metabolites in Thymus dae-nensis celak. in vitro. Chemosphere 2020, 249, 126069. [Google Scholar] [CrossRef]
- Boyer, R. Modern Experimental Biochemistry; Pearson Education India: Noida, India, 2000. [Google Scholar]
- Motevali, A.; Minaei, S.; Banakar, A.; Ghobadian, B.; Khoshtaghaza, M.H. Comparison of energy parameters in various dryers. Energy Conver. Manag. 2014, 87, 711–725. [Google Scholar] [CrossRef]
- Ghanbarian, D.; Torki-Harchegani, M.; Sadeghi, M.; Pirbalouti, A.G. Ultrasonically improved convective drying of peppermint leaves: Influence on the process time and energetic indices. Renew. Energy 2020, 153, 67–73. [Google Scholar] [CrossRef]
- Huang, J.; Zhang, M. Effect of three drying methods on the drying characteristics and quality of okra. Dry. Technol. 2016, 34, 900–911. [Google Scholar] [CrossRef]
- Timm, N.d.S.; Coradi, P.C.; Lang, G.H.; Ramos, A.H.; Canizares, L.d.C.C.; Ferreira, C.D.; Oliveira, M.d. Effects of drying temperature of corn from the center and extremities of the corncob on morphology and technological, thermal, and pasting properties of isolated starch. J. Food Eng. 2023, 336, 111215. [Google Scholar] [CrossRef]
- An, K.; Zhao, D.; Wang, Z.; Wu, J.; Xu, Y.; Xiao, G. Comparison of different drying methods on Chinese ginger (Zingiber officinale Roscoe): Changes in volatiles, chemical profile, antioxidant properties, and microstructure. Food Chem. 2016, 197, 1292–1300. [Google Scholar] [CrossRef]
- Kayacan, S.; Karasu, S.; Akman, P.K.; Goktas, H.; Doymaz, I.; Sagdic, O. Effect of different drying methods on total bioactive compounds, phenolic profile, in vitro bioaccessibility of phenolic and HMF formation of persimmon. LWT 2020, 118, 108830. [Google Scholar] [CrossRef]
- Shaw, M.; Meda, V.; Tabil, L., Jr.; Opoku, A., Jr. Drying and color characteristics of coriander foliage using convective thin-layer and microwave drying. J. Microw. Power Electromag. Energy 2006, 41, 56–65. [Google Scholar] [CrossRef]
- Łechtańska, J.; Szadzińska, J.; Kowalski, S. Microwave-and infrared-assisted convective drying of green pepper: Quality and energy considerations. Chem. Eng. Process. Process Int. 2015, 98, 155–164. [Google Scholar] [CrossRef]
- Tabatabaei Kolor, R.; Mohammadi, I.; Motevali, A. Investigating some quality and thermodynamic parameters of kiwifruit thin layer drying in an air recycling dryer equipped with heat pump. Iran. J. Biosyst. Eng. 2019, 50, 331–342. [Google Scholar]
- Podsędek, A. Natural antioxidants and antioxidant capacity of Brassica vegetables: A review. LWT 2007, 40, 1–11. [Google Scholar] [CrossRef]
- Ismail, A.; Marjan, Z.M.; Foong, C.W. Total antioxidant activity and phenolic content in selected vegetables. Food Chem. 2004, 87, 581–586. [Google Scholar] [CrossRef]
- Lim, Y.Y.; Murtijaya, J. Antioxidant properties of Phyllanthus amarus extracts as affected by different drying methods. LWT 2007, 40, 1664–1669. [Google Scholar] [CrossRef]
- Reyes, A.; Evseev, A.; Mahn, A.; Bubnovich, V.; Bustos, R.; Scheuermann, E. Effect of operating conditions in freeze-drying on the nutritional properties of blueberries. Int. J. Food Sci. Nut. 2011, 62, 303–306. [Google Scholar] [CrossRef] [PubMed]
- Pankyamma, V.; Mokam, S.Y.; Debbarma, J.; Rao, B.M. Effects of microwave vacuum drying and conventional drying methods on the physicochemical and microstructural properties of squid shreds. J. Sci. Food Agric. 2019, 99, 5778–5783. [Google Scholar] [CrossRef] [PubMed]
- Witrowa-Rajchert, D.; Rząca, M. Effect of drying method on the microstructure and physical properties of dried apples. Dry. Technol. 2009, 27, 903–909. [Google Scholar] [CrossRef]
- Yao, L.; Fan, L.; Duan, Z. Effect of different pretreatments followed by hot-air and far-infrared drying on the bioactive compounds, physicochemical property and microstructure of mango slices. Food Chem. 2020, 305, 125477. [Google Scholar] [CrossRef] [PubMed]
- Zotarelli, M.F.; Porciuncula, B.D.A.; Laurindo, J.B. A convective multi-flash drying process for producing dehydrated crispy fruits. J. Food Eng. 2012, 108, 523–531. [Google Scholar] [CrossRef]
- Thuwapanichayanan, R.; Prachayawarakorn, S.; Kunwisawa, J.; Soponronnarit, S. Determination of effective moisture diffusivity and assessment of quality attributes of banana slices during drying. LWT 2011, 44, 1502–1510. [Google Scholar] [CrossRef]
- Deng, Y.; Zhao, Y. Effects of pulsed-vacuum and ultrasound on the osmodehydration kinetics and microstructure of apples (Fuji). J. Food Eng. 2008, 85, 84–93. [Google Scholar] [CrossRef]
- Lam, J.K.; Chow, M.Y.; Zhang, Y.; Leung, S.W. siRNA versus miRNA as therapeutics for gene silencing. Mol. Ther. -Nucleic Acids 2015, 4, e252. [Google Scholar] [CrossRef]
- Altay, K.; Hayaloglu, A.A.; Dirim, S.N. Determination of the drying kinetics and energy efficiency of purple basil (Ocimum basilicum L.) leaves using different drying methods. Heat. Mass Transfer. 2019, 55, 2173–2184. [Google Scholar] [CrossRef]
- Arslan, D.; Özcan, M.M.; Mengeş, H.O. Evaluation of drying methods with respect to drying parameters, some nutritional and colour characteristics of peppermint (Mentha x piperita L.). Energy Convers Manag. 2010, 51, 2769–2775. [Google Scholar] [CrossRef]
- Agbede, O.O.; Oke, E.O.; Akinfenwa, S.I.; Wahab, K.T.; Ogundipe, S.; Aworanti, O.A.; Arinkoola, A.O.; Agarry, S.E.; Ogunleye, O.O.; Osuolale, F.N. Thin layer drying of green microalgae (Chlorella sp.) paste biomass: Drying characteristics, energy requirement and mathematical modeling. Bioresour. Technol. Rep. 2020, 11, 100467. [Google Scholar] [CrossRef]
- Kaveh, M.; Abbaspour-Gilandeh, Y.; Fatemi, H.; Chen, G. Impact of different drying methods on the drying time, energy, and quality of green peas. J. Food Process Preserv. 2021, 45, e15503. [Google Scholar] [CrossRef]
- Kaveh, M.; Abbaspour-Gilandeh, Y.; Nowacka, M. Comparison of different drying techniques and their carbon emissions in green peas. Chem. Eng. Process-Process Int. 2021, 160, 108274. [Google Scholar] [CrossRef]
- Torki-Harchegani, M.; Ghanbarian, D.; Pirbalouti, A.G.; Sadeghi, M. Dehydration behaviour, mathematical modelling, energy efficiency and essential oil yield of peppermint leaves undergoing microwave and hot air treatments. Renew. Sustain. Energy Rev. 2016, 58, 407–418. [Google Scholar] [CrossRef]


| Treatments (Drying Methods) | Storage | ||
|---|---|---|---|
| Before | After | ||
| Microwave (M) | 100 W | Kept all dried samples in polyethylene packaging for 6 months under 5–10 °C. | |
| 170 W | |||
| 270 W | |||
| Cabinet (H) | 50 °C | ||
| 70 °C | |||
| Oven (O) | 60 °C | ||
| 70 °C | |||
| Shade | − | ||
| Sun | − | ||
| S.O.V | df | a* | b* | L* | ab | Chroma |
|---|---|---|---|---|---|---|
| Drying method (D) | 9 | 591.35 * | 45.65 * | 22.61 * | 2.95 * | 619.65 * |
| Storage (S) | 1 | 466.09 * | 50.87 * | 17.94 * | 1.07 * | 535.15 * |
| D × S | 9 | 128.48 * | 3.49 * | 0.48 * | 1.35 * | 125.48 * |
| Error | 40 | 0.22 | 0.15 | 0.19 | 0.04 | 0.21 |
| S.O.V | df | pH | TA | TSS | Vit C | Anthocyanin | Phenol |
|---|---|---|---|---|---|---|---|
| Drying method (D) | 9 | 0.047 * | 1.65 * | 12.46 * | 127.83 * | 24.35 * | 1720.19 * |
| Storage (S) | 1 | 0.003 ns | 42.12 * | 57.48 * | 2317.57 * | 50.83 * | 18,474.09 * |
| D × S | 9 | 0.027 * | 0.15 * | 7.62 ns | 111.95 * | 27.46 * | 781.39 ns |
| Error | 40 | 0.05 | 0.16 | 1.78 | 2.69 | 2.62 | 21.88 |
| Treatment | EE (%) | SEC (MJ/kg) | Deff (m2/s) | |
|---|---|---|---|---|
| Microwave | 100 W | 5.68 | 246.5753 | 1.40 × 10⁻¹⁰ |
| 170 W | 24.68 | 12.57534 | 5.59 × 10−09 | |
| 270 W | 25.26 | 12.20548 | 9.13 × 10−09 | |
| Cabinet | 50 °C | 1.16 | 1182.141 | 7.87 × 10⁻¹¹ |
| 70 °C | 2.01 | 960.8532 | 1.53 × 10⁻¹⁰ | |
| Oven | 60 °C | 4.15 | 407.6347 | 2.19 × 10⁻¹⁰ |
| 70 °C | 4.89 | 358.2235 | 3.29 × 10⁻¹⁰ | |
| Shade | − | − | − | 9.68 × 10⁻¹² |
| Sun | − | − | − | 2.73 × 10⁻¹¹ |
Publisher’s Note: MDPI stays neutral with regard to jurisdictional claims in published maps and institutional affiliations. |
© 2022 by the authors. Licensee MDPI, Basel, Switzerland. This article is an open access article distributed under the terms and conditions of the Creative Commons Attribution (CC BY) license (https://creativecommons.org/licenses/by/4.0/).
Share and Cite
Talebzadeh, S.L.; Fatemi, H.; Azizi, M.; Kaveh, M.; Salavati Nik, A.; Szymanek, M.; Kulig, R. Interaction of Different Drying Methods and Storage on Appearance, Surface Structure, Energy, and Quality of Berberis vulgaris var. asperma. Foods 2022, 11, 3003. https://doi.org/10.3390/foods11193003
Talebzadeh SL, Fatemi H, Azizi M, Kaveh M, Salavati Nik A, Szymanek M, Kulig R. Interaction of Different Drying Methods and Storage on Appearance, Surface Structure, Energy, and Quality of Berberis vulgaris var. asperma. Foods. 2022; 11(19):3003. https://doi.org/10.3390/foods11193003
Chicago/Turabian StyleTalebzadeh, Seyede Laleh, Hamideh Fatemi, Majid Azizi, Mohammad Kaveh, Amirali Salavati Nik, Mariusz Szymanek, and Ryszard Kulig. 2022. "Interaction of Different Drying Methods and Storage on Appearance, Surface Structure, Energy, and Quality of Berberis vulgaris var. asperma" Foods 11, no. 19: 3003. https://doi.org/10.3390/foods11193003