


The Near-Infrared Spectroscopy of Ethanol-Fixed Tissues to Detect Illicit Treatments with Glucocorticoids in Bulls


Abstract
:1. Introduction
2. Materials and Methods
2.1. Animal Treatment, Sample Collection and Preparation
2.2. Data Acquisition
2.3. Statistical Analysis
3. Results
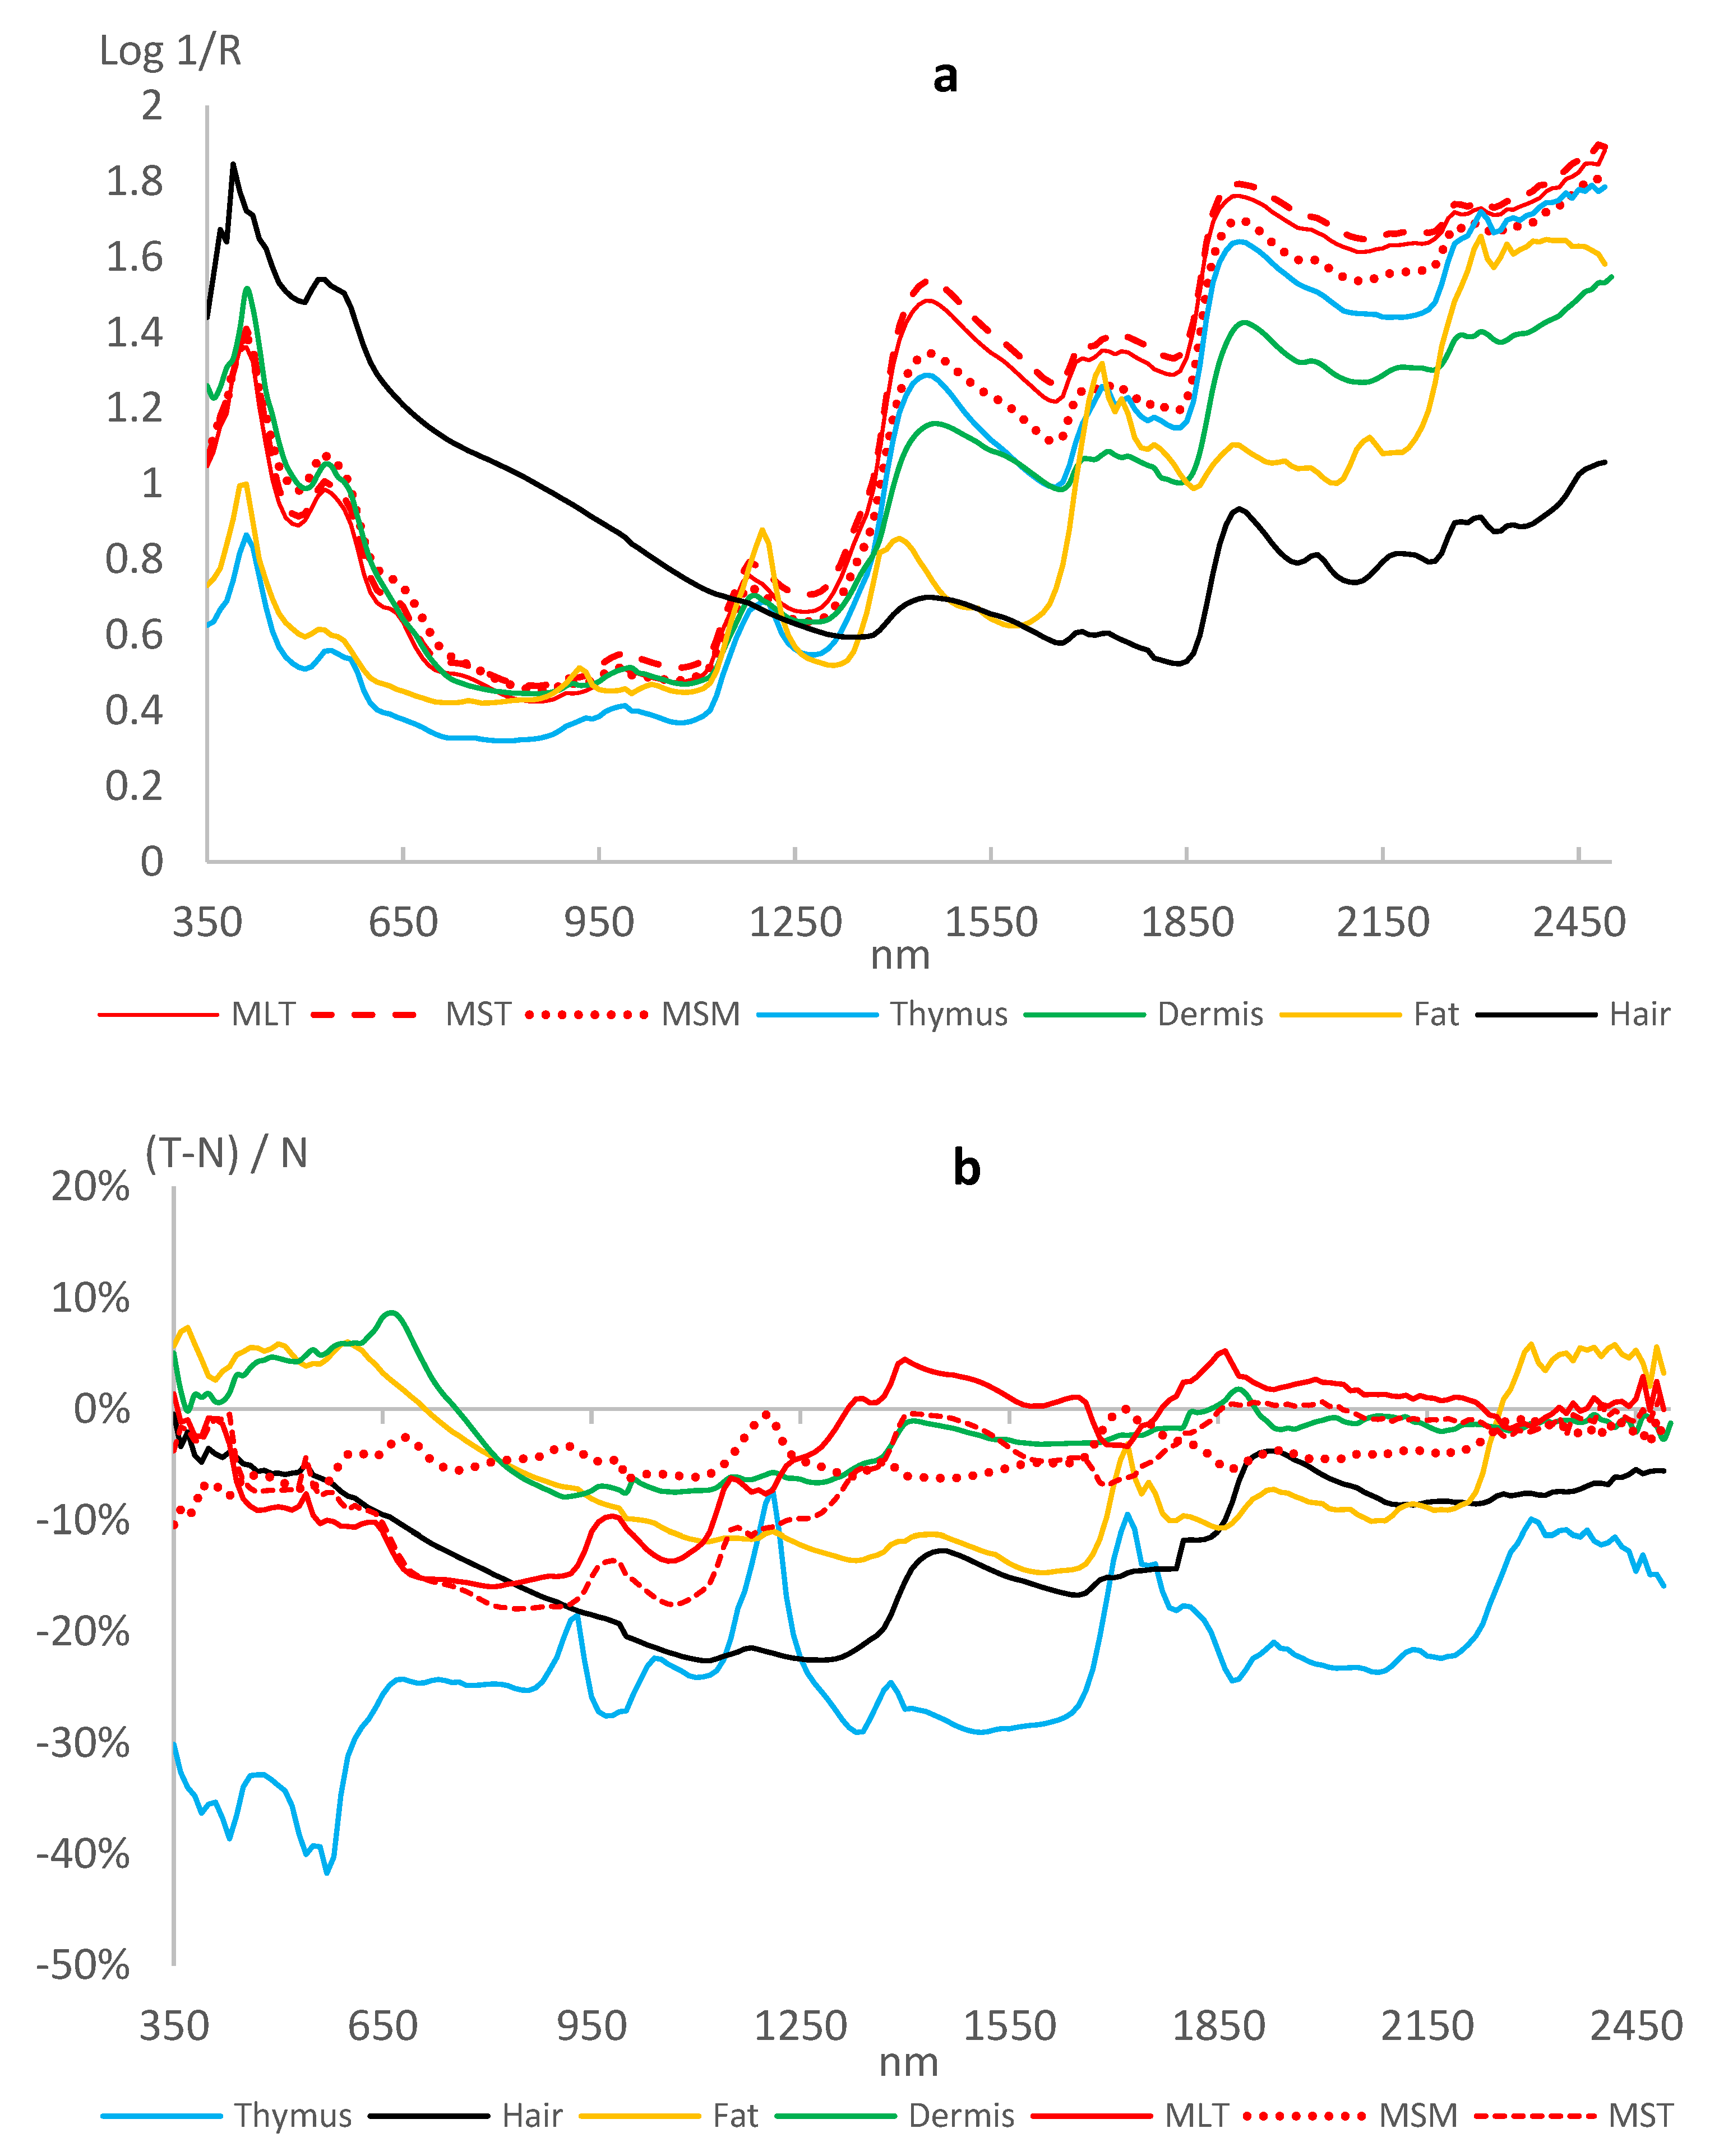
3.1. NIR Spectra
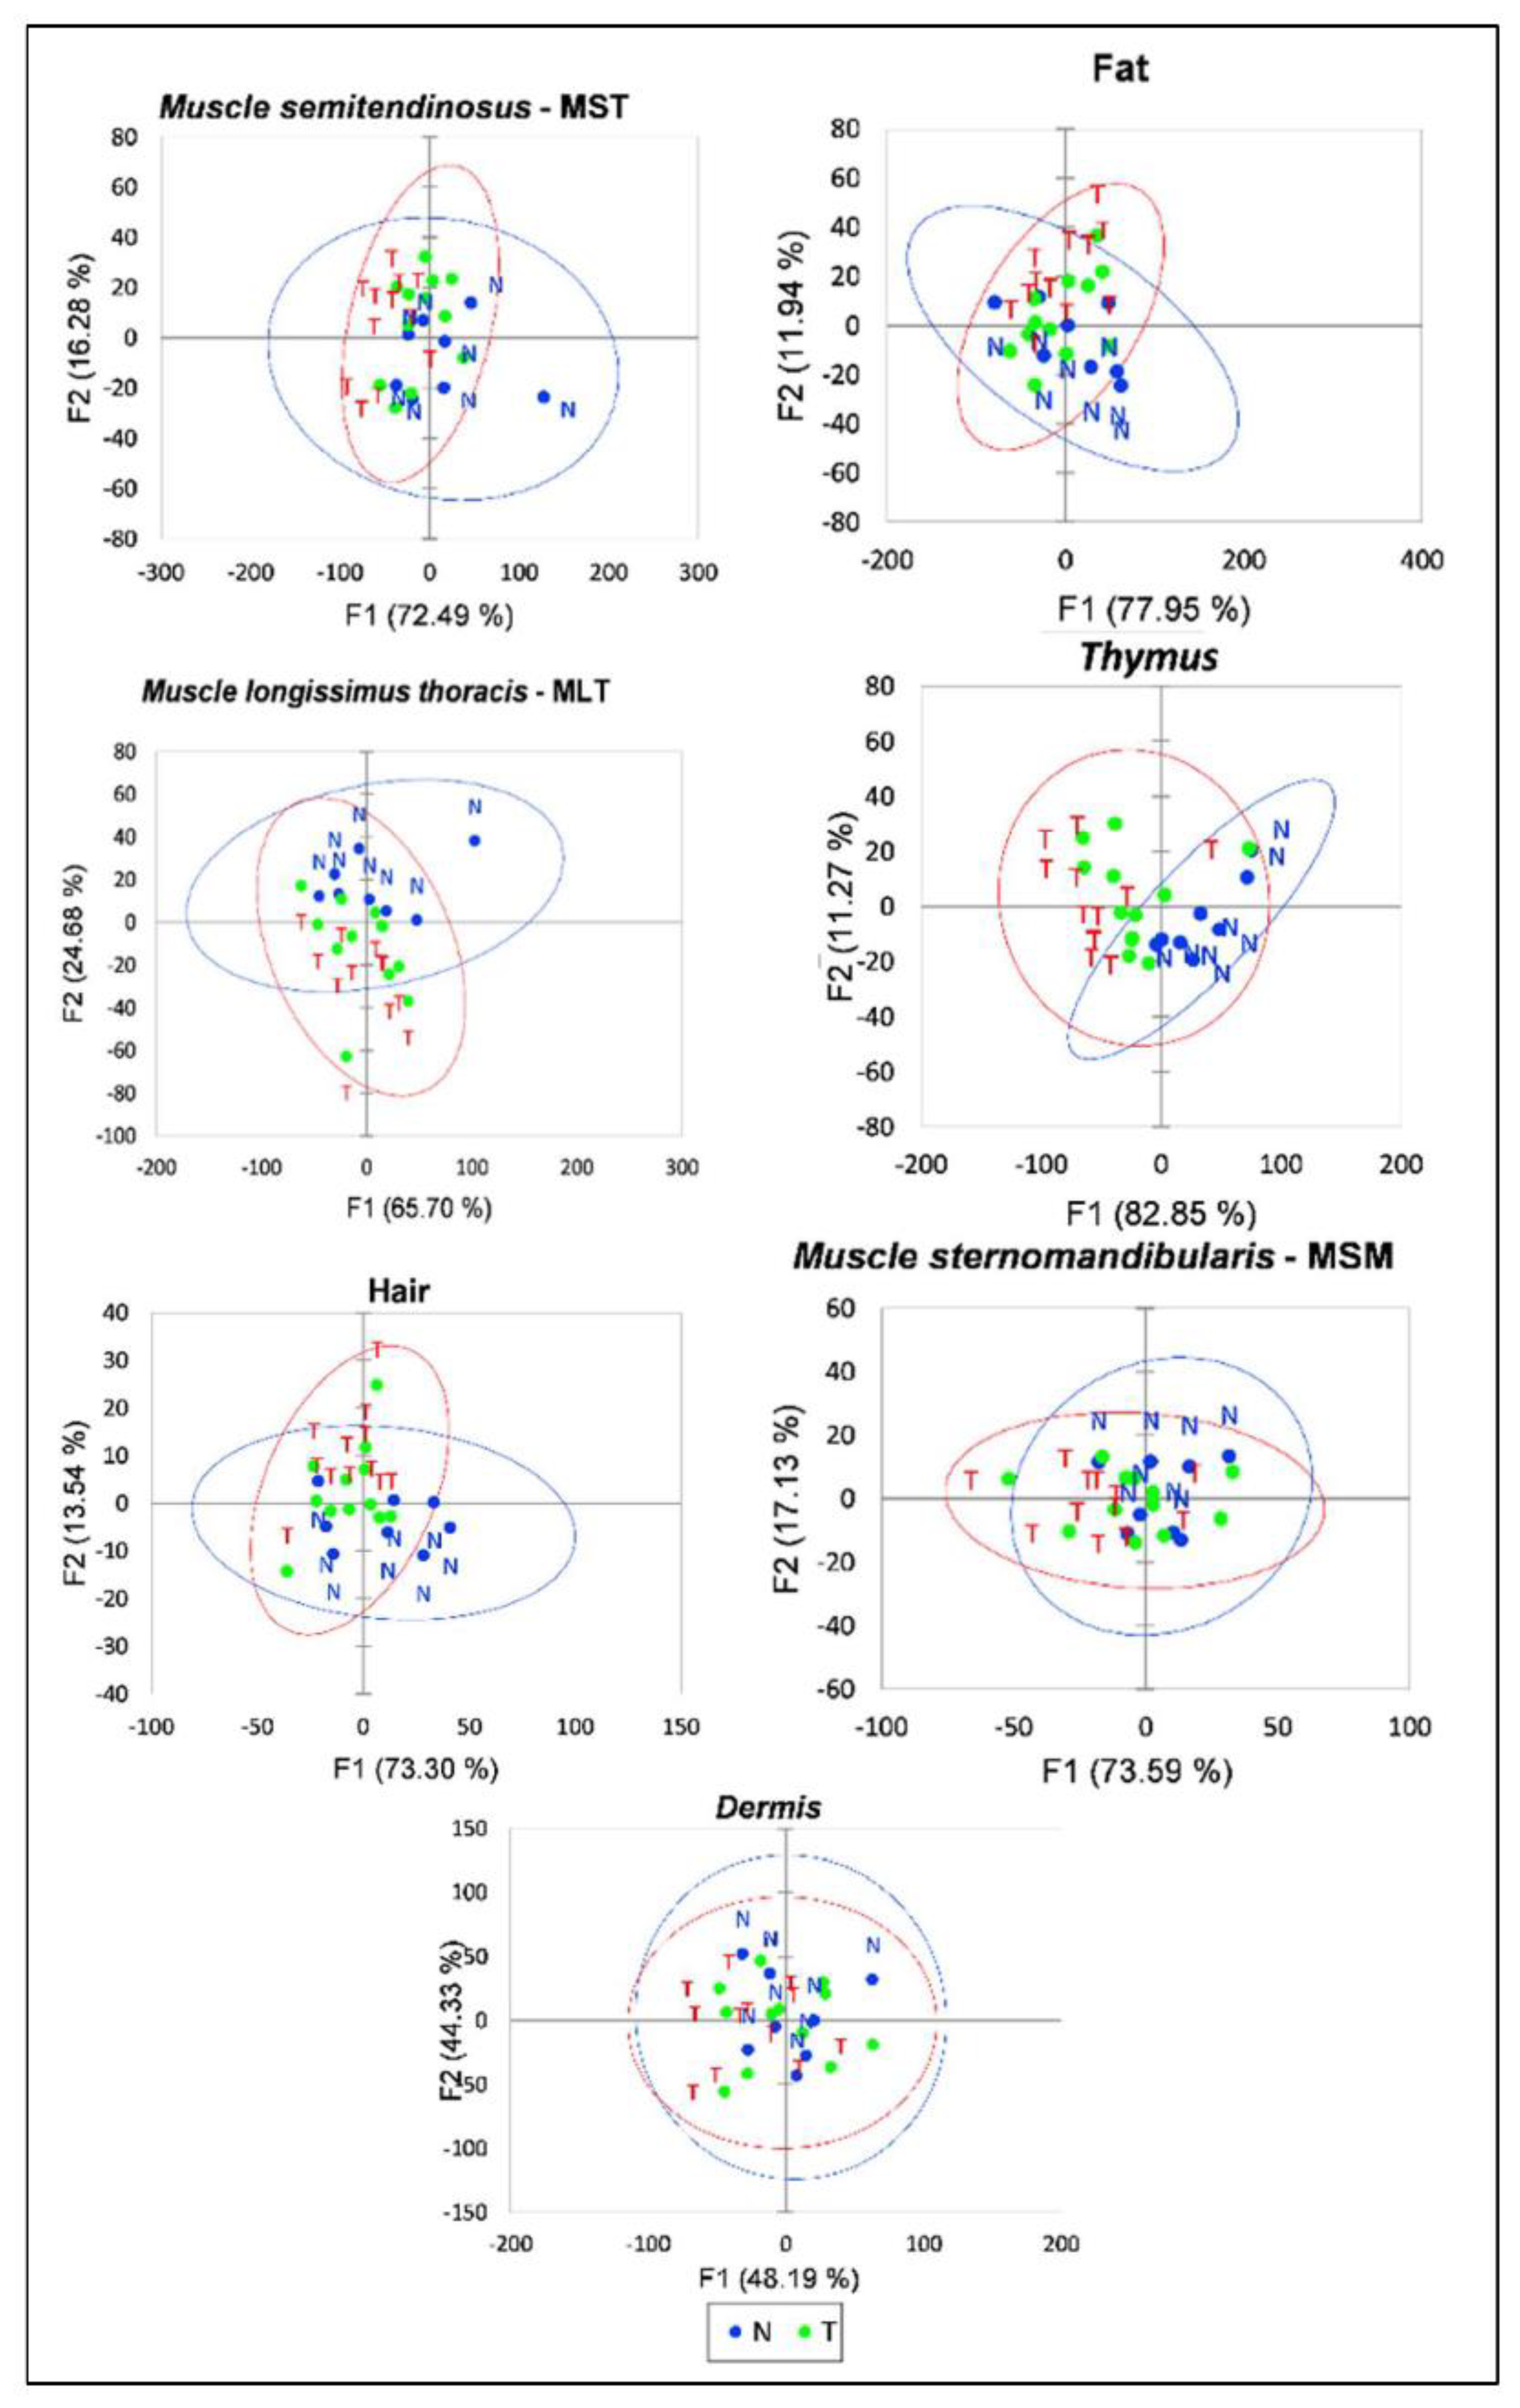
3.2. Principal Component Projections
3.3. Discriminant Analysis
4. Discussion
5. Conclusions
Author Contributions
Funding
Institutional Review Board Statement
Data Availability Statement
Conflicts of Interest
Abbreviations
References
- Qu, J.H.; Liu, D.; Cheng, J.H.; Sun, D.W.; Ma, J.; Pu, H.; Zeng, X.A. Applications of near-infrared spectroscopy in food safety evaluation and control: A review of recent research advances. Crit. Rev. Food Sci. Nutr. 2015, 55, 1939–1954. [Google Scholar] [CrossRef] [PubMed]
- Zamora-Rojas, E.; Pérez-Marín, D.; De Pedro-Sanz, E.; Guerrero-Ginel, J.E.; Garrido-Varo, A. Handheld NIRS analysis for routine meat quality control: Database transfer from at-line instruments. Chemometr. Intell. Lab. Syst. 2012, 114, 30–35. [Google Scholar] [CrossRef]
- Teixeira, C.A.; Lopo, M.; Páscoa, R.; Lopes, J.A. A review on the applications of portable Near-Infrared Spectrometers in the agro-food industry. Appl. Spectrosc. 2013, 67, 1215–1233. [Google Scholar]
- Prieto, N.; Pawluczyk, O.; Dugan, M.E.R.; Aalhus, J.L. A review of the principles and applications of Near-Infrared Spectroscopy to characterize meat, fat, and meat products. Appl. Spectrosc. 2017, 71, 1403–1426. [Google Scholar] [CrossRef]
- Kartakoullisa, A.; Comaposada, J.; Cruz-Carrióna, A.; Serra, X.; Gou, P. Feasibility study of smartphone-based Near Infrared Spectroscopy (NIRS) for T salted minced meat composition diagnostics at different temperatures. Food Chem. 2019, 278, 314–321. [Google Scholar] [CrossRef] [PubMed]
- Tassone, S.; Masoero, G.; Peiretti, P.G. Vibrational spectroscopy to predict in vitro digestibility and the maturity index of different forage crops during the growing cycle and after freeze- or oven-drying treatment. Anim. Feed Sci. Technol. 2014, 194, 12–15. [Google Scholar] [CrossRef]
- Pasquini, C. Near infrared spectroscopy: A mature analytical technique with new perspectives—A review. Anal. Chim. Acta 2018, 1026, 8–36. [Google Scholar] [CrossRef]
- Masoero, G.; Iacurto, M.; Sala, G. Ethanol specimen of beef muscle samples for NIRS is rapid but as efficient as the freeze-dried sample preparations. In New Developments in Evaluation of Carcass and Meat Quality in Cattle and Sheep; EAAP Scientific Series 123; Lazzaroni, C., Ed.; Wageningen Academic Publishers: Wageningen, The Netherlands, 2007; pp. 281–304. [Google Scholar]
- Masoero, G.; Bergoglio, G.; Vincenti, F.; Destefanis, G.; Brugiapaglia, A. A rapid new ethanol preparation for early muscle sampling submitted to NIR analysis: Preliminary results for cattle and buffalo. Ital. J. Anim. Sci. 2005, 4, 297. [Google Scholar]
- Masoero, G.; Rotolo, L.; Zoccarato, I.; Gasco, L.; Schiavone, A.; De Marco, V.; Meineri, G.; Borreani, G.; Tabacco, E.; Della Casa, G.; et al. Mycorrhizal corn can improve yield, reduce mycotoxins and preserve nutritive value. Agric. Res. Updates 2018, 24, 117–140. [Google Scholar]
- Peiretti, P.G.; Meineri, G.; Masoero, G. NIRS of body and tissues in growing rabbits fed diets with different fat sources and supplemented with Curcuma longa. World Rabbit Sci. 2013, 21, 85–90. [Google Scholar] [CrossRef]
- Concollato, A.; Parisi, G.; Masoero, G.; Romvàri, R.; Olsen, R.E.; Dalle Zotte, A. Carbon monoxide stunning of Atlantic salmon (Salmo salar L.) modifies rigor mortis and sensory traits which are revealed by instrumental analysis. J. Sci. Food Agric. 2016, 96, 3524–3535. [Google Scholar] [CrossRef]
- Girolami, F.; Donalisio, C.; Tagliante, M.; Gatto, S.; Bertarelli, D.; Balbo, A.; Nebbia, C. Illicit use of dexamethasone in meat cattle: Rationale, effects on treated animals, and traditional and innovative diagnostic techniques. Large Anim. Rev. 2010, 16, 113–124. [Google Scholar]
- Berzaghi, P.; Segato, S.; Cozzi, G.; Andrighetto, I. Mid and Near Infrared Spectroscopy to identify illegal treatments in beef cattle. Vet. Res. Commun. 2006, 30, 109–112. [Google Scholar] [CrossRef]
- Barbera, S.; Tarantola, M.; Sala, G.; Nebbia, C. Canonical discriminant analysis and meat quality analysis as complementary tools to detect the illicit use of dexamethasone as a growth promoter in Friesian bulls. Vet. J. 2018, 235, 54–59. [Google Scholar] [CrossRef]
- Richelmi, G.B.; Maurella, C.; Pezzolato, M.; Botta, M.; Varello, K.; Pitardi, D.; Baioni, E.; Bellino, C.; D’Angelo, A.; Caramelli, M.; et al. Thymus atrophy is an efficient marker of illicit treatment with dexamethasone in veal calves: Results from a triennial experimental study. Res. Vet. Sci. 2017, 113, 67–72. [Google Scholar] [CrossRef]
- Nebbia, C.; Urbani, A.; Carletti, M.; Gardini, G.; Balbo, A.; Bertarelli, D.; Girolami, F. Novel strategies for tracing the exposure of meat cattle to illegal growth-promoters. Vet. J. 2011, 189, 34–42. [Google Scholar] [CrossRef]
- Goldring, D.; Sharon, D. Low-Cost Spectrometry System for End-User Food Analysis. U.S. Patent US009377396 B2, 28 June 2016. [Google Scholar]
- MedCalc®. Available online: https://www.medcalc.org/calc/index.php (accessed on 1 June 2022).
- Tijms, H. Understanding Probability, 3rd ed.; Cambridge University Press: Amsterdam, The Netherlands, 2012. [Google Scholar]
- Masoero, G.; Sala, G.; Gardini, G.; Carletti, M.; Balbo, A.; Girolami, F.; Nebbia, C.; Barbera, S.; Tarantola, M. Impiego della spettroscopia NIR per l’individuazione di trattamenti illeciti con corticosteroidi nel bovino da carne. In Proceedings of the 3rd Simposio Italiano di Spettroscopia nel Vicino Infrarosso, Lazise, Italy, 21–23 May 2008; Available online: https://docs.google.com/document/d/1gkzDlD-KWE6Pp7StWpWxUBSC2m4JN7HmUpM_eMO8MJw/edit?usp=sharing (accessed on 25 January 2022).
- Pearce, K.L.; Rosenvold, K.; Andersen, H.J.; Hopkins, D.L. Water distribution and mobility in meat during the conversion of muscle to meat and ageing and the impacts on fresh meat quality attributes. A review. Meat Sci. 2011, 89, 111–124. [Google Scholar] [CrossRef]
- Barbera, S.; Biolatti, B.; Divari, S.; Cannizzo, F.T. Meat quality traits and canonical discriminant analysis to identify the use of illicit growth promoters in Charolais bulls. Food Chem. 2019, 300, 125173. [Google Scholar] [CrossRef]
- Corah, T.I.; Tatum, J.D.; Morgan, J.B.; Mortimer, R.G.; Smith, G.C. Effects of a dexamethasone implant on deposition of intramuscular fat in genetically identical cattle. J. Anim. Sci. 1995, 73, 3310–3316. [Google Scholar] [CrossRef]
- Elgendy, R.; Giantin, M.; Montesissa, C.; Dacasto, M. Transcriptomic analysis of skeletal muscle from beef cattle exposed to illicit schedules containing dexamethasone: Identification of new candidate biomarkers and their validation using samples from a field monitoring trial. Food Addit. Contam. Part A Chem. Anal. Control Expo. Risk Assess. 2015, 32, 1448–1463. [Google Scholar] [CrossRef]
- Stella, R.; Biancotto, G.; Arrigoni, G.; Barrucci, F.; Angeletti, R.; James, P. Proteomics for the detection of indirect markers of steroids treatment in bovine muscle. Proteomics 2015, 15, 2332–2341. [Google Scholar] [CrossRef] [PubMed]
- Biasibetti, E.; Pezzolato, M.; Brugiapaglia, A.; Biagini, D.; Lazzaroni, C.; Bellino, C.; D’angelo, A.; Bozzetta, E. Thymus and meat physicochemical measurements to discriminate calves treated with anabolic and therapeutic doses of dexamethasone. Animals 2021, 15, 100271. [Google Scholar] [CrossRef] [PubMed]
- Benedetto, A.; Biasibetti, E.; Robotti, E.; Marengo, E.; Audino, V.; Bozzetta, E.; Pezzolato, M. Transcriptional Biomarkers and Immunohistochemistry for Detection of Illicit Dexamethasone Administration in Veal Calves. Foods 2022, 11, 1810. [Google Scholar] [CrossRef] [PubMed]
- Benedetto, A.; Pezzolato, M.; Biasibetti, E.; Bozzetta, E. Omics applications in the fight against abuse of anabolic substances in cattle: Challenges, perspectives, and opportunities. Curr. Opin. Food Sci. 2021, 40, 112–120. [Google Scholar] [CrossRef]
- Moretti, S.; Lega, F.; Rigoni, L.; Saluti, G.; Giusepponi, D.; Gioiello, A.; Manuali, E.; Rossi, R.; Galarini, R. Multiclass screening method to detect more than fifty banned substances in bovine bile and urine. Anal. Chim. Acta 2018, 1032, 56–67. [Google Scholar] [CrossRef]
- Kademi, H.I.; Ulusoy, B.H.; Hecer, C. Applications of miniaturized and portable near infrared spectroscopy (NIRS) for inspection and control of meat and meat products. Food Rev. Int. 2018, 35, 201–220. [Google Scholar] [CrossRef]


| EtOH Tissue | N f+ | T f− | Error Rate | Prob. Total |
|---|---|---|---|---|
| Longissimus thoracis muscle-MLT | 0.00 ** | 0.00 ** | 0.00 | 0.0001 |
| Skin-Dermis | 0.25 | 0.00 ** | 0.10 | 0.0003 |
| Fat | 0.25 | 0.08 ** | 0.15 | 0.0017 |
| Thymus | 0.25 | 0.25+ | 0.25 | 0.0253 |
| Semitendinosus muscle-MST | 0.25 | 0.25+ | 0.25 | 0.0253 |
| Sternomandibularis muscle-MSM | 0.38 | 0.25+ | 0.30 | 0.0736 |
| Skin-hair | 0.38 | 0.33 | 0.35 | 0.1797 |
| Total error | 0.20 | <0.0001 | ||
| Specificity (1-false+) | 0.75 | 0.0001 | ||
| Sensitivity (1-false−) | 0.83 | <0.0001 | ||
| Specificity vs. Sensitivity | 0.75 | 0.83 | 0.2498 |
| EtOH Tissue | Mean Rate | a. UV-Vis-NIR 350–1025 nm | b. NIR 740–1070 nm | c. UV-Vis 350–681 nm | |||
|---|---|---|---|---|---|---|---|
| N f+ | T f− | N f+ | T f− | N f+ | T f− | ||
| Semitendinosus muscle-MST | 0.05 | 0.25 | 0.00 ** | 0.00 ** | 0.00 ** | 0.13 * | 0.00 ** |
| Thymus | 0.06 | 0.00 ** | 0.08 ** | 0.25 | 0.08 ** | 0.00 ** | 0.00 ** |
| Longissimus thoracis muscle-MLT | 0.24 | 0.00 ** | 0.00 ** | 0.50 | 0.25+ | 0.38 | 0.17 ** |
| Skin–Hair | 0.39 | 0.25 | 0.50 | 0.38 | 0.42 | 0.00 ** | 0.08 ** |
| Sternomandibularis muscle-MSM | 0.42 | 0.38 | 0.33 | 0.63 | 0.58 | 0.38 | 0.17 ** |
| Skin-Dermis | 0.46 | 0.50 | 0.50 | 0.25 | 0.25+ | 0.50 | 0.33 |
| Fat | 0.48 | 0.63 | 0.33 | 0.50 | 0.42 | 0.38 | 0.25+ |
| Validated misclassification | Rate | 0.29 ** | 0.25 ** | 0.36 * | 0.29 ** | 0.25 ** | 0.14 ** |
| False+ vs. False− | Prob. | 0.6011 | 0.3863 | 0.1011 | |||
| Validated misclassification of the “cut-off spectra” | 0.26 ** | 0.31 ** | 0.19 ** | ||||
| Probability of contrasts | “Cut-off a” | 1.000 | 0.3549 | 0.1615 | |||
| “Cut-off b” | 1.000 | 0.0206 | |||||
| Animal | Treatment | Tissues | |||
|---|---|---|---|---|---|
| Fat (1) | MSM (2) | Thymus (3) | Combined Sum (1 & 2 & 3 *) | ||
| 1 | T | * | * | * | 3 |
| 2 | T | 0 | |||
| 3 | T | * | * | 2 | |
| 4 | T | 0 | |||
| 5 | T | 0 | |||
| 6 | T | * | * | 2 | |
| 7 | T | * | 1 | ||
| 8 | T | 0 | |||
| 9 | T | * | * | 2 | |
| 10 | T | * | 1 | ||
| 11 | T | * | 1 | ||
| 12 | T | * | 1 | ||
| Error rate T False− | 0.42 | 0.58 | 0.08 | ||
| * Misclassification in repeated tissues from 12 treated animals | |||||
| 1 False−/12 = 0.33; 2 False−/12 = 0.25; 3 False−/12 = 0.08 0.11 | |||||
| 13 | N | * | * | 2 | |
| 14 | N | * | 1 | ||
| 15 | N | * | 1 | ||
| 16 | N | * | 1 | ||
| 17 | N | * | 1 | ||
| 18 | N | * | * | 2 | |
| 19 | N | * | 1 | ||
| 20 | N | * | * | 2 | |
| Error rate N False+ | 0.50 | 0.63 | 0.25 | ||
| * Misclassification in repeated tissues from 8 control animals | |||||
| 1 False+/8 = 0.63; 2 False+/8 = 0.38; 3 False+/8 = 0.00 | |||||
Publisher’s Note: MDPI stays neutral with regard to jurisdictional claims in published maps and institutional affiliations. |
© 2022 by the authors. Licensee MDPI, Basel, Switzerland. This article is an open access article distributed under the terms and conditions of the Creative Commons Attribution (CC BY) license (https://creativecommons.org/licenses/by/4.0/).
Share and Cite
Barbera, S.; Masoero, G.; Nebbia, C. The Near-Infrared Spectroscopy of Ethanol-Fixed Tissues to Detect Illicit Treatments with Glucocorticoids in Bulls. Foods 2022, 11, 3001. https://doi.org/10.3390/foods11193001
Barbera S, Masoero G, Nebbia C. The Near-Infrared Spectroscopy of Ethanol-Fixed Tissues to Detect Illicit Treatments with Glucocorticoids in Bulls. Foods. 2022; 11(19):3001. https://doi.org/10.3390/foods11193001
Chicago/Turabian StyleBarbera, Salvatore, Giorgio Masoero, and Carlo Nebbia. 2022. "The Near-Infrared Spectroscopy of Ethanol-Fixed Tissues to Detect Illicit Treatments with Glucocorticoids in Bulls" Foods 11, no. 19: 3001. https://doi.org/10.3390/foods11193001