
Structural, Thermal and Pasting Properties of Heat-Treated Lotus Seed Starch–Protein Mixtures
 and
and
Abstract
:1. Introduction
2. Materials and Methods
2.1. Materials
2.1.1. Extraction of Lotus Seed Starch (LS)
2.1.2. Extraction of Lotus Seed Protein (LP)
2.2. Preparation of Lotus Seed Starch–Protein Mixtures (LS-LP)
2.3. Fourier Transform Infrared (FTIR) Spectroscopy
2.4. UV–Visible Absorption Spectra
2.5. X-ray Diffraction (XRD)
2.6. Scanning Electron Microscopy (SEM)
2.7. Pasting Properties
2.8. Thermal Properties
2.9. Swelling Power and Solubility of Mixtures
2.10. Data Analysis
3. Results
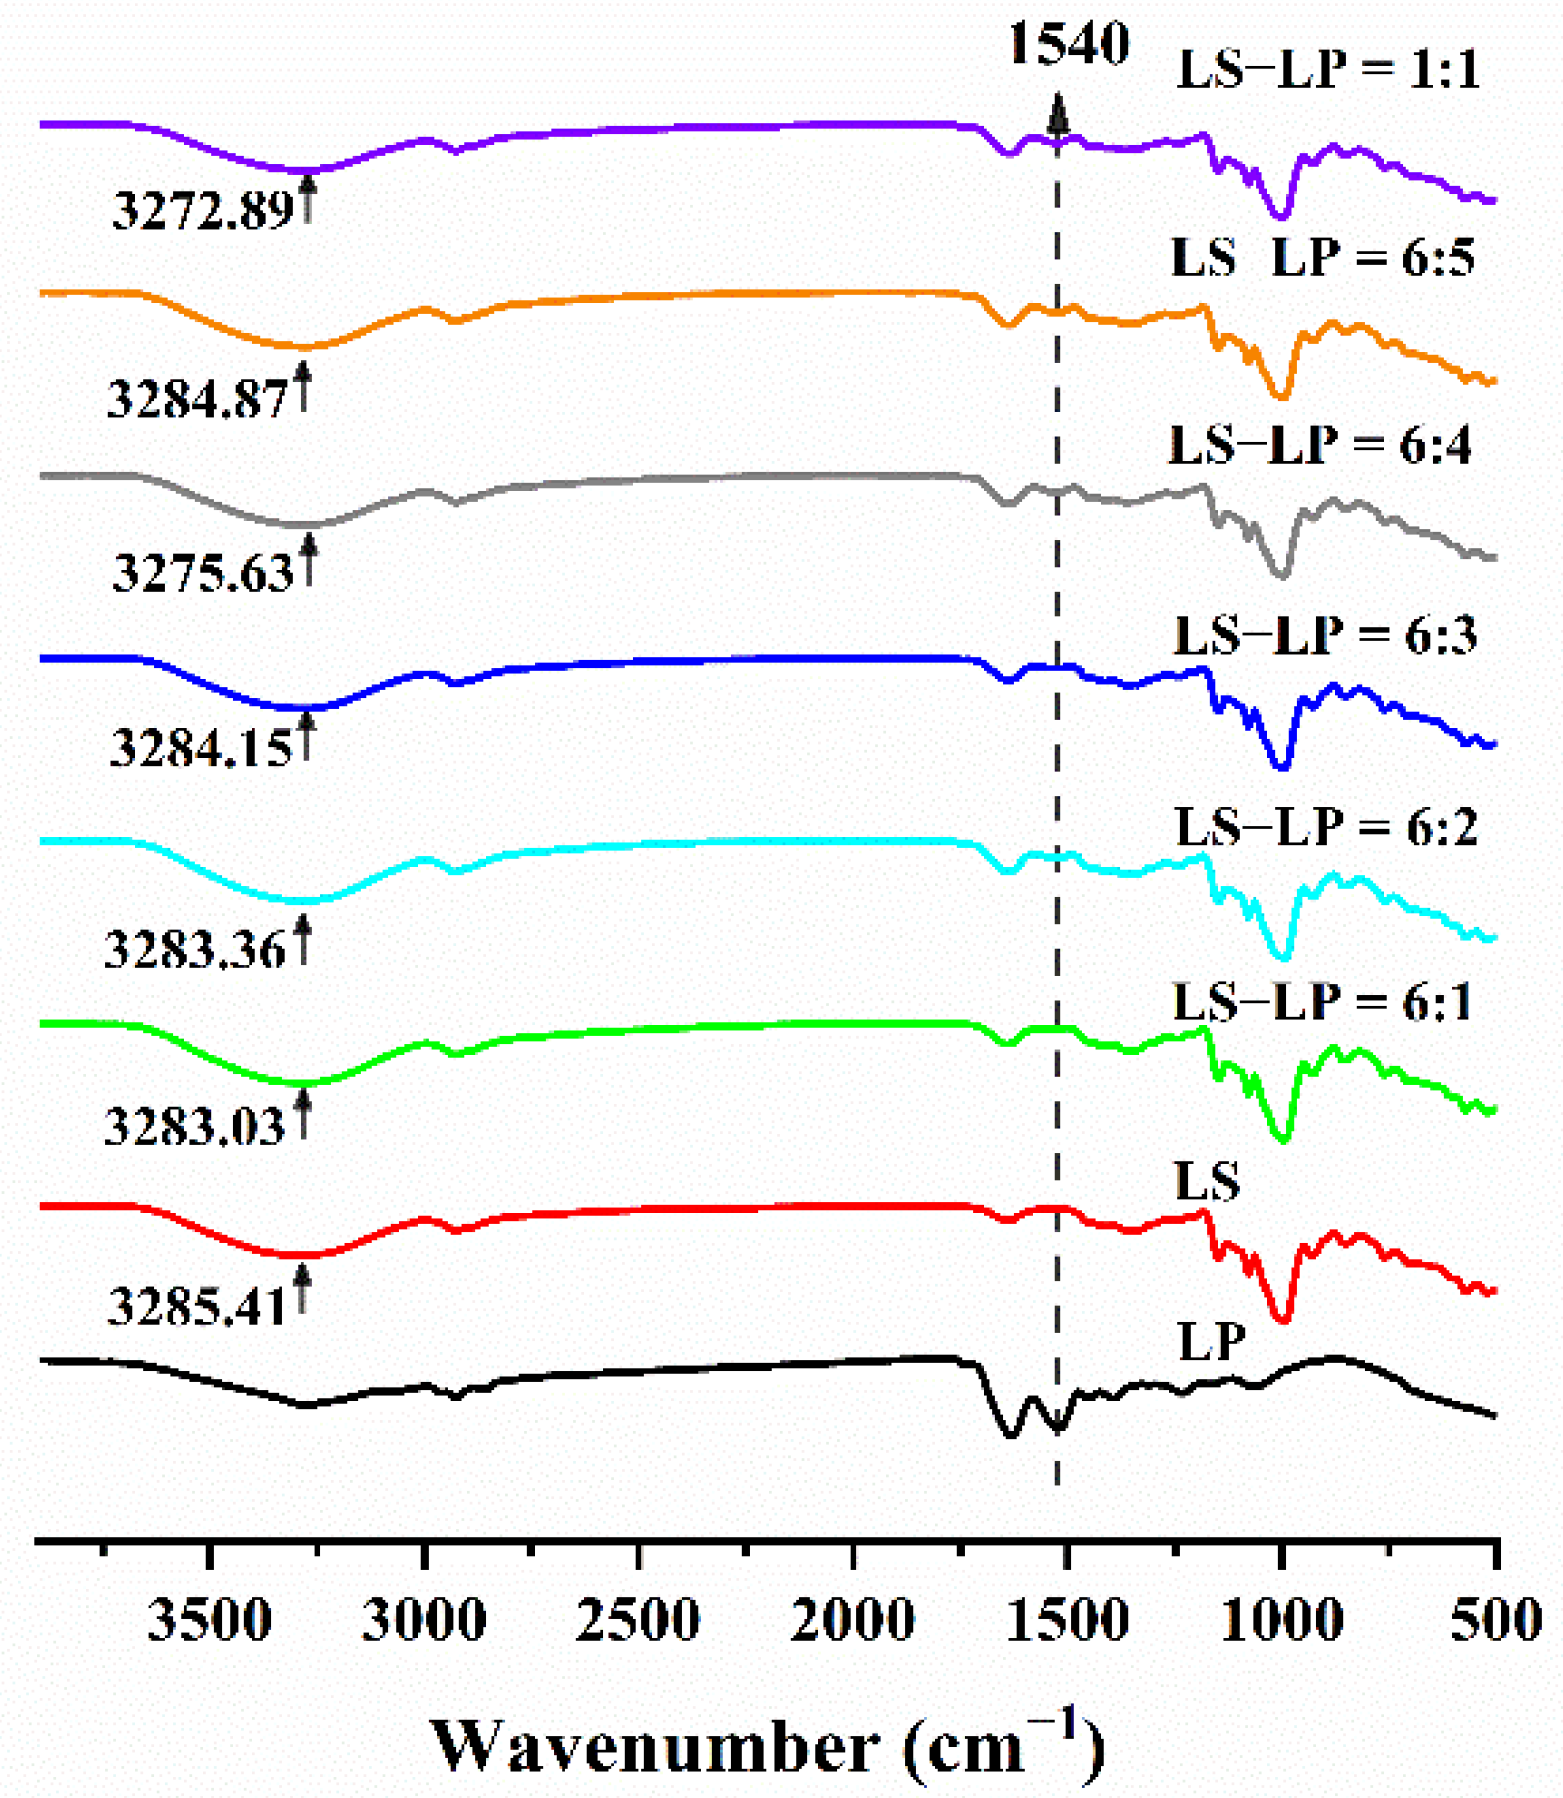
3.1. FTIR Spectroscopy
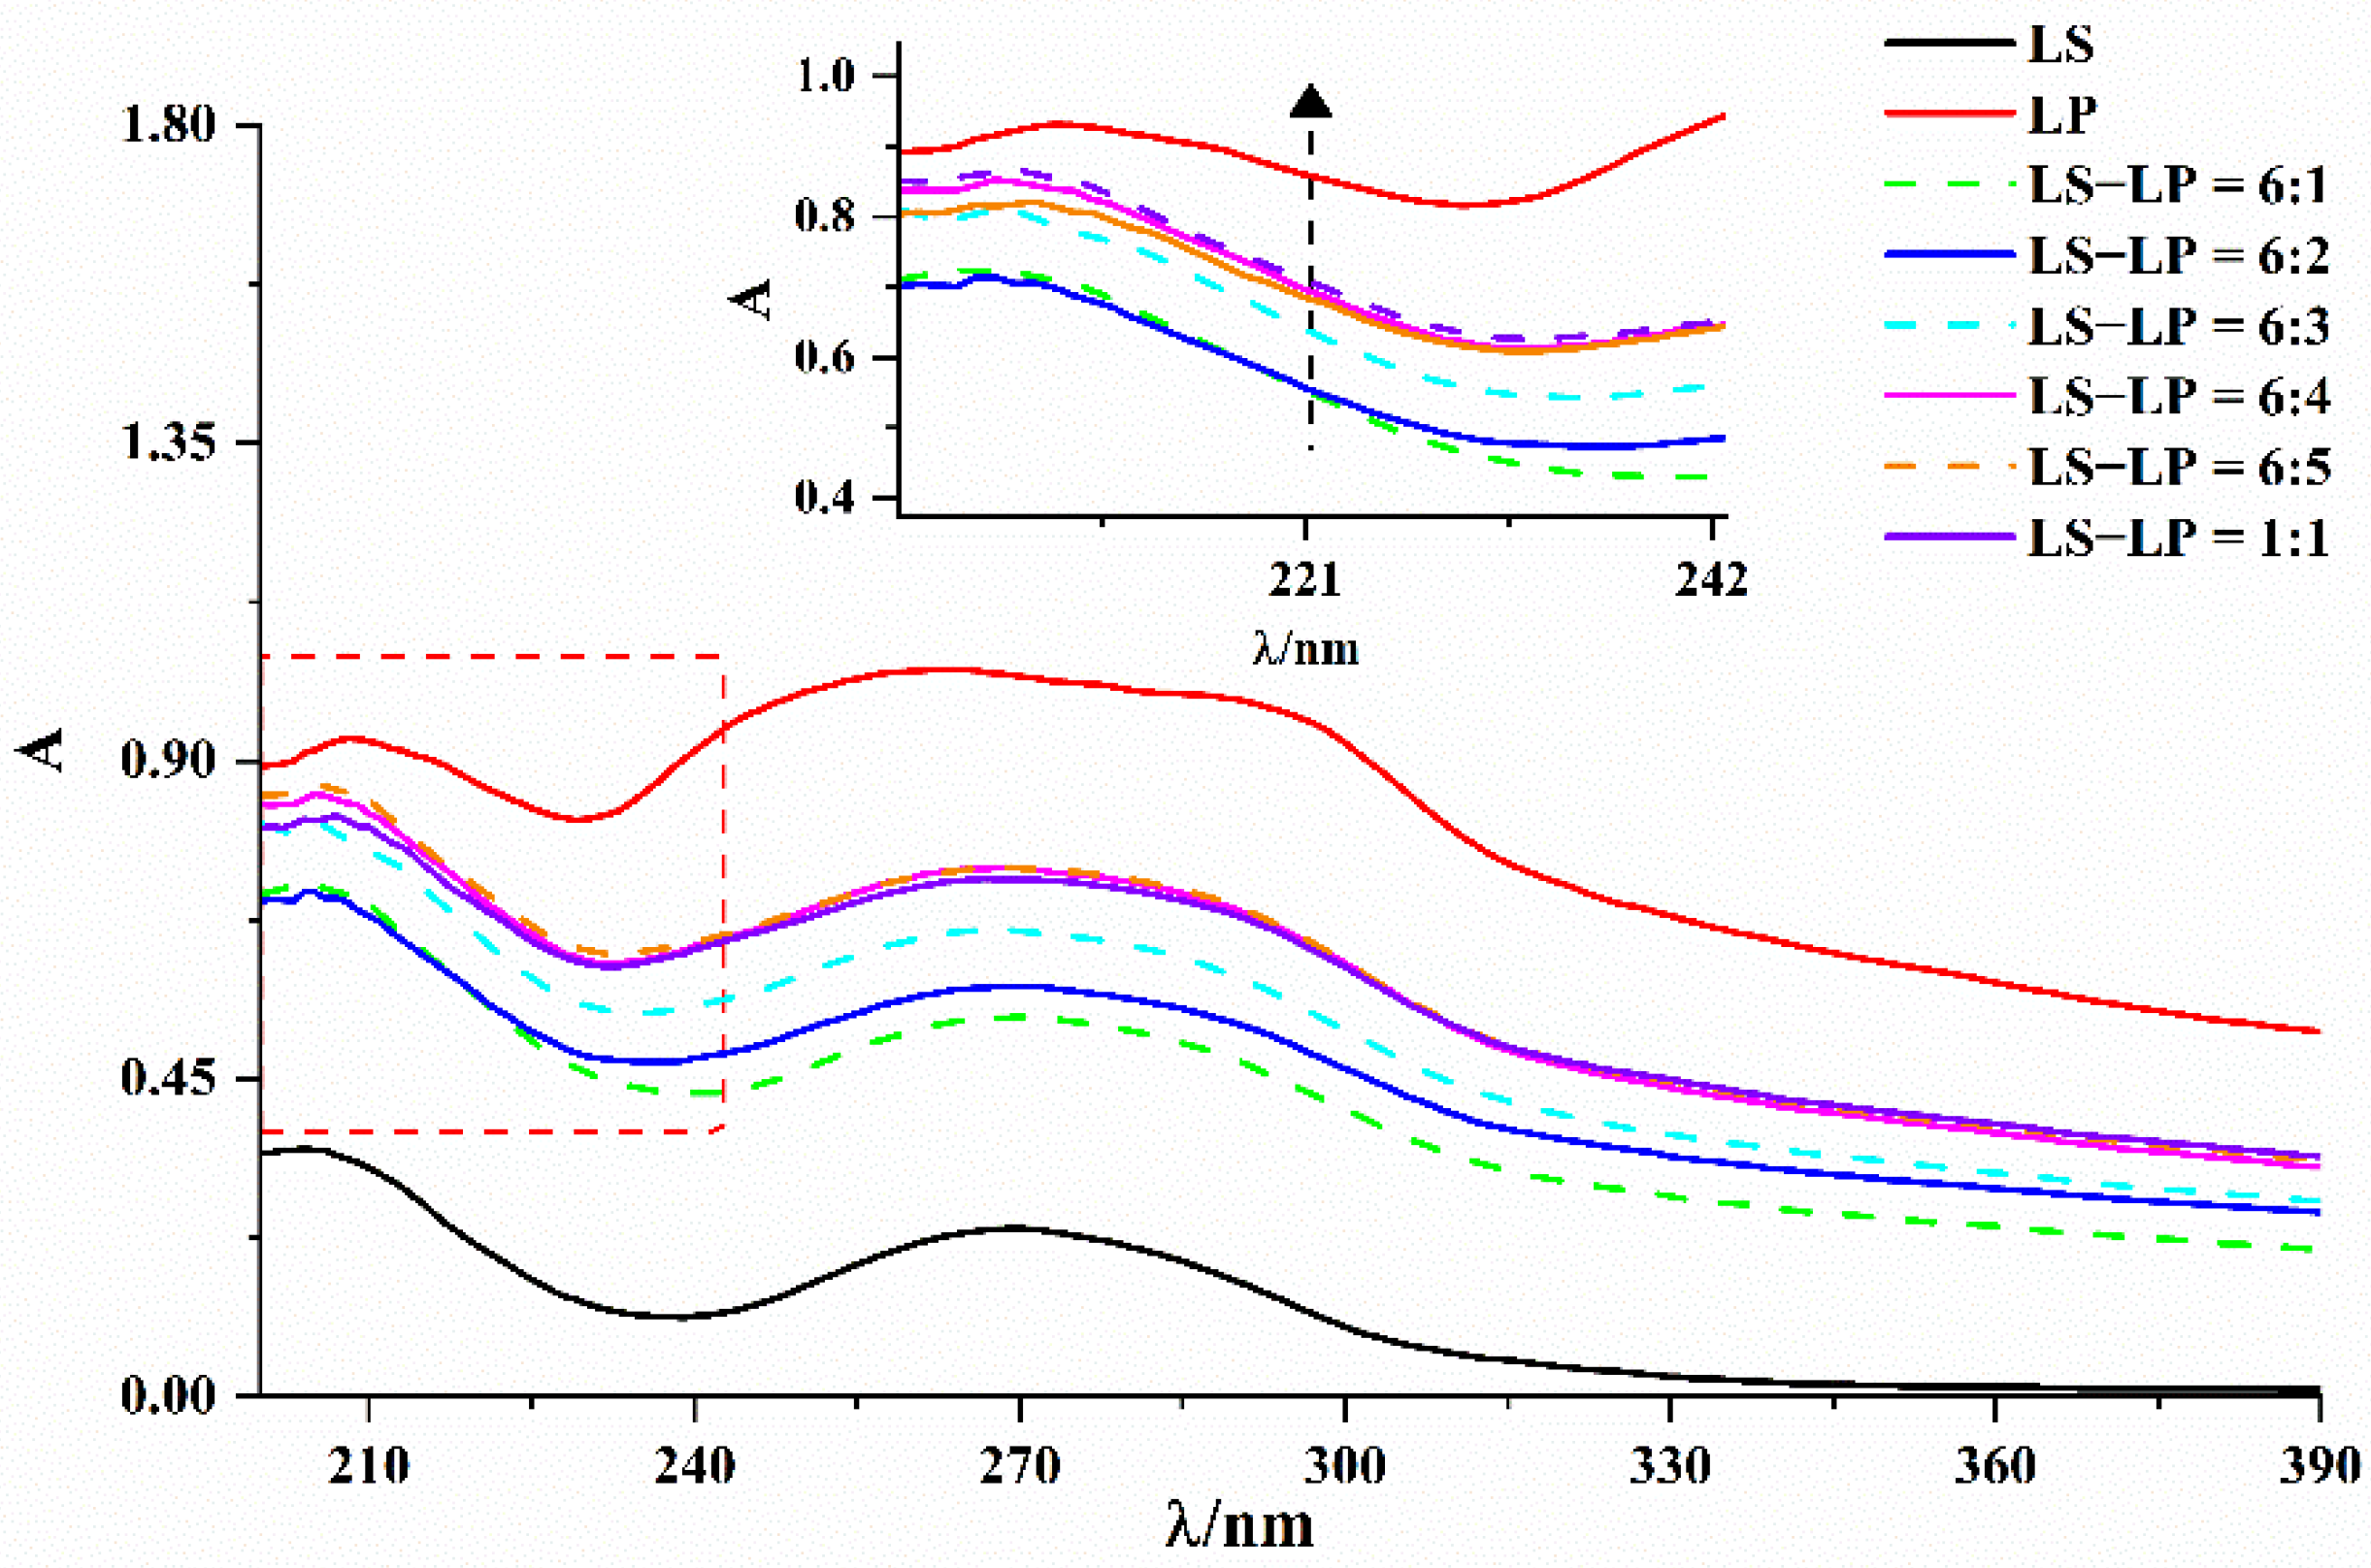
3.2. UV–Visible Absorption Spectra
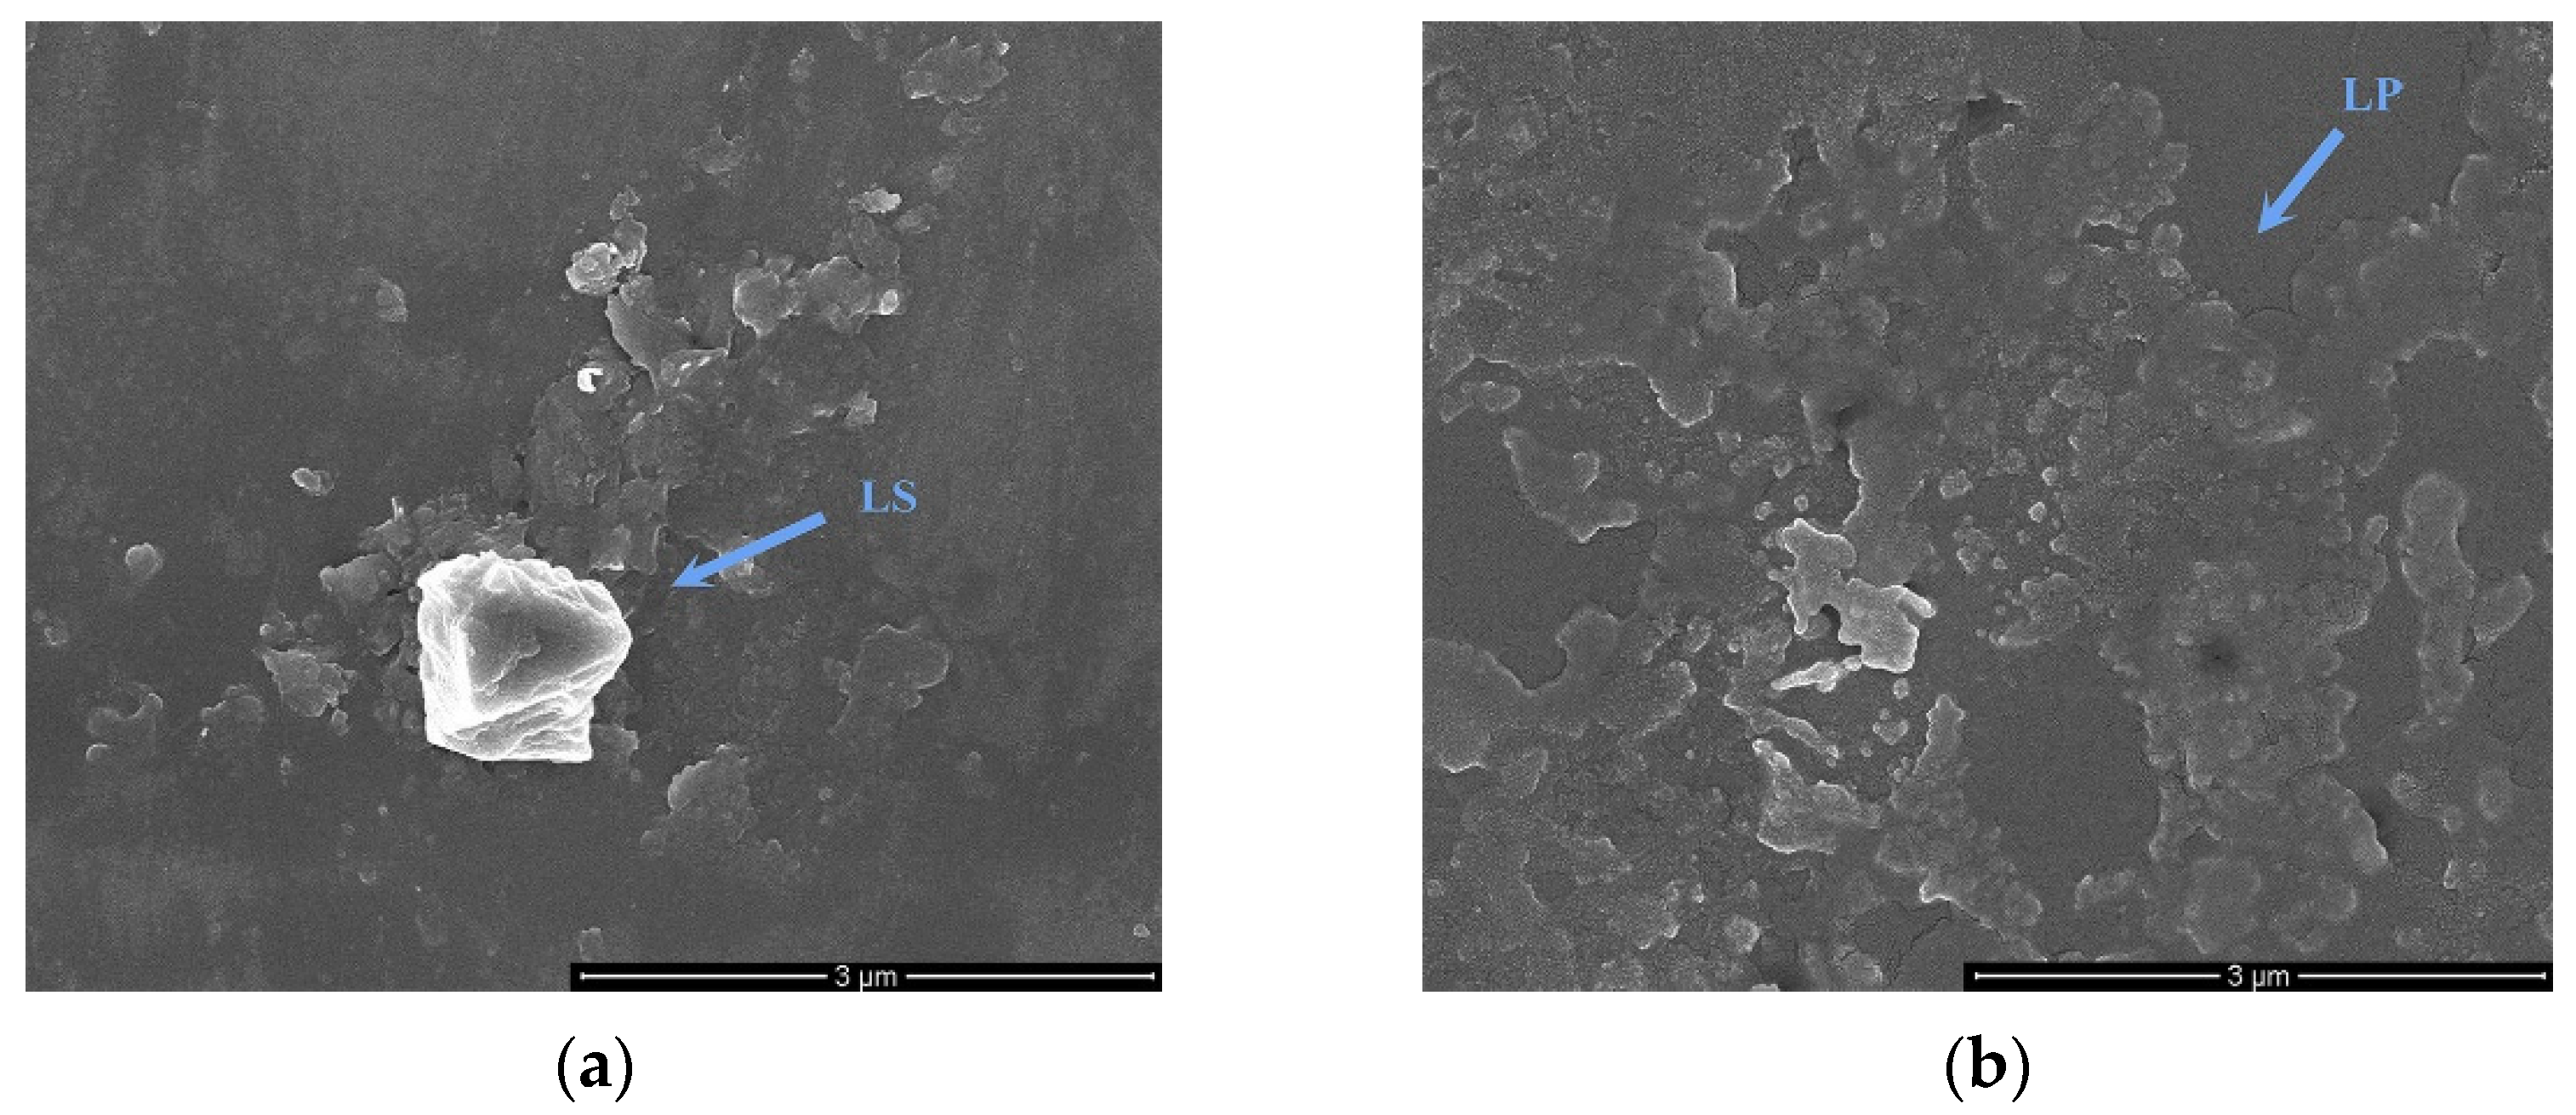
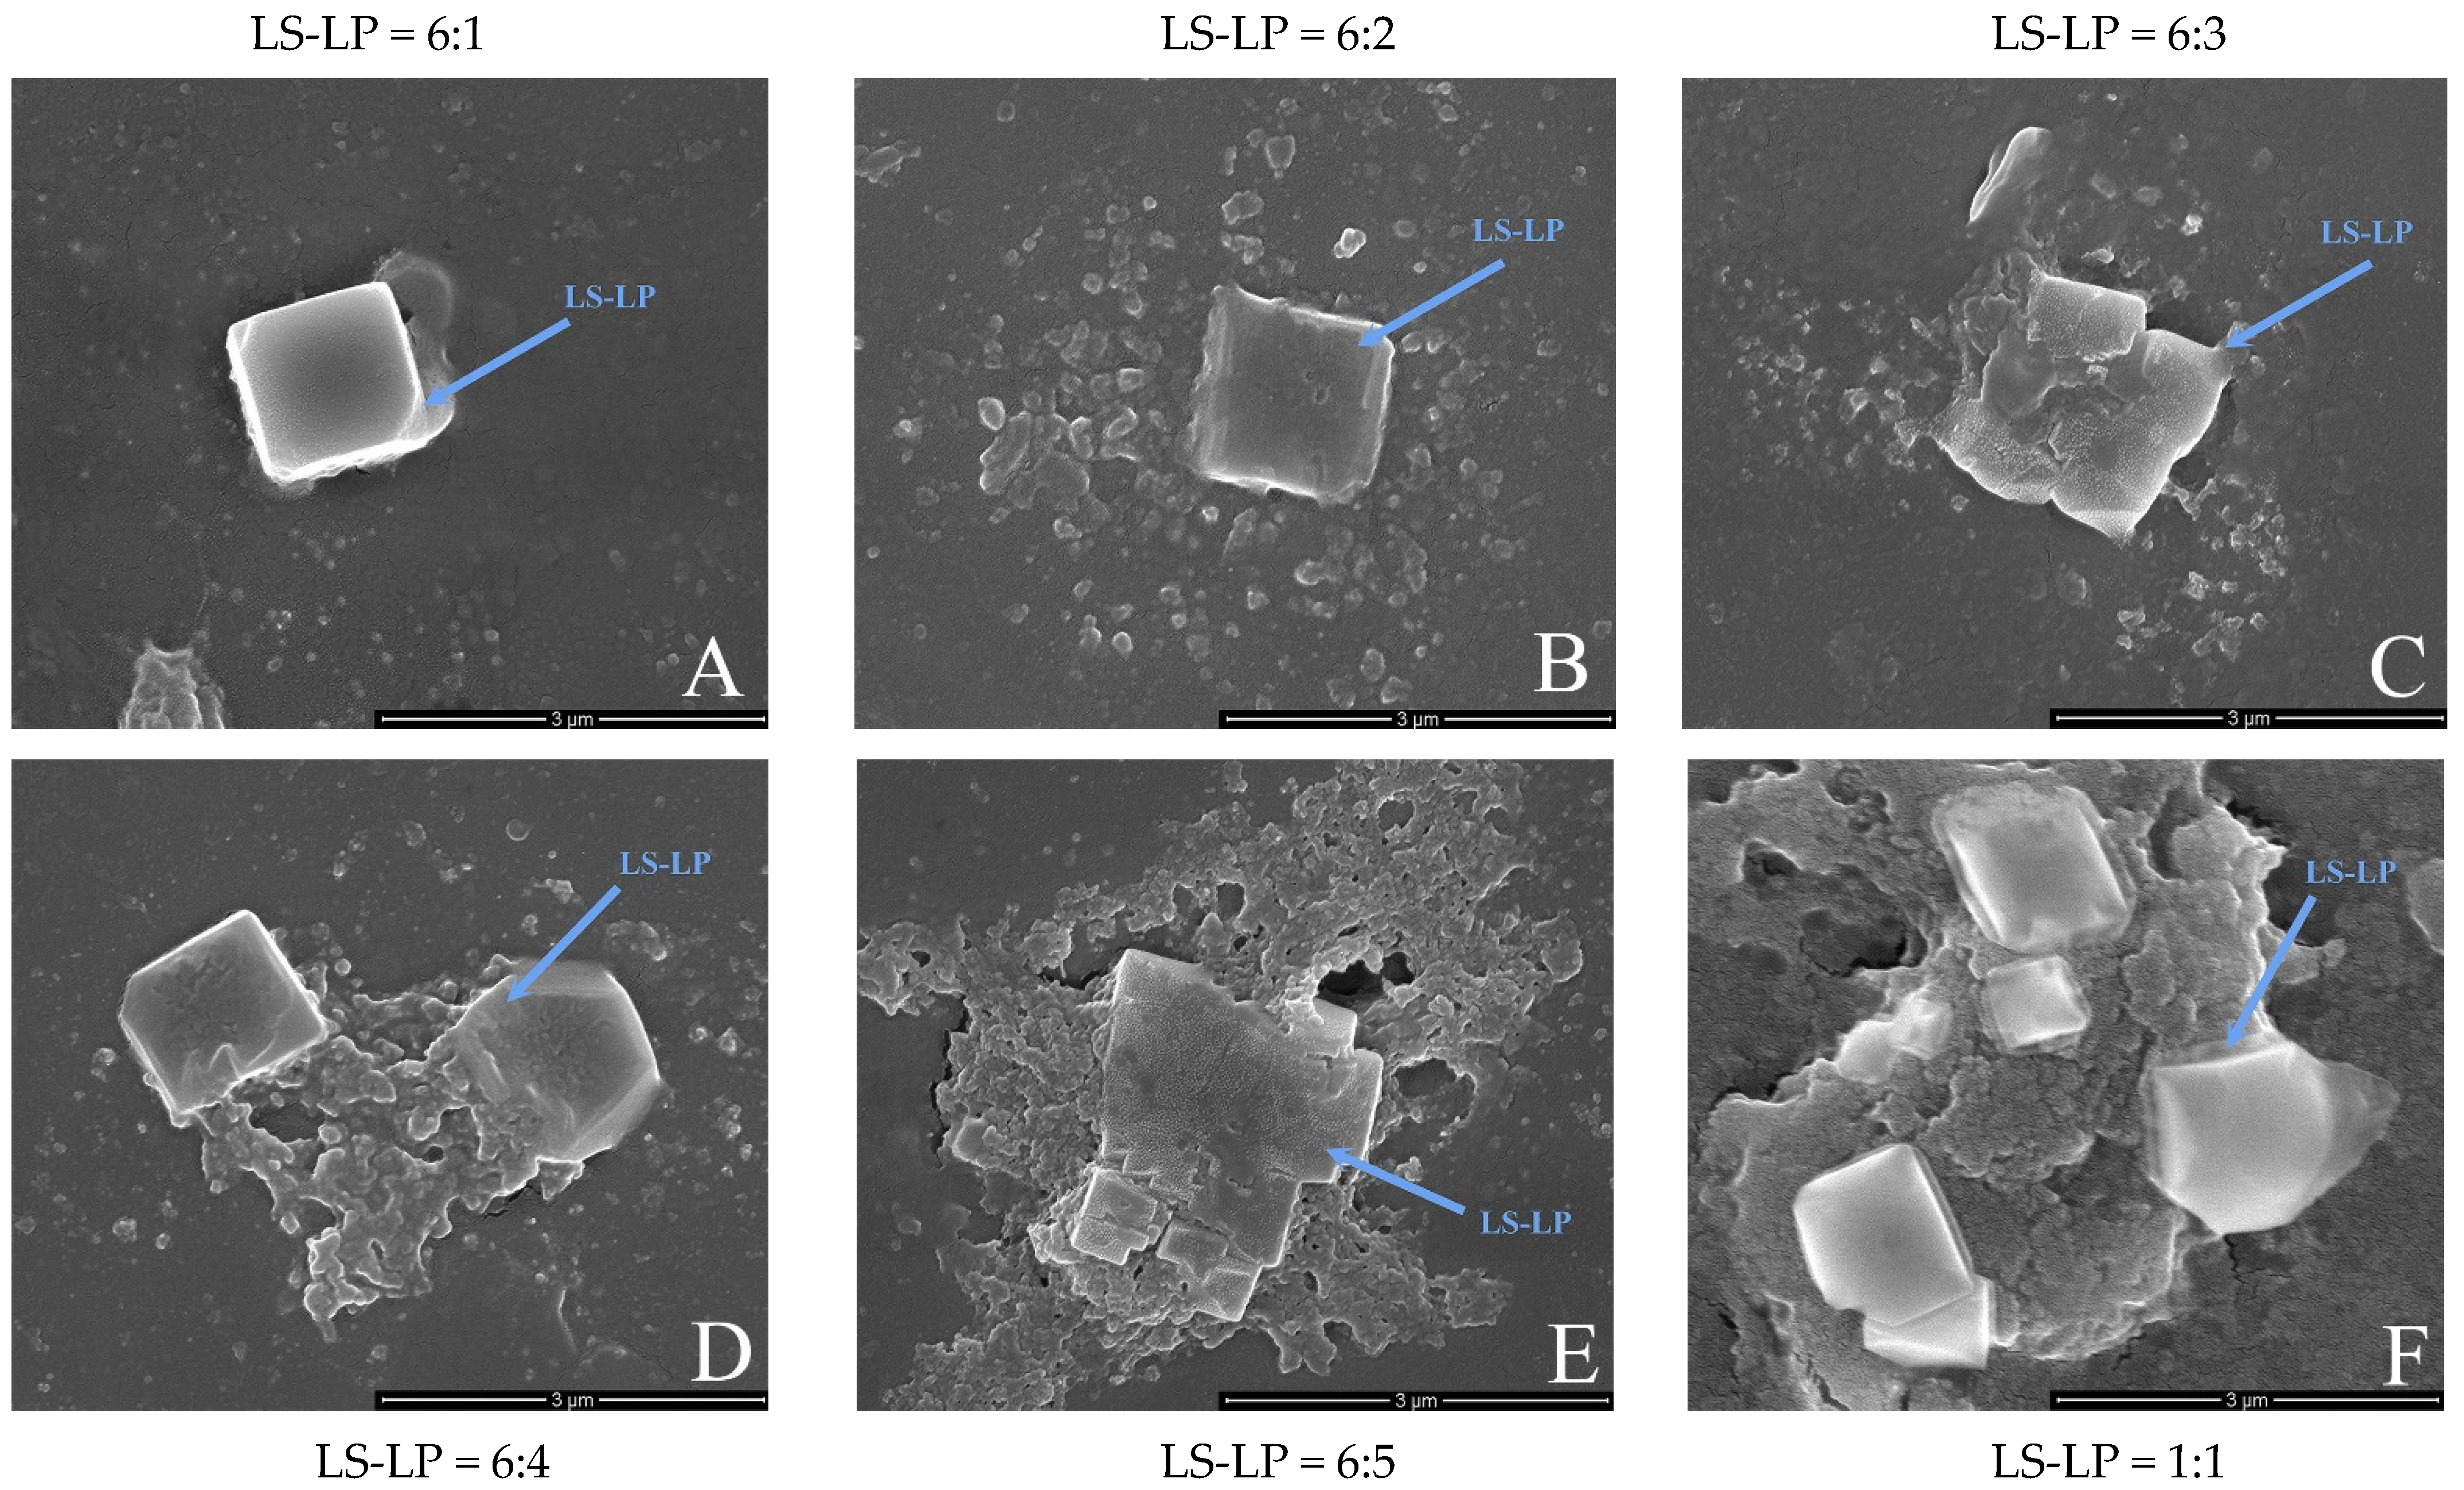
3.3. SEM
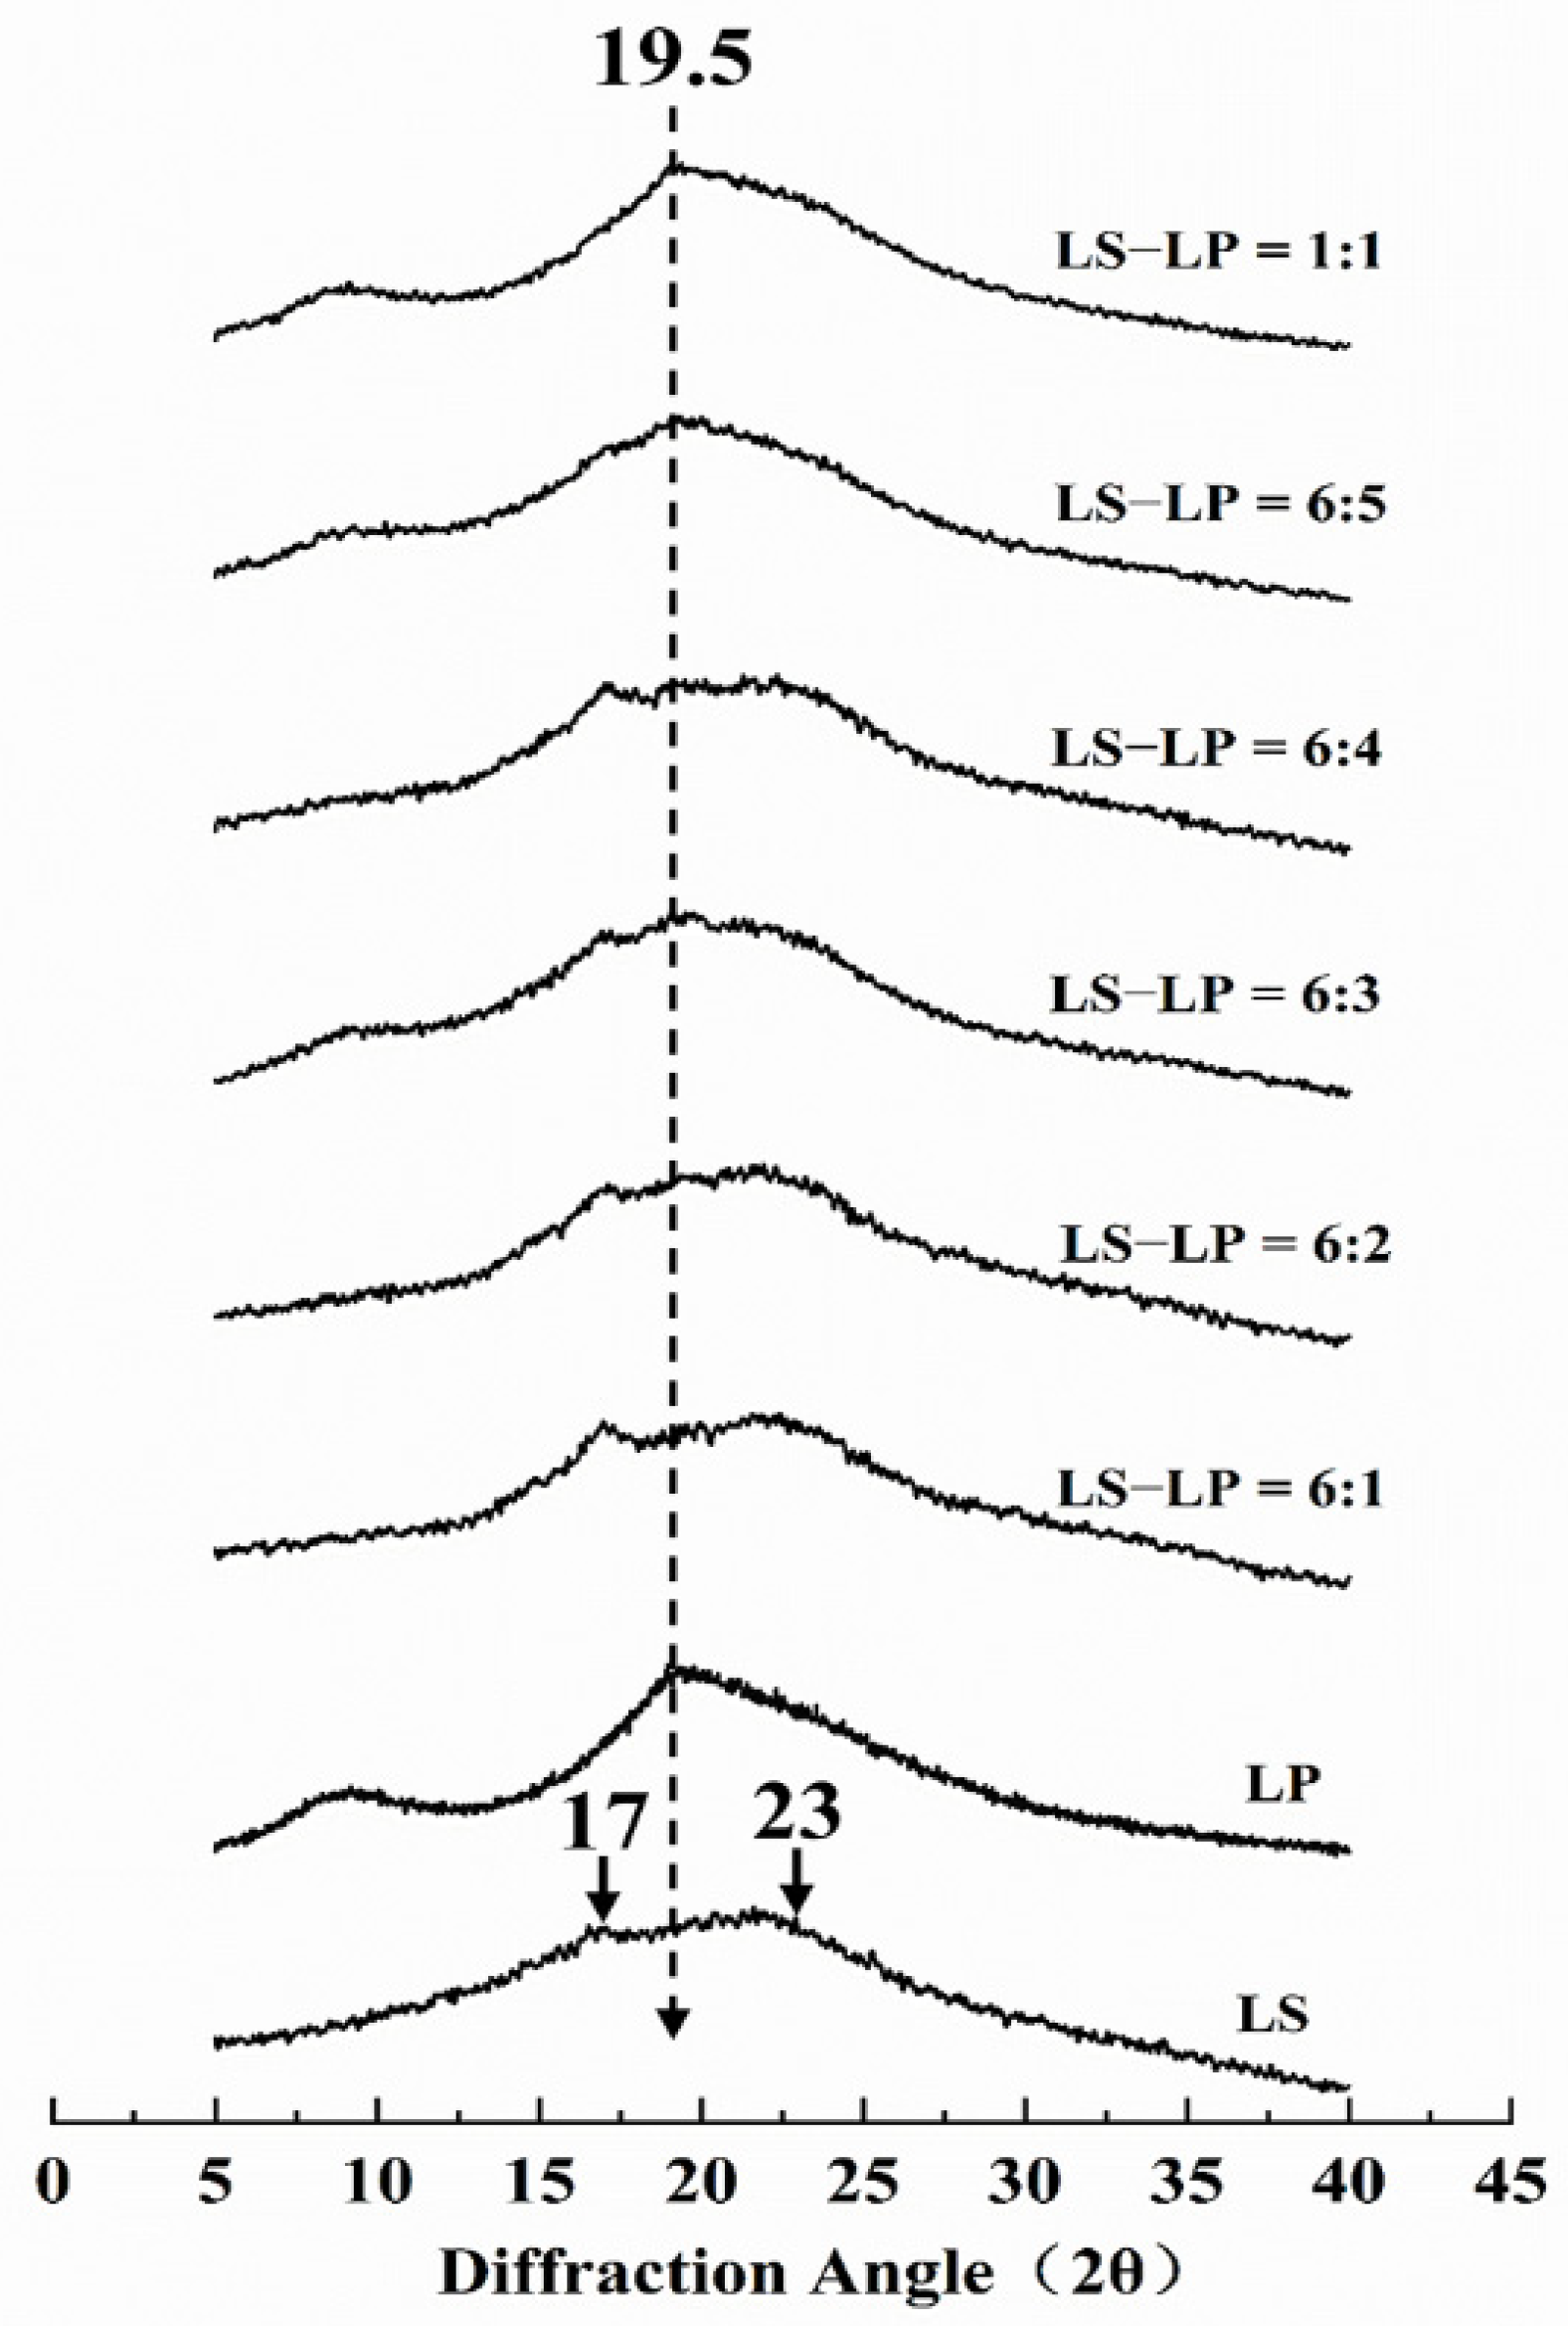
3.4. XRD
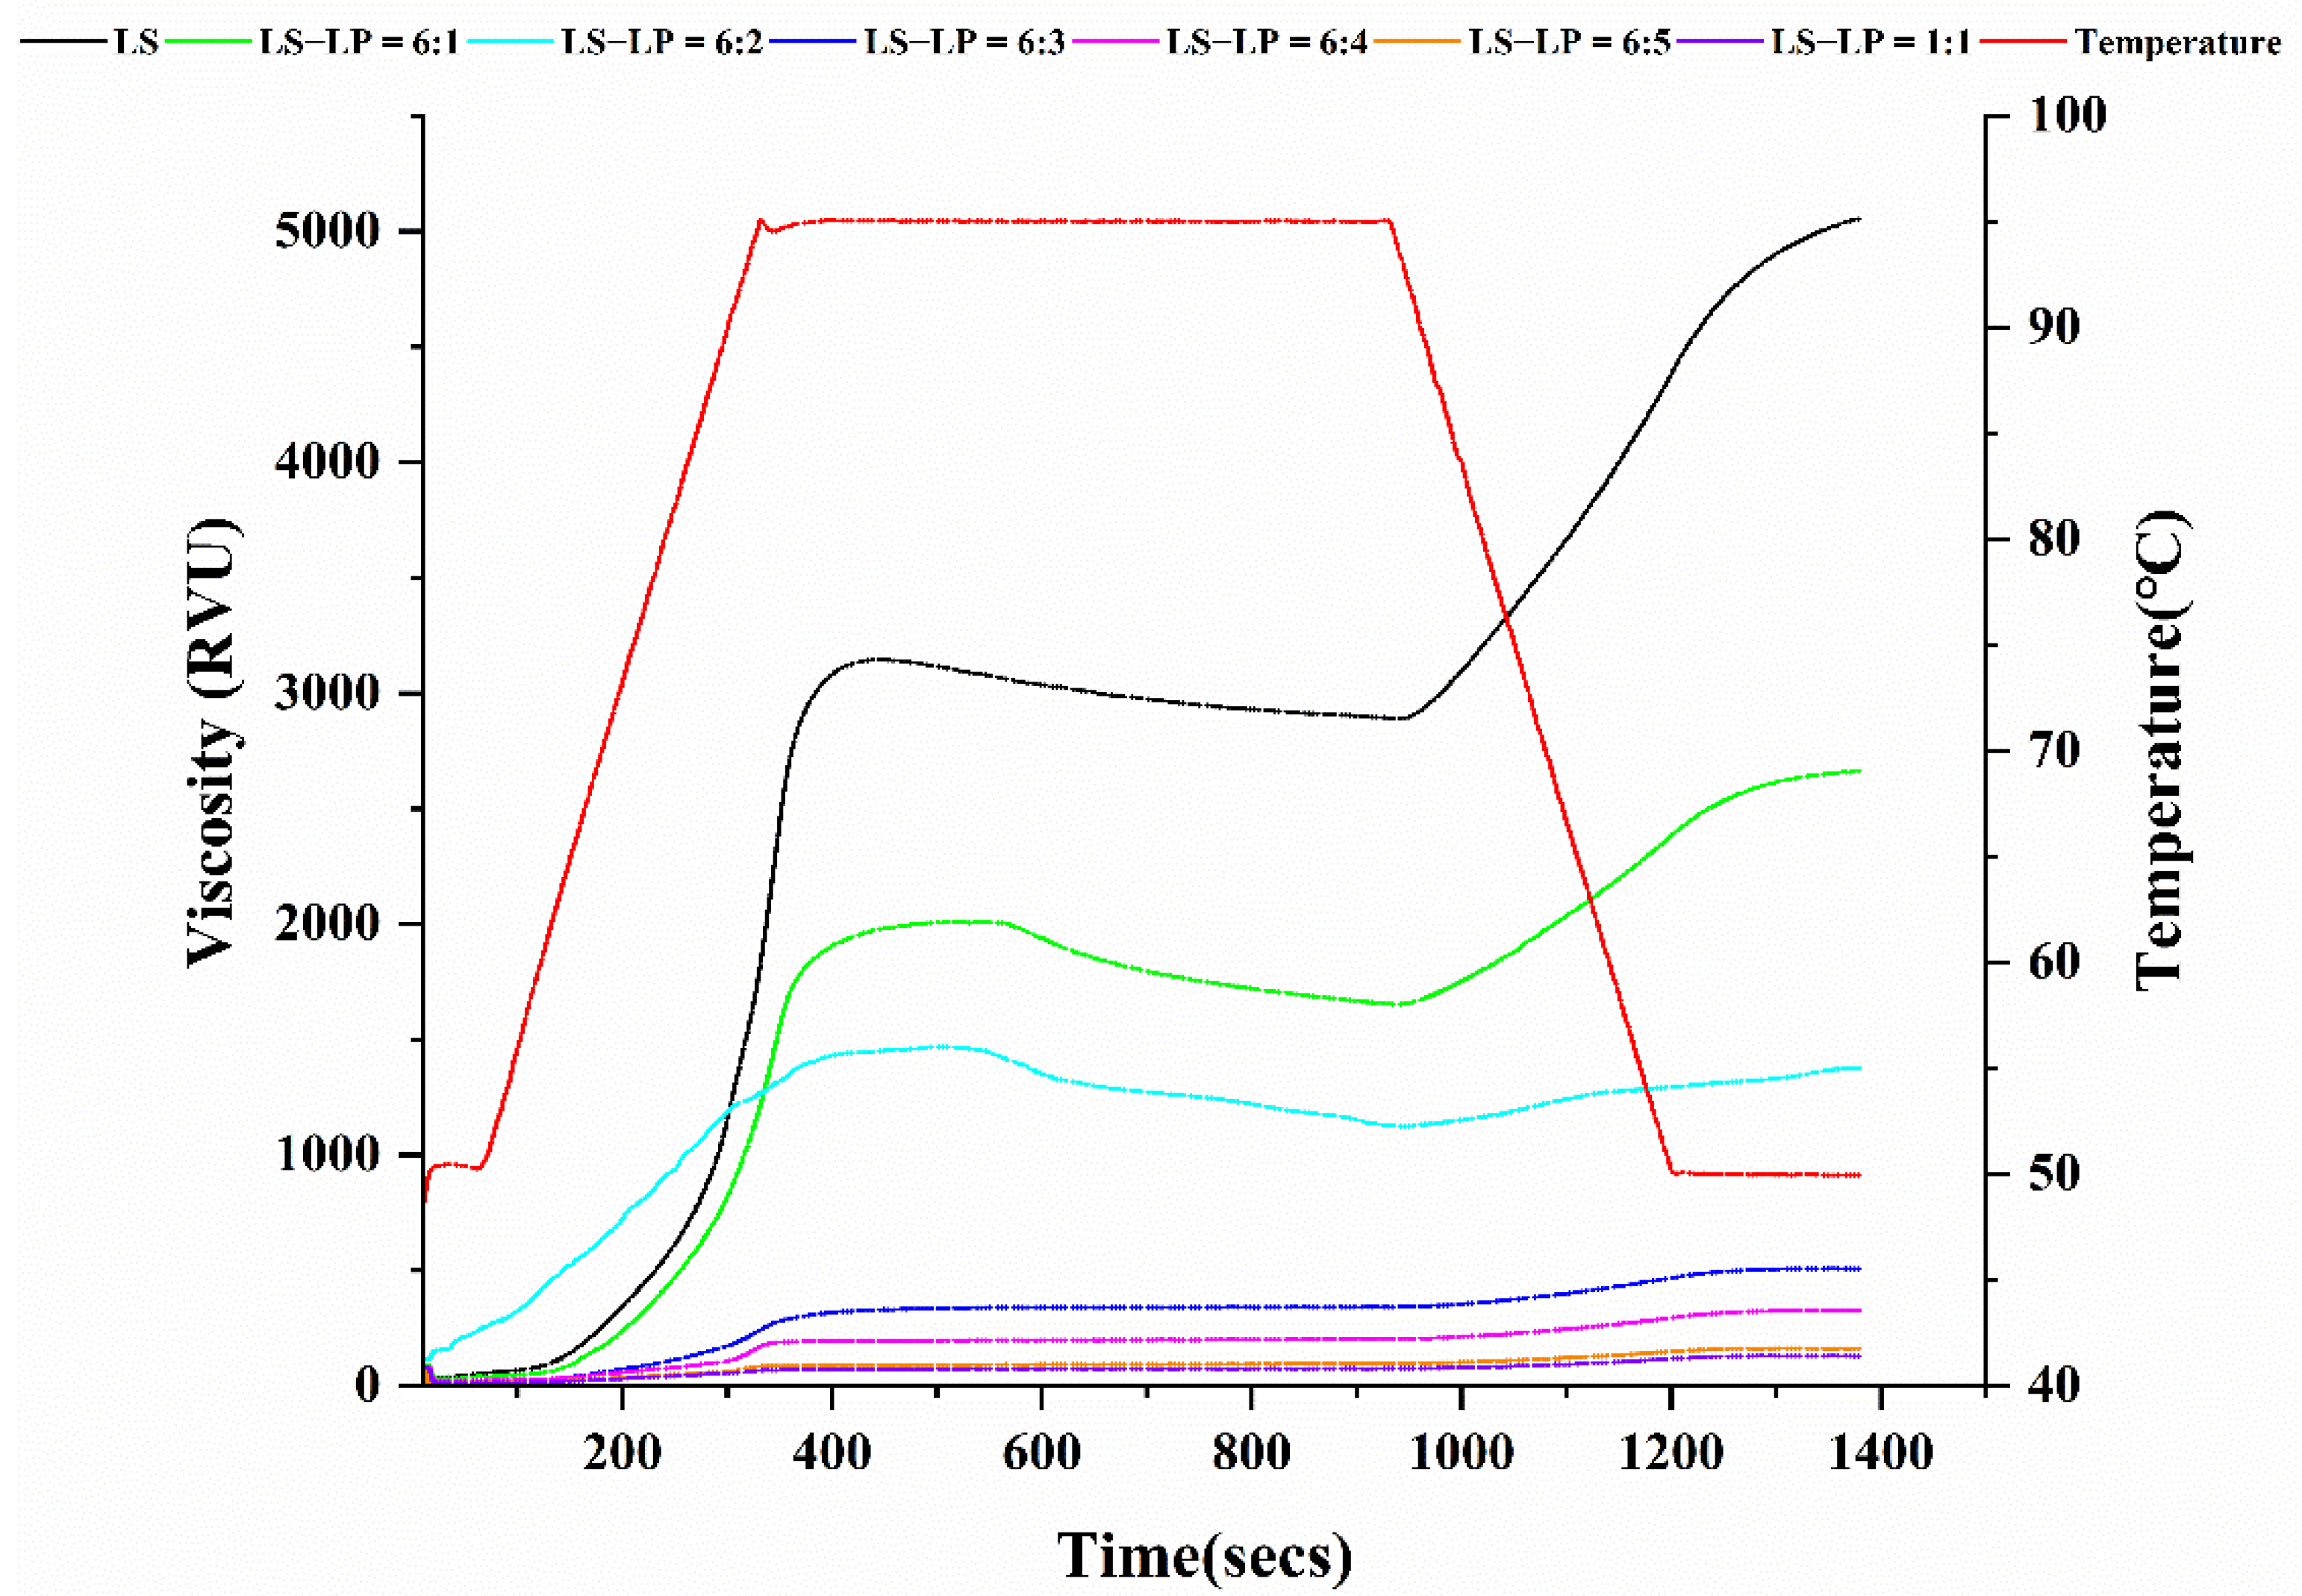
3.5. Pasting Properties
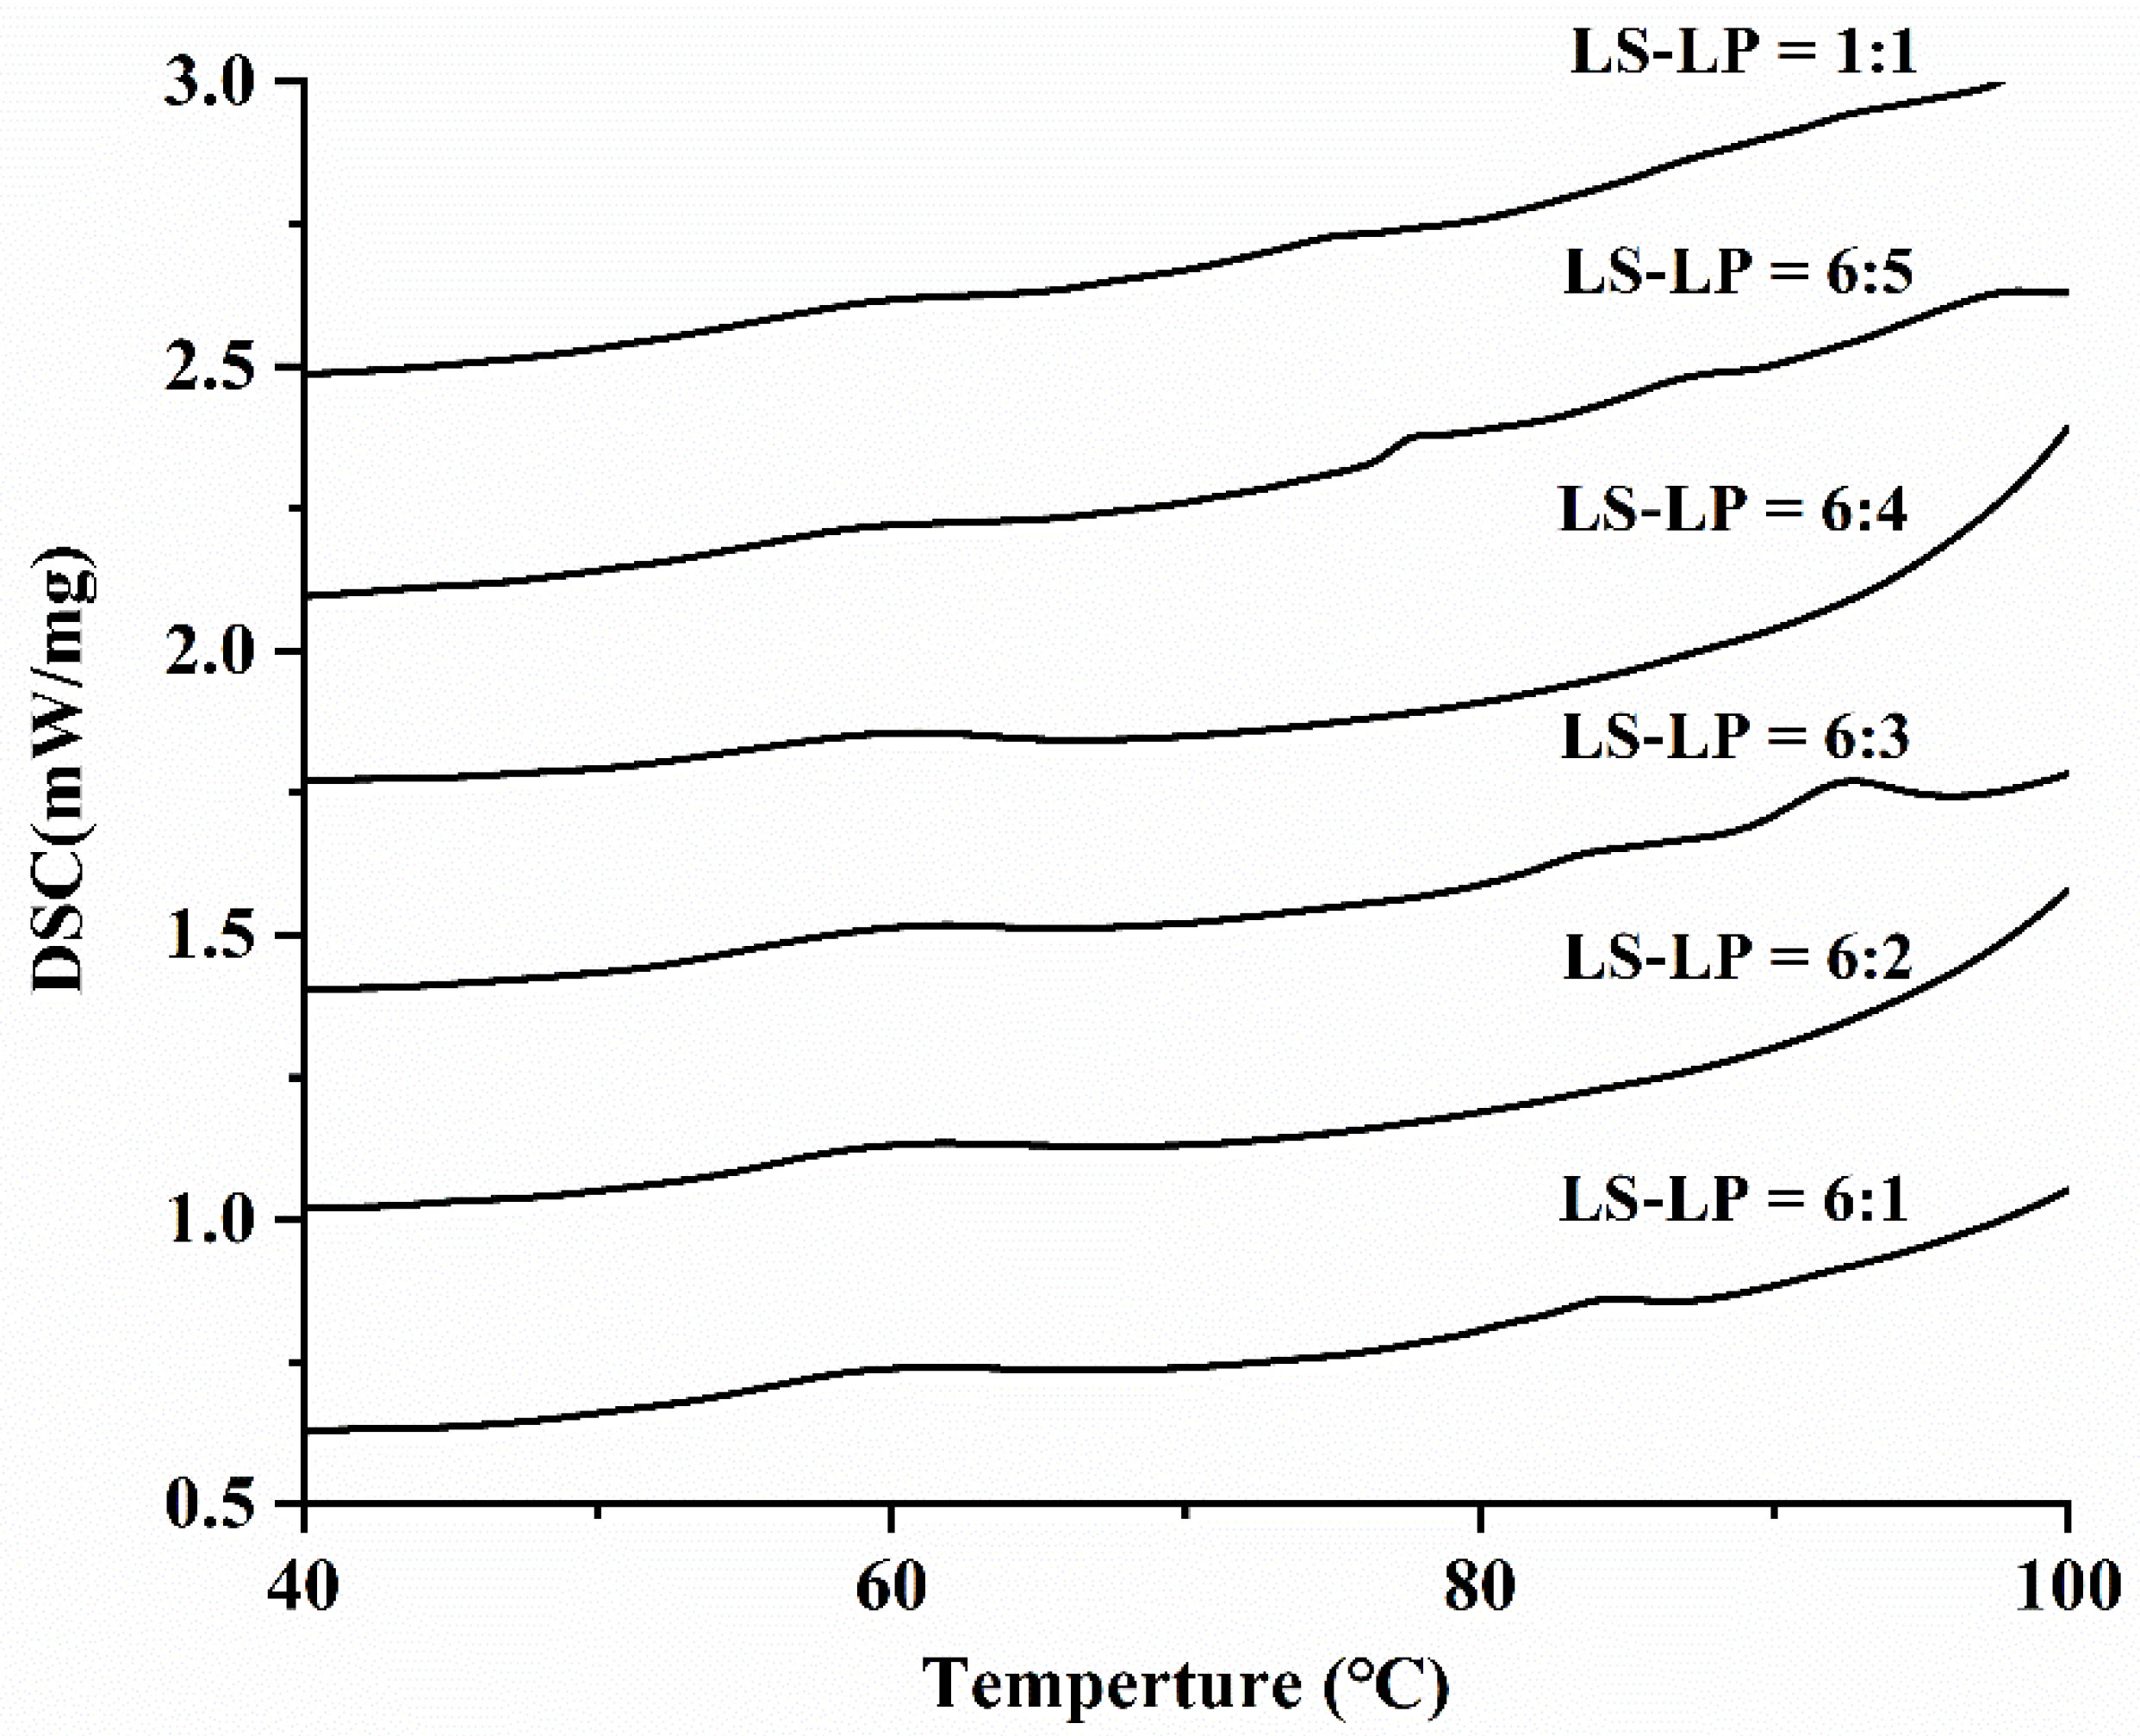
3.6. DSC
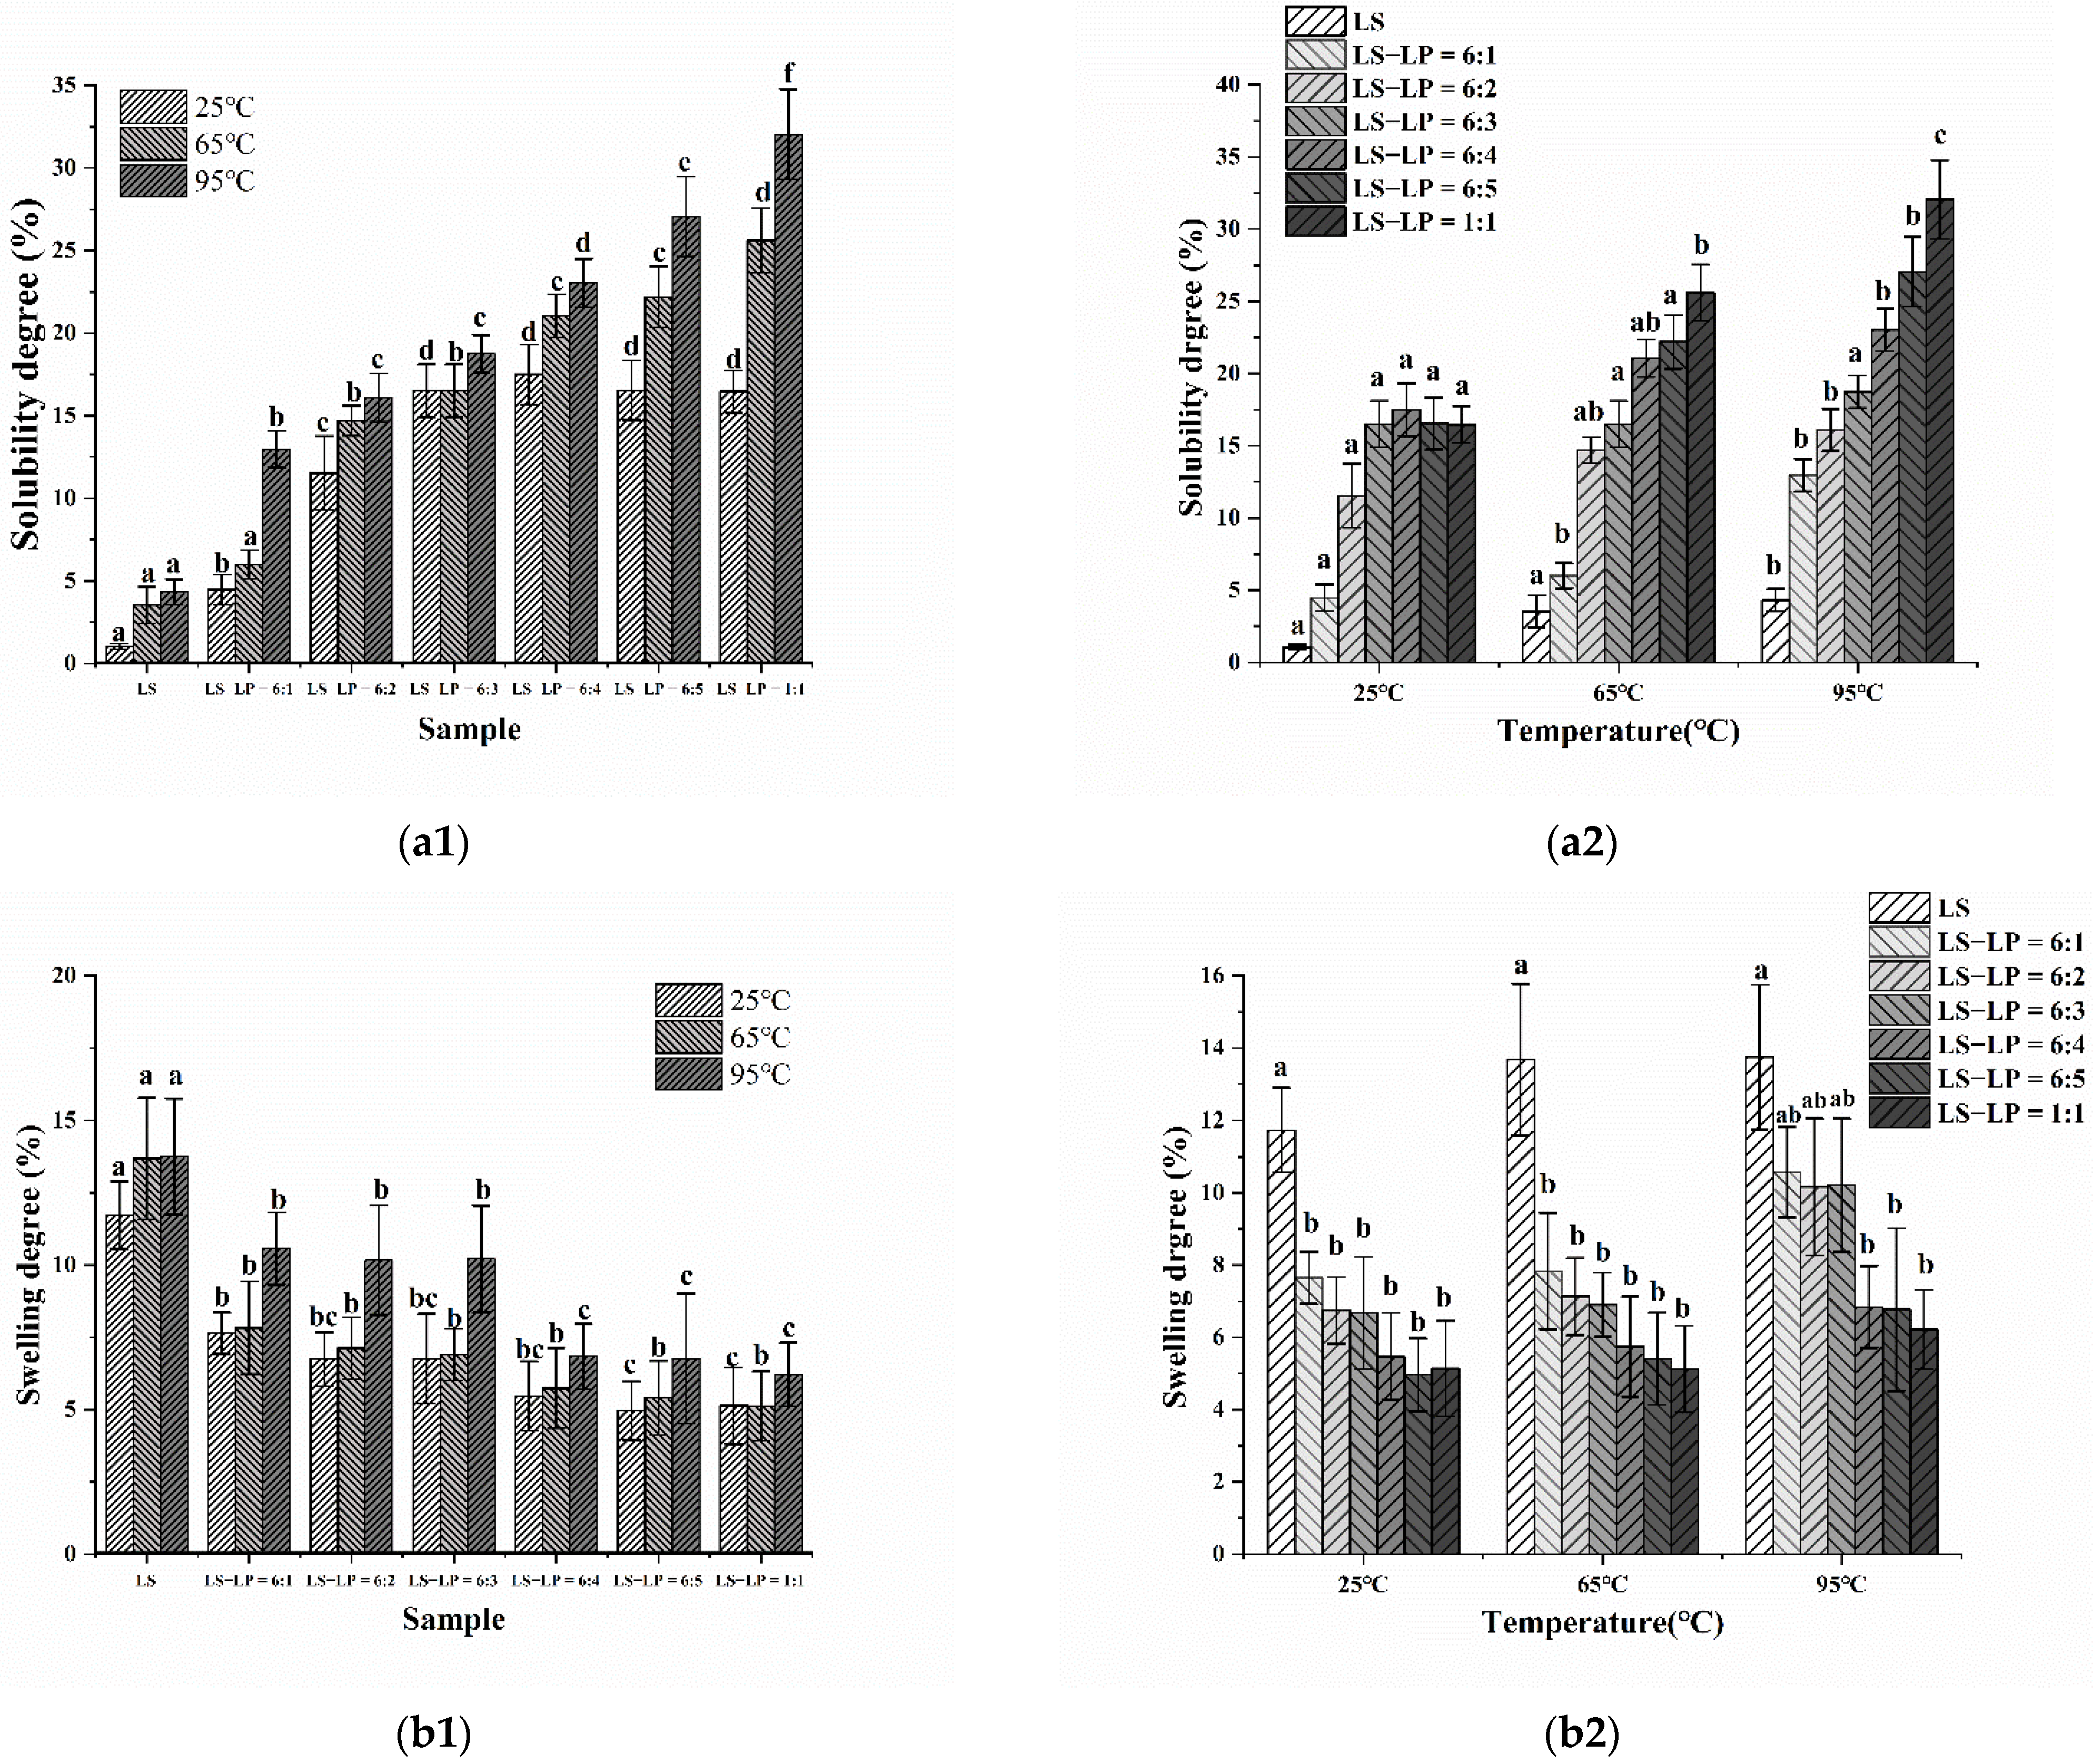
3.7. Solubility and Swelling Degree
4. Conclusions
Author Contributions
Funding
Data Availability Statement
Acknowledgments
Conflicts of Interest
References
- Xu, X.; Liu, W.; Zhong, J.; Luo, L.; Liu, C.; Luo, S.; Chen, L. Binding interaction between rice glutelin and amylose: Hydrophobic interaction and conformational changes. Int. J. Biol. Macromol. 2015, 81, 942–950. [Google Scholar] [CrossRef]
- Wang, J.; Zhao, S.; Min, G.; Qiao, D.; Zhang, B.; Niu, M.; Jia, C.; Xu, Y.; Lin, Q. Starch-protein interplay varies the multi-scale structures of starch undergoing thermal processing. Int. J. Biol. Macromol. 2021, 175, 179–187. [Google Scholar] [CrossRef]
- Goel, P.K.; Singhal, R.S.; Kulkarni, P.R. Studies on interactions of corn starch with casein and casein hydrolysates. Food Chem. 1999, 64, 383–389. [Google Scholar] [CrossRef]
- Jenkins, D.J.; Thorne, M.J.; Wolever, T.M.; Jenkins, A.L.; Rao, A.V.; Thompson, L.U. The effect of starch-protein interaction in wheat on the glycemic response and rate of in vitro digestion. Am. J. Clin. Nutr. 1987, 5, 946–951. [Google Scholar] [CrossRef] [PubMed]
- Lu, Z.; Donner, E.; Yada, R.Y.; Liu, Q. Physicochemical properties and in vitro starch digestibility of potato starch/protein blends. Carbohydr. Polym. 2016, 154, 214–222. [Google Scholar] [CrossRef] [PubMed]
- Ren, F.; Wang, S. Effect of modified tapioca starches on the gelling properties of whey protein isolate. Food Hydrocoll. 2019, 93, 87–91. [Google Scholar] [CrossRef]
- Li, M.; Yue, Q.; Liu, C.; Zheng, X.; Hong, J.; Li, L.; Bian, K. Effect of gliadin/glutenin ratio on pasting, thermal, and structural properties of wheat starch. J. Cereal Sci. 2020, 93, 102973. [Google Scholar] [CrossRef]
- Zhang, Y.; Chen, C.; Chen, Y.; Chen, Y. Effect of rice protein on the water mobility, water migration and microstructure of rice starch during retrogradation. Food Hydrocoll. 2019, 91, 136–142. [Google Scholar] [CrossRef]
- Zhan, Q.; Ye, X.; Zhang, Y.; Kong, X.; Bao, J.; Corke, H.; Sui, Z. Starch granule-associated proteins affect the physicochemical properties of rice starch. Food Hydrocoll. 2020, 101, 105504. [Google Scholar] [CrossRef]
- Chu, L.; Yang, L.; Li, J.; Lin, L.; Zheng, G. Effect of Smilax china L. starch on the gel properties and interactions of calcium sulfate-induced soy protein isolate gel. Int. J. Biol. Macromol. 2019, 135, 127–132. [Google Scholar] [CrossRef]
- Fitzsimons, S.M.; Mulvihill, D.M.; Morris, E.R. Co-gels of whey protein isolate with crosslinked waxy maize starch: Analysis of solvent partition and phase structure by polymer blending laws. Food Hydrocoll. 2008, 22, 468–484. [Google Scholar] [CrossRef]
- Téllez-Morales, J.A.; Herman-Lara, E.; Gómez-Aldapa, C.A.; Rodríguez-Miranda, J. Techno-functional properties of the starch-protein interaction during extrusion-cooking of a model system (corn starch and whey protein isolate). LWT 2020, 132, 109789. [Google Scholar] [CrossRef]
- Ferreira, L.F.; de Oliveira, A.C.S.; Begali, D.D.O.; Neto, A.R.D.S.; Martins, M.A.; de Oliveira, J.E.; Borges, S.V.; Yoshida, M.I.; Tonoli, G.H.D.; Dias, M.V. Characterization of cassava starch/soy protein isolate blends obtained by extrusion and thermocompression. Ind. Crops Prod. 2021, 160, 113092. [Google Scholar] [CrossRef]
- Yang, C.; Zhong, F.; Douglas Goff, H.; Li, Y. Study on starch-protein interactions and their effects on physicochemical and digestible properties of the blends. Food Chem. 2019, 280, 51–58. [Google Scholar] [CrossRef]
- Ren, F.; Dong, D.; Yu, B.; Hou, Z.; Cui, B. Rheology, thermal properties, and microstructure of heat-induced gel of whey pro-tein–acetylated potato starch. Starch–Stärke 2017, 69, 1600344. [Google Scholar] [CrossRef]
- Guo, B.; Hu, X.; Wu, J.; Chen, R.; Dai, T.; Liu, Y.; Luo, S.; Liu, C. Soluble starch/whey protein isolate complex-stabilized high internal phase emulsion: Interaction and stability. Food Hydrocoll. 2021, 111, 106377. [Google Scholar] [CrossRef]
- Małyszek, Z.; Lewandowicz, J.; Le Thanh-Blicharz, J.; Walkowiak, K.; Kowalczewski, P.L.; Baranowska, H.M. Water Behavior of Emulsions Stabilized by Modified Potato Starch. Polymers 2021, 13, 2200. [Google Scholar] [CrossRef]
- Gui, Y.; Zou, F.; Zhu, Y.; Li, J.; Wang, N.; Guo, L.; Cui, B. The structural, thermal, pasting and gel properties of the mixtures of enzyme-treated potato protein and potato starch. LWT 2022, 154, 112882. [Google Scholar] [CrossRef]
- Zheng, M.; Su, H.; You, Q.; Zeng, S.; Zheng, B.; Zhang, Y.; Zeng, H. An insight into the retrogradation behaviors and molecular structures of lotus seed starch-hydrocolloid blends. Food Chem. 2019, 295, 548–555. [Google Scholar] [CrossRef]
- Zhang, Y.; Zeng, H.; Wang, Y.; Zeng, S.; Zheng, B. Structural characteristics and crystalline properties of lotus seed resistant starch and its prebiotic effects. Food Chem. 2014, 155, 311–318. [Google Scholar] [CrossRef]
- Sikora, M.; Krystyjan, M.; Dobosz, A.; Tomasik, P.; Walkowiak, K.; Masewicz, L.; Kowalczewski, P.L.; Baranowska, H.M. Molecular Analysis of Retrogradation of Corn Starches. Polymers 2019, 11, 1764. [Google Scholar] [CrossRef] [PubMed]
- Zeng, H.; Cai, L.; Cai, X.; Wang, Y.; Li, Y. Amino acid profiles and quality from lotus seed proteins. J. Sci. Food Agric. 2013, 93, 1070–1075. [Google Scholar] [CrossRef] [PubMed]
- Zheng, Y.; Li, Z.; Zhang, C.; Zheng, B.; Tian, Y. Effects of microwave-vacuum pre-treatment with different power levels on the structural and emulsifying properties of lotus seed protein isolates. Food Chem. 2020, 311, 125932. [Google Scholar] [CrossRef]
- Guo, Z.; Jia, X.; Lin, X.; Chen, B.; Sun, S.; Zheng, B. Insight into the formation, structure and digestibility of lotus seed amylose-fatty acid complexes prepared by high hydrostatic pressure. Food Chem. Toxicol. 2019, 128, 81–88. [Google Scholar] [CrossRef] [PubMed]
- Zhao, B.; Sun, S.; Lin, H.; Chen, L.; Qin, S.; Wu, W.; Zheng, B.; Guo, Z. Physicochemical properties and digestion of the lotus seed starch-green tea polyphenol complex under ultrasound-microwave synergistic interaction. Ultrason. Sonochem. 2019, 52, 50–61. [Google Scholar] [CrossRef]
- Guo, Z.; Zeng, S.; Zhang, Y.; Lu, X.; Tian, Y.; Zheng, B. The effects of ultra-high pressure on the structural, rheological and retrogradation properties of lotus seed starch. Food Hydrocoll. 2015, 44, 285–291. [Google Scholar] [CrossRef]
- Su, Y.; Chen, Y.; Zhang, L.; Adhikari, B.; Xu, B.; Li, J.; Zheng, T. Synthesis and characterization of lotus seed protein-based curcumin microcapsules with enhanced solubility, stability, and sustained release. J. Sci. Food Agric. 2022, 102, 2220–2231. [Google Scholar] [CrossRef]
- Ruan, H.; Chen, Q.; Fu, M.; Xu, Q.; He, G. Preparation and properties of octenyl succinic anhydride modified potato starch. Food Chem. 2009, 114, 81–86. [Google Scholar] [CrossRef]
- Zhong, D.; Jiao, Y.; Zhang, Y.; Zhang, W.; Li, N.; Zuo, Q.; Wang, Q.; Xue, W.; Liu, Z. Effects of the gene carrier polyethyleneimines on structure and function of blood components. Biomaterials 2013, 34, 294–305. [Google Scholar] [CrossRef]
- Chen, X.; He, X.; Zhang, B.; Fu, X.; Jane, J.L.; Huang, Q. Effects of adding corn oil and soy protein to corn starch on the physicochemical and digestive properties of the starch. Int. J. Biol. Macromol. 2017, 104, 481–486. [Google Scholar] [CrossRef]
- Osoś, A.; Jankowska, P.; Drożdżyńska, A.; Różańska, M.B.; Biegańska-Marecik, R.; Baranowska, H.M.; Ruszkowska, M.; Kačániová, M.; Tomkowiak, A.; Kieliszek, M.; et al. Pasta with Kiwiberry (Actinidia arguta): Effect on Structure, Quality, Consumer Acceptance, and Changes in Bioactivity during Thermal Treatment. Foods 2022, 11, 2456. [Google Scholar] [CrossRef] [PubMed]
- Chen, B.; Zeng, S.; Zeng, H.; Guo, Z.; Zhang, Y.; Zheng, B. Properties of lotus seed starch–glycerin monostearin complexes formed by high pressure homogenization. Food Chem. 2017, 226, 119–127. [Google Scholar] [CrossRef] [PubMed]
- Xiao, J.; Nian, S.; Huang, Q. Assembly of kafirin/carboxymethyl chitosan nanoparticles to enhance the cellular uptake of curcumin. Food Hydrocoll. 2015, 51, 166–175. [Google Scholar] [CrossRef]
- Liang, M.; Liu, R.; Qi, W.; Su, R.; Yu, Y.; Wang, L.; He, Z. Interaction between lysozyme and procyanidin: Multilevel structural nature and effect of carbohydrates. Food Chem. 2013, 138, 1596–1603. [Google Scholar] [CrossRef] [PubMed]
- Pang, Z.; Bourouis, I.; Sun, M.; Cao, J.; Liu, P.; Sun, R.; Chen, C.; Li, H.; Liu, X. Physicochemical properties and microstructural behaviors of rice starch/soy proteins mixtures at different proportions. Int. J. Biol. Macromol. 2022, 209, 2061–2069. [Google Scholar] [CrossRef]
- Ribotta, P.D.; Colombo, A.; León, A.E.; Añón, M.C. Effects of soy protein on physical and rheological properties of wheat starch. Starch–Stärke 2007, 59, 614–623. [Google Scholar] [CrossRef]
- Huntrakul, K.; Yoksan, R.; Sane, A.; Harnkarnsujarit, N. Effects of pea protein on properties of cassava starch edible films produced by blown-film extrusion for oil packaging. Food Packag. Shelf Life 2020, 24, 100480. [Google Scholar] [CrossRef]
- Liu, D.; Wu, Q.; Chen, H.; Chang, P.R. Transitional properties of starch colloid with particle size reduction from micro- to nanometer. J. Colloid Interface Sci. 2009, 339, 117–124. [Google Scholar] [CrossRef]
- Escamilla-García, M.; Calderón-Domínguez, G.; Chanona-Pérez, J.J.; Farrera-Rebollo, R.R.; Andraca-Adame, J.A.; Arzate-Vázquez, I.; Mendez-Mendez, J.V.; Moreno-Ruiz, L.A. Physical and structural characterisation of zein and chitosan edible films using nanotechnology tools. Int. J. Biol. Macromol. 2013, 61, 196–203. [Google Scholar] [CrossRef]
- Lopez, O.; Garcia, M.A.; Villar, M.A.; Gentili, A.; Rodriguez, M.S.; Albertengo, L. Thermo-compression of biodegradable thermoplastic corn starch films containing chitin and chitosan. LWT—Food Sci. Technol. 2014, 57, 106–115. [Google Scholar] [CrossRef]
- Xiao, H.; Lin, Q.; Liu, G.; Wu, Y.; Tian, W.; Wu, W.; Fu, X. Effect of green tea polyphenols on the gelatinization and retrogradation of rice starches with different amylose contents. J. Med. Plants Res. 2011, 5, 4298–4303. [Google Scholar] [CrossRef]
- Liu, H.; Wang, L.; Cao, R.; Fan, H.; Wang, M. In vitro digestibility and changes in physicochemical and structural properties of common buckwheat starch affected by high hydrostatic pressure. Carbohydr. Polym. 2016, 144, 1–8. [Google Scholar] [CrossRef]
- Villanueva, M.; De Lamo, B.; Harasym, J.; Ronda, F. Microwave radiation and protein addition modulate hydration, pasting and gel rheological characteristics of rice and potato starches. Carbohydr. Polym. 2018, 201, 374–381. [Google Scholar] [CrossRef]
- Karim, A.A.; Norziah, M.H.; Seow, C.C. Methods for the study of starch retrogradation. Food Chem. 2000, 71, 9–36. [Google Scholar] [CrossRef]
- Singh, N.; Kaur, L. Morphological, thermal, rheological and retrogradation properties of potato starch fractions varying in granule size. J. Sci. Food Agric. 2004, 84, 1241–1252. [Google Scholar] [CrossRef]
- Lyon, B.G.; Champagne, E.T.; Vinyard, B.T.; Windham, W.R. Sensory and Instrumental Relationships of Texture of Cooked Rice from Selected Cultivars and Postharvest Handling Practices. Cereal Chem. 2000, 77, 64–69. [Google Scholar] [CrossRef]
- Zhao, B.; Wang, B.; Zheng, B.; Chen, L.; Guo, Z. Effects and mechanism of high-pressure homogenization on the characterization and digestion behavior of lotus seed starch-green tea polyphenol complexes. J. Funct. Foods 2019, 57, 173–181. [Google Scholar] [CrossRef]


| Samples | Peak Viscosity | Hold-Through | Breakdown | Final Viscosity | Setback |
|---|---|---|---|---|---|
| LS | 3146 | 2902 | 244 | 5053 | 2151 |
| LS:LP = 6:1 | 2010 | 1666 | 344 | 2663 | 997 |
| LS:LP = 6:2 | 1467 | 1126 | 341 | 1374 | 248 |
| LS:LP = 6:3 | 342 | 339 | 3 | 506 | 167 |
| LS:LP = 6:4 | 203 | 197 | 6 | 325 | 128 |
| LS:LP = 6:5 | 96 | 92 | 4 | 160 | 68 |
| LS:LP = 1:1 | 75 | 72 | 3 | 128 | 56 |
| Samples | To(°C) | Tp(°C) | Tc(°C) | ΔH(J/g) |
|---|---|---|---|---|
| LS:LP = 6:1 | 50.8 | 68.2 | 58.9 | 2.582 |
| LS:LP = 6:2 | 51 | 68.0 | 59 | 2.525 |
| LS:LP = 6:3 | 51.1 | 65.7 | 59.2 | 1.946 |
| LS:LP = 6:4 | 51.2 | 65.8 | 59.3 | 1.847 |
| LS:LP = 6:5 | 51.4 | 65.9 | 59.4 | 0.9878 |
| LS:LP = 1:1 | 51.7 | 65.9 | 59.6 | 0.8843 |
Publisher’s Note: MDPI stays neutral with regard to jurisdictional claims in published maps and institutional affiliations. |
© 2022 by the authors. Licensee MDPI, Basel, Switzerland. This article is an open access article distributed under the terms and conditions of the Creative Commons Attribution (CC BY) license (https://creativecommons.org/licenses/by/4.0/).
Share and Cite
Liu, S.; Chen, W.; Zhang, C.; Wu, T.; Zheng, B.; Guo, Z. Structural, Thermal and Pasting Properties of Heat-Treated Lotus Seed Starch–Protein Mixtures. Foods 2022, 11, 2933. https://doi.org/10.3390/foods11192933
Liu S, Chen W, Zhang C, Wu T, Zheng B, Guo Z. Structural, Thermal and Pasting Properties of Heat-Treated Lotus Seed Starch–Protein Mixtures. Foods. 2022; 11(19):2933. https://doi.org/10.3390/foods11192933
Chicago/Turabian StyleLiu, Sidi, Wenyu Chen, Changyu Zhang, Tong Wu, Baodong Zheng, and Zebin Guo. 2022. "Structural, Thermal and Pasting Properties of Heat-Treated Lotus Seed Starch–Protein Mixtures" Foods 11, no. 19: 2933. https://doi.org/10.3390/foods11192933