
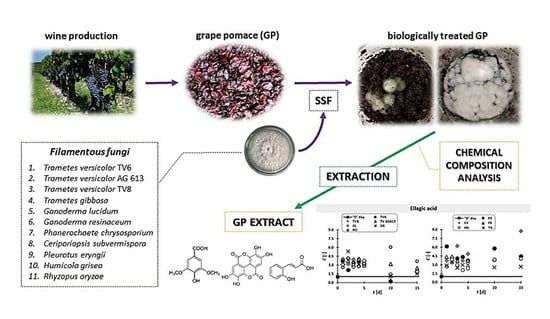
A Comparative Study of the Influence of Various Fungal-Based Pretreatments of Grape Pomace on Phenolic Compounds Recovery

 , , and
Abstract
:
1. Introduction
2. Materials and Methods
2.1. Standards and Reagents
2.2. GP Sample and Microorganisms
2.3. Biological Pretreatment of GP by Eleven Filamentous Fungi
2.4. Preparation of GP Extracts
2.5. Chemical Composition of GP
2.5.1. Dry Matter Content
2.5.2. Ash Content
2.5.3. Crude Proteins
2.5.4. Free Fats Content
2.5.5. Total Organic Carbon (TOC) and Total Nitrogen (TN)
2.5.6. Neutral Detergent Fibers (NDF), Acid Detergent Fibers (ADF) and Acid Detergent Lignin (ADL)
2.5.7. Content of Individual Sugars
2.5.8. Content of Total Phenolic Compounds
2.5.9. Content of Total Flavanoids
2.5.10. Content of Total Extractable Proanthocyanidins (TPA)
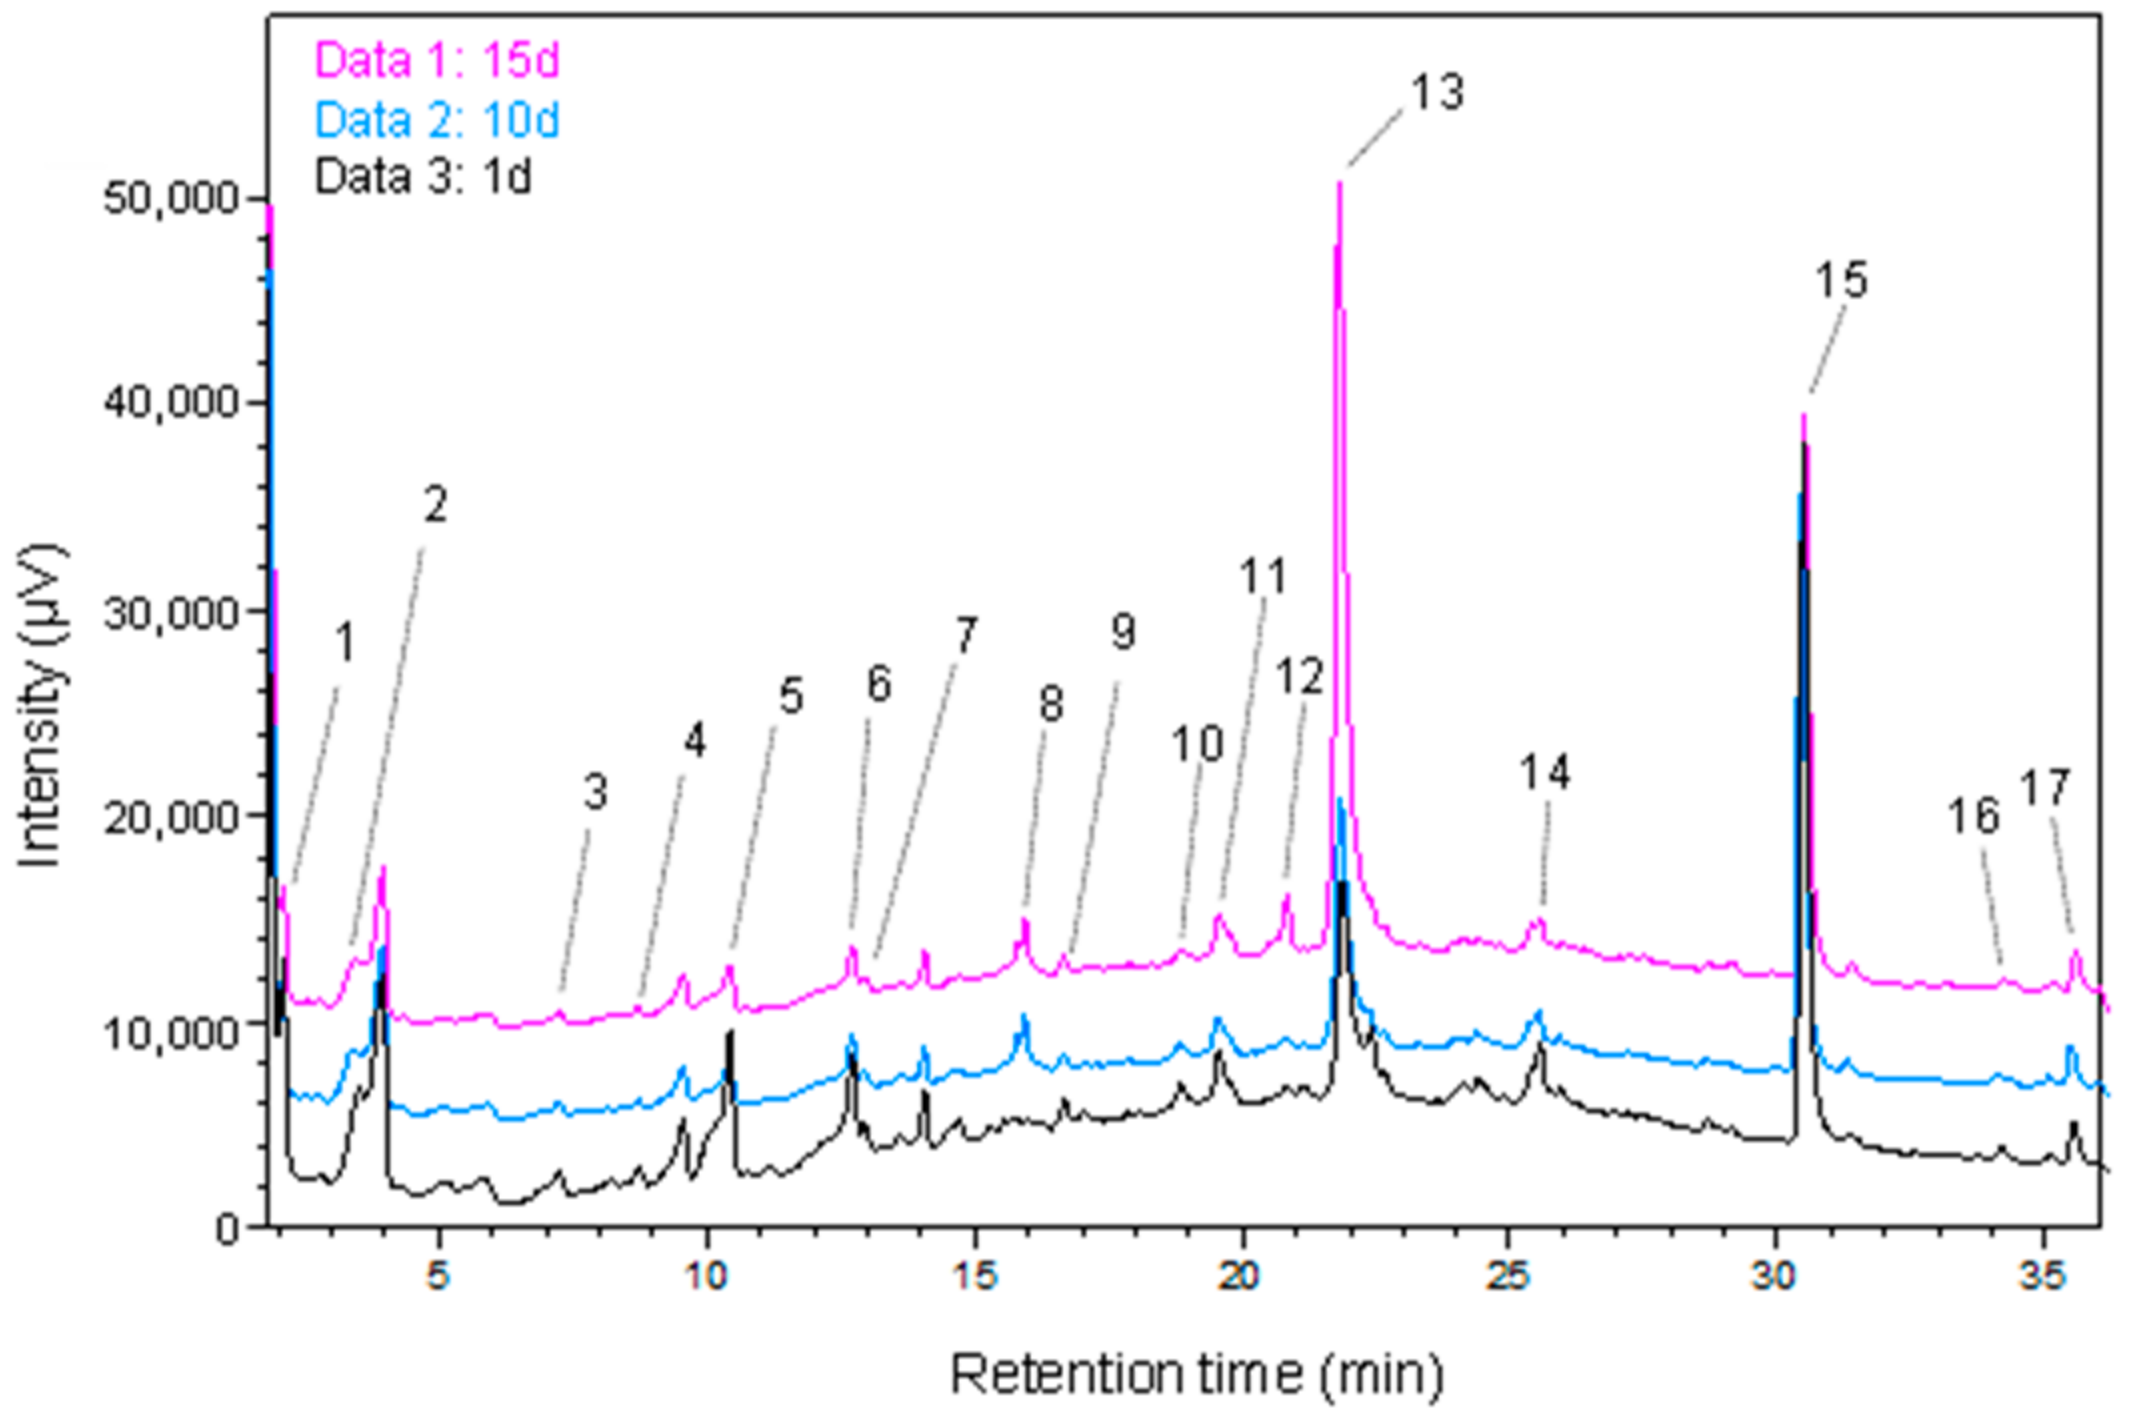
2.6. Phenolic Content Analysis by UHPLC
2.7. Statistical Analyses
3. Results and Discussion
3.1. Chemical Composition of the GP
3.2. Weight Loss
3.3. Phenolic Compound Profiles of GP before and after SSF
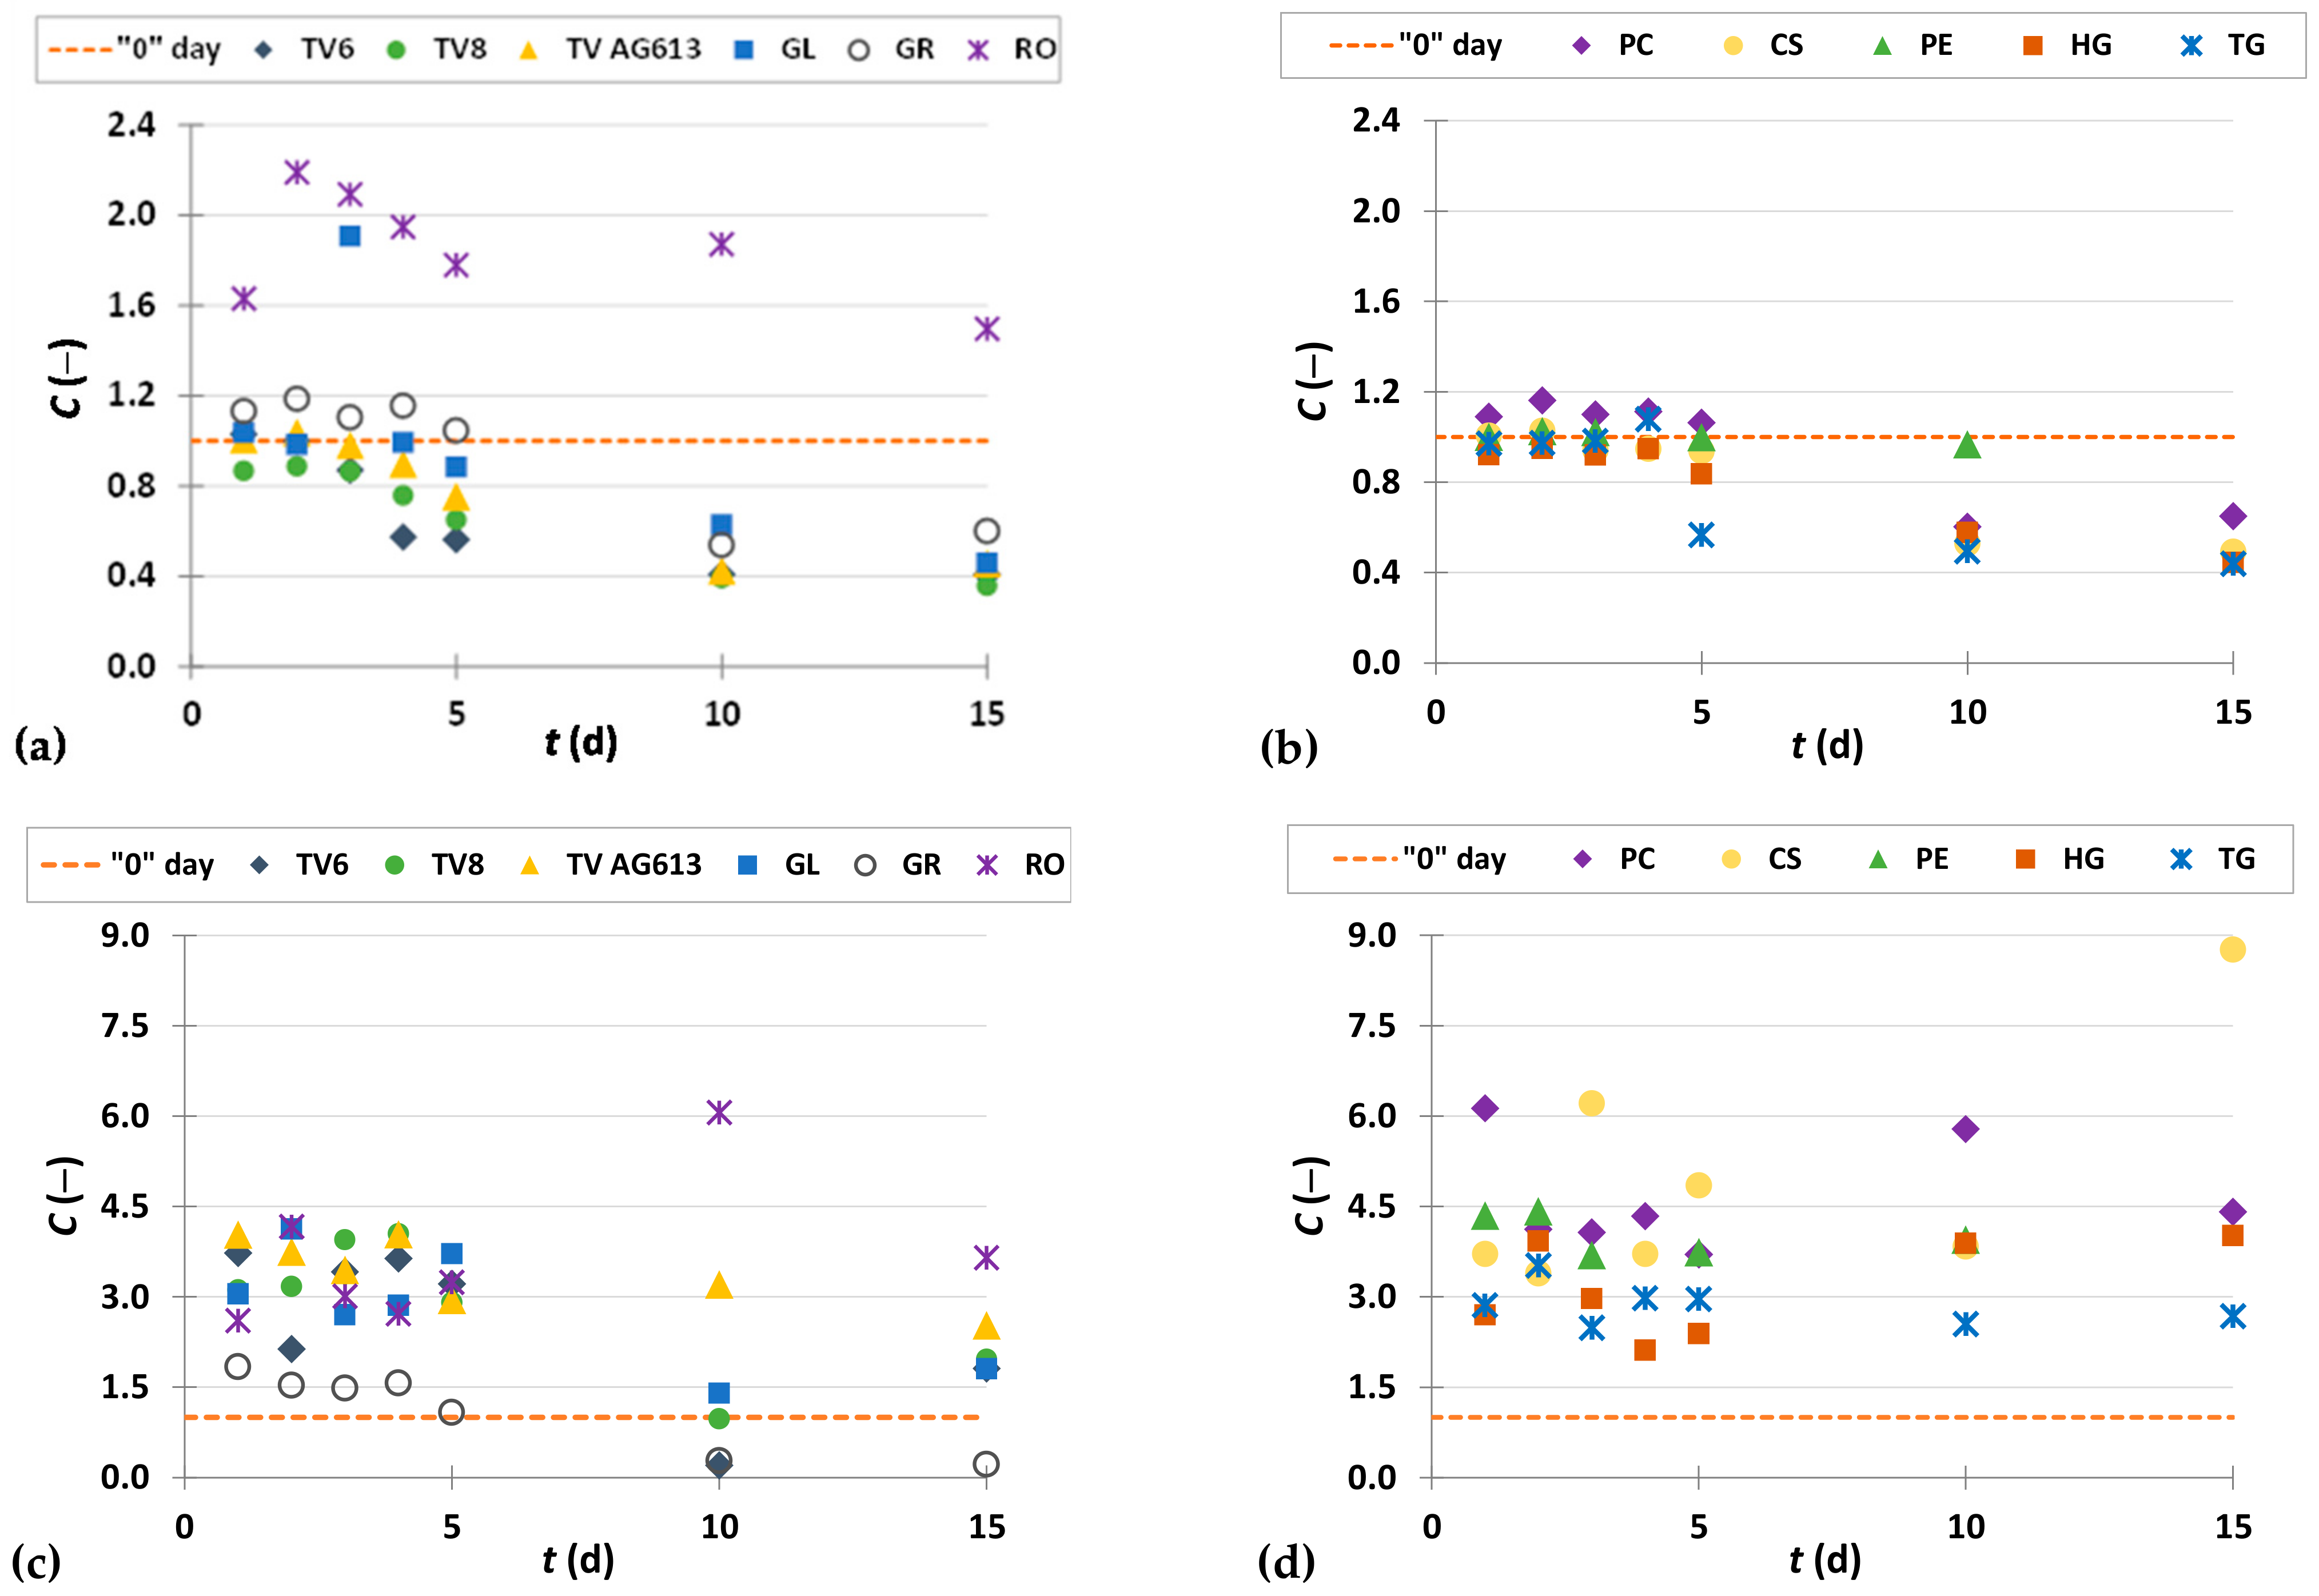
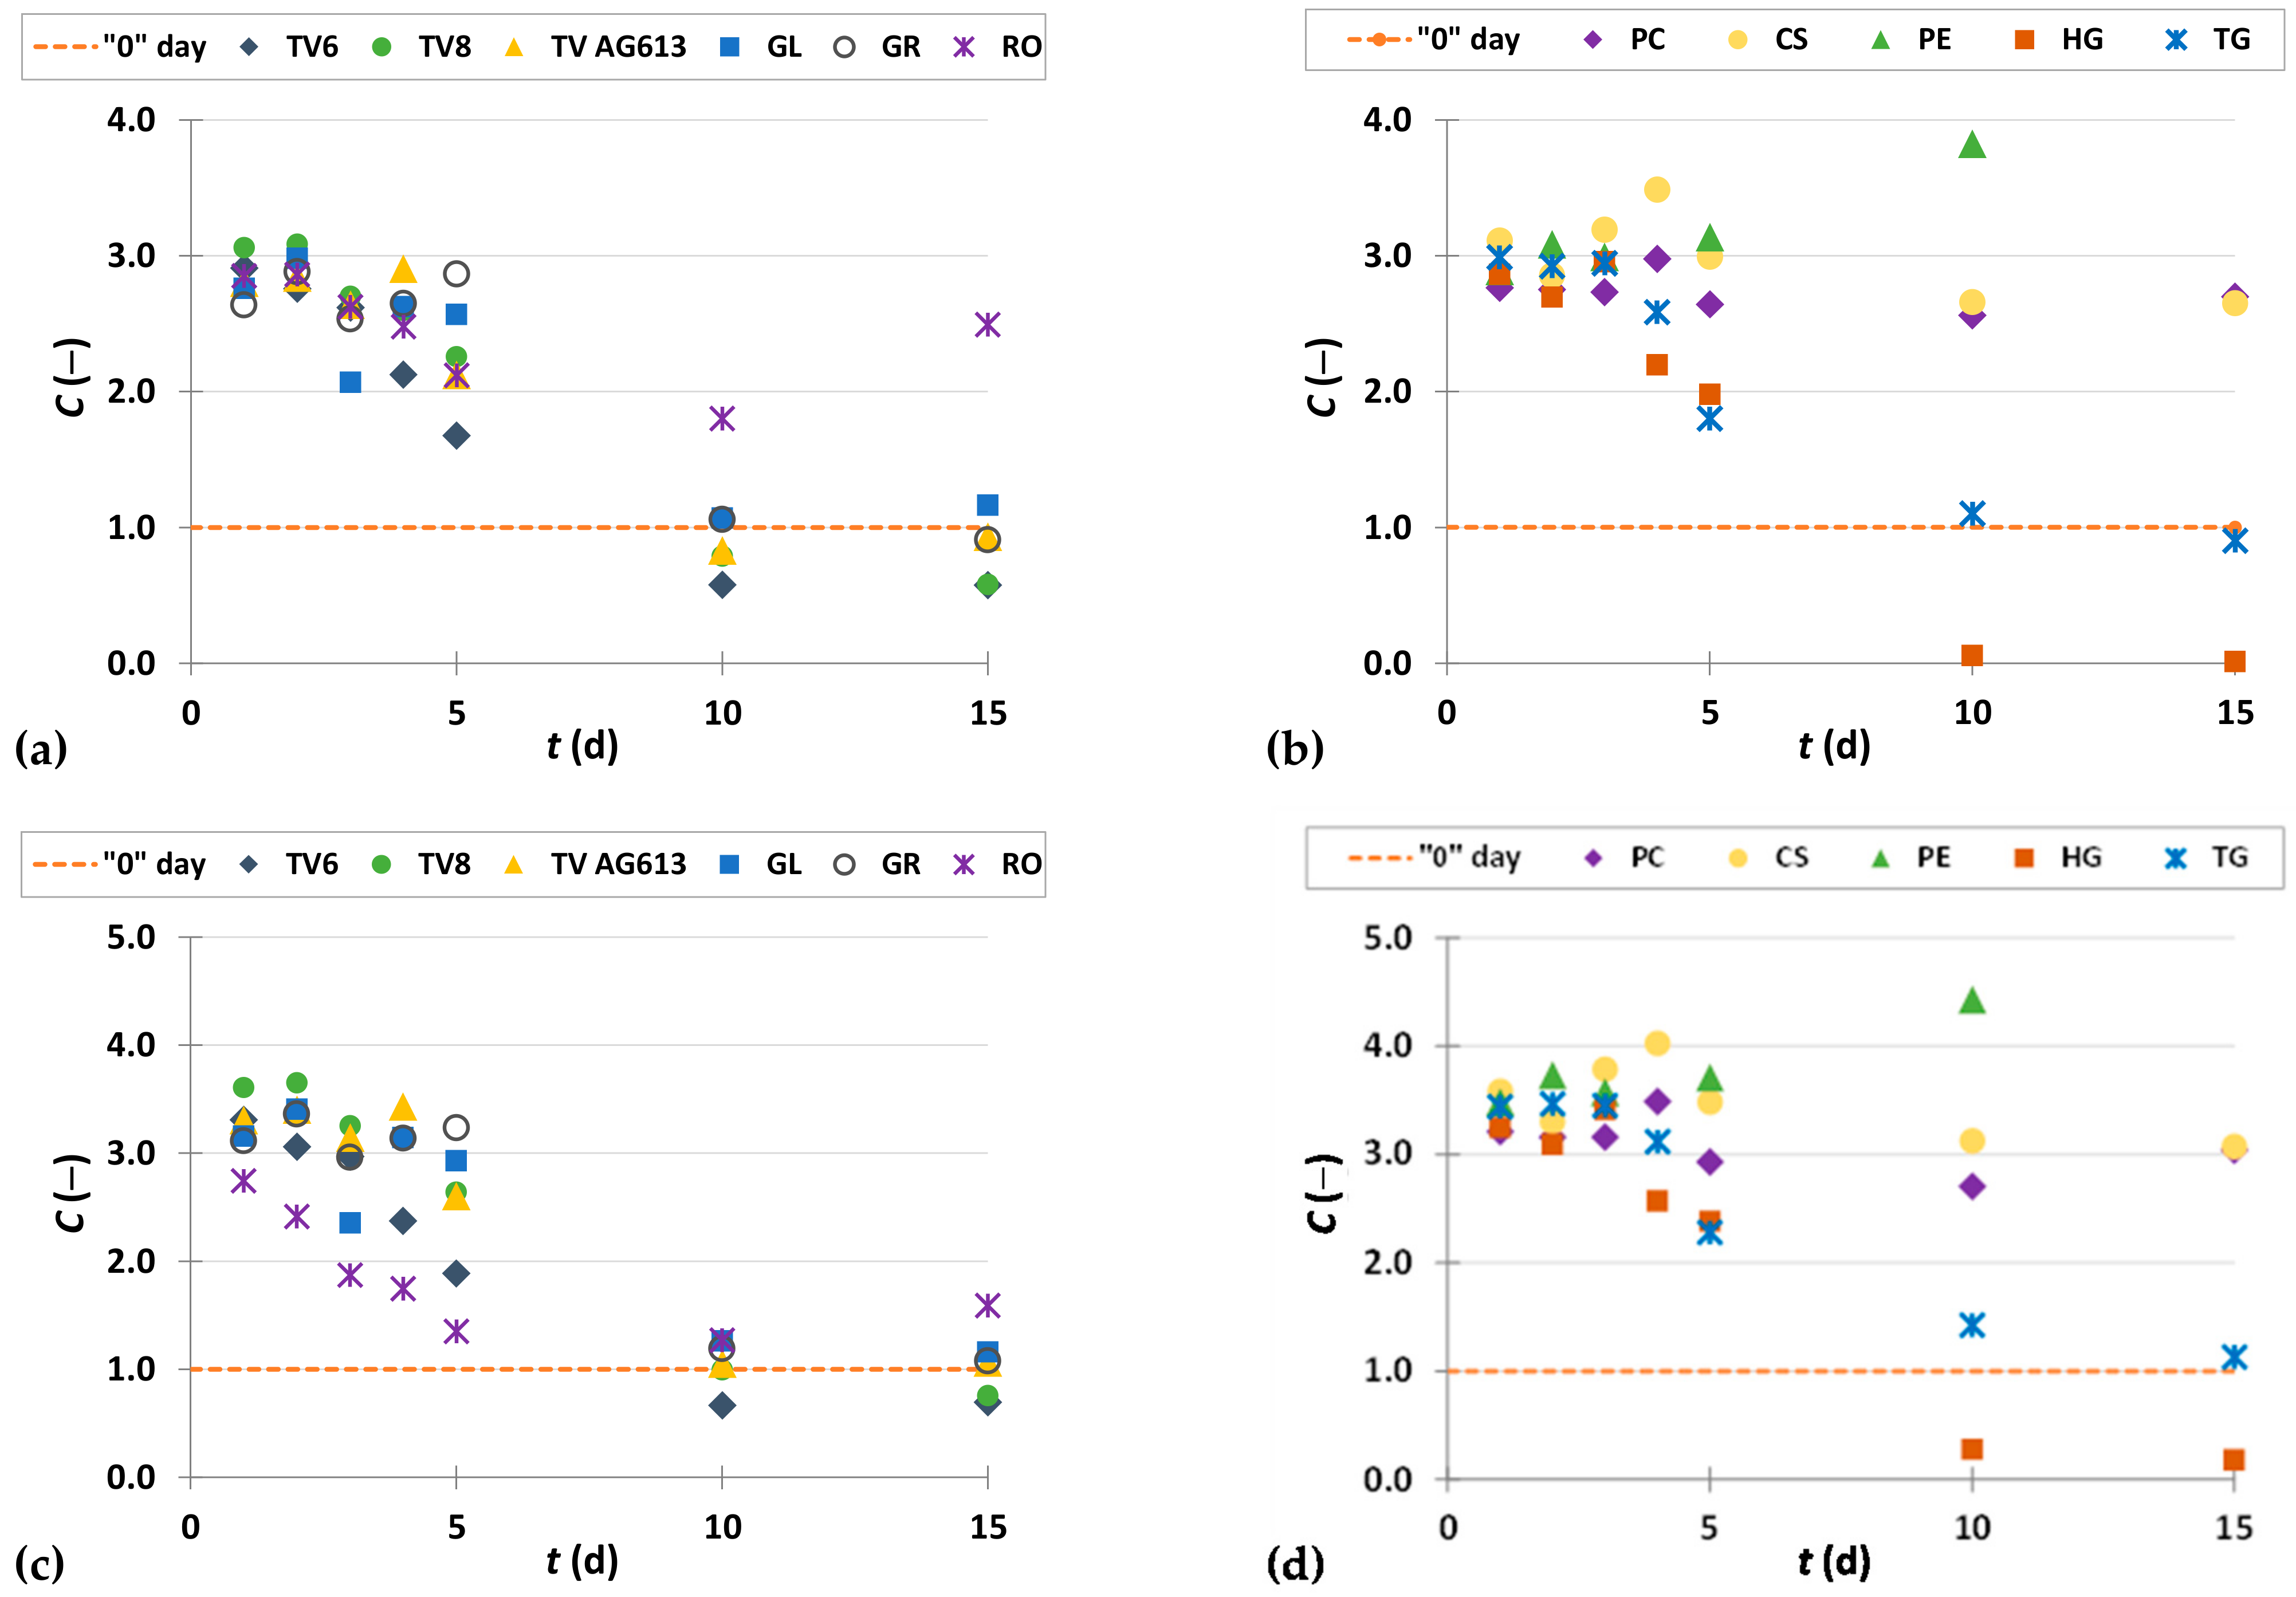
3.3.1. Phenolic Acids
3.3.2. Flavan-3-ols
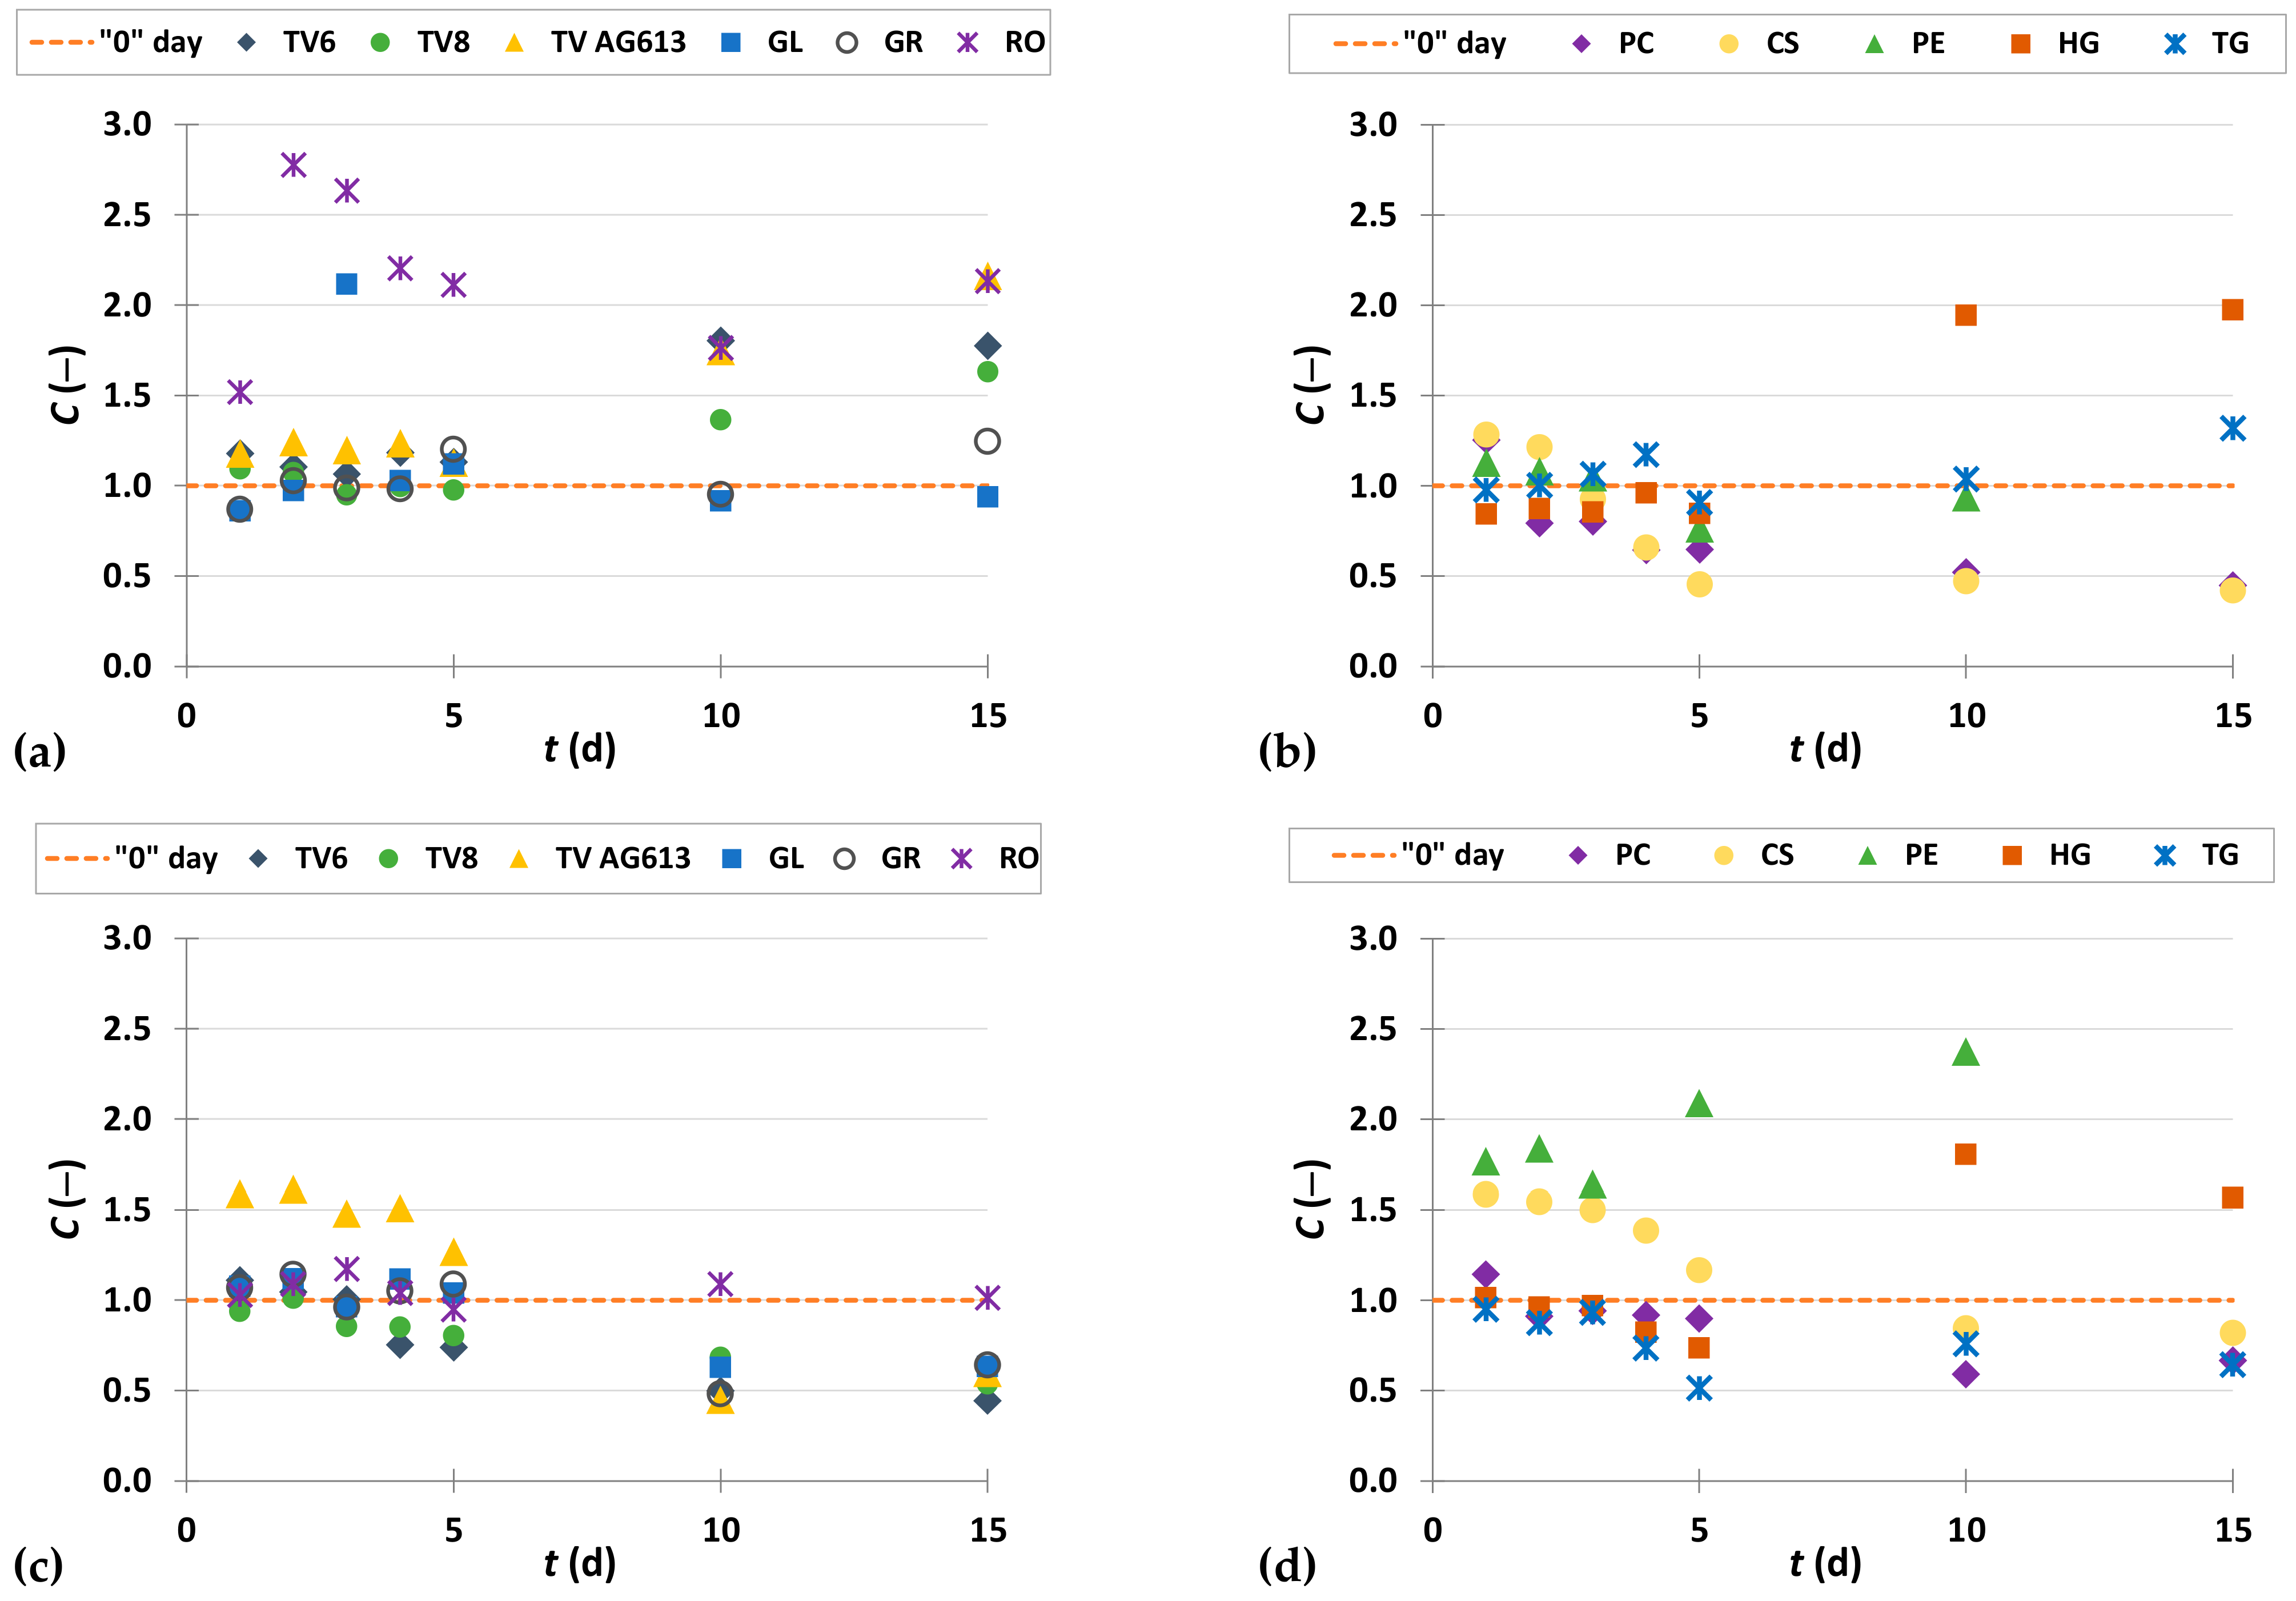
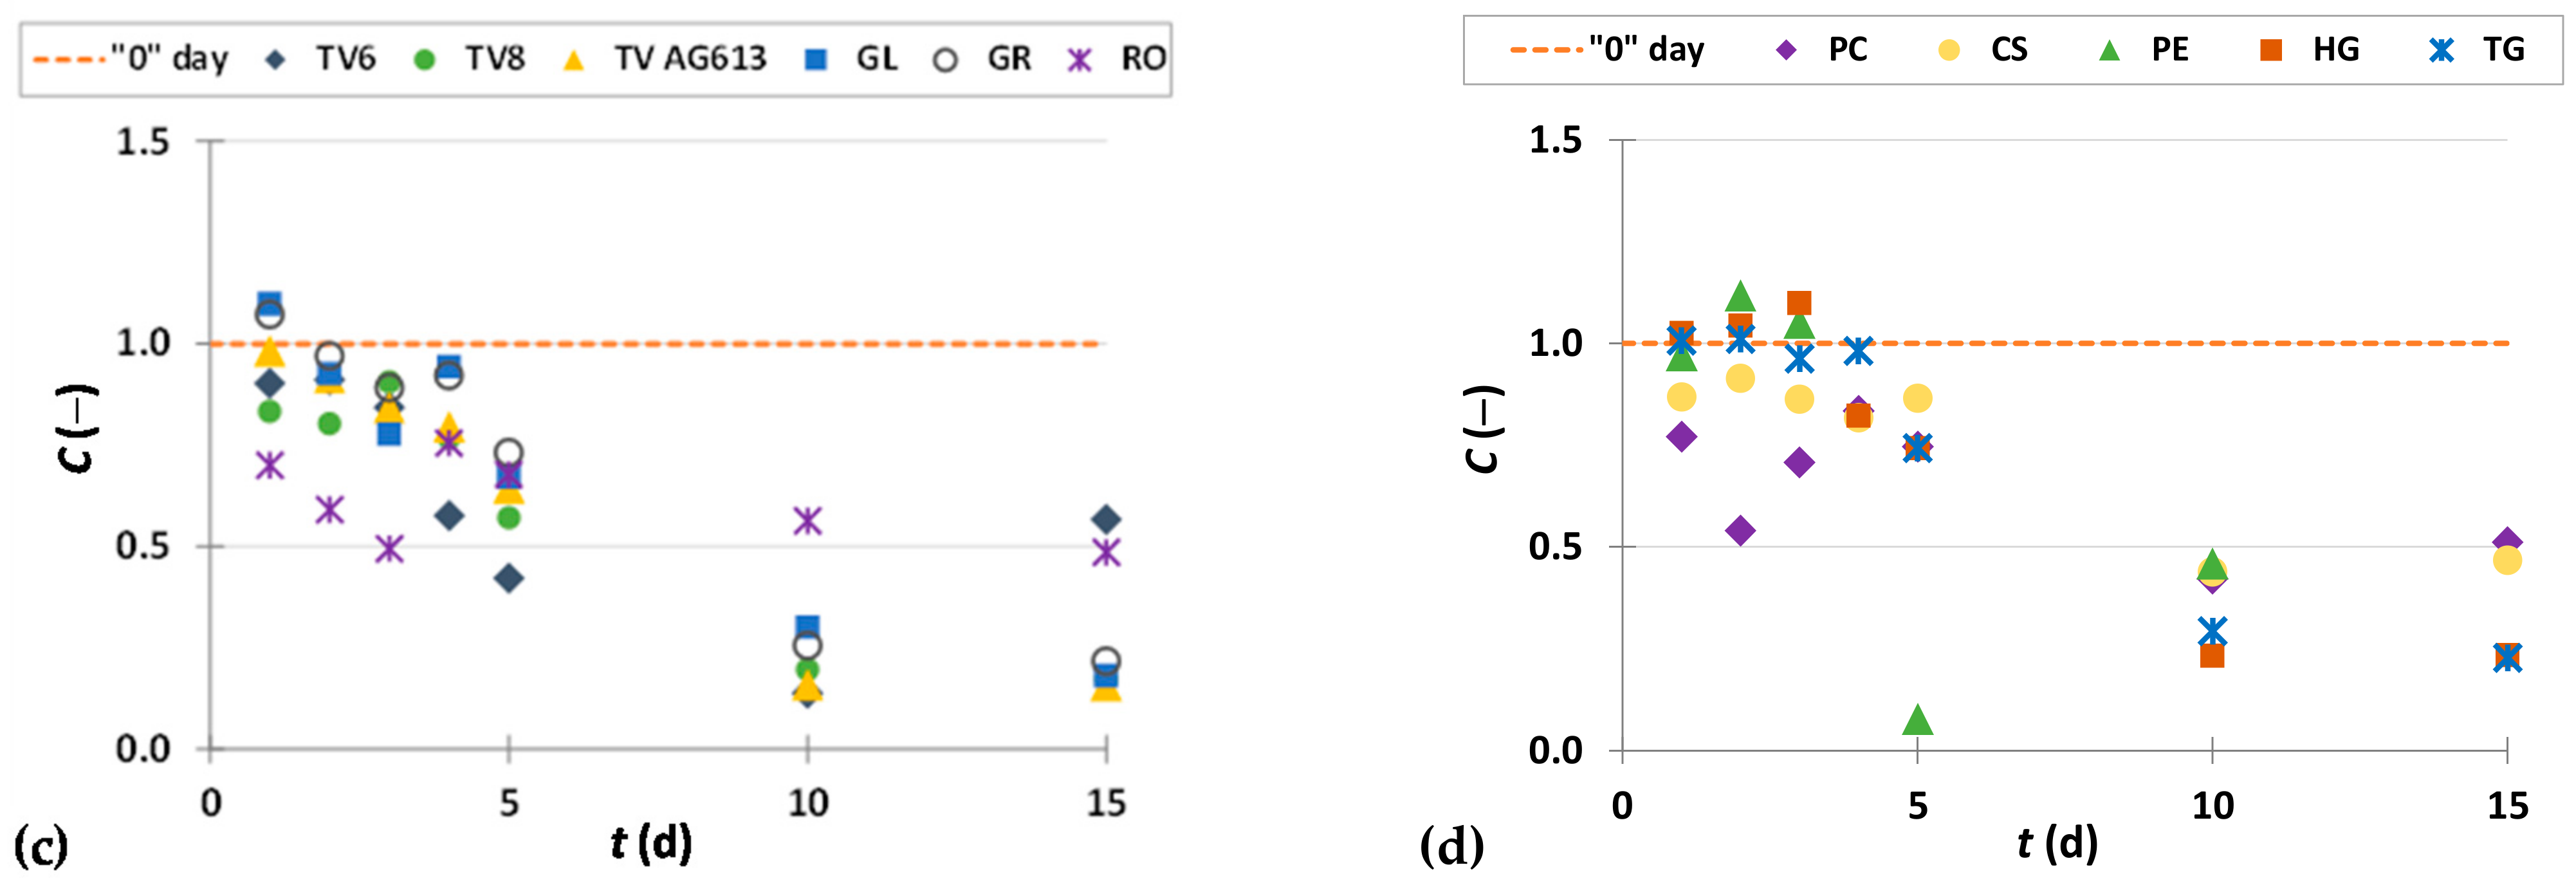
3.3.3. Flavonols
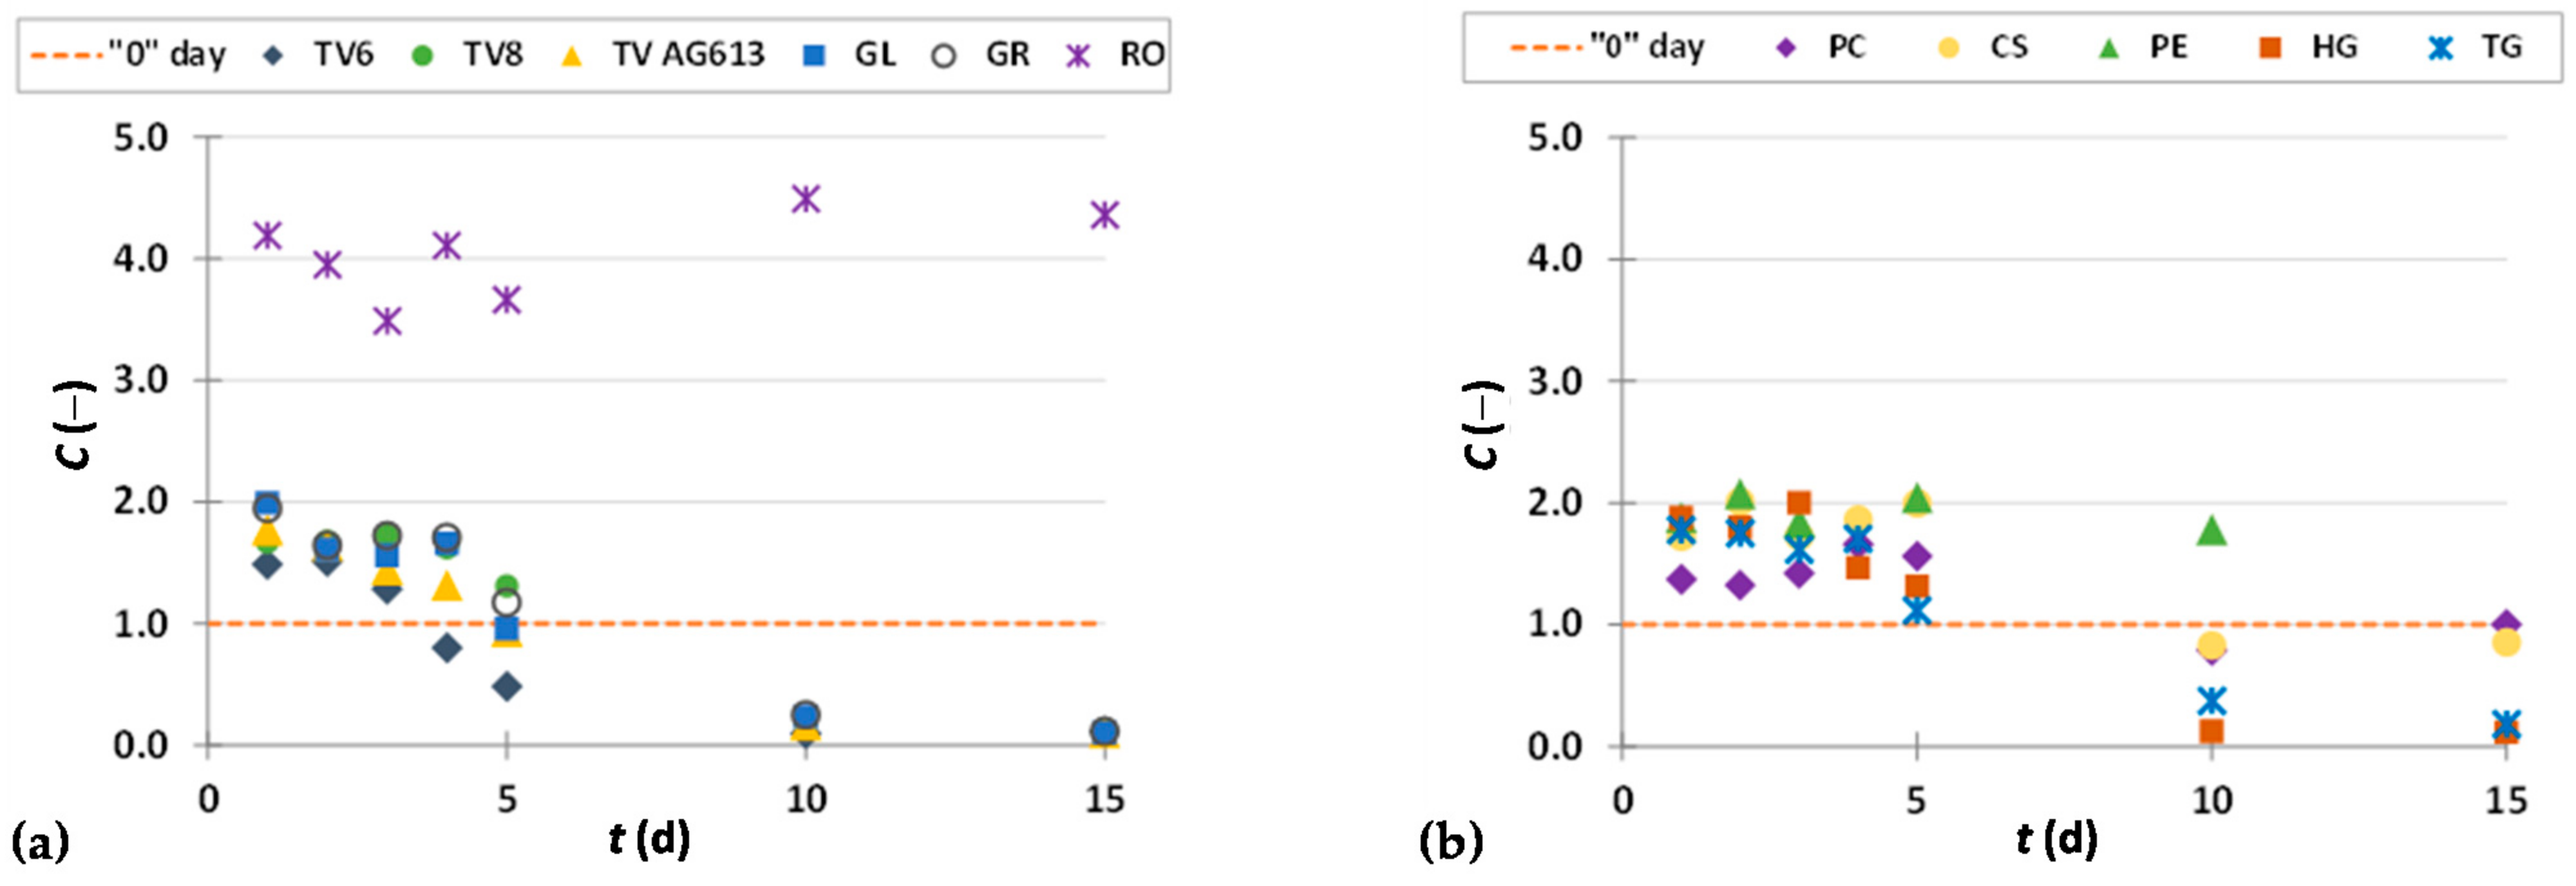
3.3.4. Procyanidins
3.3.5. Stilbenes
4. Conclusions
Author Contributions
Funding
Informed Consent Statement
Data Availability Statement
Acknowledgments
Conflicts of Interest
References
- Kalli, E.; Lappa, I.; Bouchagier, P.; Tarantilis, P.A.; Skotti, E. Novel application and industrial exploitation of winery by-products. Bioresour. Bioprocess. 2018, 5, 46–67. [Google Scholar] [CrossRef]
- Moro, K.I.B.; Bender, A.B.B.; da Silva, L.P.; Penna, N.G. Green extraction methods and microencapsulation technologies of phenolic compounds from grape pomace: A review. Food Bioprocess. Technol. 2021, 14, 1407–1431. [Google Scholar] [CrossRef]
- Bucić-Kojić, A.; Tišma, M.; Šelo, G.; Grgić, J.; Perković, G.; Planinić, M. Winery Production residues as feedstocks within the biorefinery concept. Eng. Power 2022, 17, 11–17. [Google Scholar]
- Khiari, B.; Jeguirim, M. Pyrolysis of grape marc from Tunisian wine industry: Feedstock characterization, thermal degradation and kinetic analysis. Energies 2018, 11, 730. [Google Scholar] [CrossRef] [Green Version]
- Barbanera, M.; Cardarelli, A.; Carota, E.; Castellini, M.; Giannoni, T.; Ubertini, S. Valorization of winery and distillery by-products by hydrothermal carbonization. Sci. Rep. 2021, 11, 23973–23988. [Google Scholar] [CrossRef]
- Brezoiu, A.-M.; Bajenaru, L.; Berger, D.; Mitran, R.-A.; Deaconu, M.; Lincu, D.; Stoica Guzun, A.; Matei, C.; Moisescu, M.G.; Negreanu-Pirjol, T. Effect of nanoconfinement of polyphenolic extract from grape pomace into functionalized mesoporous silica on its biocompatibility and radical scavenging activity. Antioxidants 2020, 9, 696. [Google Scholar] [CrossRef] [PubMed]
- Chowdhary, P.; Gupta, A.; Gnansounou, E.; Pandey, A.; Chaturvedi, P. Current trends and possibilities for exploitation of grape pomace as a potential source for value addition. Environ. Pollut. 2021, 278, 116796–116811. [Google Scholar] [CrossRef] [PubMed]
- Muñoz, P.; Morales, M.P.; Mendívil, M.A.; Juárez, M.C.; Muñoz, L. Using of waste pomace from winery industry to improve thermal insulation of fired clay bricks. Eco-friendly way of building construction. Constr. Build. Mater. 2014, 71, 181–187. [Google Scholar] [CrossRef]
- Dwyer, K.; Hosseinian, F.; Rod, M. The market potential of grape waste alternatives. J. Food Res. 2014, 3, 91–106. [Google Scholar] [CrossRef]
- Morazzoni, P.; Vanzani, P.; Santinello, S.; Gucciardi, A.; Zennaro, L.; Miotto, G.; Ursini, F. Grape seeds proanthocyanidins: Advanced technological preparation and analytical characterization. Antioxidants 2021, 10, 418. [Google Scholar] [CrossRef] [PubMed]
- Grgić, J.; Šelo, G.; Planinić, M.; Tišma, M.; Bucić-Kojić, A. Role of the encapsulation in bioavailability of phenolic compounds. Antioxidants 2020, 9, 923. [Google Scholar] [CrossRef]
- Teles, A.S.C.; Chávez, D.W.H.; Oliveira, R.A.; Bon, E.P.S.; Terzi, S.C.; Souza, E.F.; Gottschalk, L.M.F.; Tonon, R.V. Use of grape pomace for the production of hydrolytic enzymes by solid-state fermentation and recovery of its bioactive compounds. Food Res. Int. 2019, 120, 441–448. [Google Scholar] [CrossRef]
- Leite, P.; Silva, C.; Salgado, J.M.; Belo, I. Simultaneous production of lignocellulolytic enzymes and extraction of antioxidant compounds by solid-state fermentation of agro-industrial wastes. Ind. Crops Prod. 2019, 137, 315–322. [Google Scholar] [CrossRef] [Green Version]
- Zoghlami, A.; Paës, G. Lignocellulosic biomass: Understanding recalcitrance and predicting hydrolysis. Front. Chem. 2019, 7, 874–884. [Google Scholar] [CrossRef] [PubMed] [Green Version]
- Manara, P.; Zabaniotou, A.; Vanderghem, C.; Richel, A. Lignin extraction from mediterranean agro-wastes: Impact of pretreatment conditions on lignin chemical structure and thermal degradation behavior. Catal. Today 2014, 223, 25–34. [Google Scholar] [CrossRef]
- Zheng, Y.; Lee, C.; Yu, C.; Cheng, Y.-S.; Simmons, C.W.; Zhang, R.; Jenkins, B.M.; VanderGheynst, J.S. Ensilage and bioconversion of grape pomace into fuel ethanol. J. Agric. Food Chem. 2012, 60, 11128–11134. [Google Scholar] [CrossRef]
- Tišma, M.; Bucić-Kojić, A.; Planinić, M. Bio-based products from lignocellulosic waste biomass: A state of the art. Chem. Biochem. Eng. Q. 2021, 35, 139–156. [Google Scholar] [CrossRef]
- Šelo, G.; Planinić, M.; Tišma, M.; Tomas, S.; Koceva Komlenić, D.; Bucić-Kojić, A. A comprehensive review on valorization of agro-food industrial residues by solid-state fermentation. Foods 2021, 10, 927. [Google Scholar] [CrossRef] [PubMed]
- Teles, A.S.C.; Chávez, D.W.H.; de Araújo Santiago, M.C.P.; Gottschalk, L.M.F.; Tonon, R.V. Composition of different media for enzyme production and its effect on the recovery of phenolic compounds from grape pomace. Biocatal. Agric. Biotechnol. 2021, 35, 102067–102076. [Google Scholar] [CrossRef]
- AOAC. AOAC Official Method 942.05. In Official Methods of Analysis of AOAC INTERNATIONAL, 16th ed.; AOAC International: Arlington, VA, USA, 1995. [Google Scholar]
- AOAC. AOAC Official Method 2001.11. In Official Methods of Analysis of AOAC INTERNATIONAL, 18th ed.; AOAC International: Gaithersburg, MD, USA, 2005. [Google Scholar]
- AOAC. AOAC Official Method 945.16. In Official Methods of Analysis of AOAC INTERNATIONAL, 18th ed.; AOAC International: Gaithersburg, MD, USA, 2005. [Google Scholar]
- Goering, H.K.; Van Soest, P.J. Forage Fiber Analyses (Apparatus, Reagents, Procedures, and Some Applications); Agricultural Research Service, U.S. Department of Agriculture: Washington, DC, USA, 1970; pp. 1–24. [Google Scholar]
- Planinić, M.; Zelić, B.; Čubel, I.; Bucić-Kojić, A.; Tišma, M. Corn forage biological pretreatment by Trametes Versicolor in a tray bioreactor. Waste Manag. Res. 2016, 34, 802–809. [Google Scholar] [CrossRef]
- Marinova, D.; Ribarova, F.; Atanassova, M. Total phenolics and total flavonoids in Bulgarian fruits and vegetables. J. Univ. Chem. Technol. Metall. 2005, 40, 255–260. [Google Scholar]
- Škerget, M.; Kotnik, P.; Hadolin, M.; Hraš, A.R.; Simonič, M.; Knez, Ž. Phenols, proanthocyanidins, flavones and flavonols in some plant materials and their antioxidant activities. Food Chem. 2005, 89, 191–198. [Google Scholar] [CrossRef]
- Bucić-Kojić, A.; Šelo, G.; Zelić, B.; Planinić, M.; Tišma, M. Recovery of phenolic acid and enzyme production from corn silage biologically treated by Trametes Versicolor. Appl. Biochem. Biotechnol. 2017, 181, 948–960. [Google Scholar] [CrossRef]
- Van Kuijk, S.J.A.; Sonnenberg, A.S.M.; Baars, J.J.P.; Hendriks, W.H.; Cone, J.W. Fungal treatment of lignocellulosic biomass: Importance of fungal species, colonization and time on chemical composition and in vitro rumen degradability. Anim. Feed Sci. Technol. 2015, 209, 40–50. [Google Scholar] [CrossRef]
- Filippi, K.; Georgaka, N.; Alexandri, M.; Papapostolou, H.; Koutinas, A. Valorisation of grape stalks and pomace for the production of bio-based succinic acid by actinobacillus succinogenes. Ind. Crops Prod. 2021, 168, 113578–113587. [Google Scholar] [CrossRef]
- Niu, D.; Zuo, S.; Jiang, D.; Tian, P.; Zheng, M.; Xu, C. Treatment using white rot fungi changed the chemical composition of wheat straw and enhanced digestion by rumen microbiota in vitro. Anim. Feed Sci. Technol. 2018, 237, 46–54. [Google Scholar] [CrossRef]
- Anu; Kumar, A.; Rapoport, A.; Kunze, G.; Kumar, S.; Singh, D.; Singh, B. Multifarious pretreatment strategies for the lignocellulosic substrates for the generation of renewable and sustainable biofuels: A review. Renew. Energy 2020, 160, 1228–1252. [Google Scholar] [CrossRef]
- Zamora Zamora, H.D.; Silva, T.A.L.; Varão, L.H.R.; Baffi, M.A.; Pasquini, D. Simultaneous production of cellulases, hemicellulases, and reducing sugars by Pleurotus ostreatus growth in one-pot solid state fermentation using Alstroemeria sp. waste. Biomass Convers. Biorefin. 2021. [Google Scholar] [CrossRef]
- Thapa, S.; Mishra, J.; Arora, N.; Mishra, P.; Li, H.; O’Hair, J.; Bhatti, S.; Zhou, S. Microbial cellulolytic enzymes: Diversity and biotechnology with reference to lignocellulosic biomass degradation. Rev. Environ. Sci. Biotechnol. 2020, 19, 621–648. [Google Scholar] [CrossRef]
- Sukma, A.; Jos, B.; Sumardiono, S. Kinetic of biomass growth and protein formation on rice bran fermentation using Rhizopus oryzae. MATEC Web Conf. 2018, 156, 01023. [Google Scholar] [CrossRef] [Green Version]
- Altop, A.; Güngör, E.; Erener, G. Aspergillus niger may improve nutritional quality of grape seed and its usability in animal nutrition through solid-state fermentation. Int. Adv. Res. Eng. J. 2018, 2, 273–277. [Google Scholar]
- Ruiz-Herrera, J. Fungal Cell Wall: Structure, Synthesis, and Assembly, 1st ed.; CRC Press: Boca Raton, FL, USA, 1991; pp. 5–18. [Google Scholar]
- Zambrano, C.; Kotogán, A.; Bencsik, O.; Papp, T.; Vágvölgyi, C.; Mondal, K.C.; Krisch, J.; Takó, M. Mobilization of phenolic antioxidants from grape, apple and pitahaya residues via solid state fungal fermentation and carbohydrase treatment. LWT—Food Sci. Technol. 2018, 89, 457–465. [Google Scholar] [CrossRef] [Green Version]
- Meini, M.-R.; Cabezudo, I.; Galetto, C.S.; Romanini, D. Production of grape pomace extracts with enhanced antioxidant and prebiotic activities through solid-state fermentation by Aspergillus niger and Aspergillus oryzae. Food Biosci. 2021, 42, 101168–101178. [Google Scholar] [CrossRef]
- Bastos, R.G.; Ribeiro, H.C. Citric acid production by the solid-state cultivation consortium of and from sugarcane bagasse. Open Biotechnol. J. 2020, 14, 32–41. [Google Scholar] [CrossRef]
- Yu, H.; Xie, B.; Khan, R.; Dong, J.; Shen, G. The changes in macronutrients and microbial community structure during the co-composting of white wine distillers’ grains and potassium silicate. J. Clean. Prod. 2021, 319, 128681–128691. [Google Scholar] [CrossRef]
- Yang, Y.; Wang, L.; Zhang, Y.; Li, L.; Shi, X.; Liu, X.; Ren, X.; Dou, S. Transformation of corn stalk residue to humus-like substances during solid-state fermentation. Sustainability 2019, 11, 6771. [Google Scholar] [CrossRef] [Green Version]
- Larios-Cruz, R.; Buenrostro-Figueroa, J.; Prado-Barragán, A.; Rodríguez-Jasso, R.M.; Rodríguez-Herrera, R.; Montañez, J.C.; Aguilar, C.N. Valorization of grapefruit by-products as solid support for solid-state fermentation to produce antioxidant bioactive extracts. Waste Biomass Valori. 2019, 10, 763–769. [Google Scholar] [CrossRef]
- Sobal, M.; Martinez-Carrera, D.; Rio, B.; Roussos, S. Screening of edible mushrooms for polyphenol degradation and tannase production from coffee pulp and coffee husk. In New Horizons in Biotechnology, 1st ed.; Roussos, S., Soccol, C.R., Pandey, A., Augur, C., Eds.; Springer: Dordrecht, The Netherlands, 2003; pp. 89–95. [Google Scholar]
- AL Zahrani, N.A.; El-Shishtawy, R.M.; Asiri, A.M. Recent developments of gallic acid derivatives and their hybrids in medicinal chemistry: A review. Eur. J. Med. Chem. 2020, 204, 112609–112645. [Google Scholar] [CrossRef]
- Evtyugin, D.D.; Magina, S.; Evtuguin, D.V. Recent advances in the production and applications of ellagic acid and its derivatives: A review. Molecules 2020, 25, 2745. [Google Scholar] [CrossRef]
- Li, G.; Row, K.H. Deep eutectic solvents cross-linked molecularly imprinted chitosan microsphere for the micro-solid phase extraction of p-hydroxybenzoic acid from pear rind. J. Sep. Sci. 2021, 44, 549–556. [Google Scholar] [CrossRef] [PubMed]
- Wang, J.; Jiang, Z. Synthesis, characterisation, antioxidant and antibacterial properties of p-hydroxybenzoic acid-grafted chitosan conjugates. Int. J. Food Sci. 2022, 57, 1283–1290. [Google Scholar] [CrossRef]
- Srinivasulu, C.; Ramgopal, M.; Ramanjaneyulu, G.; Anuradha, C.M.; Suresh Kumar, C. Syringic acid (SA)—A review of its occurrence, biosynthesis, pharmacological and industrial importance. Biomed. Pharmacother. 2018, 108, 547–557. [Google Scholar] [CrossRef]
- Ingole, A.; Kadam, M.P.; Dalu, A.P.; Kute, S.M.; Mange, P.R.; Theng, V.D.; Lahane, O.R.; Nikas, A.P.; Kawal, Y.V.; Nagrik, S.U.; et al. A review of the pharmacological characteristics of vanillic acid. J. Drug Delivery Ther. 2021, 11, 200–204. [Google Scholar] [CrossRef]
- Sharma, N.; Tiwari, N.; Vyas, M.; Khurana, N.; Muthuraman, A.; Utreja, P. An overview of therapeutic effects of vanillic acid. Plant Arch. 2020, 2, 3053–3059. [Google Scholar]
- Bucić-Kojić, A.; Fernandes, F.; Silva, T.; Planinić, M.; Tišma, M.; Šelo, G.; Šibalić, D.; Pereira, D.M.; Andrade, P.B. Enhancement of the anti-inflammatory properties of grape pomace treated by Trametes versicolor. Food Funct. 2020, 11, 680–688. [Google Scholar] [CrossRef] [PubMed]
- Lubbers, R.J.M.; de Vries, R.P. Production of protocatechuic acid from p-hydroxyphenyl (H) units and related aromatic compounds using an Aspergillus niger cell factory. mBio 2021, 12, e0039121. [Google Scholar] [CrossRef]
- Sova, M.; Saso, L. Natural sources, pharmacokinetics, biological activities and health benefits of hydroxycinnamic acids and their metabolites. Nutrients 2020, 12, 2190. [Google Scholar] [CrossRef]
- Zduńska, K.; Dana, A.; Kolodziejczak, A.; Rotsztejn, H. Antioxidant properties of ferulic acid and its possible application. Skin Pharmacol. Physiol. 2018, 31, 332–336. [Google Scholar] [CrossRef]
- Padilla-González, G.F.; Grosskopf, E.; Sadgrove, N.J.; Simmonds, M.S.J. Chemical diversity of Flavan-3-Ols in grape seeds: Modulating factors and quality requirements. Plants 2022, 11, 809. [Google Scholar] [CrossRef]
- Kubina, R.; Iriti, M.; Kabała-Dzik, A. Anticancer potential of selected flavonols: Fisetin, kaempferol, and quercetin on head and neck cancers. Nutrients 2021, 13, 845. [Google Scholar] [CrossRef]
- Tang, C.; Tan, B.; Sun, X. Elucidation of interaction between whey proteins and proanthocyanidins and its protective effects on proanthocyanidins during in-vitro digestion and storage. Molecules 2021, 26, 5468. [Google Scholar] [CrossRef] [PubMed]
- Benbouguerra, N.; Hornedo-Ortega, R.; Garcia, F.; El Khawand, T.; Saucier, C.; Richard, T. Stilbenes in grape berries and wine and their potential role as anti-obesity agents: A review. Trends Food Sci. Technol. 2021, 112, 362–381. [Google Scholar] [CrossRef]
- Beaumont, P.; Courtois, A.; Atgié, C.; Richard, T.; Krisa, S. In the shadow of resveratrol: Biological activities of epsilon-viniferin. J. Physiol. Biochem. 2022. [Google Scholar] [CrossRef] [PubMed]
- Zhang, X.-Y.; Chen, J.; Li, X.-L.; Yi, K.; Ye, Y.; Liu, G.; Wang, S.-F.; Hu, H.-L.; Zou, L.; Wang, Z.-G. Dynamic changes in antioxidant activity and biochemical composition of tartary buckwheat leaves during aspergillus niger fermentation. J. Funct. Foods 2017, 32, 375–381. [Google Scholar] [CrossRef]
- Tița, O.; Lengyel, E.; Stegăruș, D.I.; Săvescu, P.; Ciubara, A.B.; Constantinescu, M.A.; Tița, M.A.; Rață, D.; Ciubara, A. Identification and quantification of valuable compounds in red grape seeds. Appl. Sci. 2021, 11, 5124. [Google Scholar] [CrossRef]
- Maluf, D.F.; Gonçalves, M.; D’Angelo, R.; Girassol, A.; Tulio, A.; Pupo, Y.; Farago, P. Cytoprotection of antioxidant biocompounds from grape pomace: Further exfoliant phytoactive ingredients for cosmetic products. Cosmetics 2018, 5, 46. [Google Scholar] [CrossRef] [Green Version]
- Muñoz-Bernal, Ó.A.; Coria-Oliveros, A.J.; de la Rosa, L.A.; Rodrigo-García, J.; del Rocío Martínez-Ruiz, N.; Sayago-Ayerdi, S.G.; Alvarez-Parrilla, E. Cardioprotective effect of red wine and grape pomace. Food Res. Int. 2021, 140, 110069–110085. [Google Scholar] [CrossRef] [PubMed]


| Component | Untreated GP | Biologically Treated GP | ||
|---|---|---|---|---|
| Day ‘0’ | 5 Days | 10 Days | 15 Days | |
| Ash [%db] | 4.63 ± 0.03 | 5.28 ± 0.05 | 5.91 ± 0.09 | 6.5 ± 0.06 |
| Crude proteins [%db] | 14.04 ± 0.13 | 13.88 ± 0.14 | 15.75 ± 0.01 | 15.72 ± 0.16 |
| Fats [%db] | 8.69 ± 0.17 | 9.38 ± 0.39 | 9.50 ± 0.13 | 10.43 ± 0.39 |
| TC [%db] | 73.62 ± 0.17 | 73.98 ± 0.25 | 72.08 ± 0.51 | 73.09 ± 0.93 |
| NDF [%db] | 50.89 ± 0.38 | 58.53 ± 0.30 | 64.62 ± 0.44 | 63.82 ± 0.49 |
| ADF [%db] | 46.25 ± 1.17 | 57.88 ± 0.53 | 61.02 ± 0.44 | 60.89 ± 0.34 |
| ADL [%db] | 32.36 ± 0.03 | 39.90 ± 1.02 | 44.71 ± 0.58 | 44.15 ± 0.77 |
| Hemicellulose [%db] | 4.64 ± 0.78 | 0.65 ± 0.71 | 3.60 ± 0.34 | 2.94 ± 0.68 |
| Cellulose [%db] | 13.88 ± 1.19 | 17.98 ± 1.34 | 16.31 ± 0.94 | 16.74 ± 0.43 |
| Sucrose [mg/gdb] | 8.83 ± 0.18 | 2.54 ± 0.06 | 1.37 ± 0.08 | 1.41 ± 0.08 |
| Glucose [mg/gdb] | 1.97 ± 0.05 | 4.58 ± 0.18 | 4.72 ± 0.00 | 2.60 ± 0.00 |
| Fructose [mg/gdb] | 4.56 ± 0.10 | 6.26 ± 0.10 | 0.95 ± 0.17 | 1.06 ± 0.11 |
| Arabinose [mg/gdb] | 1.39 ± 0.08 | 3.29 ± 0.12 | 1.86 ± 1.46 | 2.06 ± 0.31 |
| Xylose [mg/gdb] | 0.21 ± 0.04 | 0.46 ± 0.06 | 0.32 ± 0.08 | 0.33 ± 0.00 |
| TOC [mg/gdb] | 47.47 ± 0.33 | 49.18 ± 1.41 | 40.26 ± 2.18 | 43.50 ± 3.86 |
| TN [mg/gdb] | 1.39 ± 0.03 | 1.25 ± 0.07 | 1.57 ± 0.09 | 2.28 ± 0.14 |
| TPC [mg/gdb] | 51.38 ± 1.02 | 22.26 ± 0.51 | 16.41 ± 0.58 | 16.84 ± 0.34 |
| TF [mg/gdb] | 30.15 ± 0.43 | 13.59 ± 2.20 | 9.11 ± 0.40 | 8.08 ± 0.11 |
| TPA [mg/gdb] | 8.79 ± 0.07 | 3.55 ± 0.08 | 2.46 ± 0.06 | 1.81 ± 0.04 |
| Phenolic Compounds | Microorganism | SSF (Day) | Co (µg/gdb) | Ci,max. (µg/gdb) | |
|---|---|---|---|---|---|
| Phenolic acids (Hydroxybenzoic acids) | Gallic acid | R. oryzae | 2 | 267.77 ± 11.78 | 568.43 ± 12.48 |
| Ellagic acid | C. subvermispora | 15 | 34.65 ± 3.66 | 303.72 ± 25.89 | |
| p-Hydroxybenzoic acid | R. oryzae | 2 | 5.05 ± 0.22 | 14.37 ± 0.23 | |
| Syringic acid | P. eryngii | 10 | 86.37 ± 2.15 | 205.13 ± 0.01 | |
| Vanillic acid | R. oryzae | 2 | 40.54 ± 0.21 | 63.35 ± 1.57 | |
| 3,4-Dihydroxybenzoic acid | H. grisea | 15 | 138.61 ± 9.87 | 699.30 ± 20.78 | |
| Phenolic acids (Hydroxycinnamic acids) | Ferulic acid | G. lucidum | 1 | 4.78 ± 0.20 | 5.95 ± 0.21 |
| o-Coumaric acid | T. versicolor AG613 | 15 | 4.43 ± 0.11 | 33.36 ± 0.37 | |
| p-Coumaric acid | R. oryzae | 1 | 8.76 ± 0.70 | 14.63 ± 0.16 | |
| Flavan-3-ols | Epicatechin gallate | T. versicolor AG613 | 15 | 166.69 ± 8.42 | 519.13 ± 5.20 |
| Galocatechin gallate | P. eryngii | 10 | 291.57 ± 2.35 | 1064.70 ± 0.25 | |
| Flavonols | Quercetin | P. eryngii | 10 | 173.32 ± 16.54 | 662.63 ± 6.68 |
| Kaempferol | P. eryngii | 10 | 10.22 ± 1.06 | 45.25 ± 0.82 | |
| Procyanidins | Procyanidin B1 | R. oryzae | 10 | 304.27 ± 0.37 | 1368.26 ± 18.19 |
| Procyanidin B2 | P. eryngii | 2 | 619.59 ± 7.90 | 692.75 ± 10.35 | |
| Stilbenes | Resveratrol | P. eryngii | 5 | 46.07 ± 3.48 | 69.65 ± 0.97 |
| ε-Viniferin | G. resinaceum | 4 | 17.52 ± 1.64 | 51.80 ± 0.35 | |
Publisher’s Note: MDPI stays neutral with regard to jurisdictional claims in published maps and institutional affiliations. |
© 2022 by the authors. Licensee MDPI, Basel, Switzerland. This article is an open access article distributed under the terms and conditions of the Creative Commons Attribution (CC BY) license (https://creativecommons.org/licenses/by/4.0/).
Share and Cite
Šelo, G.; Planinić, M.; Tišma, M.; Grgić, J.; Perković, G.; Koceva Komlenić, D.; Bucić-Kojić, A. A Comparative Study of the Influence of Various Fungal-Based Pretreatments of Grape Pomace on Phenolic Compounds Recovery. Foods 2022, 11, 1665. https://doi.org/10.3390/foods11111665
Šelo G, Planinić M, Tišma M, Grgić J, Perković G, Koceva Komlenić D, Bucić-Kojić A. A Comparative Study of the Influence of Various Fungal-Based Pretreatments of Grape Pomace on Phenolic Compounds Recovery. Foods. 2022; 11(11):1665. https://doi.org/10.3390/foods11111665
Chicago/Turabian StyleŠelo, Gordana, Mirela Planinić, Marina Tišma, Josipa Grgić, Gabriela Perković, Daliborka Koceva Komlenić, and Ana Bucić-Kojić. 2022. "A Comparative Study of the Influence of Various Fungal-Based Pretreatments of Grape Pomace on Phenolic Compounds Recovery" Foods 11, no. 11: 1665. https://doi.org/10.3390/foods11111665