
Food Waste and Qualitative Evaluation of Menus in Public University Canteens—Challenges and Opportunities


 , ,
, ,  and
and 
Abstract
:
1. Introduction
2. Materials and Methods
2.1. Study Design
2.2. Qualitative Evaluation of Menus
2.3. Food Waste
2.4. Statistical Analysis
3. Results
4. Discussion
5. Conclusions
Author Contributions
Funding
Institutional Review Board Statement
Informed Consent Statement
Data Availability Statement
Conflicts of Interest
References
- Kabir, A.; Miah, S.; Islam, A. Factors influencing eating behavior and dietary intake among resident students in a public university in Bangladesh: A qualitative study. PLoS ONE 2018, 13, e0198801. [Google Scholar] [CrossRef] [PubMed] [Green Version]
- El Zein, A.; Shelnutt, K.P.; Colby, S.; Vilaro, M.J.; Zhou, W.; Greene, G.; Olfert, M.D.; Riggsbee, K.; Morrell, J.S.; Mathews, A.E. Prevalence and correlates of food insecurity among US college students: A multi-institutional study. BMC Public Health 2019, 19, 12. [Google Scholar] [CrossRef] [PubMed]
- Mongiello, L.L.; Freudenberg, N.; Spark, A. Making the Healthy Choice the Easy Choice on Campus: A Qualitative Study. Health Behav. Policy Rev. 2015, 2, 110–121. [Google Scholar] [CrossRef]
- Amaral, A.R.; Rodrigues, E.; Gaspar, A.R.; Gomes, A. A review of empirical data of sustainability initiatives in university campus operations. J. Clean. Prod. 2020, 250, 16. [Google Scholar] [CrossRef]
- FAO. Food Wastage Footprint Impacts on Natural Resources; Food Agriculture Organiziton: Rome, Italy, 2013. [Google Scholar]
- García-Herrero, L.; De Menna, F.; Vittuari, M. Food waste at school. The environmental and cost impact of a canteen meal. Waste Manag. 2019, 100, 249–258. [Google Scholar] [CrossRef] [PubMed]
- García-Herrero, L.; Costello, C.; De Menna, F.; Schreiber, L.; Vittuari, M. Eating away at sustainability. Food consumption and waste patterns in a US school canteen. J. Clean. Prod. 2021, 279, 123571. [Google Scholar] [CrossRef]
- FAO. The State of Food and Agriculture Moving Forward on Food Loss and Waste Reduction; FAO: Rome, Italy, 2019. [Google Scholar]
- Ferreira, M.; Liz Martins, M.; Rocha, A. Food waste as a index of foodservice quality. Br. Food J. 2013, 115, 1628–1637. [Google Scholar] [CrossRef]
- Pinto, R.S.; dos Santos Pinto, R.M.; Melo, F.F.; Campos, S.S.; Cordovil, C.M. A simple awareness campaign to promote food waste reduction in a University canteen. Waste Manag. 2018, 76, 28–38. [Google Scholar] [CrossRef]
- Qian, L.; Li, F.; Cao, B.; Wang, L.; Jin, S. Determinants of food waste generation in Chinese university canteens: Evidence from 9192 university students. Resour. Conserv. Recycl. 2021, 167, 105410. [Google Scholar] [CrossRef]
- Leal Filho, W.; Lange Salvia, A.; Davis, B.; Will, M.; Moggi, S. Higher education and food waste: Assessing current trends. Int. J. Sustain. Dev. World Ecol. 2021, 28, 1–11. [Google Scholar] [CrossRef]
- Parfitt, J.; Barthel, M.; Macnaughton, S. Food waste within food supply chains: Quantification and potential for change to 2050. Philos. Trans. R. Soc. Lond. B Biol. Sci. 2010, 365, 3065–3081. [Google Scholar] [CrossRef] [Green Version]
- Stuart, T. Waste-Uncovering the Global Food Scandal; Penguin Books: London, UK, 2009. [Google Scholar]
- Augustini, V.; Kishimoto, P.; Tescaro, T.; Almeida, F.Q.A. Avaliação do Índice de Resto-Ingesta e Sobras em Unidade de Alimentação e Nutrição (UAN) de uma empresa metalúrgica na cidade de Piracicaba/SP. Simbio-Logias 2008, 1, 99–110. [Google Scholar]
- Saphire, D. Getting an “A” at Lunch-Smart Strategies to Reduce Waste in Campus Dining; Inform: New York, NY, USA, 1998. [Google Scholar]
- Lechner, A.; Giovanoni, A. Avaliação do resto-ingesta em uma unidade de alimentação no vale do Taquari-RS. Revista Destaques Académicos-CCBS/UNIVATES 2012, 4, 79–83. [Google Scholar]
- Conselho Federal de Nutricionistas. Resolução CFN N° 380/2005. Brasil. 2005. Available online: https://novoportal.crn1.org.br/wp-content/uploads/2015/04/res380.pdf?x53725 (accessed on 27 July 2021).
- United Nations Environment Programme. Food Waste Index Report 2021; United Nations: Nairobi, Kenya, 2021. [Google Scholar]
- Bradacz, D. Modelo de Gestão da Qualidade para o Controle de Despedício de Alimentos em Unidades de Alimentação e Nutrição; UFSC: Florianópolis, Brazil, 2003. [Google Scholar]
- Proença, R. Inovação Tecnológica na Produção de Alimentação Colectiva; Insular: Florinópolis, Brazil, 1997. [Google Scholar]
- WHO. WHO European Ministerial Conference on Counteracting Obesity Conference Report; WHO Regional OKCE for Europe: Copenhagen, Denmark, 2007. [Google Scholar]
- Lima, J.; Rocha, A. Avaliação da Qualidade das Ementas em Instituições Particulares de Solidariedade Social do Concelho de Águeda. Rev. Nutr. 2013, 17, 16–19. [Google Scholar]
- Souza, V.R.; Ferreira, A.B.; São José, J.F.; Silva, E.M.; Silva, D.A. Influence of intervention on the menu’s nutritional and sensory qualities and on the food waste of children’s education center. Cienc. Saude Coletiva 2019, 24, 411–418. [Google Scholar] [CrossRef]
- Bessa, V.; Monteiro, A.; Rocha, A. Proposta de critérios para avaliação qualitativa de ementas. Alimentação Humana 2009, 15, 73–79. [Google Scholar]
- Cupertino, A.F.; Maynard, D.D.; Queiroz, F.L.; Zandonadi, R.P.; Ginani, V.C.; Raposo, A.; Saraiva, A.; Botelho, R.B.A. How Are School Menus Evaluated in Different Countries? A Systematic Review. Foods 2021, 10, 374. [Google Scholar] [CrossRef]
- Veiros, M.; Campos, G.; Ruivo, I.; Proença, R.; Rocha, A.; Kent-Smith, L. Avaliação Qualitativa de Ementas-Método AQE. Revista de Alimentação Humana 2007, 13, 62–78. [Google Scholar]
- Rodrigues, S.; Franchini, B.; Graça, P.; Almeida, M. A new food guide for the portuguese population: Development and technical considerations. J. Nutr. Educ. Behav. 2006, 38, 189–195. [Google Scholar] [CrossRef]
- Ricarte, M.P.; Fé, M.A.; da Silva Santos, I.H.; Lopes, A.K. Avaliação do desperdício de alimentos em uma Unidade de Alimentação e Nutrição Institucional em Fortaliza-CE. Saber Científico 2008, 1, 158–175. [Google Scholar]
- São José, J. Avaliação Qualitativa De Cardápios Em Uma Unidade De Alimentação E Nutrição Localizada Em Vitória-Es. Demetra Alimentação Nutrição Saúde 2015, 9, 975–984. [Google Scholar]
- Benvindo, J.; Pinto, A.; Bandoni, D. Qualidade Nutricional De Cardápios Planejados Para Restaurantes Universitários De Universidades Federais Do Brasil. Demetra Alimentação Nutrição Saúde 2017, 12, 447–464. [Google Scholar] [CrossRef] [Green Version]
- World Health Organization. Diet, Nutrition and Prevention of Chronic Diseases; Report of a Joint WHO/FAO Expert Consultation; World Health Organization: Geneva, Switzerland, 2003. [Google Scholar]
- Longo-Silva, G.; Toloni, M.; Rodrigues, S.; Rocha, A.; Taddei, J.A. Qualitative evaluation of the menu and plate waste in public day care centers in São Paulo city, Brazil. Rev. Nutr. 2013, 26, 135–144. [Google Scholar] [CrossRef] [Green Version]
- de Abreu, E.S.; Spinelli, M.G.; de Souza Pinto, A.M. Gestão de Unidades de Alimentação e Nutrição: Um Modelo de Fazer; Metha: São Paulo, Brazil, 2003. [Google Scholar]
- Sayur, J.; Pinto, A.M. Avaliação do resto alimentar em uma Unidade de Alimentação e Nutrição. Nutrição em Pauta 2009, 17, 62–65. [Google Scholar]
- Vian, C.E.F.; Lobo, G.D.; Monteiro, D.M.S.; Miranda, S.H.G.; Meira, A.M.; Poeta, P.T. An inquire on dining. Revista de Ciências Agrárias 2020, 43, 106–117. [Google Scholar]
- Carvalho, J.; Lima, J.; Rocha, A. Desperdício Alimentar E Satisfação Do Consumidor Com O Serviço De Alimentação Da Escola De Hotelaria E Turismo De Coimbra, Portugal. Demetra Alimentação Nutrição Saúde 2015, 10, 405–418. [Google Scholar] [CrossRef] [Green Version]
- Messner, R.; Richards, C.; Johnson, H. The “Prevention Paradox”: Food waste prevention and the quandary of systemic surplus production. Agric. Hum. Values 2020, 37, 1–13. [Google Scholar] [CrossRef]
- Silva Júnior, E.A. Manual de Controle Higiênico-Sanitário em Alimentos, 5th ed.; Varela: São Paulo, Brazil, 2002; 254p. [Google Scholar]
- Nonino-Borges, C.B.; Rabito, E.I.; da Silva, A.; Ferraz, C.; Chiarello, P.; dos Santos, J.; Marchini, J. Food wastage in a hospital. Desperdício de alimentos intrahospitalar. Revista Nutrição Campinas 2006, 19, 349–356. [Google Scholar] [CrossRef] [Green Version]
- Castro, M.D.; Oliveira, L.D.; Passamani, L.; Silva, R.D. Resto-ingesta e aceitação de refeições em uma Unidade de Alimentação e Nutrição. Higiene Alimentar. São Paulo. Revista Higiene Alimentar 2003, 17, 24–28. [Google Scholar]
- Silvennoinen, K.; Heikkilä, L.; Katajajuuri, J.; Reinikainen, A. Food waste volume and origin: Case studies in the Finnish food service sector. Waste Manag. 2015, 46, 140–145. [Google Scholar] [CrossRef]
- Derqui, B.; Fernandez, V.; Fayos, T. Towards more sustainable food systems. Addressing food waste at school canteens. Appetite 2018, 129, 1–11. [Google Scholar] [CrossRef] [PubMed]
- Martin-Rios, C.; Demen-Meier, C.; Gössling, S.; Cornuz, C. Food waste management innovations in the foodservice industry. Waste Manag. 2018, 79, 196–206. [Google Scholar] [CrossRef] [PubMed] [Green Version]
- Visschers, V.H.; Gundlach, D.; Beretta, C. Smaller servings vs. information provision: Results of two interventions to reduce plate waste in two university canteens. Waste Manag. 2020, 103, 323–333. [Google Scholar] [CrossRef] [PubMed]
- Hennchen, B. Knowing the kitchen: Applying practice theory to issues of food waste in the food service sector. J. Clean. Prod. 2019, 225, 675–683. [Google Scholar] [CrossRef]
- Migliavada, R.; Ricci, F.Z.; Torri, L. A three-year longitudinal study on the use of pre-ordering in a university canteen. Appetite 2021, 163, 105203. [Google Scholar] [CrossRef] [PubMed]
- Ellison, B.; Savchenko, O.; Nikolaus, C.J.; Duff, B.R. Every plate counts: Evaluation of a food waste reduction campaign in a university dining hall. Resour. Conserv. Recycl. 2019, 144, 276–284. [Google Scholar] [CrossRef]
- Derqui, B.; Grimaldi, D.; Fernandez, V. Building and managing sustainable schools: The case of food waste. J. Clean. Prod. 2020, 243, 118533. [Google Scholar] [CrossRef]
- Kasavan, S.; Ali, N.I.; Ali, S.S.; Masarudin, N.A.; Yusoff, S.B. Quantification of food waste in school canteens: A mass flow analysis. Resour. Conserv. Recycl. 2021, 164, 105176. [Google Scholar] [CrossRef]
- Martin-Rios, C.; Hofmann, A.; Mackenzie, N. Sustainability-oriented innovations in food waste management technology. Sustainability 2021, 13, 210. [Google Scholar] [CrossRef]

| Canteen | Menu Weeks | Criteria A | Criteria B | Criteria C | Criteria D | Criteria E | Criteria F | Global Adequacy |
|---|---|---|---|---|---|---|---|---|
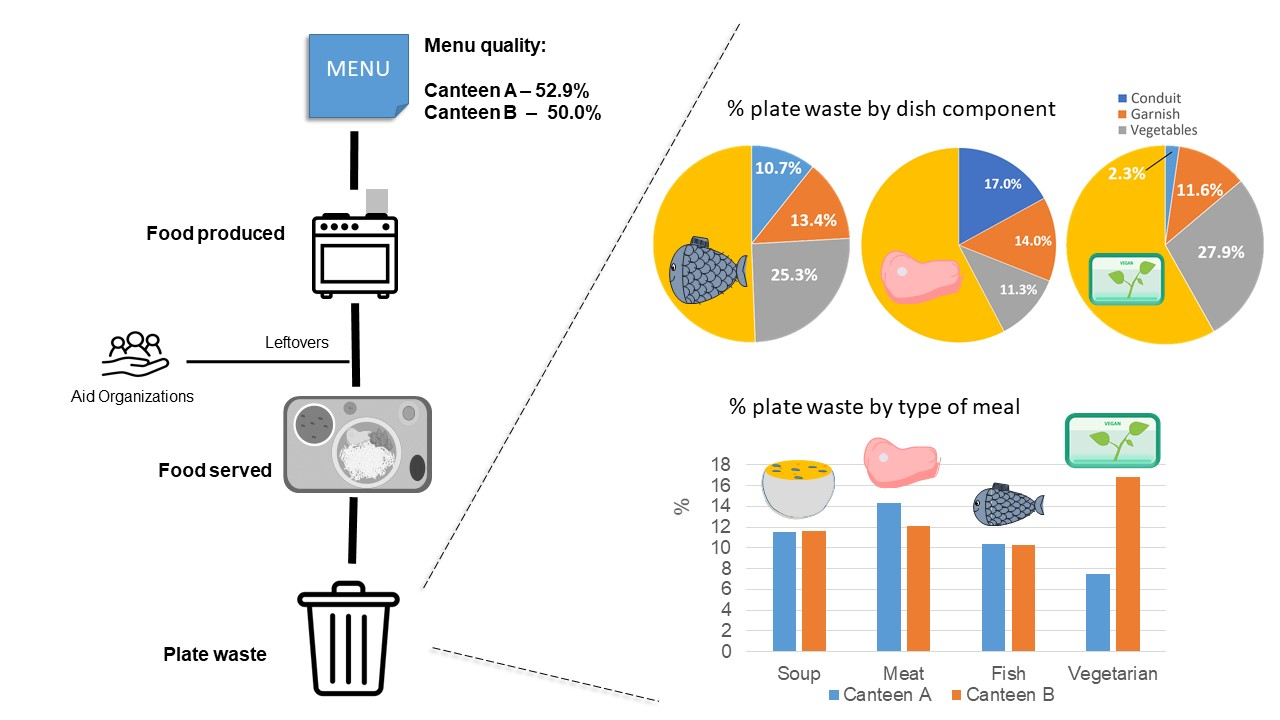
| A | 5 | 33.3 | 38.9 | 50.0 | 50.0 | 66.7 | 75.0 | 52.9 |
| B | 5 | 33.3 | 33.3 | 66.7 | 50.0 | 66.7 | 58.3 | 50.0 |
| Meals Served n | Food Produced | Food Served | Food Wasted | |||
|---|---|---|---|---|---|---|
| g | g | % a | g | % b | ||
| Canteen A | ||||||
| Soup | 19,513.7 ± 2914.6 | 14,255.8 ± 2807.8 | 74.0 ± 14.0 | 1583.1 ± 780.7 | 11.5 ± 6.2 | |
| Meat dish | 358 | 38,946.0 ± 7761.9 | 34,216.0 ± 7127.8 | 88.0 ± 6.5 | 4406.6 ± 2009.5 | 14.3 ± 7.8 |
| Fish dish | 59 | 8718.2 ± 2226.3 | 7561.6 ± 2046.7 | 87.1 ±13.3 | 688.2 ± 211.1 | 10.4 ± 6.3 |
| Vegetarian dish | 35 | 6722.4 ± 2310.5 | 5540.2 ± 3277.3 | 75.0 ± 29.9 | 381.1 ± 245.9 | 7.5 ± 3.0 |
| Canteen B | ||||||
| Soup | 56,201.0 ± 5679.1 | 35,741.0 ± 10674.3 | 63.4 ± 15.9 | 4124.8 ± 1455.1 | 11.6 ± 4.8 | |
| Meat dish | 795 | 64,172.0 ± 12,579.8 | 48,740.6 ± 19.1 | 78.4 ± 19.1 | 5682.6 ± 2258.2 | 12.1 ± 5.3 |
| Fish dish | 274 | 29,877.3 ± 7695.1 | 27,648.2 ± 5313.1 | 94.1 ± 8.1 | 2933.9 ± 1058.7 | 10.3 ± 2.4 |
| Vegetarian dish | 100 | 16,459.3 ± 8333.3 | 14,973.9 ± 7571.4 | 90.3 ± 7.7 | 1958.2 ± 1390.0 | 16.8 ± 11.9 |
| N a | Conduit b | Garnish b | Vegetables b | ||
|---|---|---|---|---|---|
| Meat dish | Total | 8 | 17.0 ± 8.5 | 14.0 ± 5.2 | 11.3 ± 8.1 |
| Canteen A | 4 | 23.6 ± 5.4 | 15.3 ± 2.9 | 8.1 ± 4.8 | |
| Canteen B | 4 | 10.4 ± 5.1 | 12.7 ± 6.5 | 14.4 ± 9.4 | |
| Fish dish | Total | 7 | 10.7 ± 8.0 | 13.4 ± 6.3 | 25.3 ± 16.4 |
| Canteen A | 4 | 10.6 ± 8.8 | 14.6 ± 7.7 | 31.9 ± 18.6 | |
| Canteen B | 3 | 10.9 ± 6.7 | 11.7 ± 2.8 | 16.5 ± 5.8 | |
| Vegetarian dish | Total | 5 | 2.3 ± 1.2 | 11.6 ± 4.1 | 27.9 ± 20.7 |
| Canteen A | 3 | 3.1 ± 1.0 | 11.4 ± 5.2 | 34.5 ± 23.9 | |
| Canteen B | 2 | 10.9 ± 6.7 | 11.7 ± 2.8 | 16.5 ± 5.8 |
Publisher’s Note: MDPI stays neutral with regard to jurisdictional claims in published maps and institutional affiliations. |
© 2021 by the authors. Licensee MDPI, Basel, Switzerland. This article is an open access article distributed under the terms and conditions of the Creative Commons Attribution (CC BY) license (https://creativecommons.org/licenses/by/4.0/).
Share and Cite
Aires, C.; Saraiva, C.; Fontes, M.C.; Moreira, D.; Moura-Alves, M.; Gonçalves, C. Food Waste and Qualitative Evaluation of Menus in Public University Canteens—Challenges and Opportunities. Foods 2021, 10, 2325. https://doi.org/10.3390/foods10102325
Aires C, Saraiva C, Fontes MC, Moreira D, Moura-Alves M, Gonçalves C. Food Waste and Qualitative Evaluation of Menus in Public University Canteens—Challenges and Opportunities. Foods. 2021; 10(10):2325. https://doi.org/10.3390/foods10102325
Chicago/Turabian StyleAires, Cristina, Cristina Saraiva, Maria Conceição Fontes, Daniel Moreira, Márcio Moura-Alves, and Carla Gonçalves. 2021. "Food Waste and Qualitative Evaluation of Menus in Public University Canteens—Challenges and Opportunities" Foods 10, no. 10: 2325. https://doi.org/10.3390/foods10102325