
From Quantifying to Managing Food Loss in the Agri-Food Industry Supply Chain


Abstract
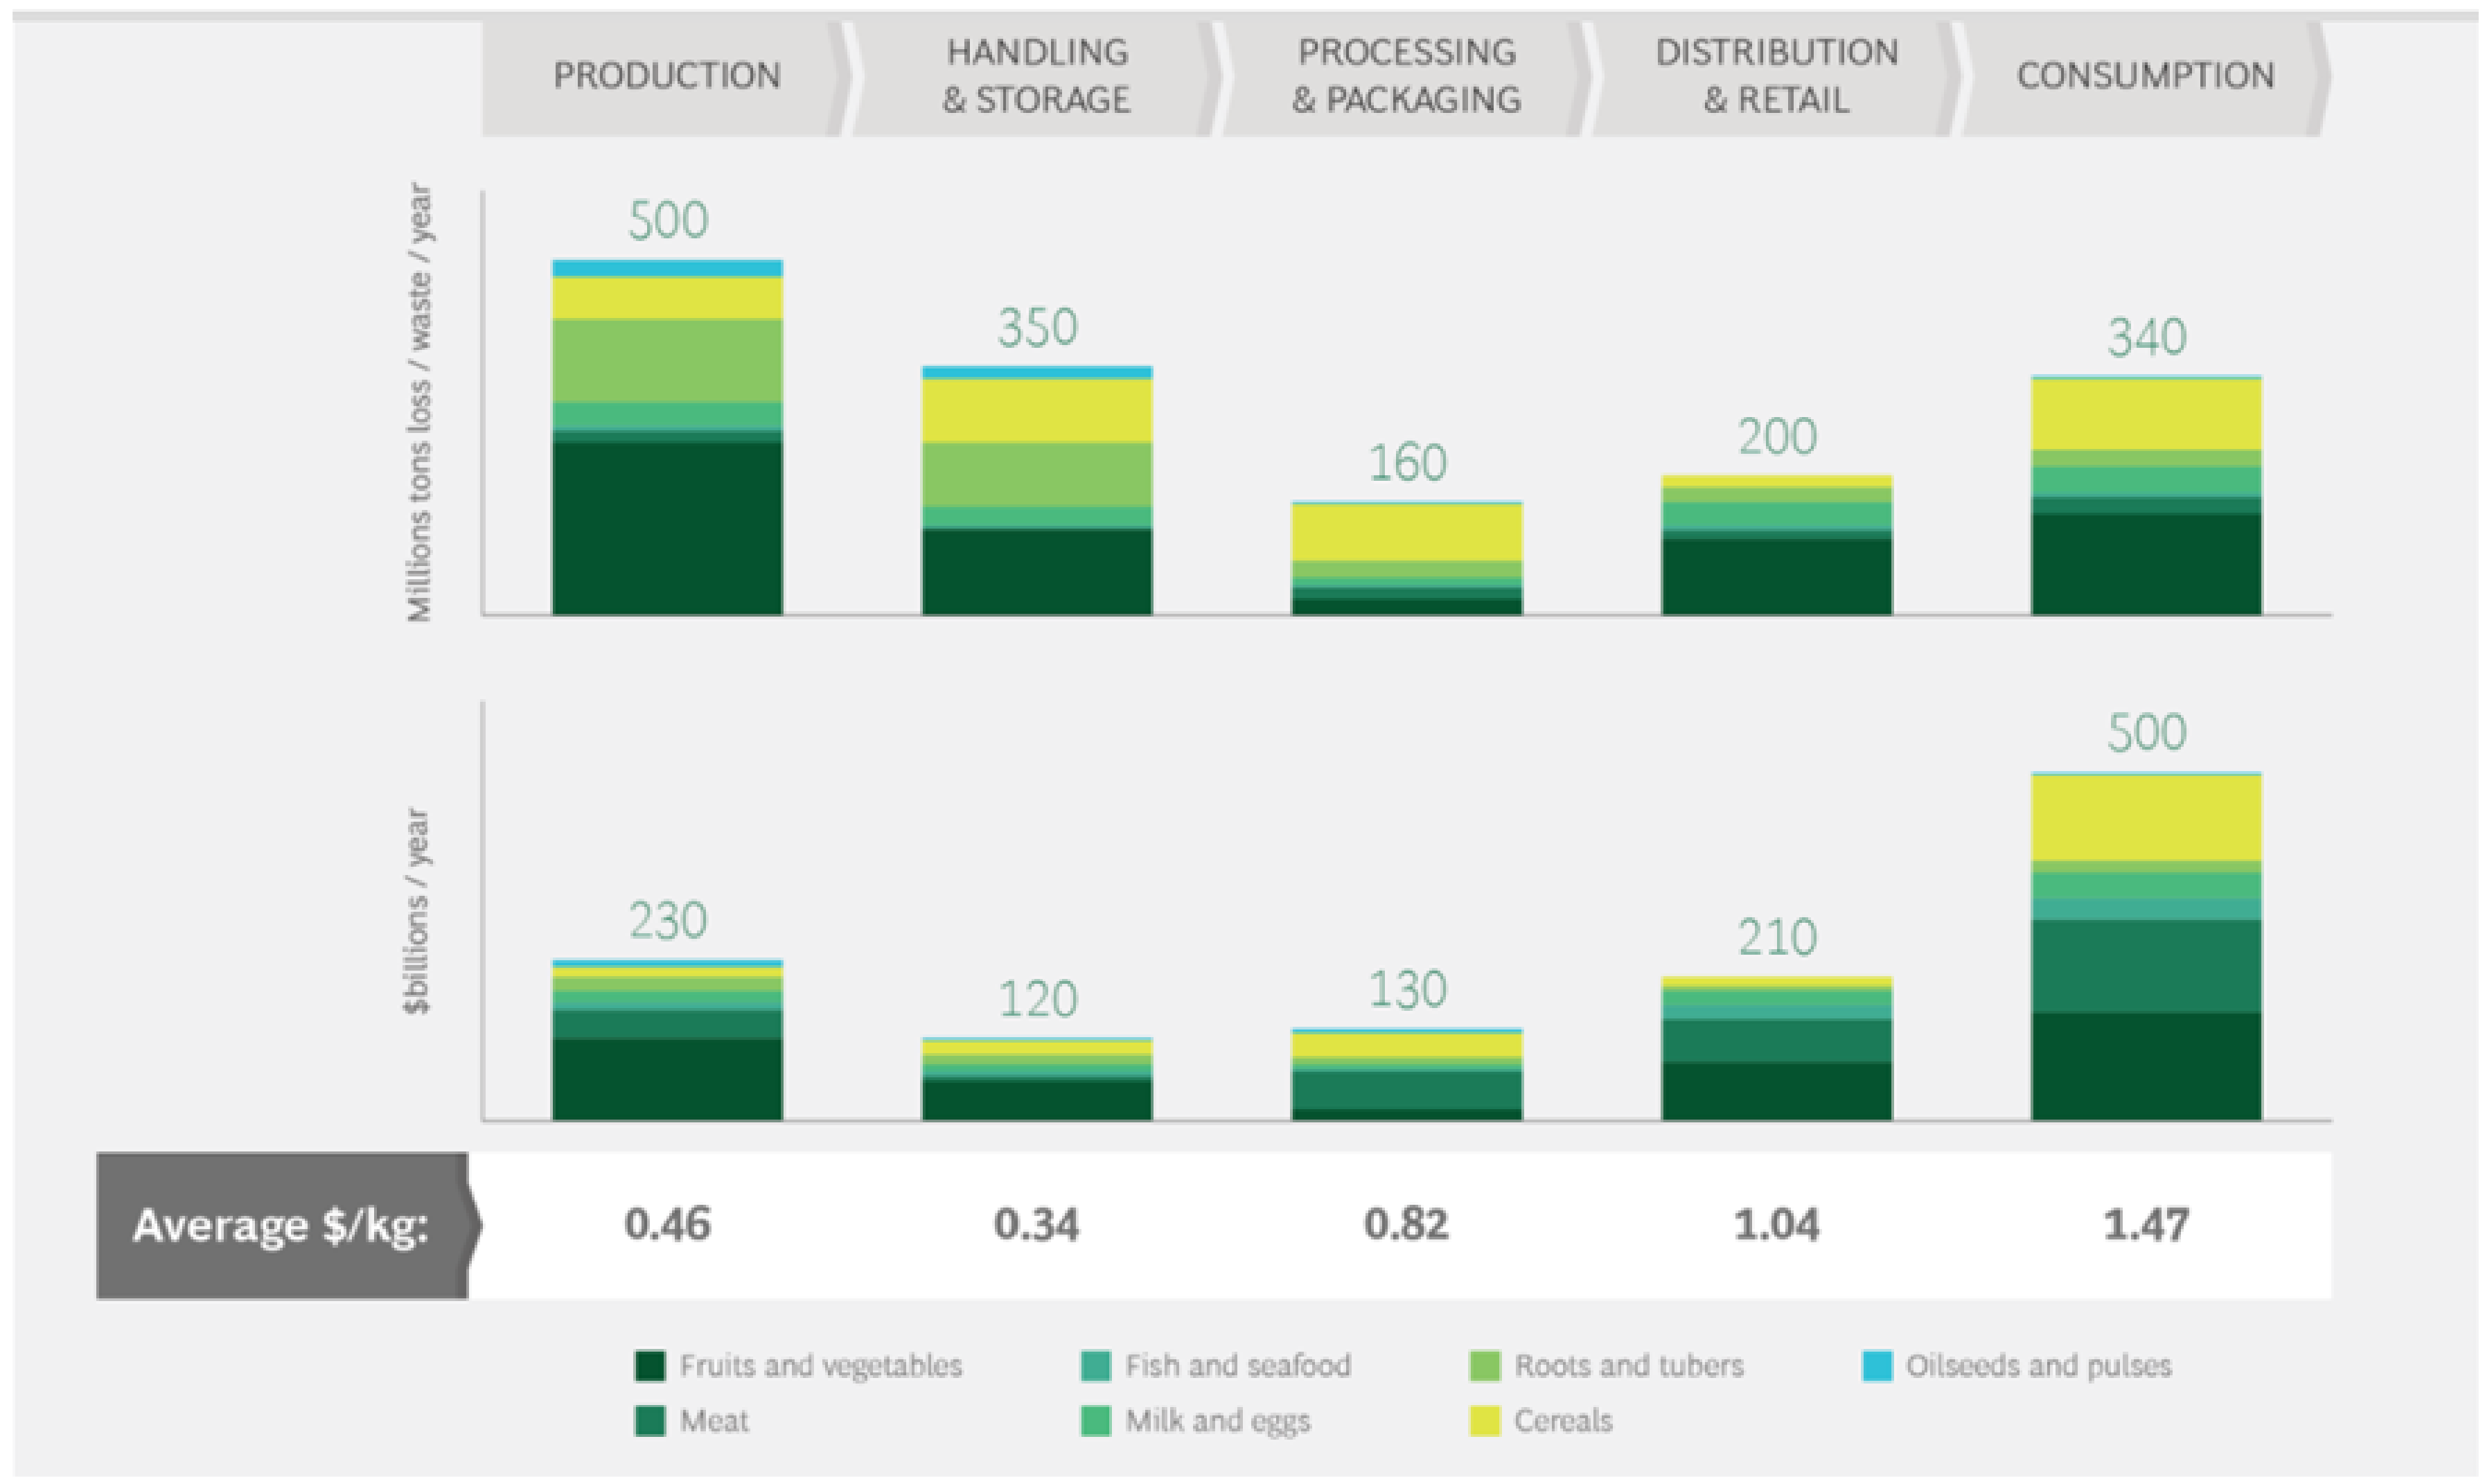
:1. Introduction
2. Materials and Methods
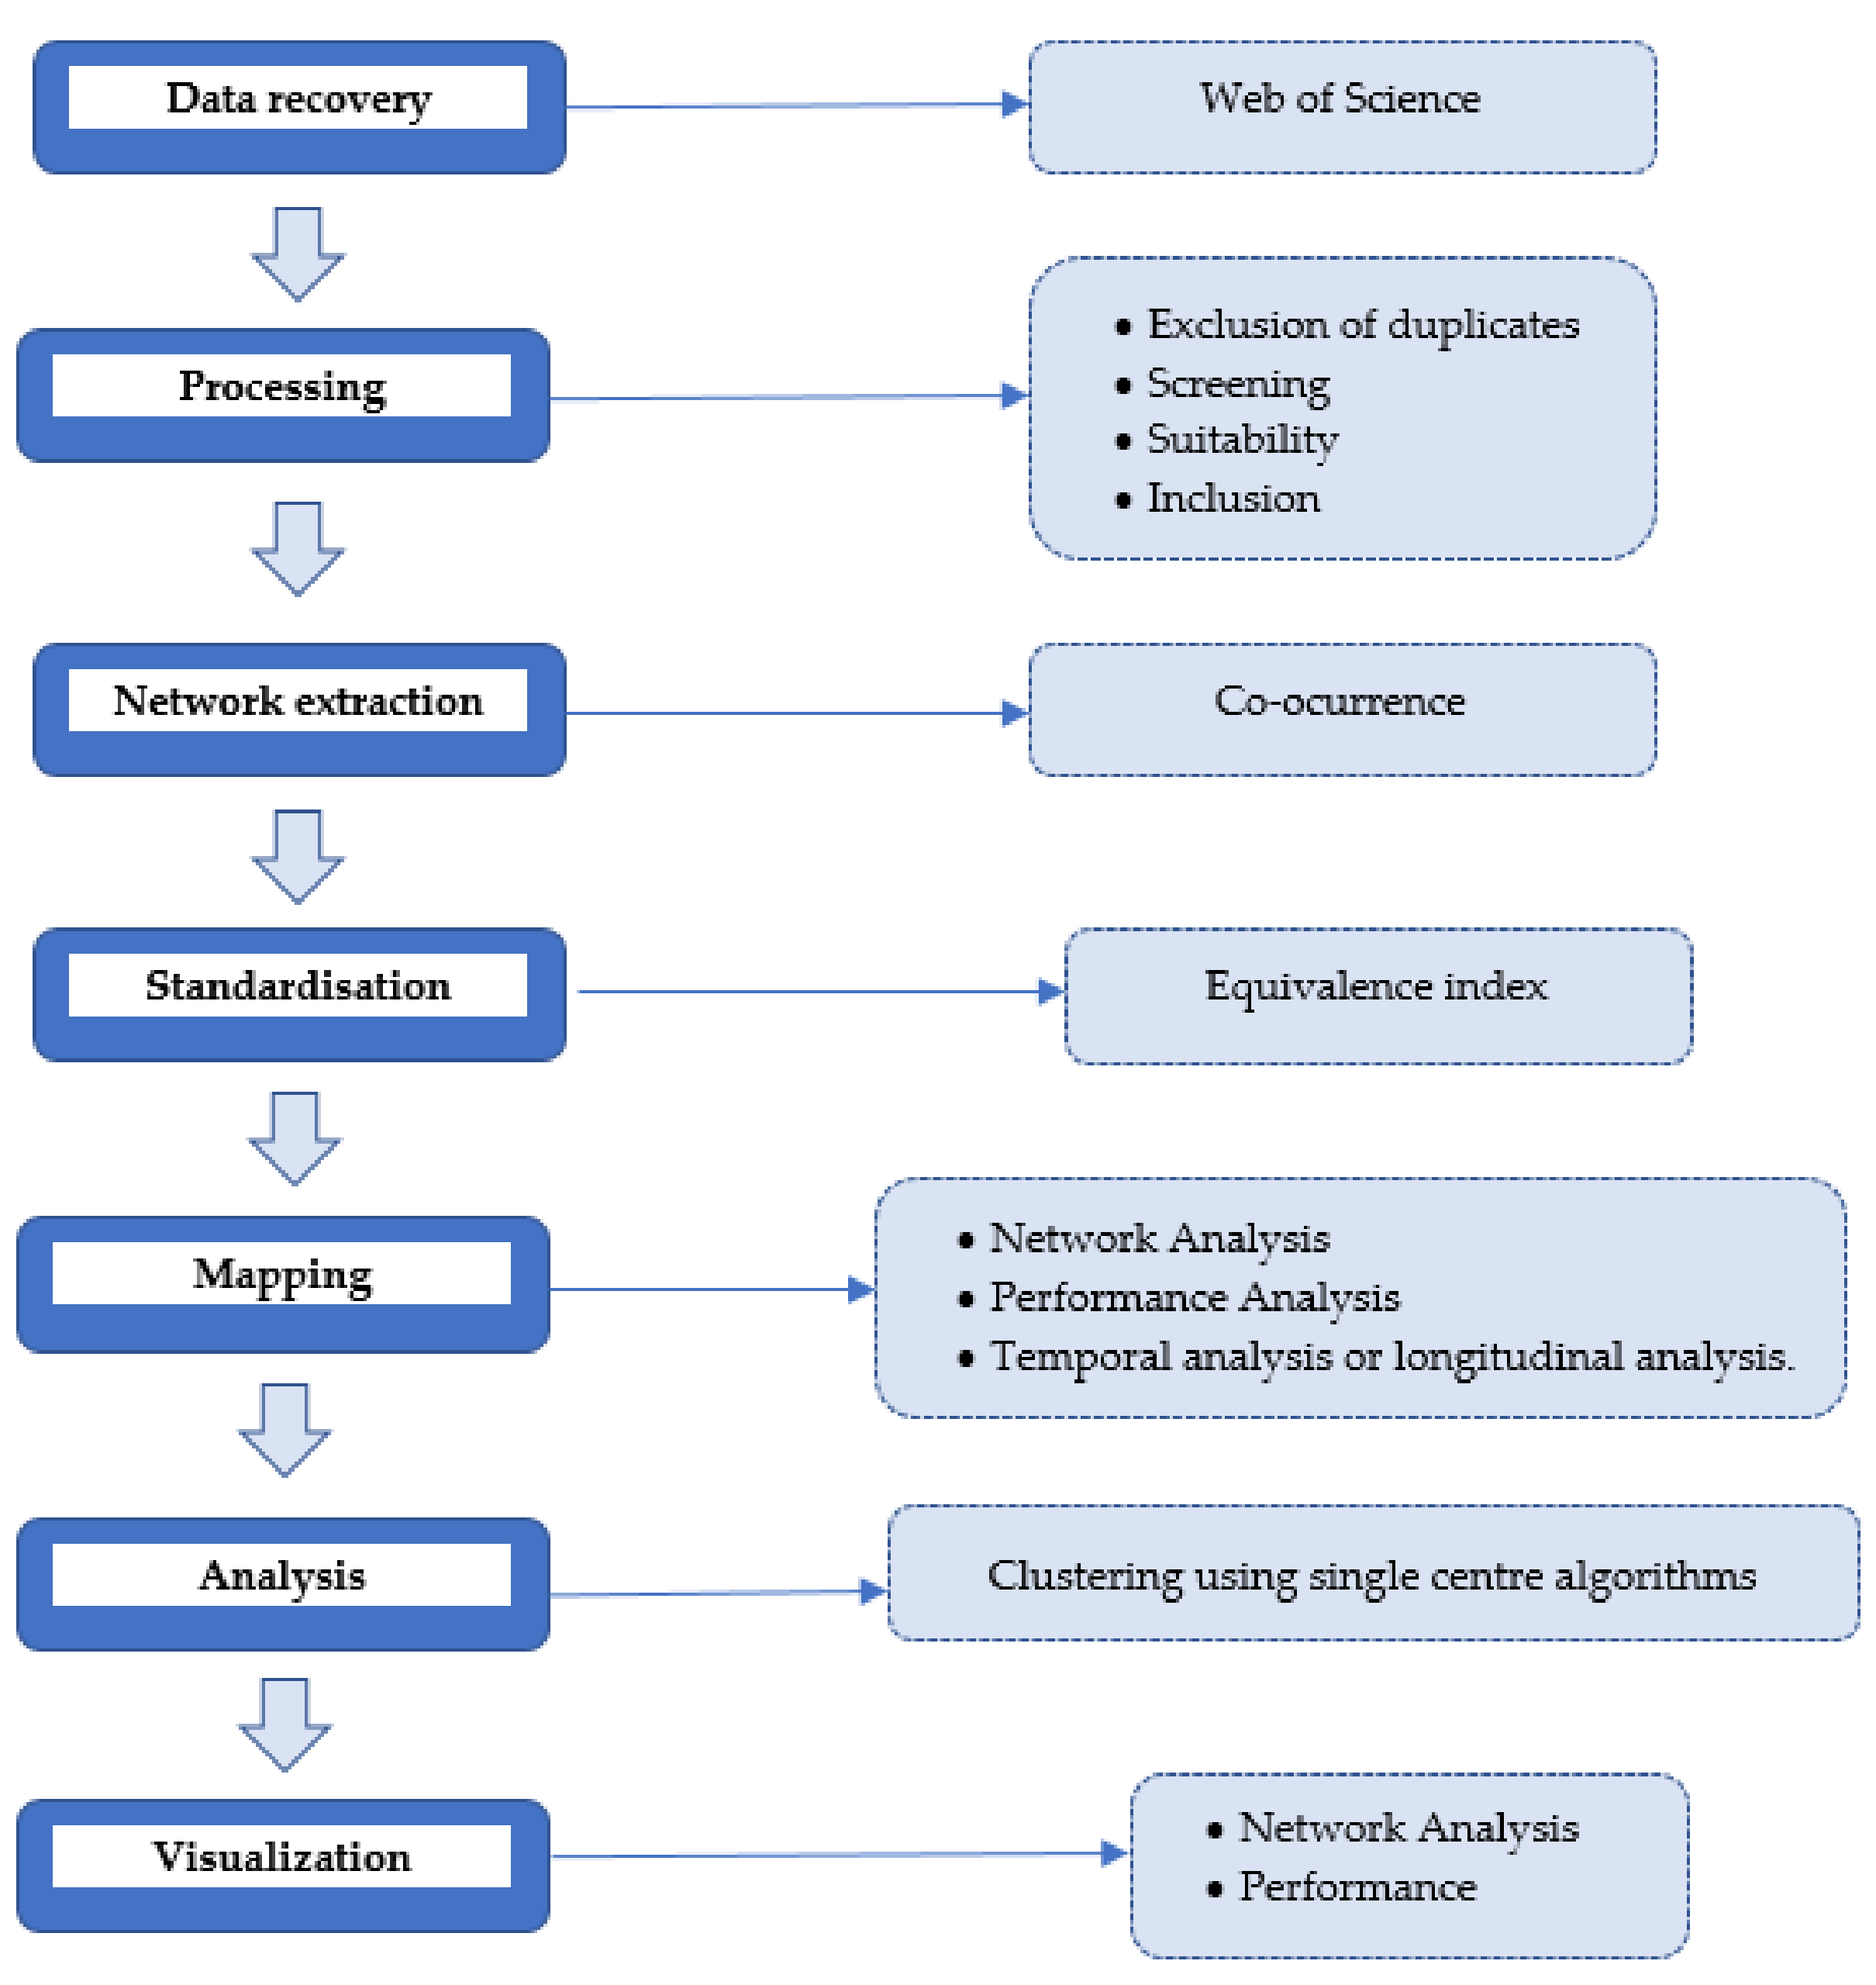
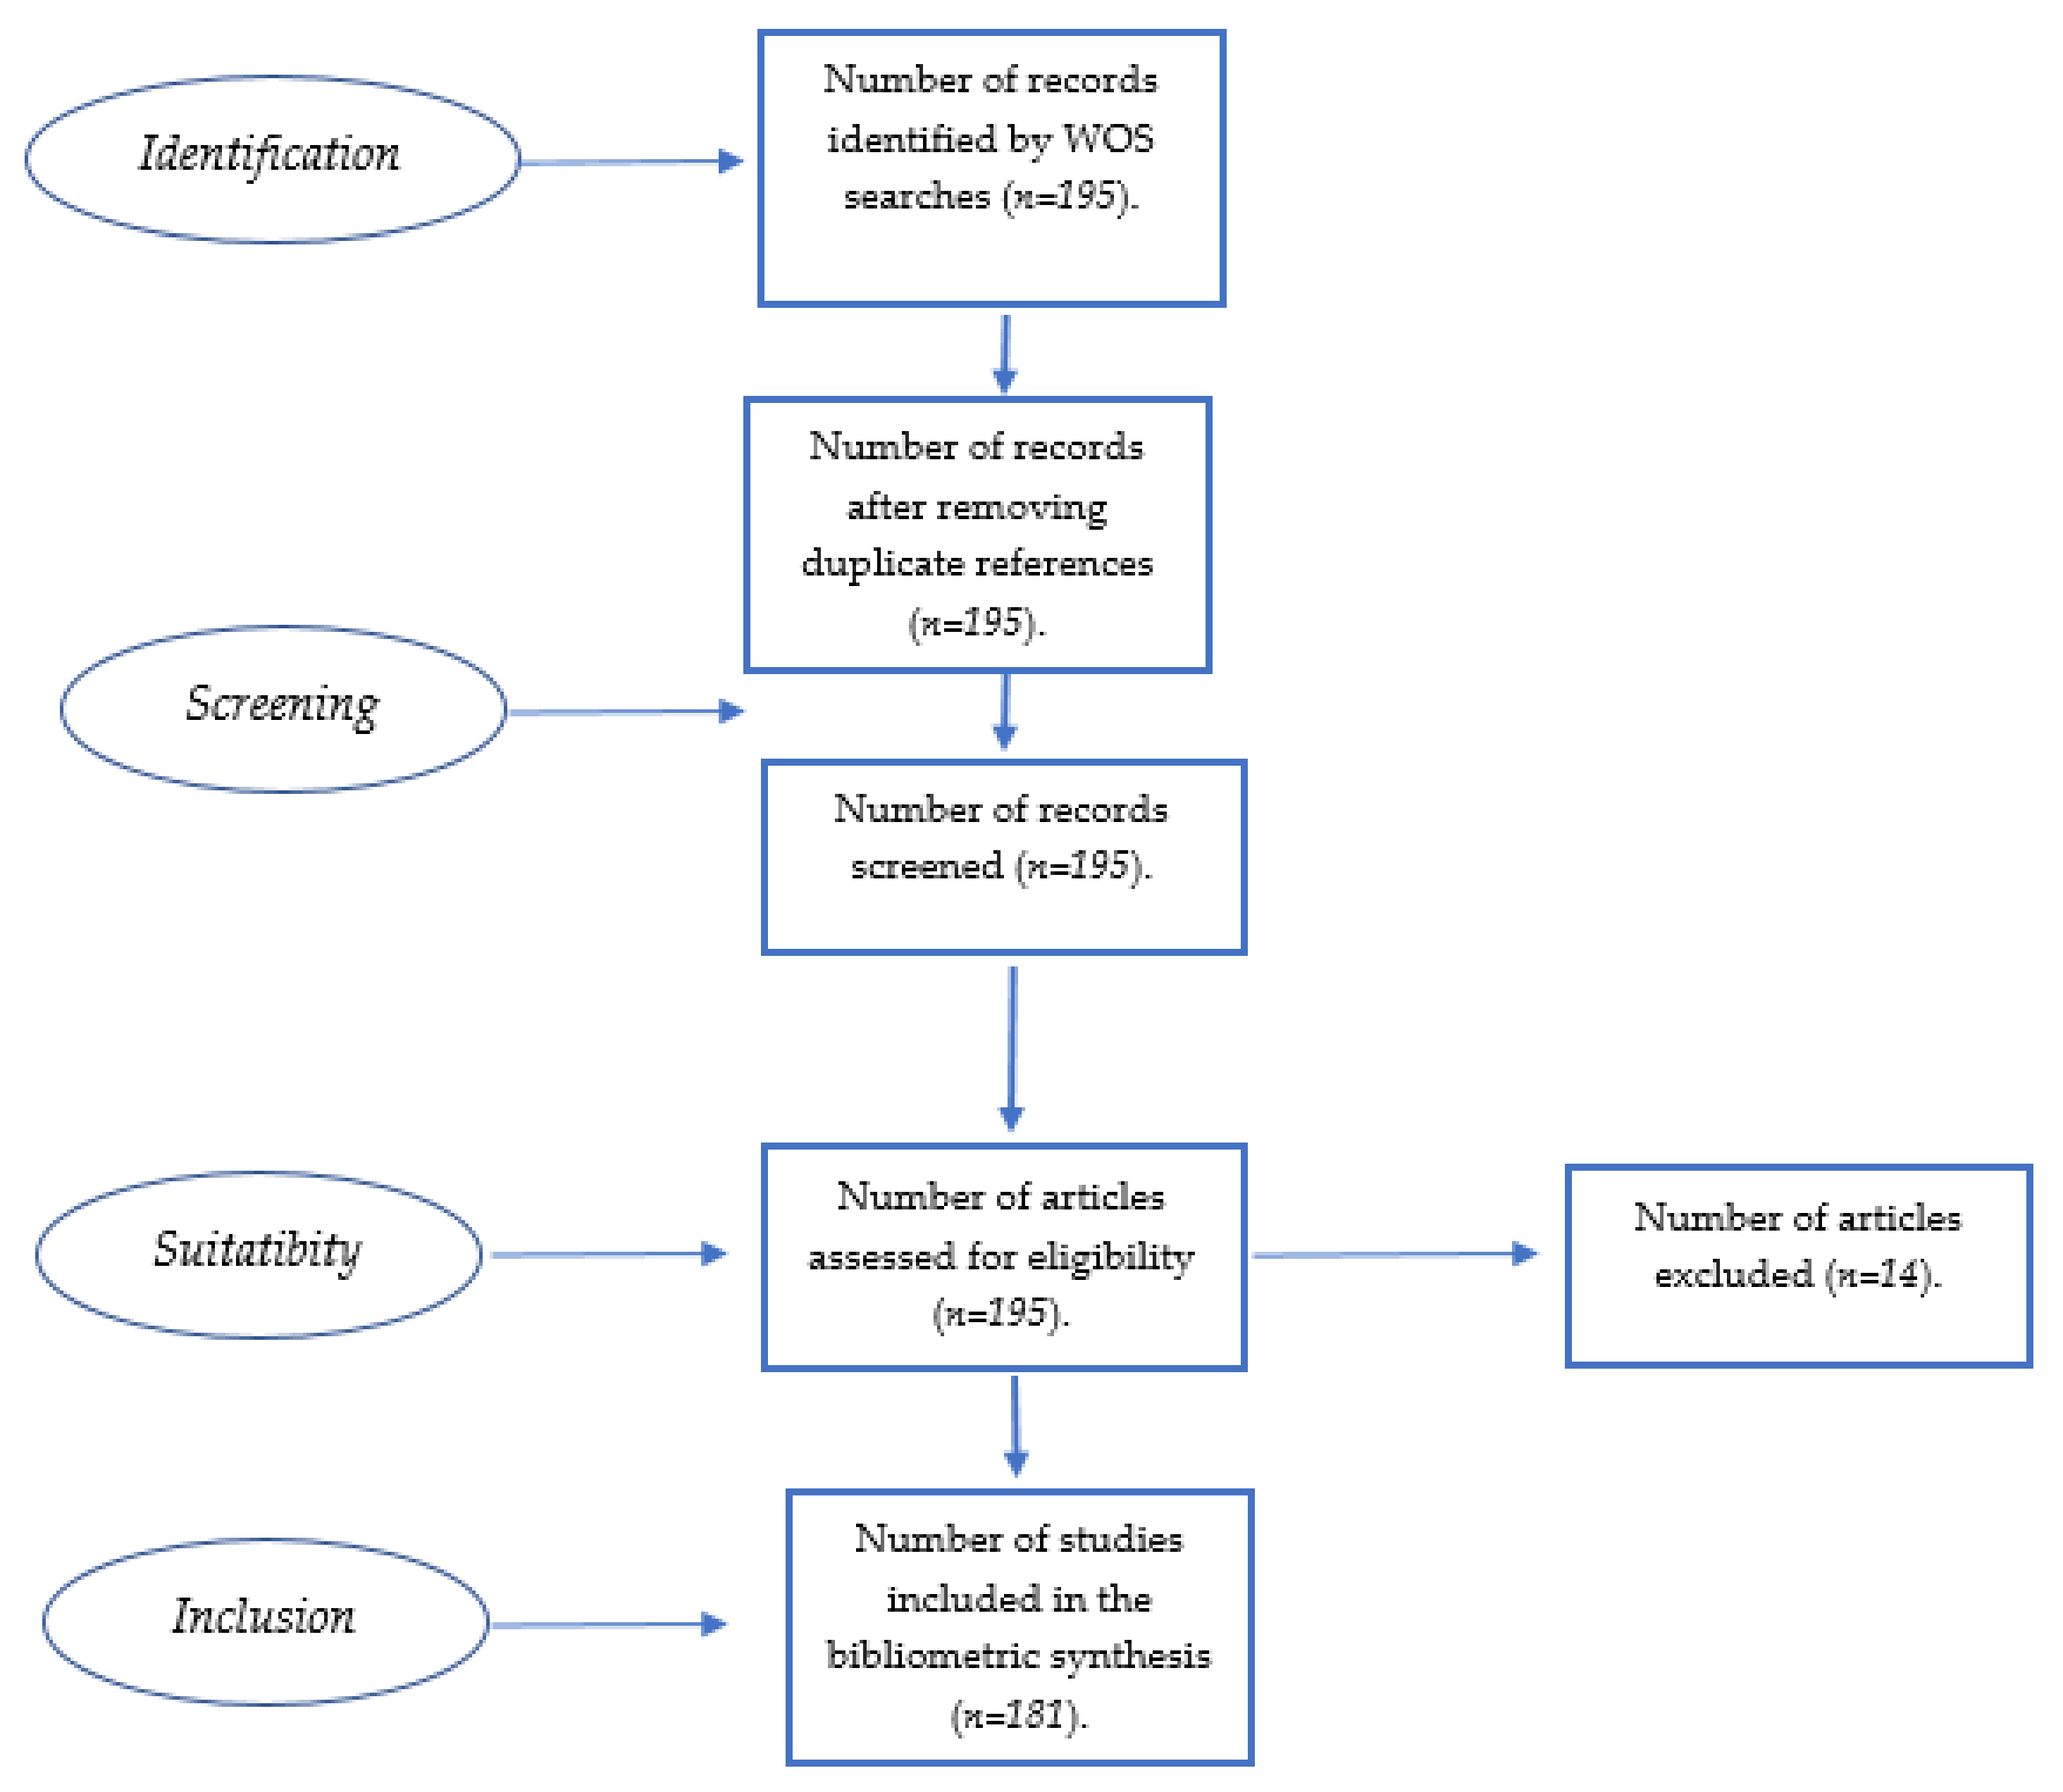
Data Collection and Methology
3. Results
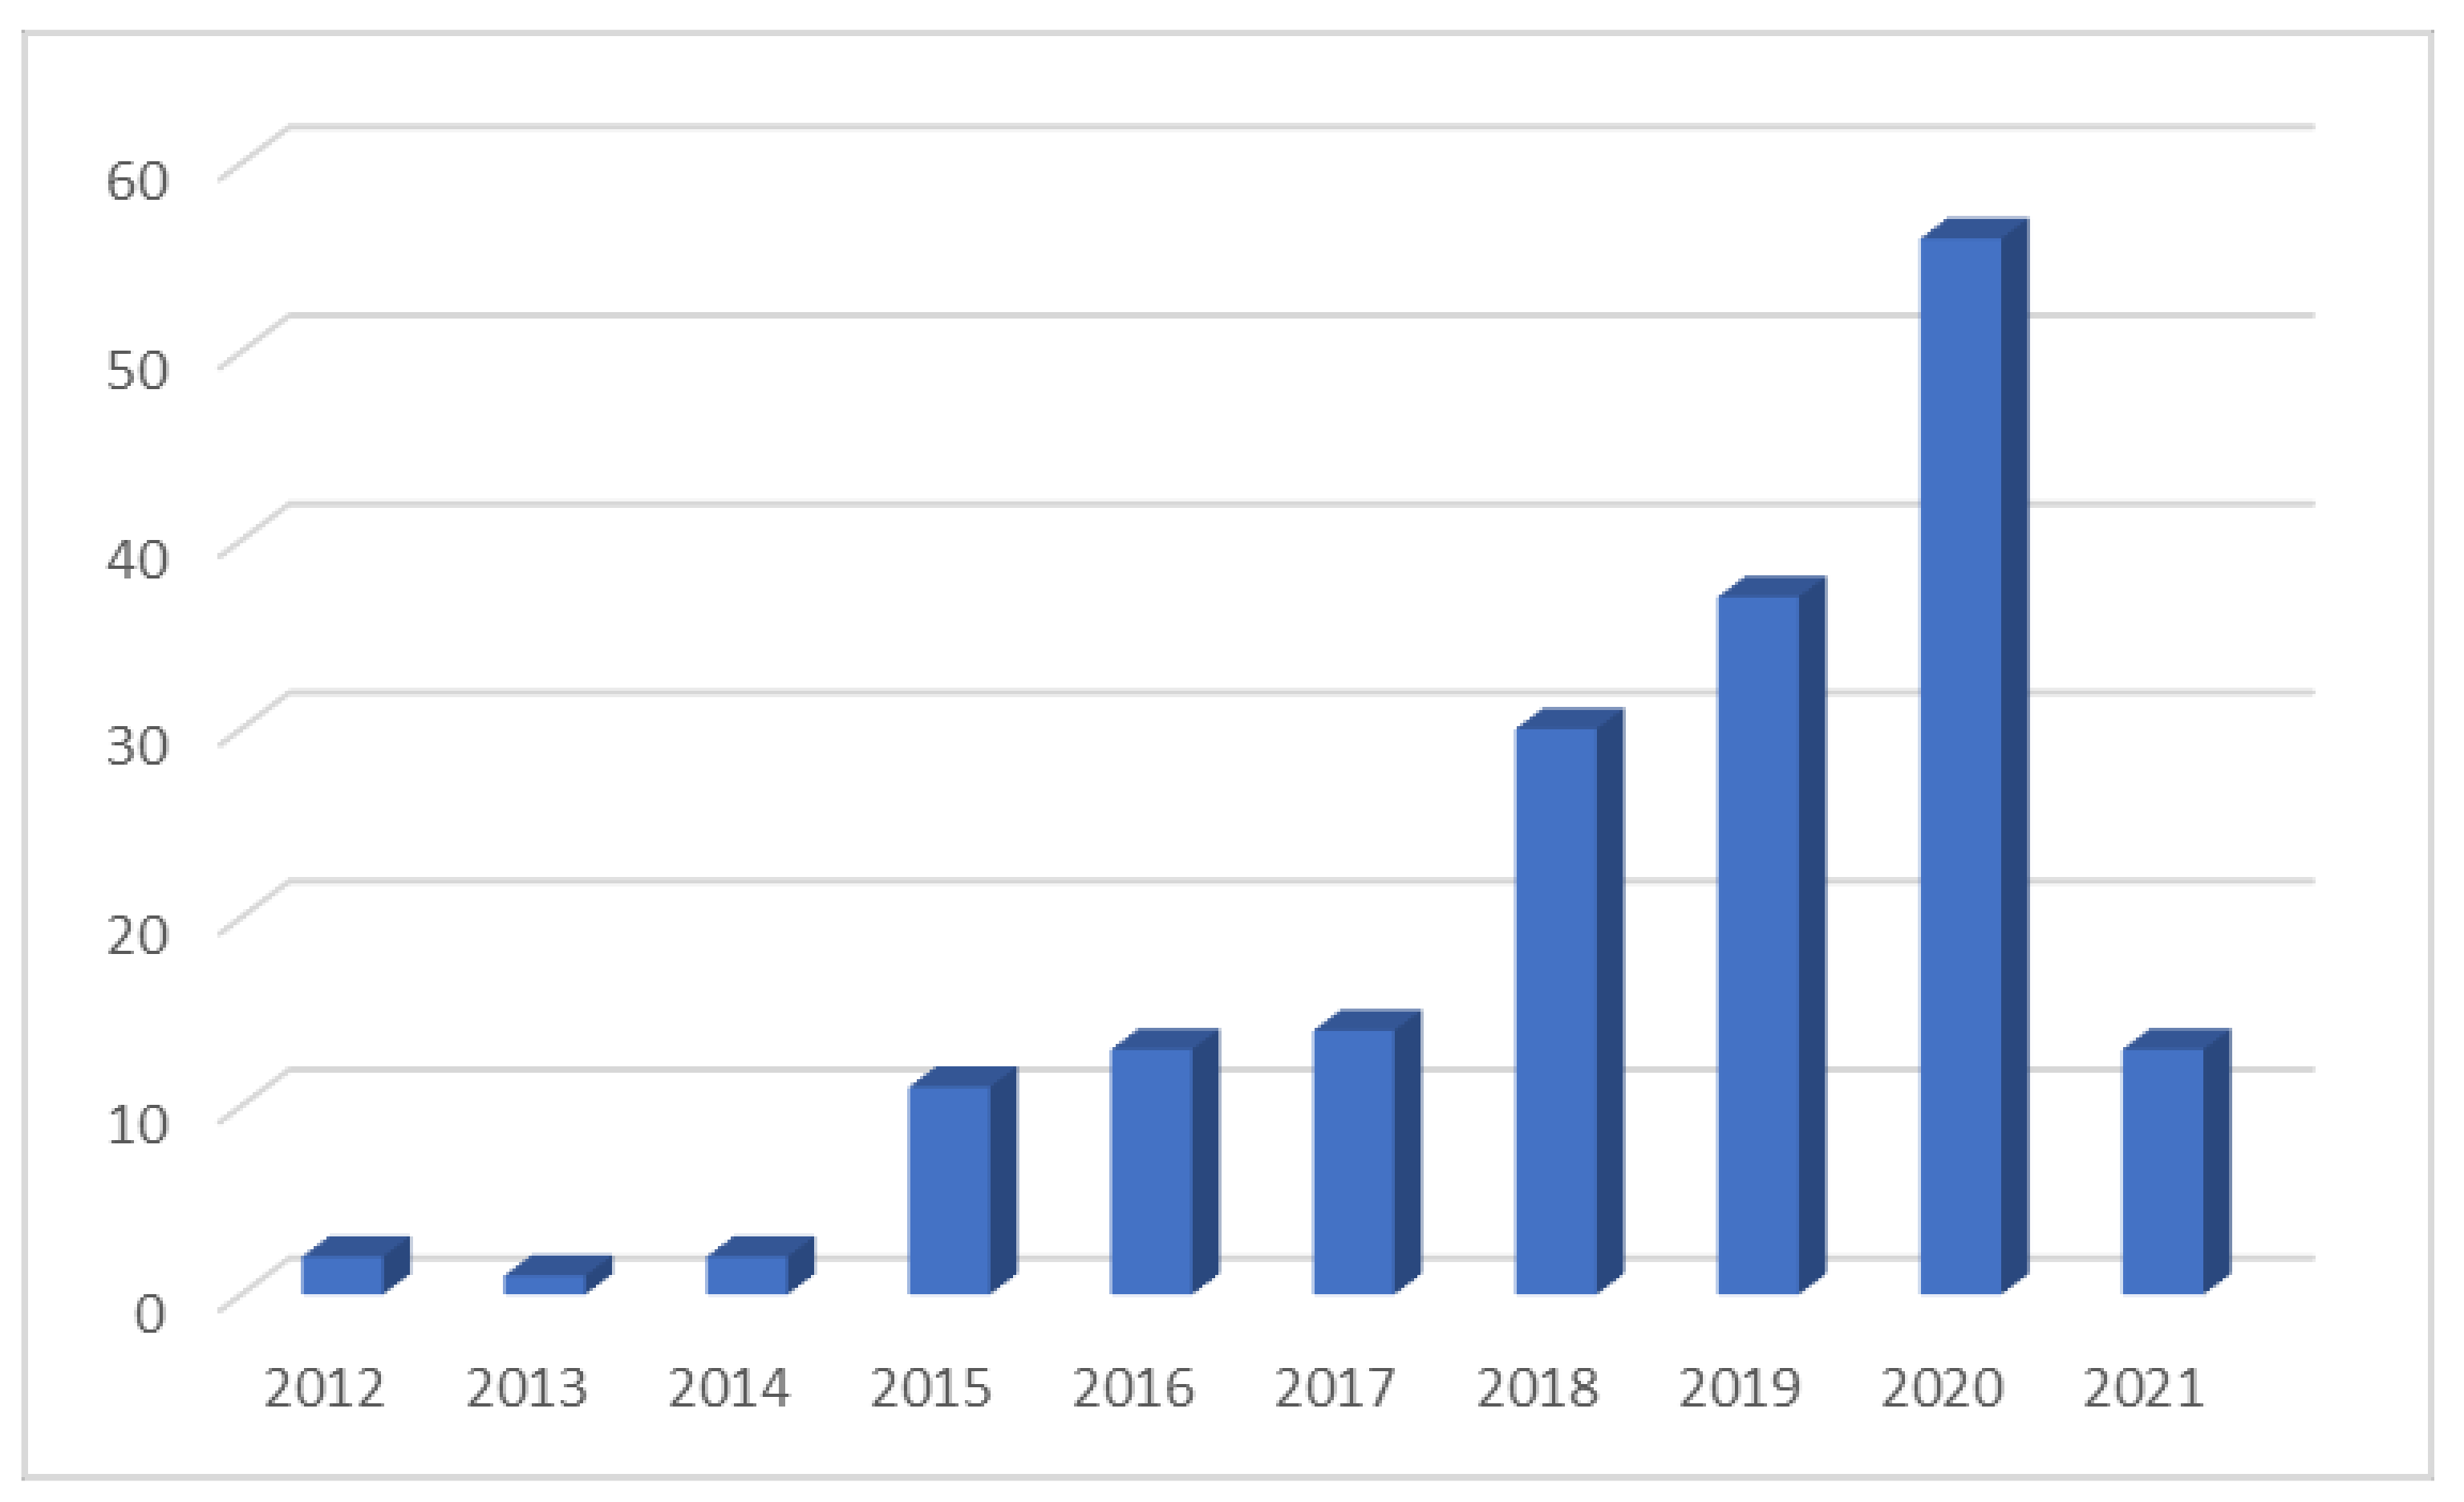
3.1. Evolution of Keywords
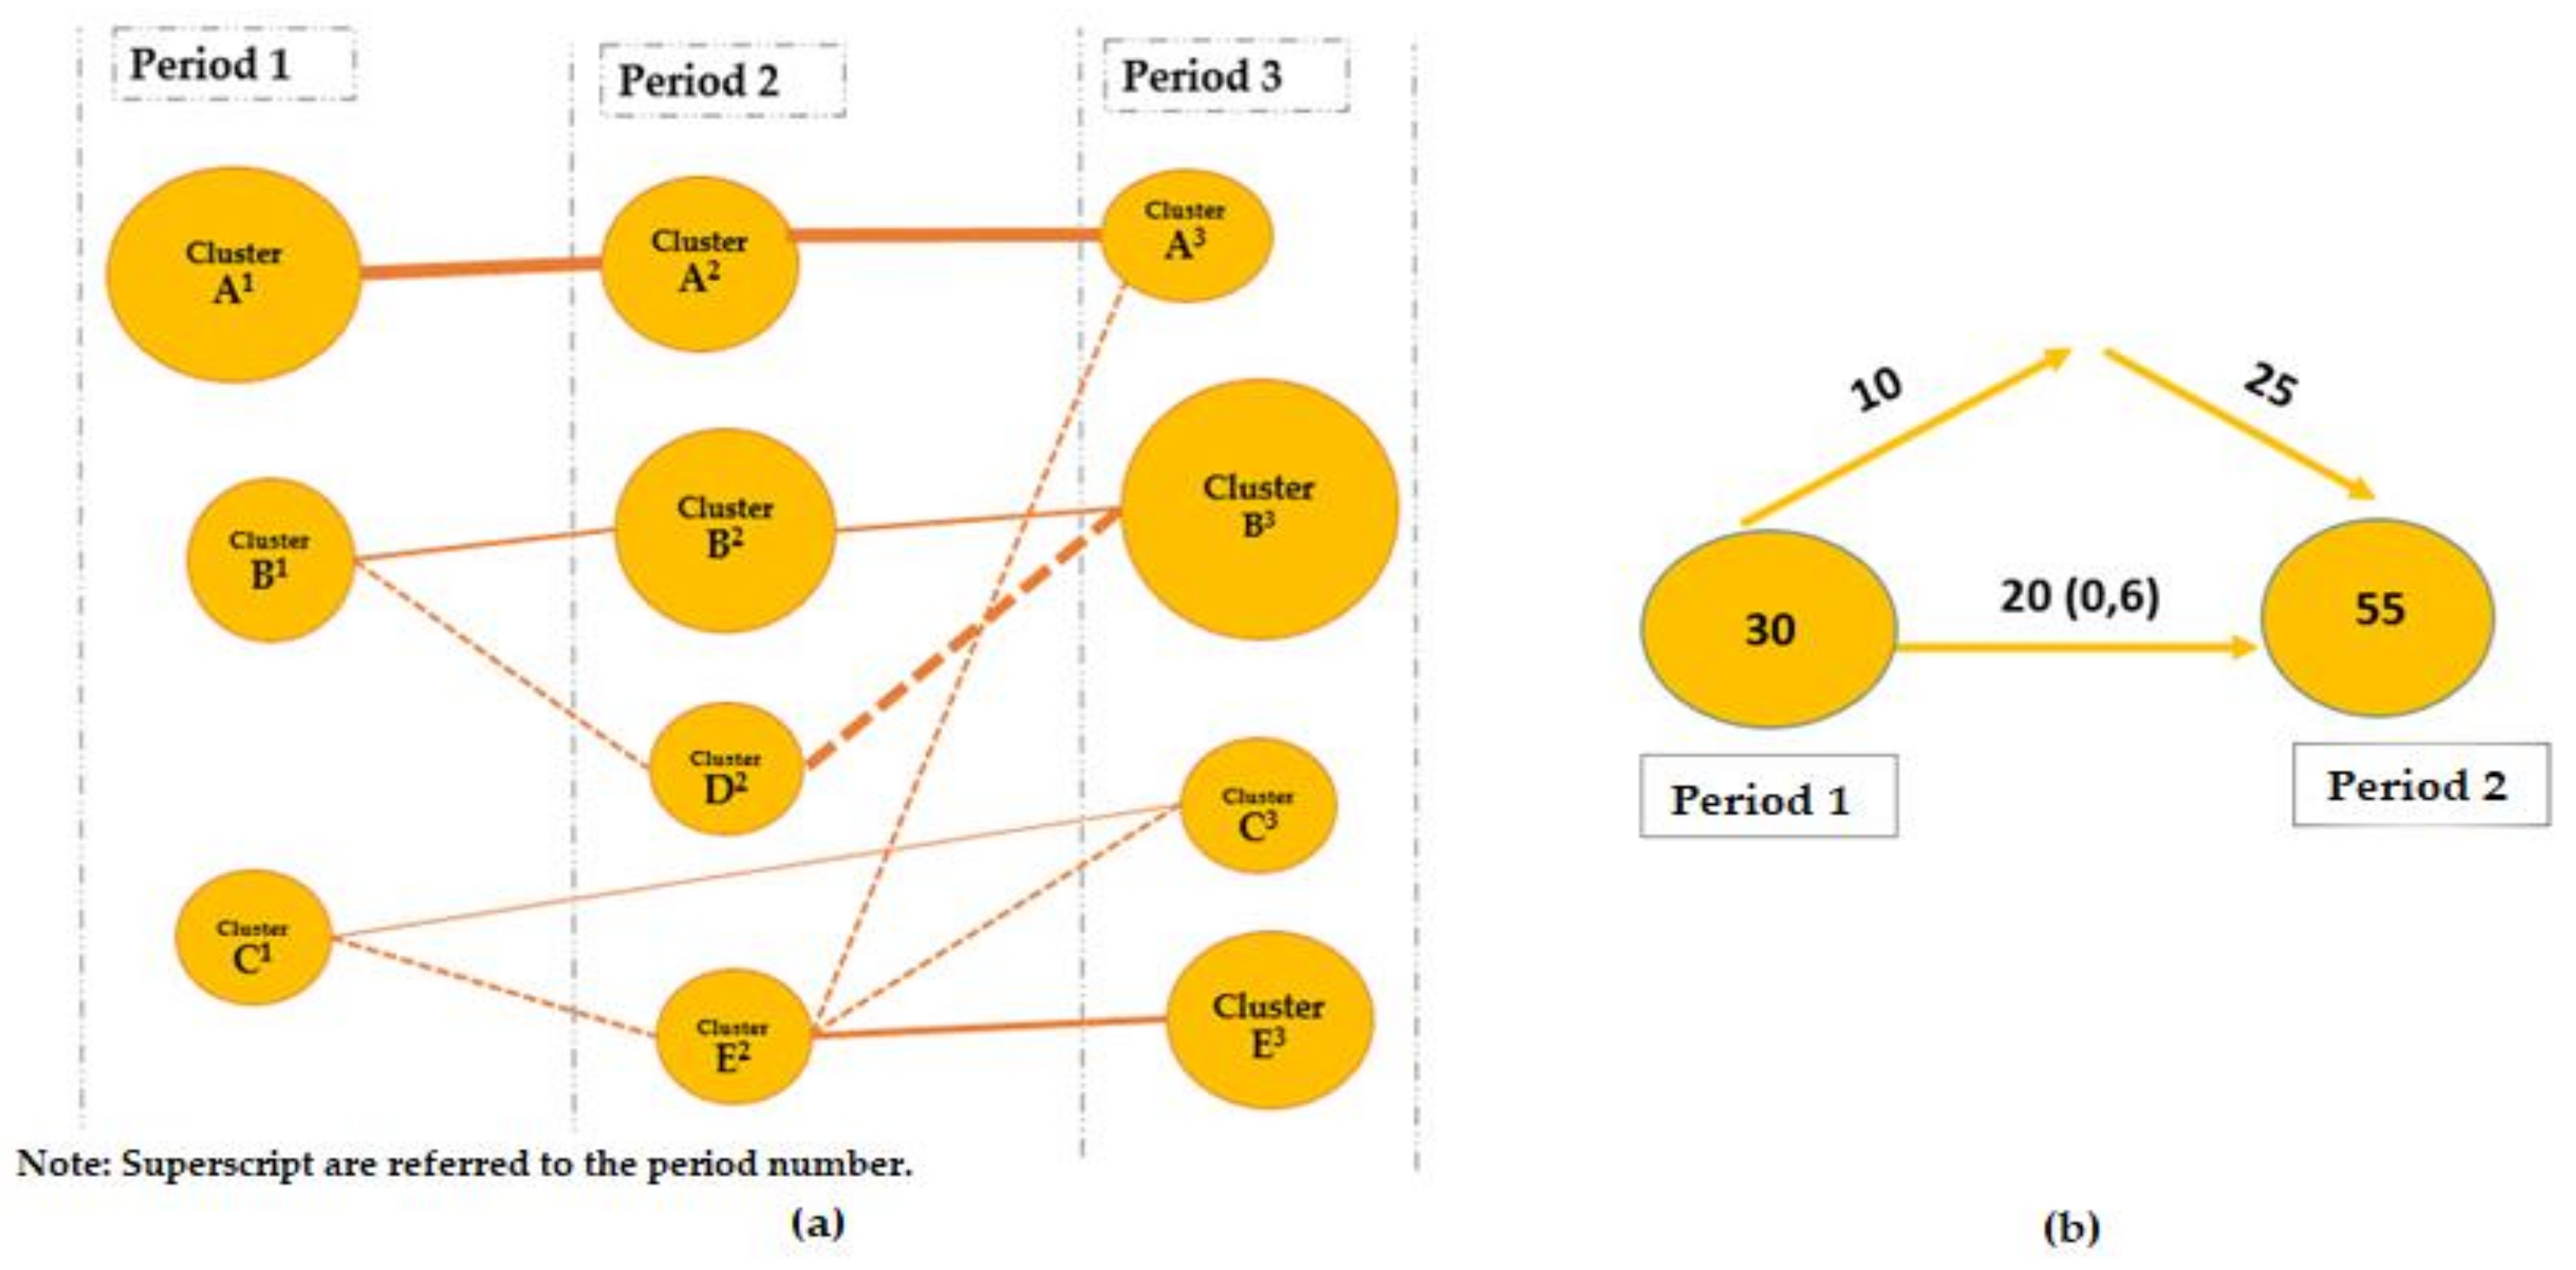
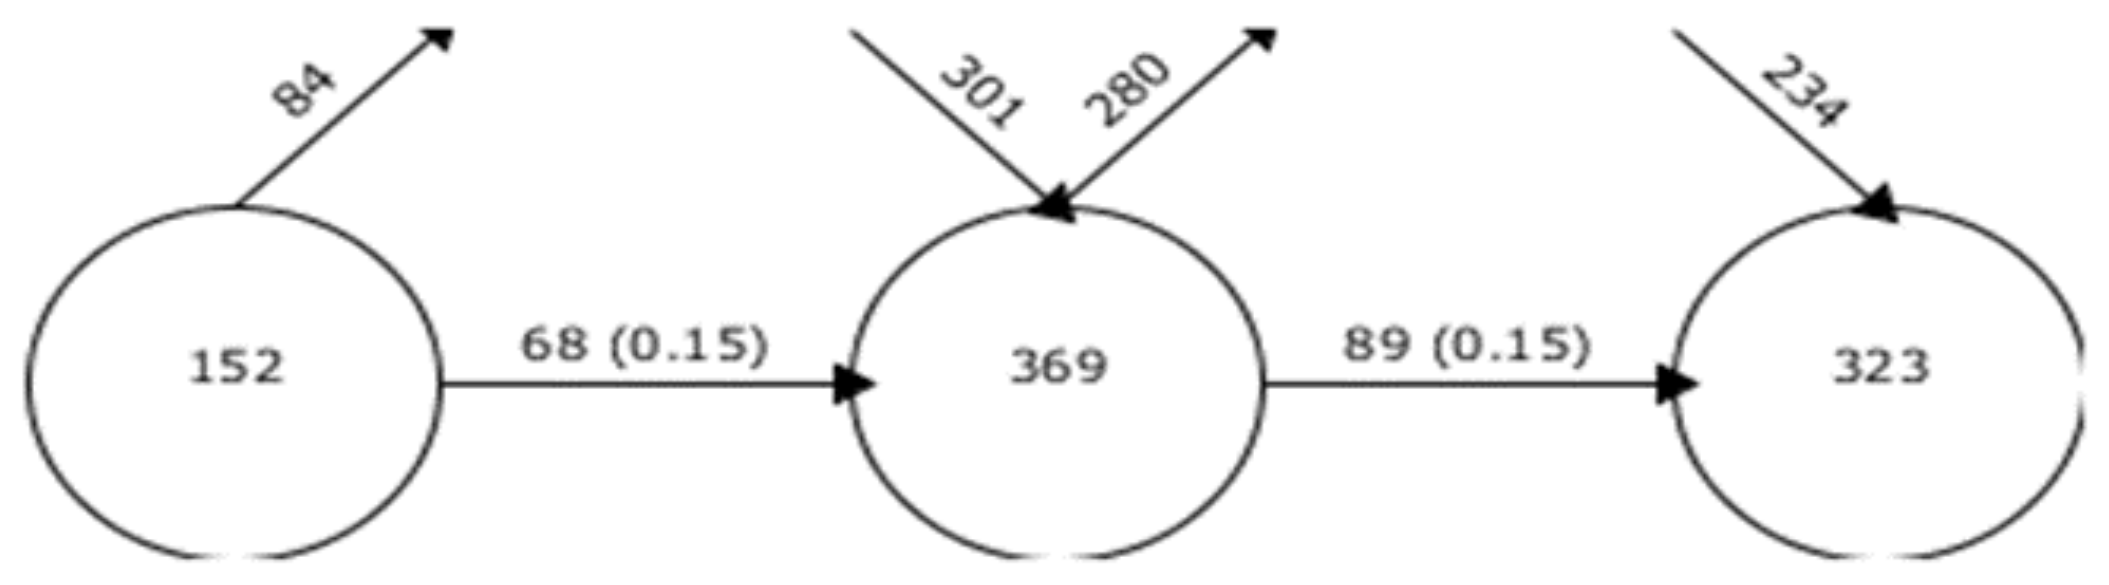
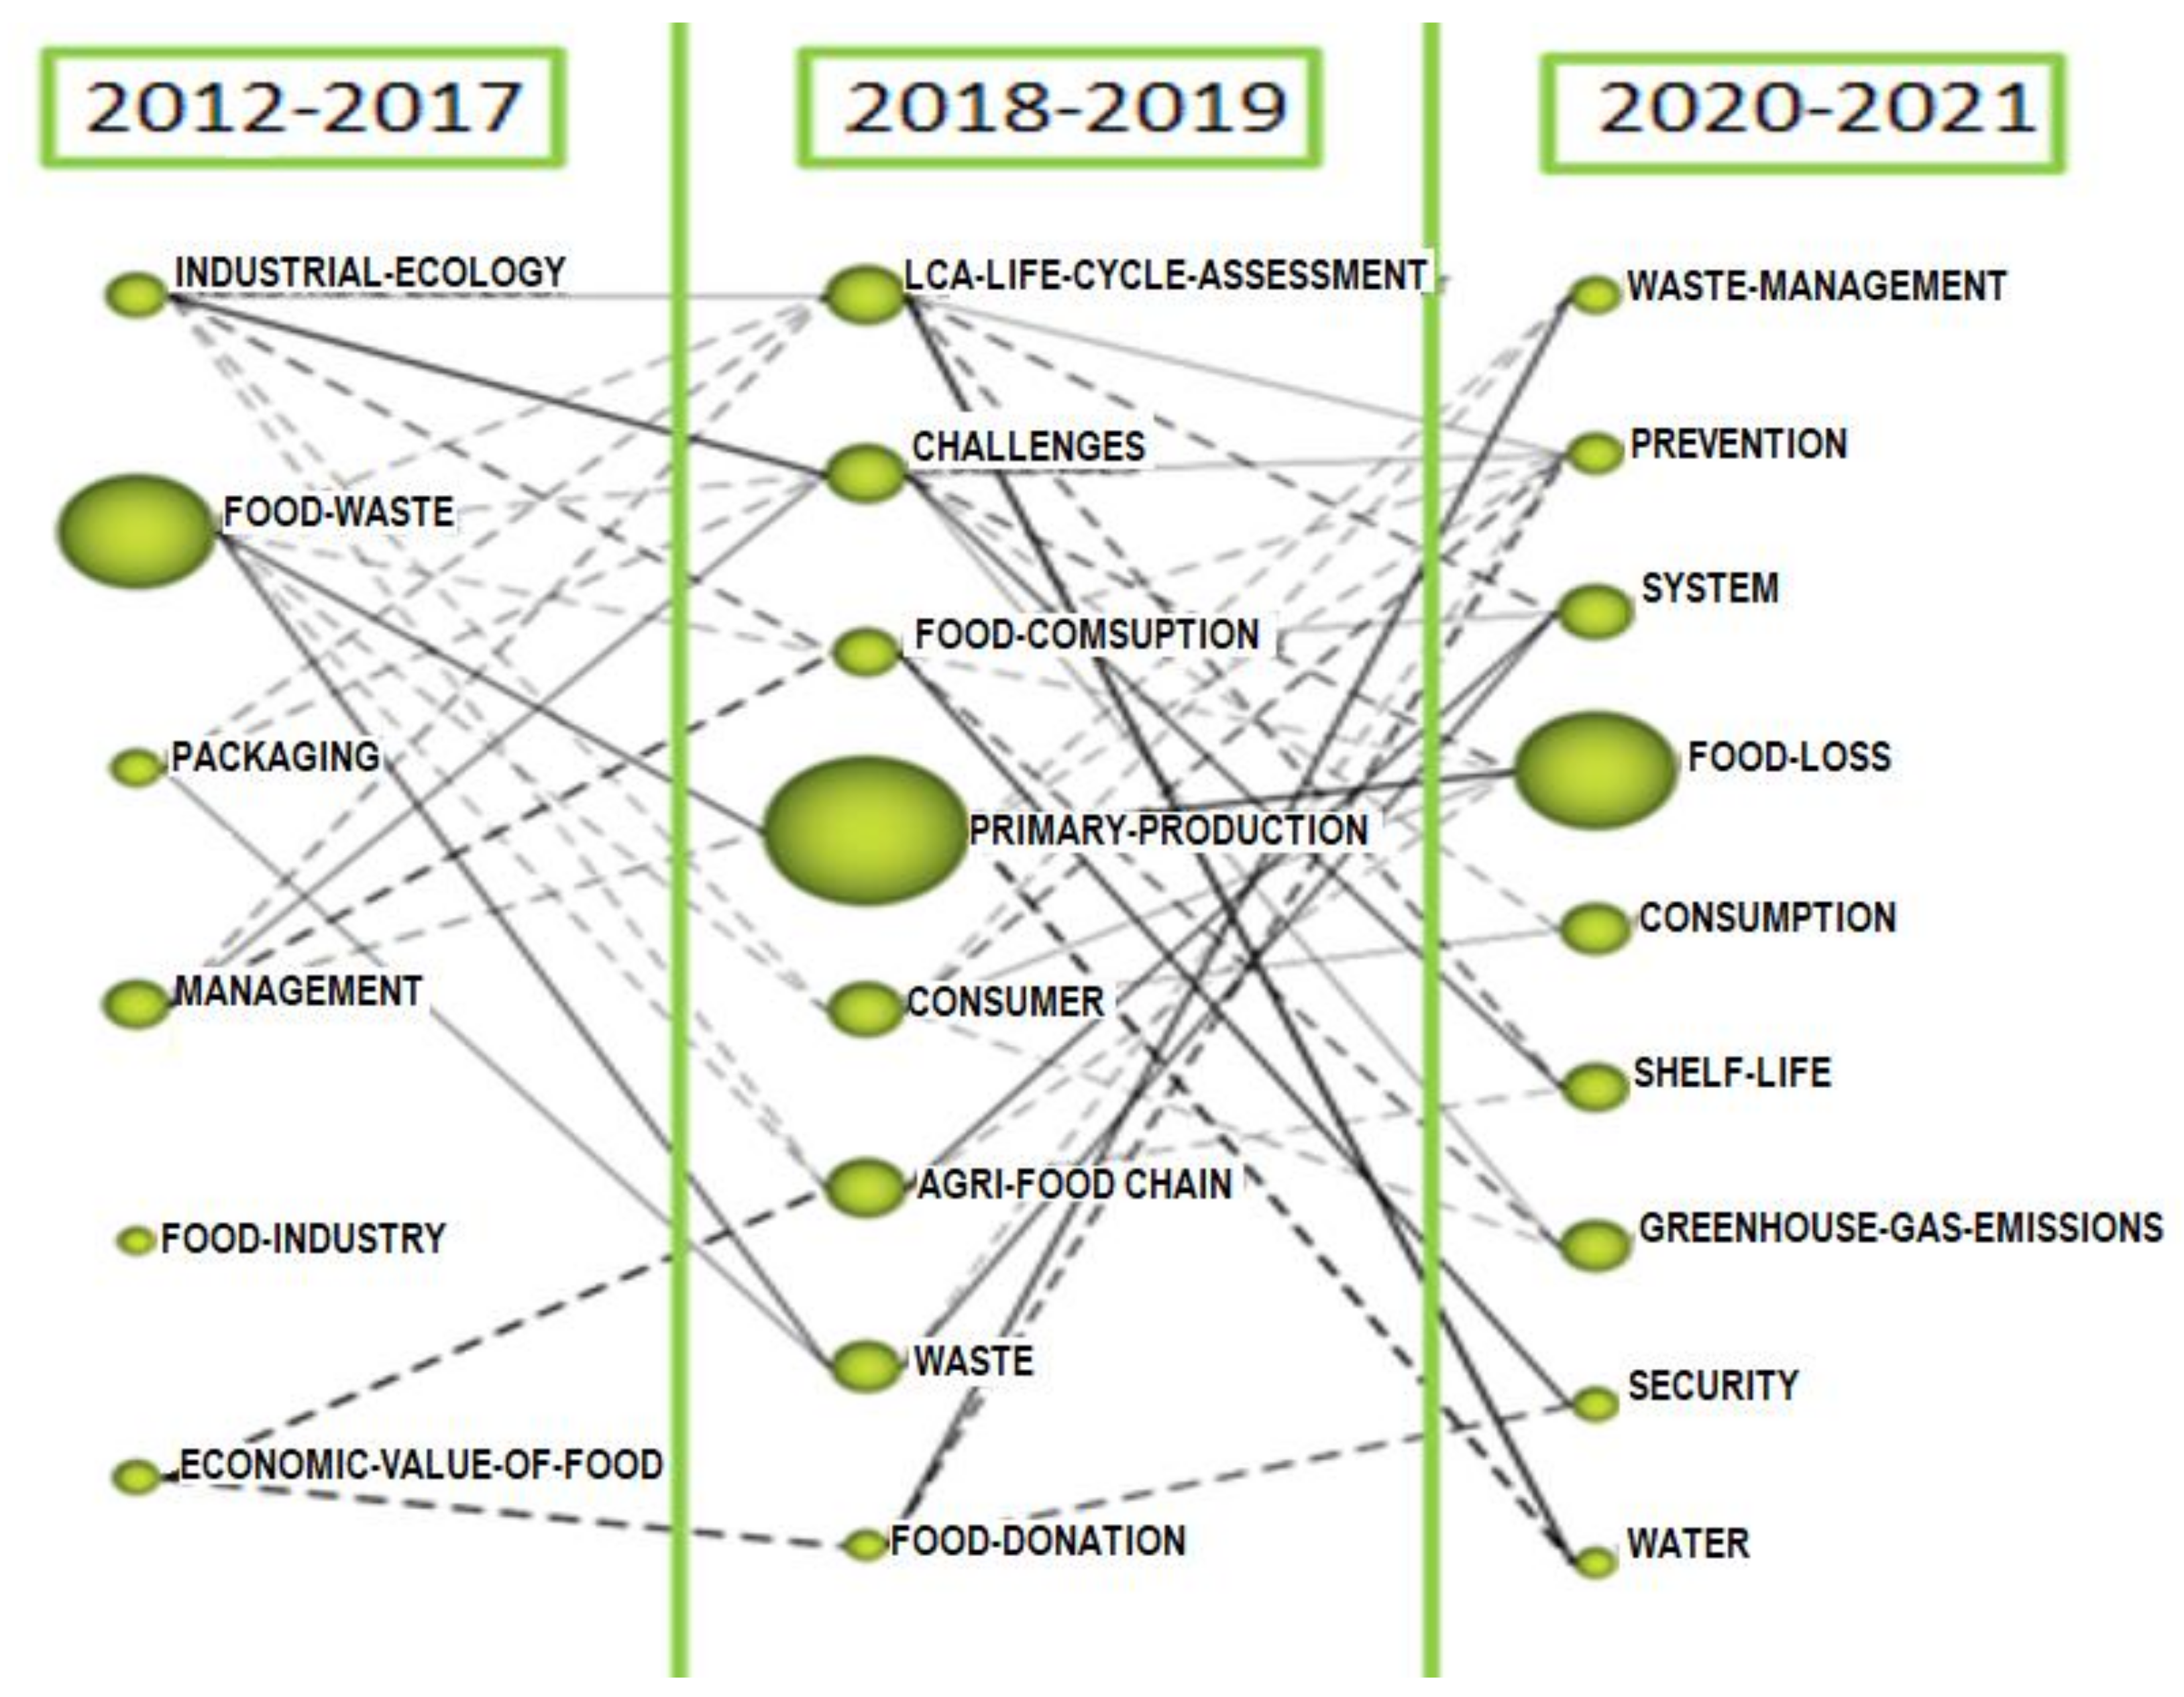
3.2. Thematic Evolution Map
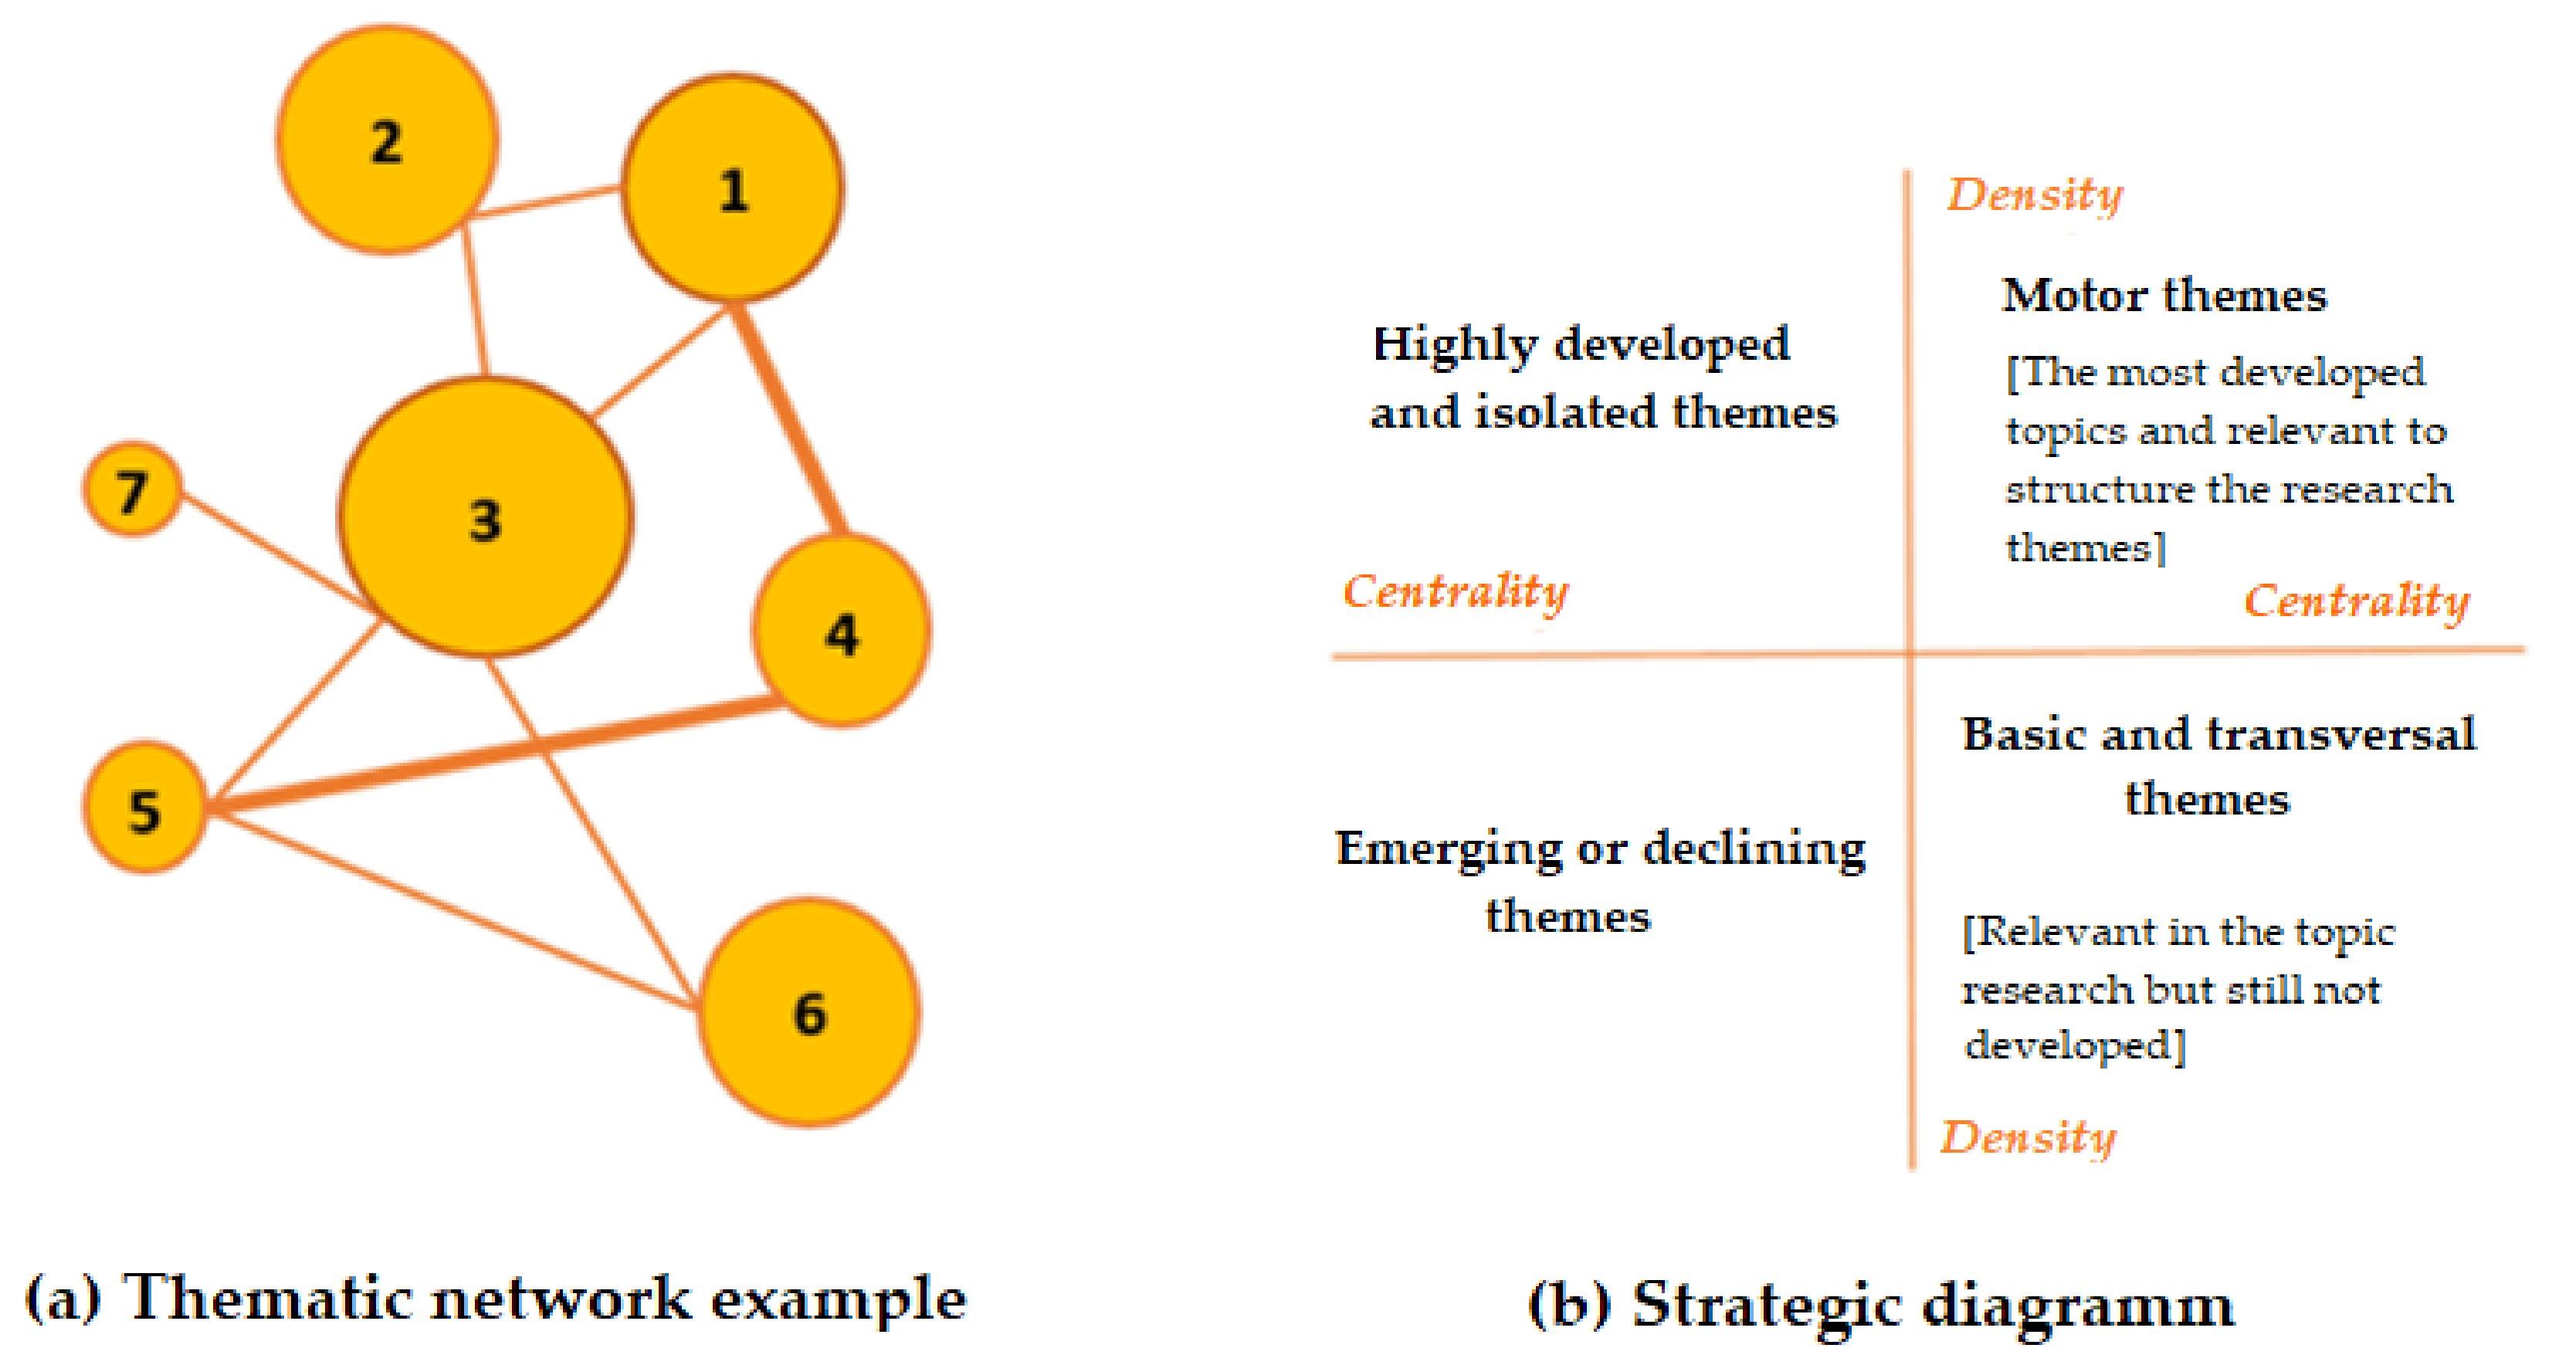
3.3. Strategic Map and Thematic Network
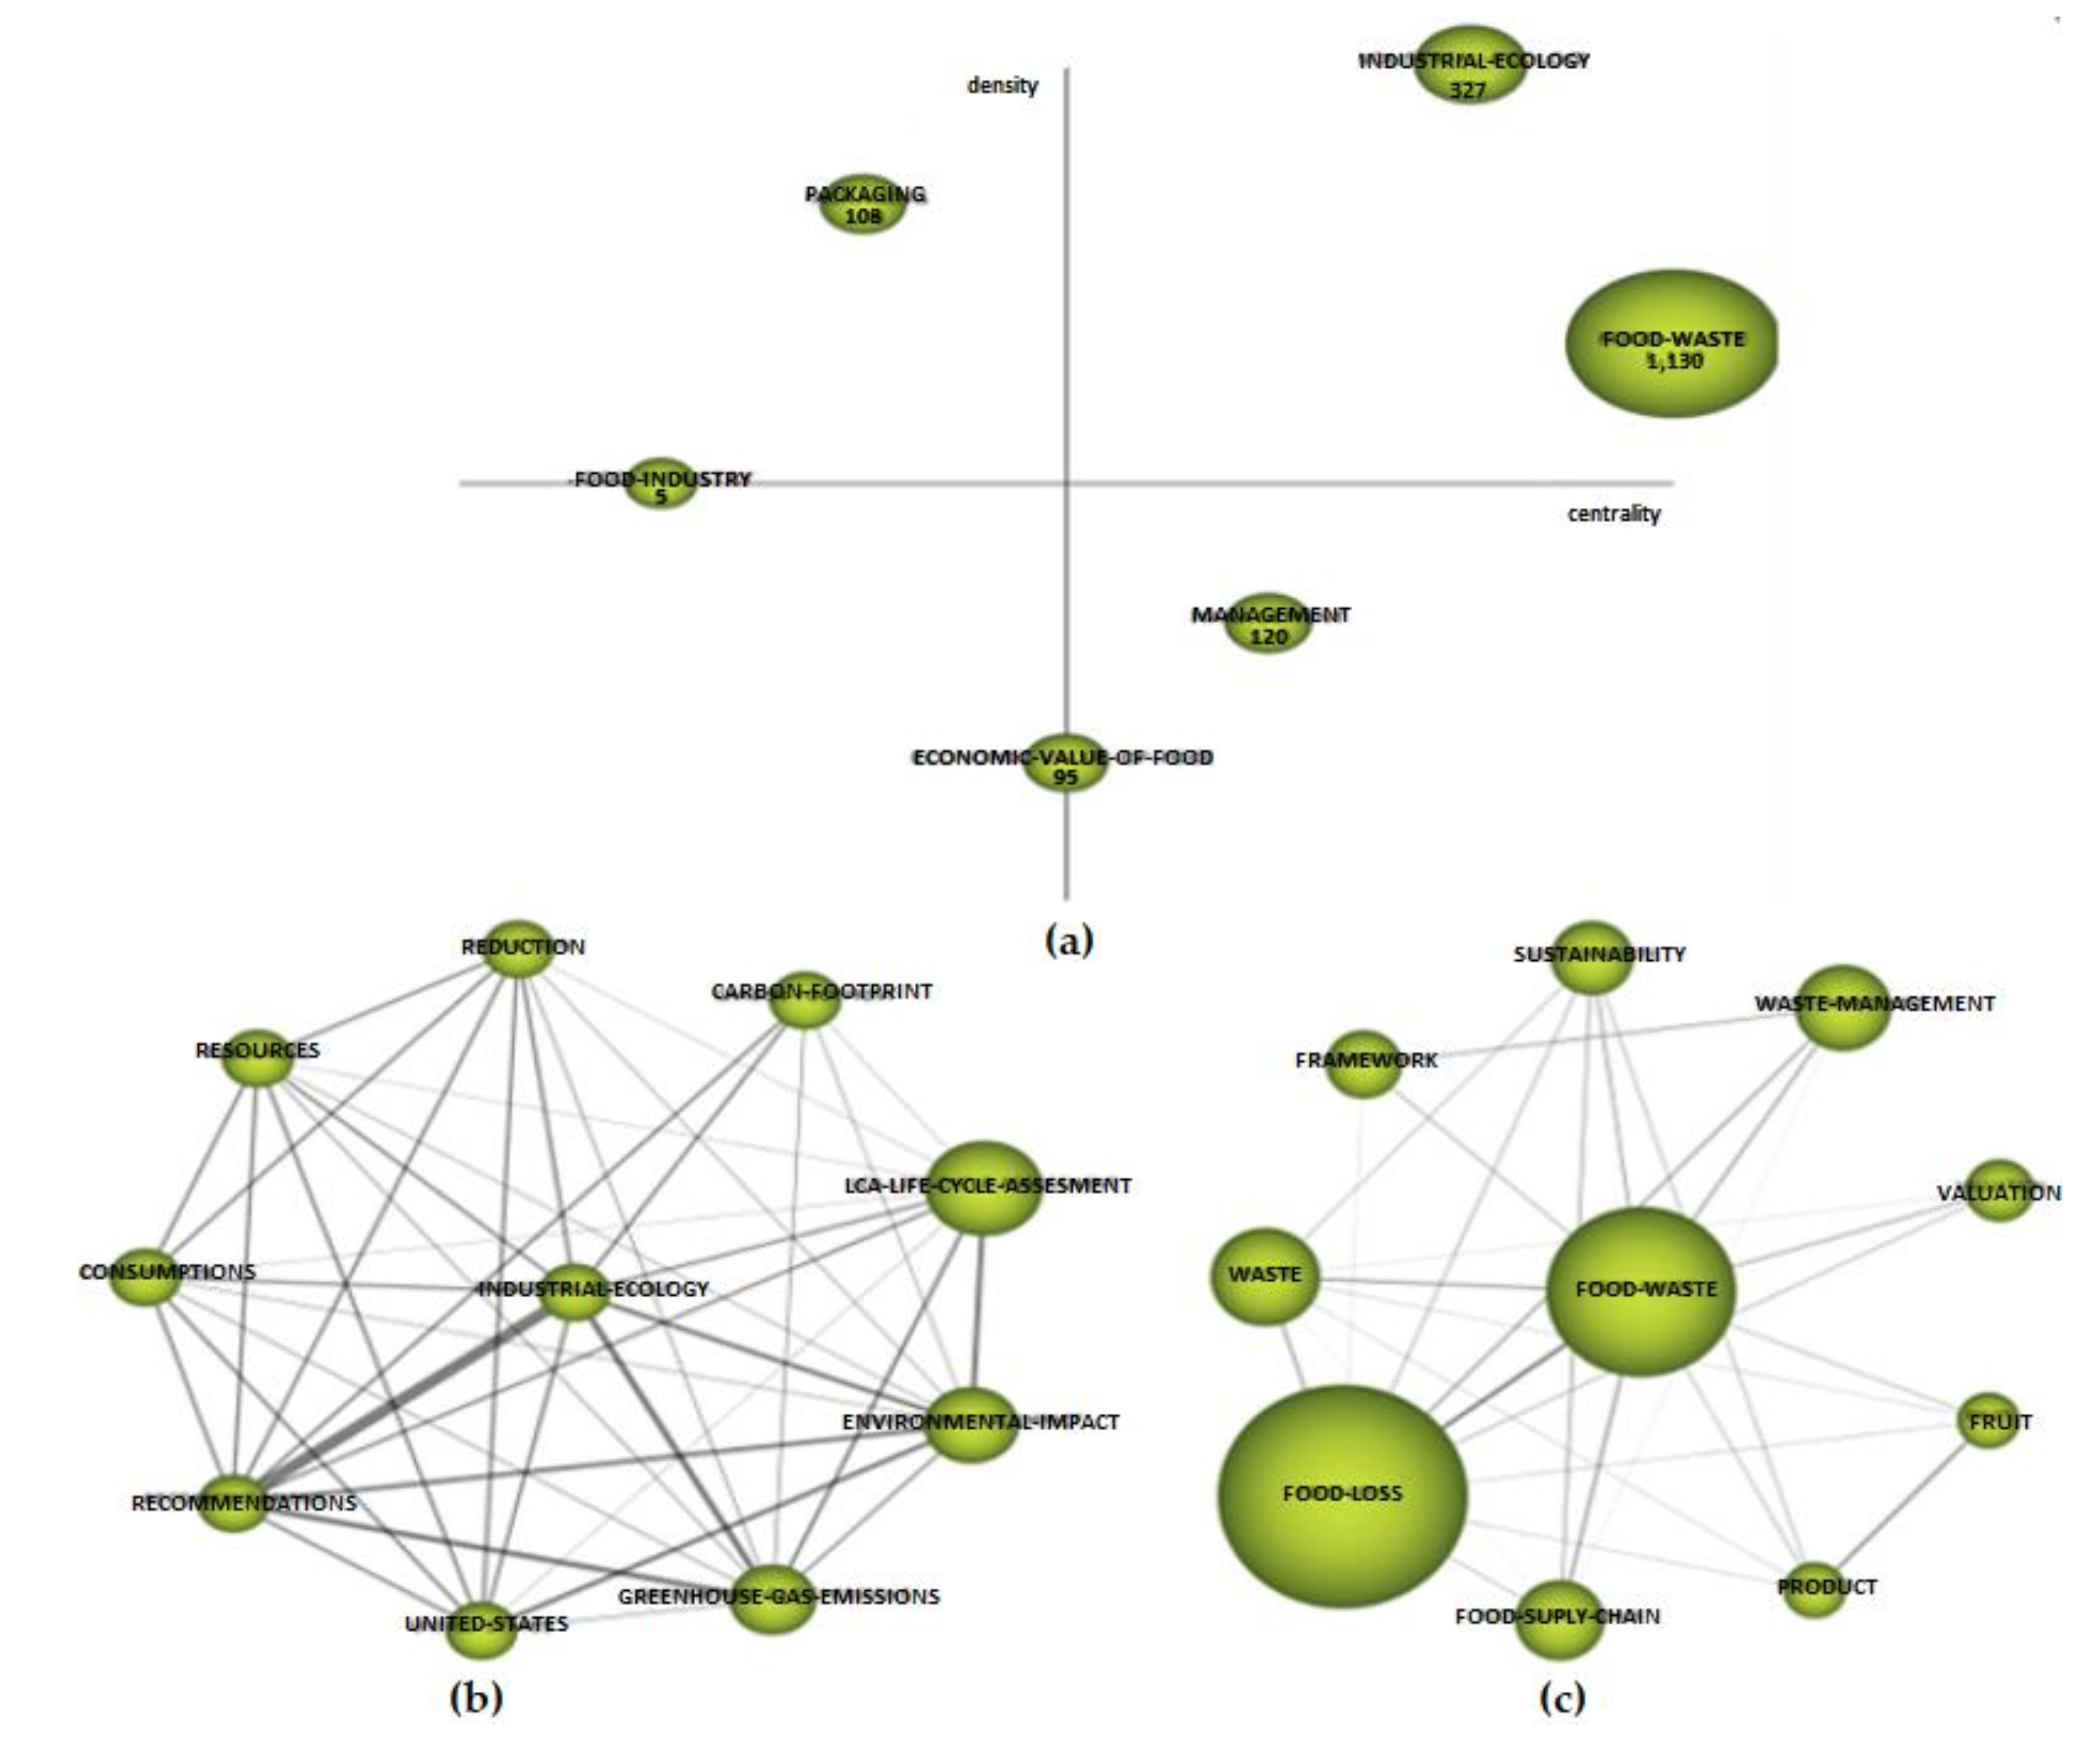
3.3.1. Period 2012–2017
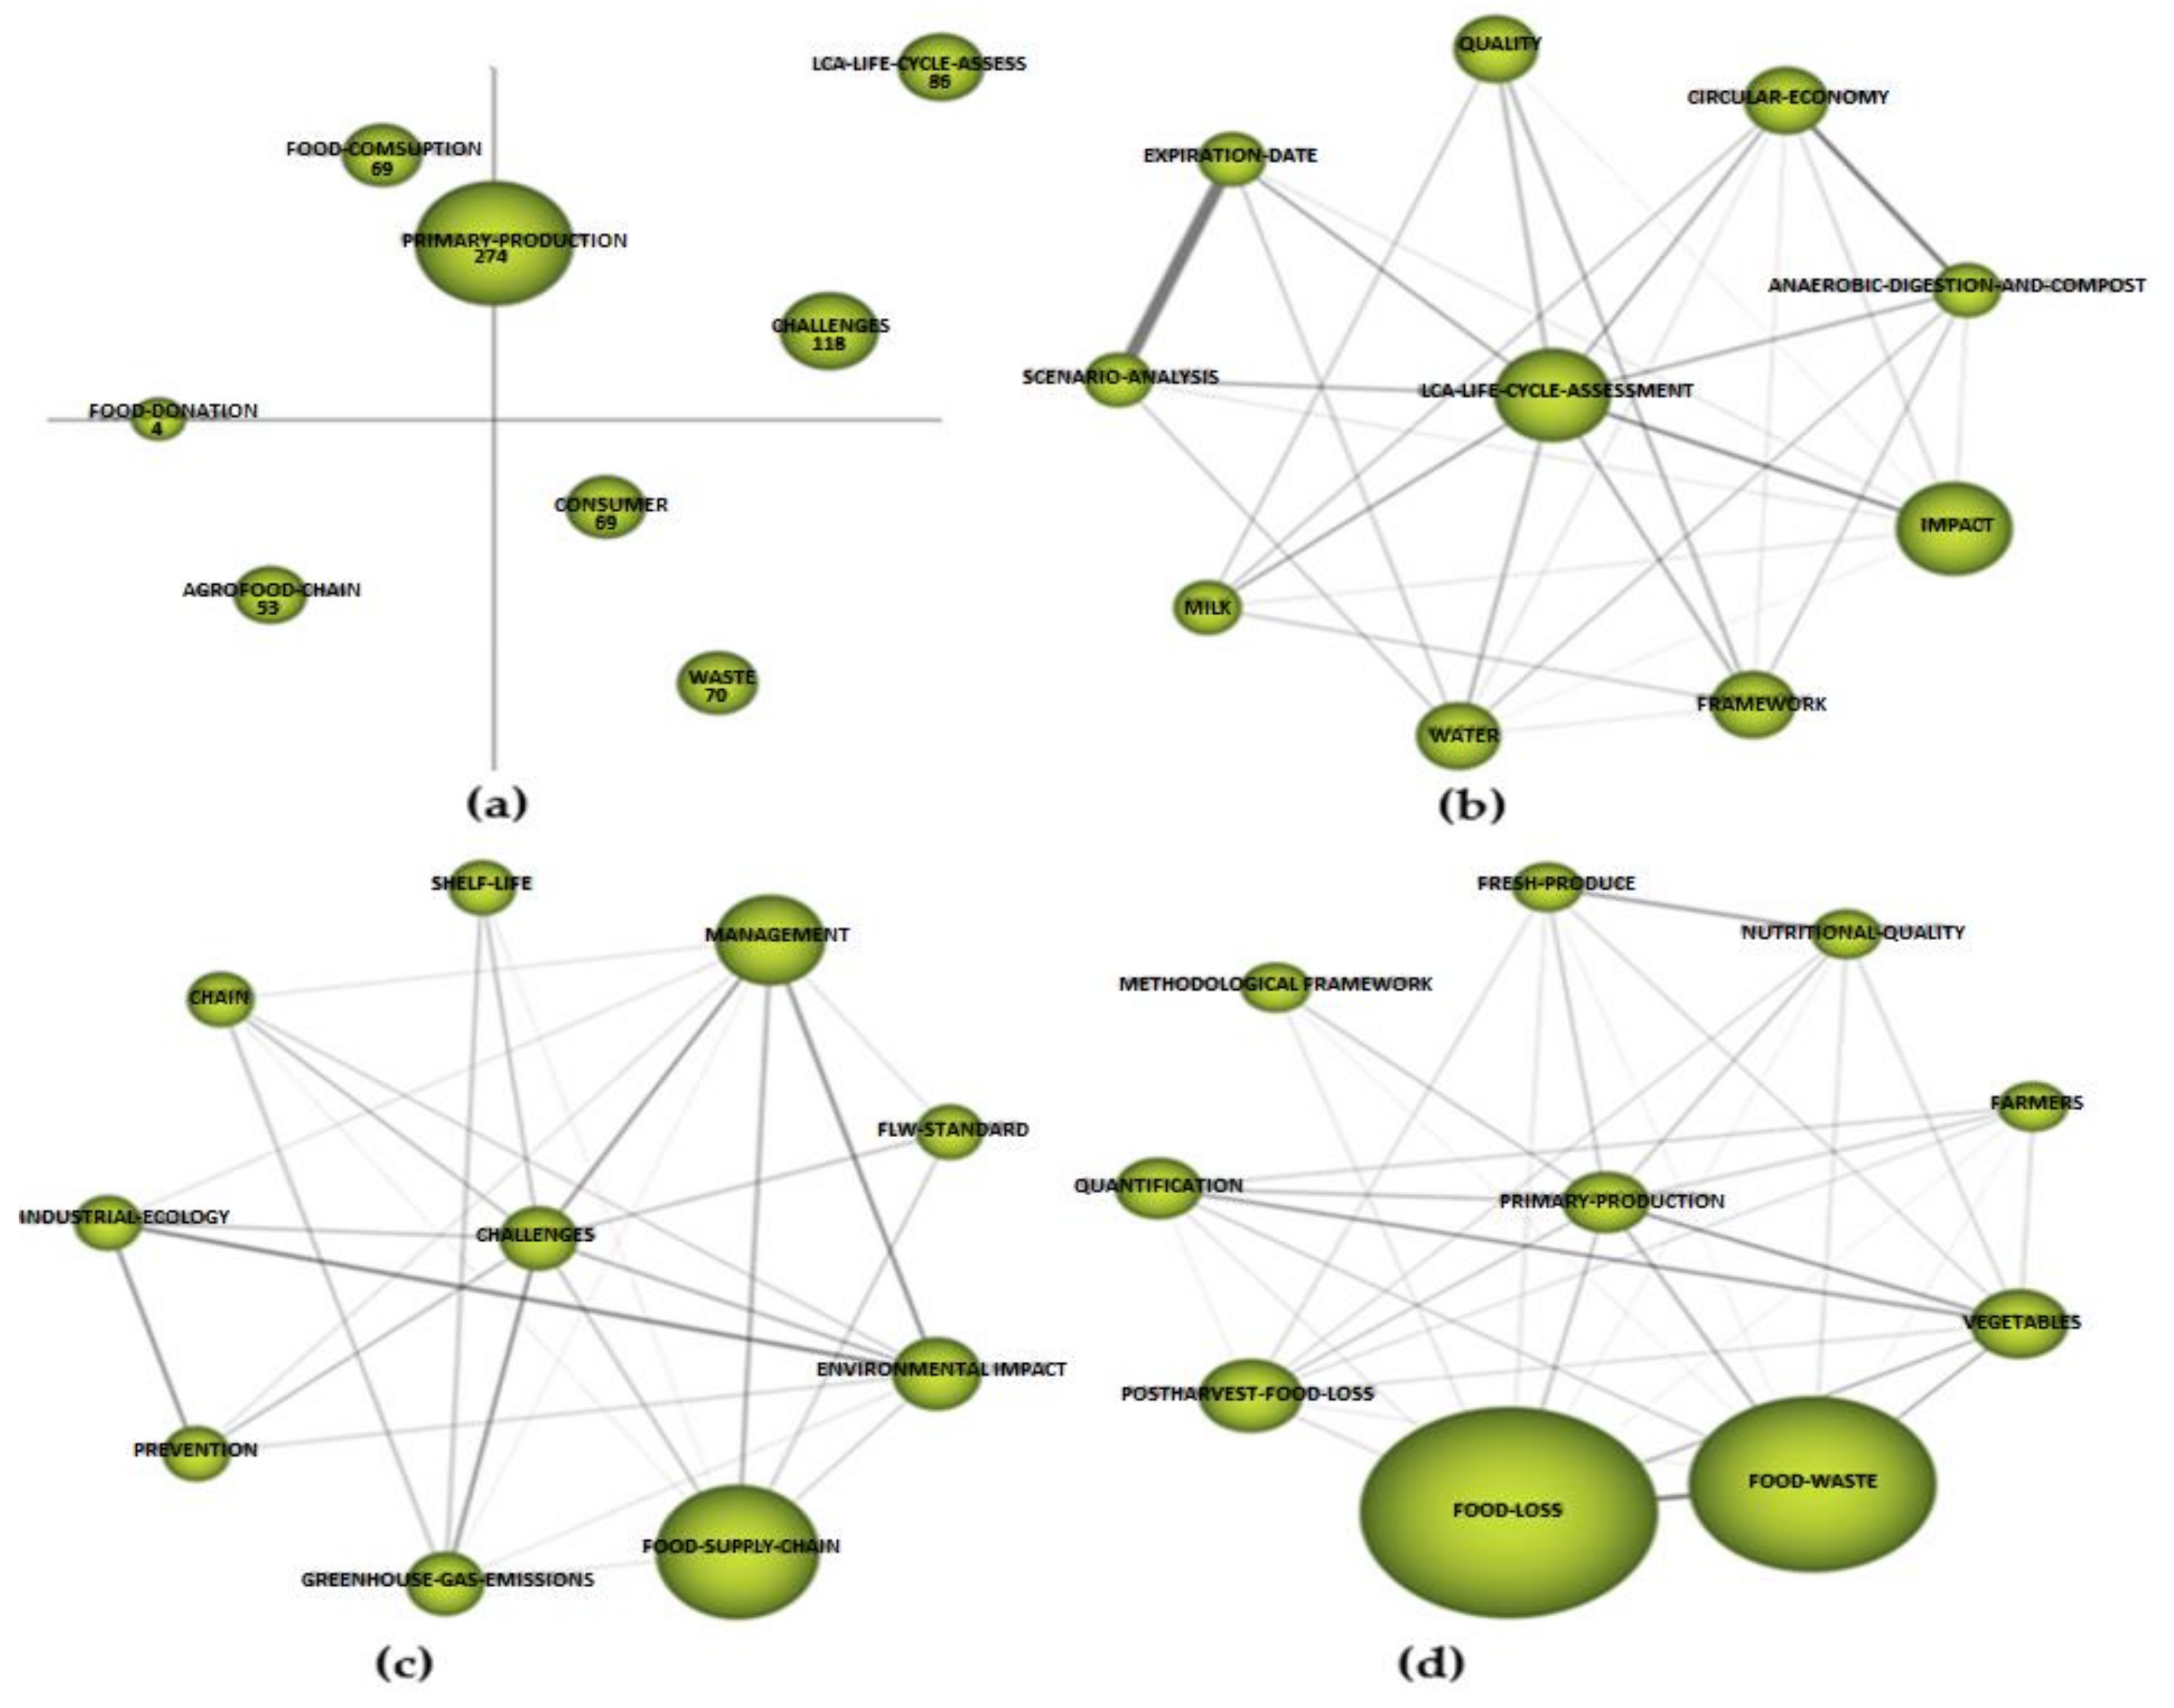
3.3.2. Period 2018–2019
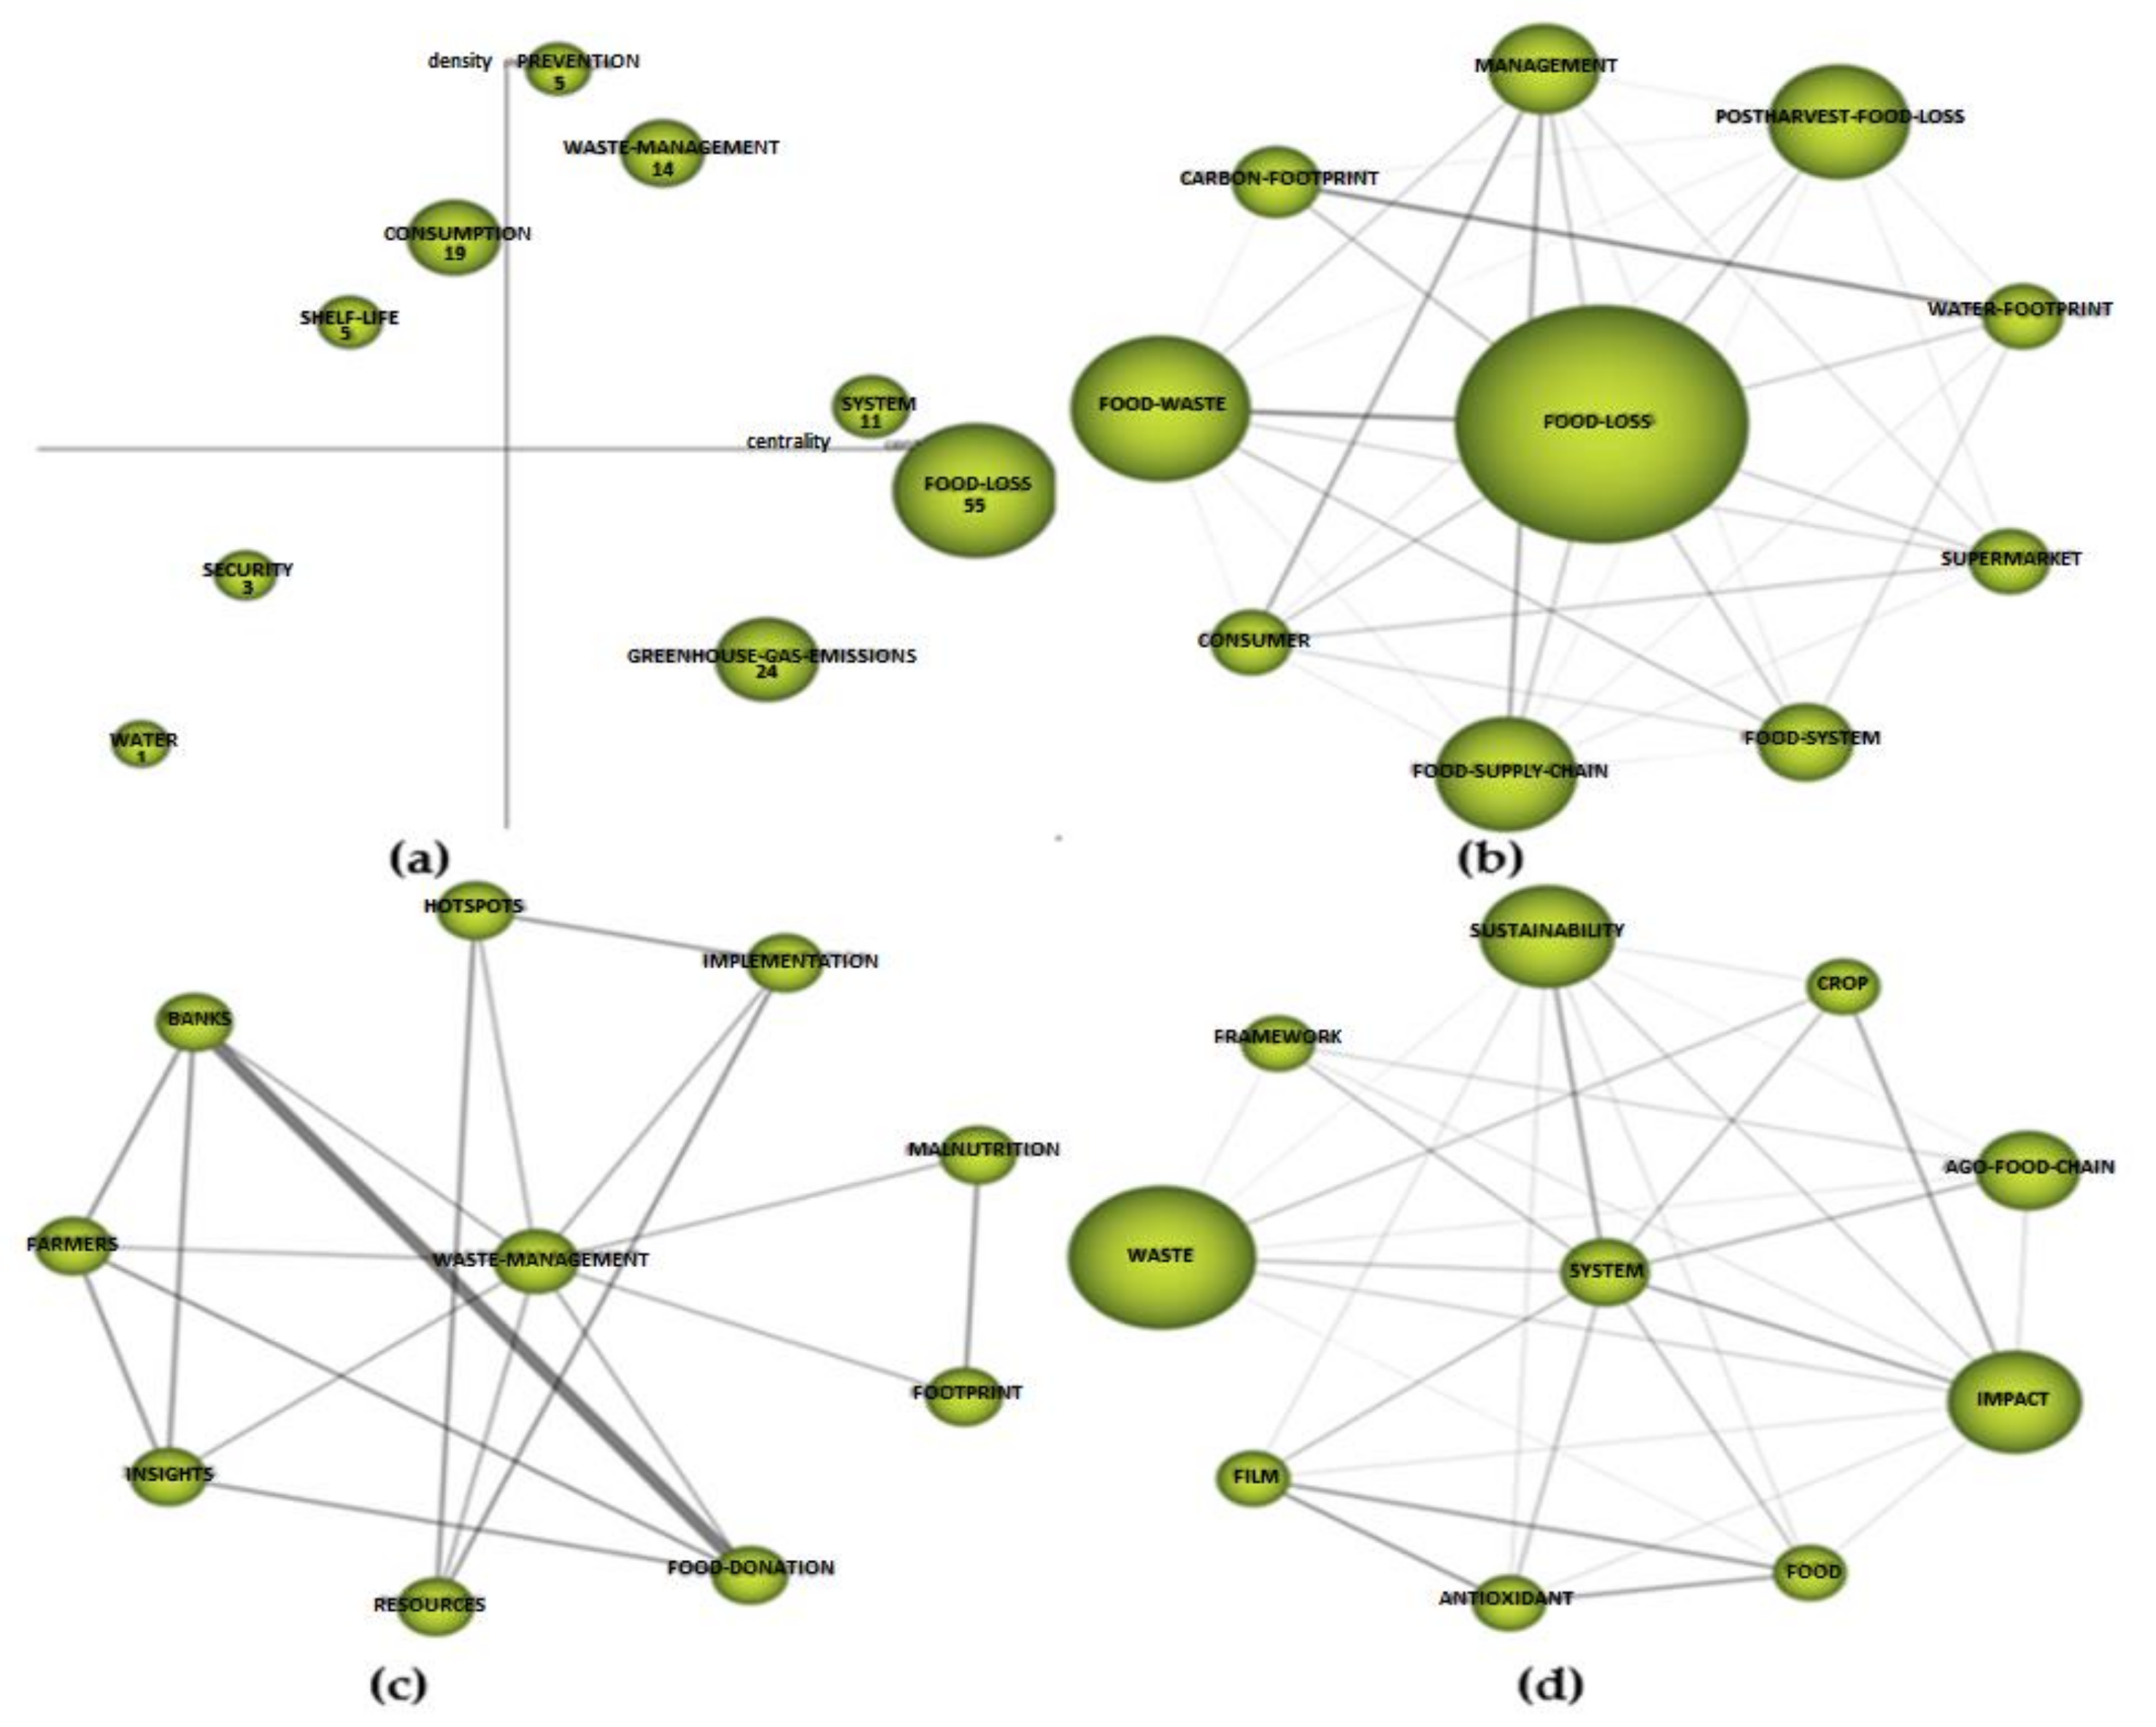
3.3.3. Period 2020–2021
4. Discussion
5. Conclusions
5.1. Theoretical Implications
5.2. Practical Implications
5.3. Limitations and Future Lines of Research
Author Contributions
Funding
Institutional Review Board Statement
Informed Consent Statement
Data Availability Statement
Conflicts of Interest
References
- Lanfranchi, M.; Falco, N.D.; Santagada, R.; Sippelli, S.; Giannetto, C. Analysis and Models for the Reduction of Waste in Organized Large-Scale Retail Distribution: The Tomato. Qual. Access Success 2018, 19, 130–133. [Google Scholar]
- Baker, N.; Popay, S.; Bennett, J.; Kneafsey, M. Net yield efficiency: Comparing salad and vegetable waste between community supported agriculture and supermarkets in the UK. J. Agric. Food Sys. Community Dev. 2019, 8, 179–192. [Google Scholar] [CrossRef]
- FAO. Food and Agriculture Organization of the United Nations. Workshop on Reducing Post-Harvest Losses in Grain Supply Chains in Africa, Italy. Available online: http://www.fao.org/fileadmin/user_upload/ags/publication (accessed on 24 April 2021).
- Gustavsson, J.; Cederberg, C.; Sonesso, U. Food and Agriculture Organization of the United Nations. Available online: http://www.fao.org/3/a-i2697e.pdf (accessed on 7 April 2021).
- Williams, I.D.; Schneider, F.; Syversen, F. The “food waste challenge” can be solved. Waste Manag. 2015, 41, 1–2. [Google Scholar] [CrossRef] [PubMed]
- FAO. Food and Agriculture Organization of the United Nations. Safe Food: Global Initiative on Food Loss and Waste Reduction. Definitional Framework of Food Loss-Working Paper, Italy. Available online: http://www.fao.org/fileadmin/user_upload/save-food/PDF/FLW_Definition_and_Scope_2014.pdf (accessed on 27 April 2021).
- Dora, M.; Biswas, S.; Choudhary, S.; Nayak, R.; Irani, Z. A system-wide interdisciplinary conceptual framework for food loss and waste mitigation strategies in the supply chain. Ind. Mark. Manag. 2021, 93, 492–508. [Google Scholar] [CrossRef]
- Jagtap, S.; Rahimifard, S. The digitisation of food manufacturing to reduce waste–Case study of a ready meal factory. Waste Manag. 2019, 87, 387–397. [Google Scholar] [CrossRef]
- Jagtap, S.; Bhatt, C.; Thik, J.; Rahimifard, S. Monitoring potato waste in food manufacturing using image processing and internet of things approach. Sustainability 2019, 11, 3173. [Google Scholar] [CrossRef] [Green Version]
- Antonelli, M.; Reynolds, C.; Cattaneo, A. Toward Sustainable Food Systems: Approaches and Strategies to Prevent and Reduce Food Loss and Waste. Available online: https://www.mdpi.com/journal/foods/special_issues/sustainable_food_systems_approaches_strategies_prevent_reduce_food_loss_waste (accessed on 12 April 2021).
- Thyberg, K.L.; Tonjes, D.J. Drivers of food waste and their implications for sustainable policy development. Resour. Conserv. Recycl. 2016, 106, 110–123. [Google Scholar] [CrossRef]
- Dora, M. Collaboration in a circular economy: Learning from the farmers to reduce food waste. J. Enterp. Inf. Manag. 2019, 33, 769–789. [Google Scholar] [CrossRef]
- Parfitt, J.; Barthel, M.; Macnaughton, S. Food waste within food supply chains: Quantification and potential for change to 2050. Philos. Trans. Royal Soc. A 2010, 365, 3065–3081. [Google Scholar] [CrossRef] [PubMed] [Green Version]
- Kashyap, D.; Agarwal, T. Food loss in India: Water footprint, land footprint and GHG emissions. Environ. Dev. Sustain. 2020, 22, 2905–2918. [Google Scholar] [CrossRef]
- Garcia-Garcia, G.; Woolley, E.; Rahimifard, S.; Colwill, J.; White, R.; Needham, L. A Methodology for Sustainable Management of Food Waste. Waste Biomass Valor. 2017, 8, 2209–2227. [Google Scholar] [CrossRef] [Green Version]
- Jagtap, S.; Rahimifard, S. Unlocking the Potential of the Internet of Things to Improve Resource Efficiency in Food Supply Chains. In Innovative Approaches and Applications for Sustainable Rural Development, Proceedings of the 8th International Conference HAICTA, Chania, Greece, 21–24 September 2017; Theodoridis, A., Ragkos, A., Salampasis, M., Eds.; Springer: Cham, Switzerland, 2019. [Google Scholar]
- Garcia-Garcia, G.; Woolley, E.; Rahimifar, S. Optimising industrial food waste management. In Proceedings of the 14th Global Conference on Sustainable Manufacturing, Stellenbosch, South Africa, 3–5 October 2016. [Google Scholar]
- United Nations. Sustainable Development Goals. Available online: http://www.un.org/sustainabledevelopment/news/communications-material/ (accessed on 1 May 2021).
- Fernandez-Zamudio, M.A.; Barco, H.; Schneider, F. Direct measurement of mass and economic harvest and post-harvest losses in spanish persimmon primary production. Agriculture 2020, 10, 581. [Google Scholar] [CrossRef]
- Vázquez-Rowe, I.; Laso, J.; Margallo, M.; Garcia-Herrero, I.; Hoehn, D.; Amo-Setién, F.; Bala, A.; Abjas, R.; Sarabia, C.; Dura, M.J.; et al. Food loss and waste metrics: A proposed nutritional cost footprint linking linear programming and life cycle assessment. Int. J. Life 2020, 25, 1197–1209. [Google Scholar] [CrossRef]
- Stancu, V.; Haugaard, P.; Lähteenmäki, L. Determinants of consumer food waste behaviour: Two routes to food waste. Appetite 2016, 96, 7–17. [Google Scholar] [CrossRef]
- Papargyropoulou, E.; Lozano, R.; Steinberger, J.K.; Wright, N.; bin Ujang, Z. The food waste hierarchy as a framework for the management of food surplus and food waste. J. Clean. Prod. 2014, 76, 106–115. [Google Scholar] [CrossRef]
- Sheahan, M.; Barrett, C.B. Food loss and waste in Sub-Saharan Africa: A critical review. Food Policy 2017, 70, 1–12. [Google Scholar] [CrossRef]
- Buzby, J.C.; Hyman, J. Total and per capita value of food loss in the United States. Food Policy 2012, 37, 561–570. [Google Scholar] [CrossRef]
- Cicatiello, C.; Franco, S.; Pancino, B.; Blasi, E. The value of food waste: An exploratory study on retailing. J. Retail. Consum. Serv. 2016, 30, 96–104. [Google Scholar] [CrossRef]
- Love, D.C.; Fry, J.P.; Milli, M.C.; Neff, R.A. Wasted seafood in the United States: Quantifying loss from production to consumption and moving toward solutions. Glob. Environ. Chang. 2015, 35, 116–124. [Google Scholar] [CrossRef] [Green Version]
- Corrado, S.; Sala, S. Food waste accounting along global and European food supply chains: State of the art and outlook. Waste Manag. 2018, 79, 120–131. [Google Scholar] [CrossRef] [PubMed]
- Porter, S.D.; Reay, D.S.; Higgins, P.; Bomberg, E. A half-century of production-phase greenhouse gas emissions from food loss & waste in the global food supply chain. Sci. Total Environ. 2016, 571, 721–729. [Google Scholar] [CrossRef] [Green Version]
- Despoudi, S.; Papaioannou, G.; Saridakis, G.; Dani, S. Does collaboration pay in agricultural supply chain? An empirical approach. Int. J. Prod. Res. 2018, 56, 4396–4417. [Google Scholar] [CrossRef]
- Dora, M.; Wesana, J.; Gellynck, X.; Seth, N.; Dey, B.; De Steur, H. Importance of sustainable operations in food loss: Evidence from the Belgian food processing industry. Ann. Oper. Res. 2020, 290, 47–72. [Google Scholar] [CrossRef] [Green Version]
- Boston_Consulting_Group. BCG. Available online: https://www.bcg.com/publications/2018/tackling-1.6-billion-ton-food-loss-and-waste-crisis (accessed on 27 May 2021).
- Willersinn, C.; Mack, G.; Mouron, P.; Keiser, A.; Siegrist, M. Quantity and quality of food losses along the Swiss potato supply chain: Stepwise investigation and the influence of quality standards on losses. Waste Manag. 2015, 46, 120–132. [Google Scholar] [CrossRef] [PubMed]
- Dorward, L.J. Where are the best opportunities for reducing greenhouse gas emissions in the food system (including the food chain)? A comment. Food Policy 2012, 37, 463–466. [Google Scholar] [CrossRef]
- Conway, G.R. The properties of agroecosystems. Agric. Syst. 1987, 24, 95–117. [Google Scholar] [CrossRef]
- Horton, P.; Cameron, D.; Holdsworth, M.; Lenny Koh, S.C.; Ton, J.; Jackson, P. An agenda for integrated system-wide interdisciplinary agri-food research. Food Sec. 2017, 9, 195–210. [Google Scholar] [CrossRef] [Green Version]
- Hoehn, D.; Margallo, M.; Laso, J.; Ruiz-Salmón, I.; Batlle-Bayer, L.; Bala, A. A Novel Composite Index for the Development of Decentralized Food Production, Food Loss, and Waste Management Policies: A Water-Climate-Food Nexus Approach. Sustainability 2021, 13, 2839. [Google Scholar] [CrossRef]
- Gillman, A.; Campbell, D.C.; Spang, E.S. Does on-farm food loss prevent waste? Insights from California produce growers. Resour. Conserv. Recycl. 2019, 150, 104408. [Google Scholar] [CrossRef] [Green Version]
- Ndiritu, S.W.; Ruhinduka, R.D. Climate variability and post-harvest food loss abatement technologies: Evidence from rural Tanzania. Stud. Agric. Econ. 2019, 121, 30–40. [Google Scholar] [CrossRef]
- Wetherill, M.S.; White, K.C.; Rivera, C.; Seligman, H.K. Challenges and opportunities to increasing fruit and vegetable distribution through the US charitable feeding network: Increasing food systems recovery of edible fresh produce to build healthy food access. J. Hunger Environ. Nutr. 2019, 14, 593–612. [Google Scholar] [CrossRef] [PubMed] [Green Version]
- Mor, R.; Singh, S.; Bhardwaj, A.; Singh, L. Technological implications of supply chain practices in agri-food sector: A review. International Journal of Supply and Operations Management. Int. J. Supply Chain Oper. Resil. 2015, 2, 720–747. [Google Scholar] [CrossRef]
- Esposito, B.; Sessa, M.R.; Sica, D.; Malandrino, O. Towards circular economy in the Agri-food sector. A systematic literature review. Sustainability 2020, 12, 7401. [Google Scholar] [CrossRef]
- Cobo, M.J.; López-Herrera, A.G.; Herrera-Viedma, E.; Herrera, F. An approach for detecting, quantifying, and visualizing the evolution of a research field: A practical application to the fuzzy sets theory field. J. Informetr. 2011, 5, 146–166. [Google Scholar] [CrossRef]
- Moher, D. Preferred Reporting Items for Systematic Reviews and Meta-Analyses: The PRISMA Statement. Ann. Intern. Med. 2009, 151, 264. [Google Scholar] [CrossRef] [Green Version]
- Callon, M.; Courtial, J.P.; Laville, F. Co-word analysis as a tool for describing the network of interactions between basic and technological research: The case of polymer chemsitry. Scientometrics 1991, 22, 155–205. [Google Scholar] [CrossRef]
- Heller, M.C.; Keoleian, G.A. Greenhouse gas emission estimates of US dietary choices and food loss. J. Ind. Ecol. 2015, 19, 391–401. [Google Scholar] [CrossRef]
- Lebersorger, S.; Schneider, F. Food loss rates at the food retail, influencing factors and reasons as a basis for waste prevention measures. Waste Manag. 2014, 34, 1911–1919. [Google Scholar] [CrossRef]
- Verghese, K.; Lewis, H.; Lockrey, S.; Williams, H. Packaging’s role in minimizing food loss and waste across the supply chain. Packag. Technol. Sci. 2015, 28, 603–620. [Google Scholar] [CrossRef]
- Corrado, S.; Ardente, F.; Sala, S.; Saouter, E. Modelling of food loss within life cycle assessment: From current practice towards a systematisation. J. Clean. Prod. 2017, 140, 847–859. [Google Scholar] [CrossRef]
- Liu, C.; Hotta, Y.; Santo, A.; Hengesbaugh, M.; Watabe, A.; Totoki, Y. Food waste in Japan: Trends, current practices and key challenges. J. Clean. Prod. 2016, 133, 557–564. [Google Scholar] [CrossRef]
- Jalava, M.; Guillaume, J.H.; Kummu, M.; Porkka, M.; Siebert, S.; Varis, O. Diet change and food loss reduction: What is their combined impact on global water use and scarcity? Earth’s Future 2016, 4, 62–78. [Google Scholar] [CrossRef] [Green Version]
- Shepon, A.; Eshel, G.; Noor, E.; Milo, R. The opportunity cost of animal based diets exceeds all food losses. Proc. Natl. Acad. Sci. USA 2018, 115, 3804–3809. [Google Scholar] [CrossRef] [Green Version]
- Baker, G.A.; Gray, L.C.; Harwood, M.J.; Osland, T.J.; Tooley, J.B.C. On-farm food loss in northern and central California: Results of field survey measurements. Resour. Conserv. Recycl. 2019, 149, 541–549. [Google Scholar] [CrossRef]
- Johnson, L.K.; Dunning, R.D.; Bloom, J.D.; Gunter, C.C.; Boyette, M.D.; Creamer, N.G. Estimating on-farm food loss at the field level: A methodology and applied case study on a North Carolina farm. Resour. Conserv. Recycl. 2018, 137, 243–250. [Google Scholar] [CrossRef]
- Spang, E.S.; Stevens, B.D.; Spang, E.S.; Stevens, B.D. Estimating the blue water footprint of in-field crop losses: A case study of US potato cultivation. Sustainability 2018, 10, 2854. [Google Scholar] [CrossRef] [Green Version]
- Porter, S.D.; Reay, D.S.; Bomberg, E.; Higgins, P. Production-phase greenhouse gas emissions arising from deliberate withdrawal and destruction of fresh fruit and vegetables under the EU’s Common Agricultural Policy. Sci. Total Environ. 2018, 631, 1544–1552. [Google Scholar] [CrossRef]
- Fabbri, S.; Olsen, S.I.; Owsianiak, M. Improving environmental performance of post-harvest supply chains of fruits and vegetables in Europe: Potential contribution from ultrasonic humidification. J. Clean. Prod. 2018, 182, 16–26. [Google Scholar] [CrossRef] [Green Version]
- Principato, L.; Ruini, L.; Guidi, M.; Secondi, L. Adopting the circular economy approach on food loss and waste: The case of Italian pasta production. Resour. Conserv. Recycl. 2019, 144, 82–89. [Google Scholar] [CrossRef]
- Laso, J.; Margallo, M.; García-Herrero, I.; Fullana, P.; Bala, A.; Gazulla, C. Combined Application Of Life Cycle Assessment And Linear Programming To Evalua-te Food Waste-to-food Strategies: Seeking For Answers in the Nexus Approach. Waste Manag. 2018, 80, 186–197. [Google Scholar] [CrossRef]
- Foti, V.T.; Sturiale, L.; Timpanaro, G. An overview of food waste phenomenon: By problem to resource. Calitatea 2018, 19, 232–240. [Google Scholar]
- Wohner, B.; Schwarzinger, N.; Gürlich, U.; Heinrich, V.; Tacker, M. Technical emptiability of dairy product packaging and its environmental implications in Austria. PeerJ 2019, 7, e7578. [Google Scholar] [CrossRef]
- Luo, N.; Olsen, T.L.; Liu, Y. A Conceptual Framework to Analyze Food Loss and Waste within Food Supply Chains: An Operations Management Perspective. Sustainability 2021, 13, 927. [Google Scholar] [CrossRef]
- Bhattacharya, A.; Fayezi, S. Ameliorating food loss and waste in the supply chain through multi-stakeholder collaboration. Industrial Marketing Management. Ind. Mark. Manag. 2021, 93, 328–343. [Google Scholar] [CrossRef]
- Magalhães, V.S.M.; Ferreira, L.M.D.F.; Silva, C. Using a methodological approach to model causes of food loss and waste in fruit and vegetable supply chains. J. Clean. Prod. 2021, 283, 124574. [Google Scholar] [CrossRef]
- Laso, J.; Campos, C.; Fernandez-Rios, A.; Hoehn, D.; del Rio, A.; Ruiz-Salmon, I.; Cristobal, J.; Quinones, A.; Amo-Setien, F.J.; Ortego, M.D.; et al. Looking for answers to food loss and waste management in spain from a holistic nutritional and economic approach. Sustainability 2021, 13, 125. [Google Scholar] [CrossRef]
- Winans, K.; Marvinney, E.; Gillman, A.; Spang, E. An evaluation of on-farm food loss accounting in life-cycle assessment (LCA) of four California specialty crops. Front. Sustain. Food Syst. 2020, 4, 10. [Google Scholar] [CrossRef]
- Kinach, L.; Parizeau, K.; Fraser, E.D. Do food donation tax credits for farmers address food loss/waste and food insecurity? A case study from Ontario. Agric. Hum. Values 2020, 37, 383–396. [Google Scholar] [CrossRef] [Green Version]
- Batziakas, K.G.; Singh, S.; Ayub, K.; Kang, Q.; Brecht, J.K.; Rivard, C.L.; Pliakoni, E.D. Reducing postharvest losses of spinach stored at nonoptimum temperatures with the implementation of passive modified atmosphere packaging. HortScience 2020, 55, 326–335. [Google Scholar] [CrossRef] [Green Version]
- Katsaros, G.; Taoukis, P. Microbial Control by High Pressure Processing for Shelf-Life Extension of Packed Meat Products in the Cold Chain: Modeling and Case Studies. Appl. Sci. 2021, 11, 1317. [Google Scholar] [CrossRef]
- Galford, G.L.; Pena, O.; Sullivan, A.K.; Nash, J.; Gurwick, N.; Pirolli, G.; Richards, M.; White, J.; Wollenberg, E. Agricultural development addresses food loss and waste while reducing greenhouse gas emissions. Sci. Total Environ. 2020, 699, 134318. [Google Scholar] [CrossRef] [PubMed]
- Qu, X.; Kojima, D.; Nishihara, Y.; Wu, L.; Ando, M. Impact of rice harvest loss by mechanization or outsourcing: Comparison of specialized and part-time farmers. Agric. Econ. 2020, 66, 542–549. [Google Scholar]
- Dal’Magro, G.P.; Talamini, E. Estimating the magnitude of the food loss and waste generated in Brazil. Waste Manag. Res. 2019, 37, 706–716. [Google Scholar] [CrossRef] [PubMed]
- Mouron, P.; Willersinn, C.; Möbius, S.; Lansche, J. Environmental profile of the Swiss supply chain for French fries: Effects of food loss reduction, loss treatments and process modifications. Sustainability 2016, 8, 1214. [Google Scholar] [CrossRef] [Green Version]
- Matsuda, T.; Yano, J.; Hirai, Y.; Sakai, S.I. Life-cycle greenhouse gas inventory analysis of household waste management and food waste reduction activities in Kyoto, Japan. Int. J. Life Cycle Assess. 2012, 17, 743–752. [Google Scholar] [CrossRef] [Green Version]
- Ju, M.; Osako, M.; Harashina, S. Food loss rate in food supply chain using material flow analysis. Waste Manag. 2017, 61, 443–454. [Google Scholar] [CrossRef] [PubMed]
- Svanes, E.; Johnsen, F.M. Environmental life cycle assessment of production, processing, distribution and consumption of apples, sweet cherries and plums from conventional agriculture in Norway. J. Clean. Prod. 2019, 238, 117773. [Google Scholar] [CrossRef]
- Williams, H. Packaging Strategies That Save Food: A Research Agenda for 2030. J. Ind. Ecol. 2018, 23, 1–9. [Google Scholar] [CrossRef]
- Hoehn, D.; Margallo, M.; Laso, J.; Garcia-Herrero, I.; Bala, A.; Fullana-i-Palmer, P.; Irabien, A.; Aldaco, R. Energy embedded in food loss management and in the production of uneaten food: Seeking a sustainable pathway. Energies 2019, 12, 767. [Google Scholar] [CrossRef] [Green Version]
- Verma, M.; Plaisier, C.; van Wagenberg, C.P.; Achterbosch, T. A systems approach to food loss and solutions: Understanding practices, causes, and indicators. Towards Sustain. Glob. Food Syst. 2019, 11, 579. [Google Scholar] [CrossRef] [Green Version]
- Despoudi, S. Challenges in reducing food losses at producers’ level: The case of Greek agricultural supply chain producers. Ind. Mark. Manag. 2021, 93, 520–532. [Google Scholar] [CrossRef]


| Journal | Documents |
|---|---|
| Journal of Cleaner Production | 15 |
| Sustainability | 15 |
| Waste Management | 9 |
| Resources Conservation and Recycling | 7 |
| Science of the Total Environment | 6 |
| Food Policy | 4 |
| Journal of Industrial Ecology | 4 |
| Horticulture | 4 |
| Journal of Agriculture Food Systems and Community Development | 4 |
| International Journal of Life Cycle Assessment | 4 |
| Food | 4 |
| Title | Authors | Year | Citations |
|---|---|---|---|
| Total and per capita value of food loss in the United States [24] | Buzby and Hyman | 2012 | 266 |
| Greenhouse gas emission estimates of U.S. dietary choices and food loss [45] | Heller and Keoleian | 2015 | 135 |
| Food loss rates at the food retail, influencing factors and reasons as a basis for waste prevention measures [46] | Lebersorger and Schneider | 2014 | 99 |
| Packaging’s role in minimising food loss and waste across the supply chain [47] | Verghese, Lewis, Lockrey and Williams | 2015 | 77 |
| The value of food waste: an exploratory study on retailing [25] | Cicatiello, Franco, Pancino and Blasi | 2016 | 76 |
| Modelling of food loss within life cycle assessment: from current practice towards a systematisation [48] | Corrado, Ardente, Sala and Saouter | 2017 | 56 |
| Food waste accounting along global and European food supply chains: state of the art and outlook [27] | Corrado and Sala | 2018 | 47 |
| A half-century of production-phase greenhouse gas emissions from food loss and waste in the global food supply chain [28] | Porter, Reay, Higgins and Bomberg | 2016 | 44 |
| Food waste in Japan: Trends, current practices and key challenges [49] | Liu, Hotta, Santo, Hengesbaugh, Watabe, Totoki, Allen and Bengtsson | 2016 | 40 |
| Diet change and food loss reduction: what is their combined impact on global water use and scarcity? [50] | Jalava, Guillaume, Kummu, Porkka, Siebert and Varis | 2016 | 39 |
| The opportunity cost of animal-based diets exceeds all food losses [51] | Shepon, Eshel, Noor and Milo | 2018 | 36 |
| Name | Centrality | Centrality Range | Density | Density Range |
|---|---|---|---|---|
| Industrial ecology | 89 | 0.83 | 99.19 | 1 |
| Food waste | 123.68 | 1 | 32.3 | 0.67 |
| Packaging | 31.66 | 0.33 | 81.25 | 0.83 |
| Management | 50.9 | 0.67 | 16.75 | 0.33 |
| Food industry | 14.09 | 0.17 | 25 | 0.5 |
| Economic value of food | 34.17 | 0.5 | 9.52 | 0.17 |
| Name | Centrality | Centrality Range | Density | Density Range |
|---|---|---|---|---|
| LCA—life cycle assessment | 163.53 | 1 | 43.5 | 1 |
| Challenges | 137.62 | 0.88 | 33.67 | 0.62 |
| Food consumption | 104.51 | 0.38 | 39.19 | 0.88 |
| Primary production | 113.78 | 0.5 | 35.23 | 0.75 |
| Consumer | 120.11 | 0.62 | 25.02 | 0.38 |
| Agri-food chain | 98.87 | 0.25 | 20.98 | 0.25 |
| Waste | 129.22 | 0.75 | 12.99 | 0.12 |
| Food donation | 38.14 | 0.12 | 29.17 | 0.5 |
| Name | Centrality | Centrality Range | Density | Density Range |
|---|---|---|---|---|
| Waste management | 129.04 | 0.67 | 47.5 | 0.89 |
| Prevention | 116.92 | 0.56 | 68.03 | 1 |
| System | 138.03 | 0.89 | 33.14 | 0.56 |
| Food loss | 192.4 | 1 | 28.27 | 0.44 |
| Consumption | 113.76 | 0.44 | 35.15 | 0.78 |
| Shelf life | 104.43 | 0.33 | 34.17 | 0.67 |
| Greenhouse gas emissions | 137.54 | 0.78 | 19.99 | 0.22 |
| Security | 69.18 | 0.22 | 22.22 | 0.33 |
| Water | 35.8 | 0.11 | 4.44 | 0.11 |
Publisher’s Note: MDPI stays neutral with regard to jurisdictional claims in published maps and institutional affiliations. |
© 2021 by the authors. Licensee MDPI, Basel, Switzerland. This article is an open access article distributed under the terms and conditions of the Creative Commons Attribution (CC BY) license (https://creativecommons.org/licenses/by/4.0/).
Share and Cite
Sánchez-Teba, E.M.; Gemar, G.; Soler, I.P. From Quantifying to Managing Food Loss in the Agri-Food Industry Supply Chain. Foods 2021, 10, 2163. https://doi.org/10.3390/foods10092163
Sánchez-Teba EM, Gemar G, Soler IP. From Quantifying to Managing Food Loss in the Agri-Food Industry Supply Chain. Foods. 2021; 10(9):2163. https://doi.org/10.3390/foods10092163
Chicago/Turabian StyleSánchez-Teba, Eva M., Germán Gemar, and Ismael Pablo Soler. 2021. "From Quantifying to Managing Food Loss in the Agri-Food Industry Supply Chain" Foods 10, no. 9: 2163. https://doi.org/10.3390/foods10092163