Article

Low-Complexity and Highly-Robust Chromatic Dispersion Estimation for Faster-than-Nyquist Coherent Optical Systems

1
State Key Lab of Information Photonics and Optical Communications, Beijing University of Posts and Telecommunications, Beijing 100876, China
2
ZTE Corporation, Shenzhen 518055, China
*
Author to whom correspondence should be addressed.
Photonics 2022, 9(9), 657; https://doi.org/10.3390/photonics9090657
Submission received: 10 August 2022 / Revised: 10 September 2022 / Accepted: 12 September 2022 / Published: 15 September 2022
(This article belongs to the Special Issue Photonics for Emerging Applications in Communication and Sensing)

Abstract

:
Faster-than-Nyquist (FTN) coherent optical transmission technology is considered to be an outstanding solution to achieve higher spectral efficiency (SE), larger capacity, and greater achievable transmission by using advanced modulation formats in concert with highly efficient digital signal processing (DSP) to estimate and compensate various impairments. However, severe inter-symbol interference (ISI) caused by tight FTN pulse shaping will lead to intractable chromatic dispersion (CD) estimation problems, as existing conventional methods are completely ineffective or exhibit unaffordable computational complexity (CC). In this paper, we propose a low-complexity and highly robust scheme that could realize accurate and reliable CD estimation (CDE) based on a designed training sequence (TS) in the first stage and an optimized fractional Fourier transform (FrFT) in the second stage. The training sequence with the designed structure helps us to estimate CD roughly but reliably, and it further facilitates the FrFT in the second stage to achieve accurate CDE within a narrowed searching range; it thereby results in very low CC. Comprehensive simulation results of triple-carrier 64-GBaud FTN dual-polarization 16-ary quadrature amplitude modulation (DP-16QAM) systems demonstrate that, with only overall 3% computational complexity compared with conventional blind CDE methods, the proposed scheme exhibits a CDE accuracy better than 65 ps/nm even under an acceleration factor as low as 0.85. In addition, 60-GBaud FTN DP quadrature phase shift keying (DP-QPSK)/16QAM transmission experiments are carried out, and the results show that the CDE error is less than 70 ps/nm. The advantages of the proposed scheme make it a preferable candidate for CDE in practical FTN coherent optical systems.

1. Introduction

With the exponential growth of data traffic due to bandwidth-intensive applications such as HD video streaming, cloud computing, automatic driving, 5G and other emerging applications, the optical fiber communication capacity is gradually approaching the Shannon limit nowadays. The future optical fiber network is developing towards an ultra-high spectral efficiency, ultra-large capacity and ultra-long transmission distance [1,2]. Optical transport adopting higher bit rates and better spectrum efficiency (SE) is an inevitable step for next-generation wavelength division multiplex (WDM) systems. Although large-capacity WDM transmission systems have been commercially deployed due to the advances of digital signal processing (DSP), further increasing the spectral efficiency is a key challenge in order to meet the explosive demand for higher capacity in communication channels. The mainstream Nyquist WDM system is a feasible scheme to achieve high-spectral-efficiency and large-capacity optical transmission to a certain extent by compressing signal bandwidth and reducing the channel spacing. However, the orthogonal transmission criterion limits the further improvement of the system’s spectral efficiency. In recent years, faster-than-Nyquist (FTN) optical transmission technology has drawn great attention and been widely investigated [3,4,5]. By compressing the symbol interval in the time domain or the channel spacing in the frequency domain, the channel spacing in an FTN system could be less than the symbol rate, and the transmission rate could be higher than the Nyquist rate. Accordingly, FTN optical coherent systems are reasonably considered as a promising solution to achieve a higher SE, larger capacity and greater achievable transmission by using high-order quadrature amplitude modulation (QAM) formats in concert with advanced DSP to compensate the inherent inter-symbol interference (ISI) [6]. Therefore, FTN technology is one of the potential development directions in the field of ultra-high-spectral efficiency and ultra-large-capacity coherent optical transmission.
Chromatic dispersion (CD) compensation is a vital part of digital signal processing (DSP) units for future FTN optical transmissions to exempt from the complicated link dispersion management in the optical domain. CD is also an important optical characteristic of optical fibers, and with the increase of the speed and distance of optical transmission systems, it has become a main obstacle for the development of ultra-high-speed and ultra-long-distance optical transmission systems. In addition, CD, as one of the main channel damages, will cause serious ISI unavoidably in long-haul communication systems. Besides this, due to the real-time requirement of protection switching in the actual system, it is essential for DSP to quickly and accurately monitor the link CD and perform precise compensation. Consequently, a command of accurate CD value in advance is the necessary prerequisite for CD compensation through the DSP algorithms. Moreover, due to the CD estimation (CDE) in the first step of the DSP flow in a digital coherent receiver, at this time, other impairments have not been compensated/equalized, such that the CD estimation algorithm must be tolerant to various types of other damage, thereby putting forward high demands on the robustness of the CD estimation method. Most problematic of all is the FTN strong filtering brought about by introducing serious ISI, which may lead to unaffordable computational complexity (CC) in the estimation of CD, and may further exacerbate the difficulty of CD estimation.
Various CD estimation schemes in a digital coherent receiver have been proposed and demonstrated. One approach relies on extracting parameters from the equalizer taps, but it only applies to the case of a small amount of CD [7]. In order to improve the range of CDE, other dispersion estimation methods are developed. Many CDE schemes based on searching have been reported. One is based on the Godard Clock-Tone (GCT) of the signal spectrum [8,9]. In this method, the power of the clock tone after each signal equalization is calculated by scanning the fixed CD in a pre-defined CD range. The value of the CD can be obtained when the power of the clock tone is the largest. However, it fails when an acceleration factor is small. Another method is based on the peak-to-average-power ratio (PAPR), which also requires a pre-defined CD range and a given CD search step in order to obtain the real CD value. The eigenfunction values need to be calculated after each signal equalization, and the value of CD can be obtained when the power of the eigenfunction is the smallest [10,11]. The scheme based on auto-correlation functions of signal power waveform [12,13] can obtain the CD by finding the time delay when the signal power auto-correlation function is the maximum value, but the scheme completely fails in an FTN-WDM system. Blind CDE based on fractional Fourier transform (FrFT) uses a linear frequency modulation (LFM) signal and has good energy accumulation characteristics with the optimal fraction order [14,15,16,17]. The CD can be obtained when the optimal order is found. However, the method is almost the same as the CDE based on PAPR, with both looking up the CD value primarily by little-step searching, and thereby resulting in very high CC. Moreover, the data-aided CDE method was proposed in [18], but the CDE error is too large to be tolerated in FTN-WDM systems. A CDE scheme based on TS was also proposed in [19]. The scheme is used to solve the problem that the blind CDE algorithm based on FrFT fails at ultra-low sampling rates. After equivalent sampling, it still needs the blind CDE based on FrFT to search the optimal fraction order, thereby resulting in high CC. Besides this, the CDE method based on constant amplitude zero autocorrelation (CAZAC) TS in [20] makes use of the similar characteristics of CAZAC TS and a chirp signal. The CDE value can be obtained by using the relationship between the CD and the optimal order. However, it needs to obtain the optimal orders of the TS before and after transmission by scanning. Therefore, the CC of the method is also high. A CDE scheme based on machine learning has high CDE accuracy [21]. However, the CDE range is too small to meet requirement of FTN-WDM system for a long transmission distance. The delay-tap-sampling-based CDE method proposed in [22] needs to establish a CD lookup table, which needs to scan CD with a small step, which also leads to high CC.
In this paper, a low-complexity and highly-robust CDE scheme is proposed and demonstrated. The first stage CDE of the proposed CDE scheme mainly relies on channel estimation using a designed TS, and the fine estimation in the second stage employs blind CDE based on an optimized FrFT. The feasibility of the proposed scheme is verified by the simulation and experiment of 64/60GBaud dual polarization 16-ary QAM (DP-16QAM) and dual polarization quadrature phase shift keying (DP-QPSK) systems under different transmission distances. The results show that the CD estimation performance is accurate and robust. Compared with the conventional blind CDE scheme based on FrFT, the complexity of the proposed scheme is reduced by about 97%, with estimation accuracy comparable to the blind CDE scheme. The remainder of the paper is structured as follows. The principle of the proposed CDE scheme and the complexity comparison are described in Section 2. In Section 3, simulation results are presented to prove the feasibility of the scheme. In Section 4, we confirm the feasibility of the algorithm by performing the experiment. The conclusions are drawn in Section 5.

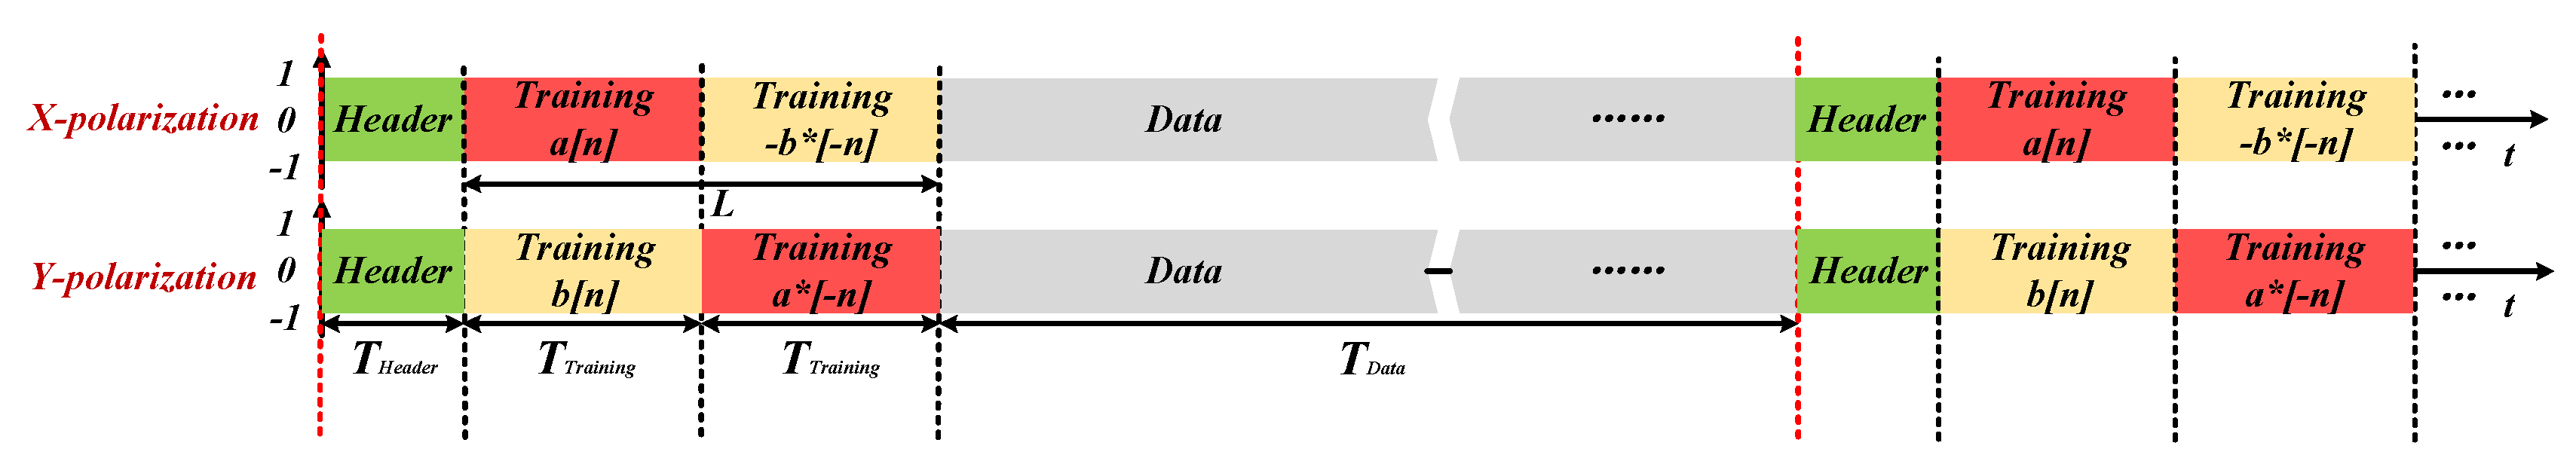
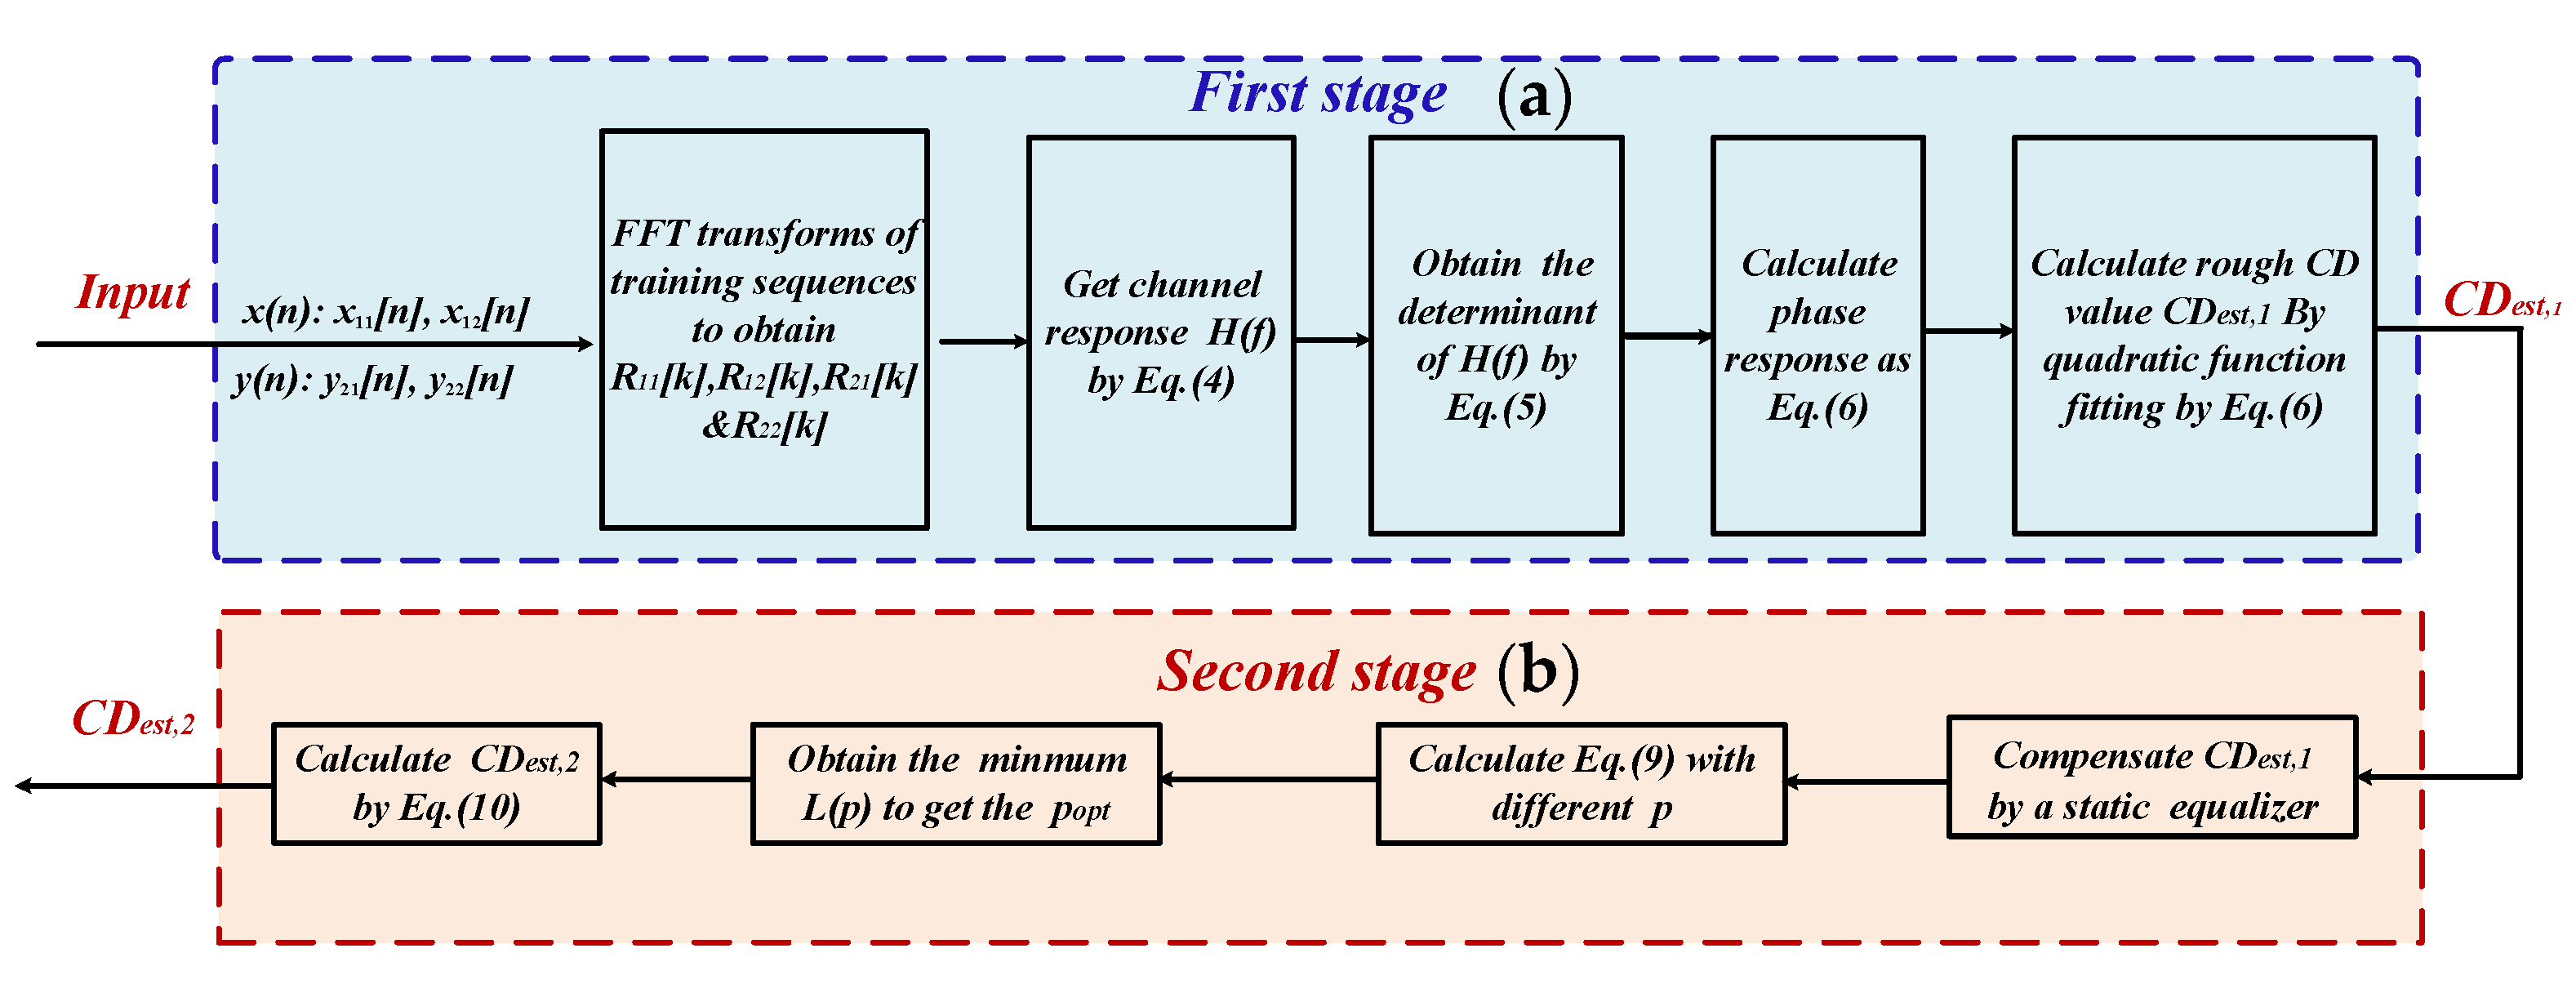
2. Principle of the CDE Scheme

In conventional scanning/searching-based CDE schemes, we need a lot of samples and a small search step in order to ensure the estimation accuracy; thus, it results in a very high CC that seriously hinders its practical application. Especially in the FTN system, the strong filter damage makes the CD estimation extremely difficult, and it is urgent to study and design a low-complexity and high-robust CDE scheme. Accordingly, here, we propose a novel two-stage CDE scheme. Figure 1 shows the structure of the data frame, which consists of CDE TS used in the first stage and the valid transmission service signal. The notation * means taking the complex conjugate. The TSs are pairs of “a[n]” and “b[n]” sequences which both are CAZAC Chu [19,20] sequences with the same length. Due to the good autocorrelation and randomness of CAZAC Chu sequences, they are chosen as the transport matrix to estimate the channel phase response corresponding to CD. The approximate dispersion value of the system is obtained by channel estimation. Then, according to the range of coarse CDE at the first stage, we further modified and optimized the blind CDE based on FrFT for fine estimation in the second stage. The steps of the CD estimation are shown in Figure 2.
From Figure 2, we can see the principle of the first-stage, where x11[n], x12[n], y21[n] and y22[n] are the input signals that are compensated by the IQ imbalance recovery algorithm corresponding to the TS a[n], −b*[−n], b[n] and a*[−n]. The channel transmission matrix can be expanded as Equation (1), where H(f) represents the channel response of the transmission system, E denotes the polarization-dependent loss (PDL) matrix, HCD(f) is the transfer function of the dispersion information, and P(f) denotes the polarization-mode dispersion (PMD) matrix:
H ( f ) = E · H C D ( f ) · P ( f )
where HCD(f) can be described as an all-pass filter in the frequency domain characterized by Equation (2). Here, λ0 is the central wavelength of the laser source, D is the fiber dispersion parameter, z is the total length of the transmission link, and c is the speed of light:
H C D ( f ) = e x p ( j f 2 π λ 0 2 D z c )
In transmission systems, because there is mainly the amplitude loss from PDL, the PDL damage represented as E can be ignored reasonably. The PMD transfer matrix P(f) can be written as Equation (3), where τ is the time delay caused by PMD, and 2 θ and φ are the azimuth and elevation rotation angels, respectively:
P ( f ) = ( p ( f ) q ( f ) q * ( f ) p * ( f ) ) = ( e j π f Δ τ c o s θ e j φ s i n θ e j φ s i n θ e j π f Δ τ c o s θ )
where the relationship between p(f) and q(f) can be expressed as | p ( f ) | 2 + | q ( f ) | 2 = 1 . As such, the channel response H(f) of the transmission system can be expressed as Equation (4):
H ( f ) = H C D ( f ) ( p ( f ) q ( f ) q * ( f ) p * ( f ) )
The determinant of H(f) is as follows:
d e t ( H ( f ) ) = e x p ( 2 j f 2 π λ 0 2 D z c ) ( | p ( f ) | 2 + | q ( f ) | 2 ) = e x p ( 2 j f 2 π λ 0 2 D z c )
Equation (5) shows that the phase angle depends on CD, such that the coarse CD value Dz can be calculated by the quadratic function simulation graph derived from data fitting, as follows:
C D e s t , 1 = D z = c f 2 π λ 0 2 a r g d e t ( H ( f ) )
However, the accuracy of the first-stage CDE algorithm cannot meet the requirements of the FTN system; therefore, the second-stage fine CDE algorithm is essential. The principle is as follows: when the linear frequency modulation (LFM) signal has the FrFT transformation of the best order, the maximum energy convergence can be obtained [16]. A similar character can be extended to the signal with CD in the frequency domain by following Equation (7). F(z, f) is the signal with CD in the frequency domain [17].
F ( z , f ) = F ( 0 , f ) e x p ( j π f 2 λ 0 2 D z c )
The optimal order popt can be inferred as follows:
p o p t = 2 π a r c c o t ( λ 0 2 D z c ( N 1 ) t 2 )
According to the time–frequency distribution of an optical signal with CD, N represents the number of samples to be calculated and t represents the symbol sampling interval. We use p, which ranges from −1 to 1, as the granularity of the search order, and L(p) represents the convergence degree of the signal energy, as shown in Equation (9). Thus, the value of popt can be obtained when the power of L(p) is at its maximum.
L ( p ) = + | X p ( u ) | 2 d u
where Xp(u) is the FrFT of the chirped signal in the time domain with the p order. CDest,2 is the estimated value we obtain. Finally, the fine CDE expression can be realized as follows:
C D e s t , 2 = c ( N 1 ) t 2 λ 0 2 t a n ( p o p t π 2 )

Complexity Comparison with the Blind CD Estimation Method

We compare the CC in terms of the number of computing operations (mainly the real multiplication and real addition) of the proposed CDE scheme with a conventional blind CDE algorithm based on FrFT [17]. It should be pointed out that all of the complexities are calculated for two polarizations, and the computation is based on optimum implementations. The CC is averaged over a single output sampling symbol. Thus, the CC of the proposed scheme is summarized as follows.
For the first-stage CDE of our proposed scheme, (1) the number of the single-polarization samples is 2L. Therefore, the FFT operation takes 4 log 2 2 L   real multipliers, and 2 log 2 2 L real adders. (2) The real multipliers and real adders required by division in the frequency domain for channel estimation, respectively, are 22 and 18. For the second-stage CDE, because the first-stage CDE narrows down the CDE range, the order search range is reduced to [−k, k]. (1) The step size of the scanning order is p, and the number of samples is N, which requires FrFT calculation. The CC of FrFT is the same as FFT with the same length. In this stage, 4 k   log 2 N p real multipliers and 2 k   log 2 N   p real adders are needed. Under the same estimation accuracy, the conventional blind CDE algorithm based on FrFT, the order search range is within (−1, 1) and the step of the scanning order is also p, the sample number is N, and the search times are 2/p. The algorithm takes 4   log 2 N p real multipliers and 2   log 2 N p real adders, respectively. In general, the value of L is small, such as 128 in a 10-Gbaud DP-16QAM system [19]. Besides this, because the first-stage CDE narrows down the CDE range, the range of p goes down, and then K is much less than 1. Consequently, the overall CC of the proposed algorithm could be far less than the conventional CDE based on FrFT. The complexity comparison between the two CDE schemes is summarized as shown in Table 1. Because the key parameters of the algorithms will be determined by simulations, the specific complexity comparison will be given in the third section of the simulation verification. For more comprehensive comparison, here we can make a rough estimation of the CC of the proposed scheme by referring to typical parameters in the existing literature. A data-aided CDE scheme is proposed in [19], where the CDE error is about 10% of the real CD. This shows that the first-stage CDE based on TS could narrow down the CDE range markedly, thereby reducing the scanning times by approximately 90%. In the literature [20], 4096 samples and the step size 0.001 of the scanning order are used to search the optimal order of the energy concentration function. It can be inferred from the above typical parameters that the length of the TS used for coarse CDE is usually less than 512. Thus, according to the calculation of the CC in Table 1, we can show that when the CDE accuracy is almost the same, the CC of the proposed CDE scheme is about 3% of the traditional CDE scheme.

3. Simulation and Discussion

3.1. Simulation Environment

In order to verify the feasibility of the proposed CDE algorithm, a three-wavelength 64GBaud DP-16QAM FTN-WDM coherent optical transmission simulation platform was built. In the transmitter-side offline DSP, 219-1 pseudorandom bit sequences (PRBS) are mapped to 16QAM symbols. The TS is inserted as shown in Figure 1. Then, FTN filtering shaping is completed by Root Raised Cosine (RRC) digital filter with a roll-off factor of 0.01. The transmitter uses three lasers with a channel spacing of 75 GHz as the carrier of the IQ modulator. The central carrier wavelength is 1550 nm. The three modulated optical carriers enter the optical fiber transmission through the wavelength division multiplexing coupler, and the optical fiber link is composed of multiple spans using a fiber loop; each loop includes 80 km optical fiber, a ROADM and an EDFA. At the receiver, the wavelength division multiplexing de-multiplexer is used to filter out the target center wavelength channel. After passing through the optical coherent receiver, the signal is processed by offline DSP to recover the original signals. Before the CD estimation, IQ quadrature imbalance compensation must be performed. In the system, the acceleration factor α is defined as the ratio between the RRC 3 dB bandwidth and the signal baud rate. The fiber CD coefficient and PMD coefficient are 16 ps/nm/km and 0.2 ps / km , respectively. The optical fiber transmission distance is over 160~960 km. The launch power at the transmitter is 0 dBm.
Figure 3 shows a simulation platform for a 64Gbaud DP-16QAM FTN-WDM system and the proposed CD estimation scheme. The parameters of the conventional blind CDE algorithm are the same as the proposed scheme. We use p for the step of the search order. For each CDE, the difference between the real CD value (CDreal) and the estimated CD value (CDest) is used to evaluate the performance. M is the total number of computations. The mean error of the absolute CDE (MECD) is defined as
M E C D = 1 M i = 1 M | C D e s t , i C D r e a l , i |

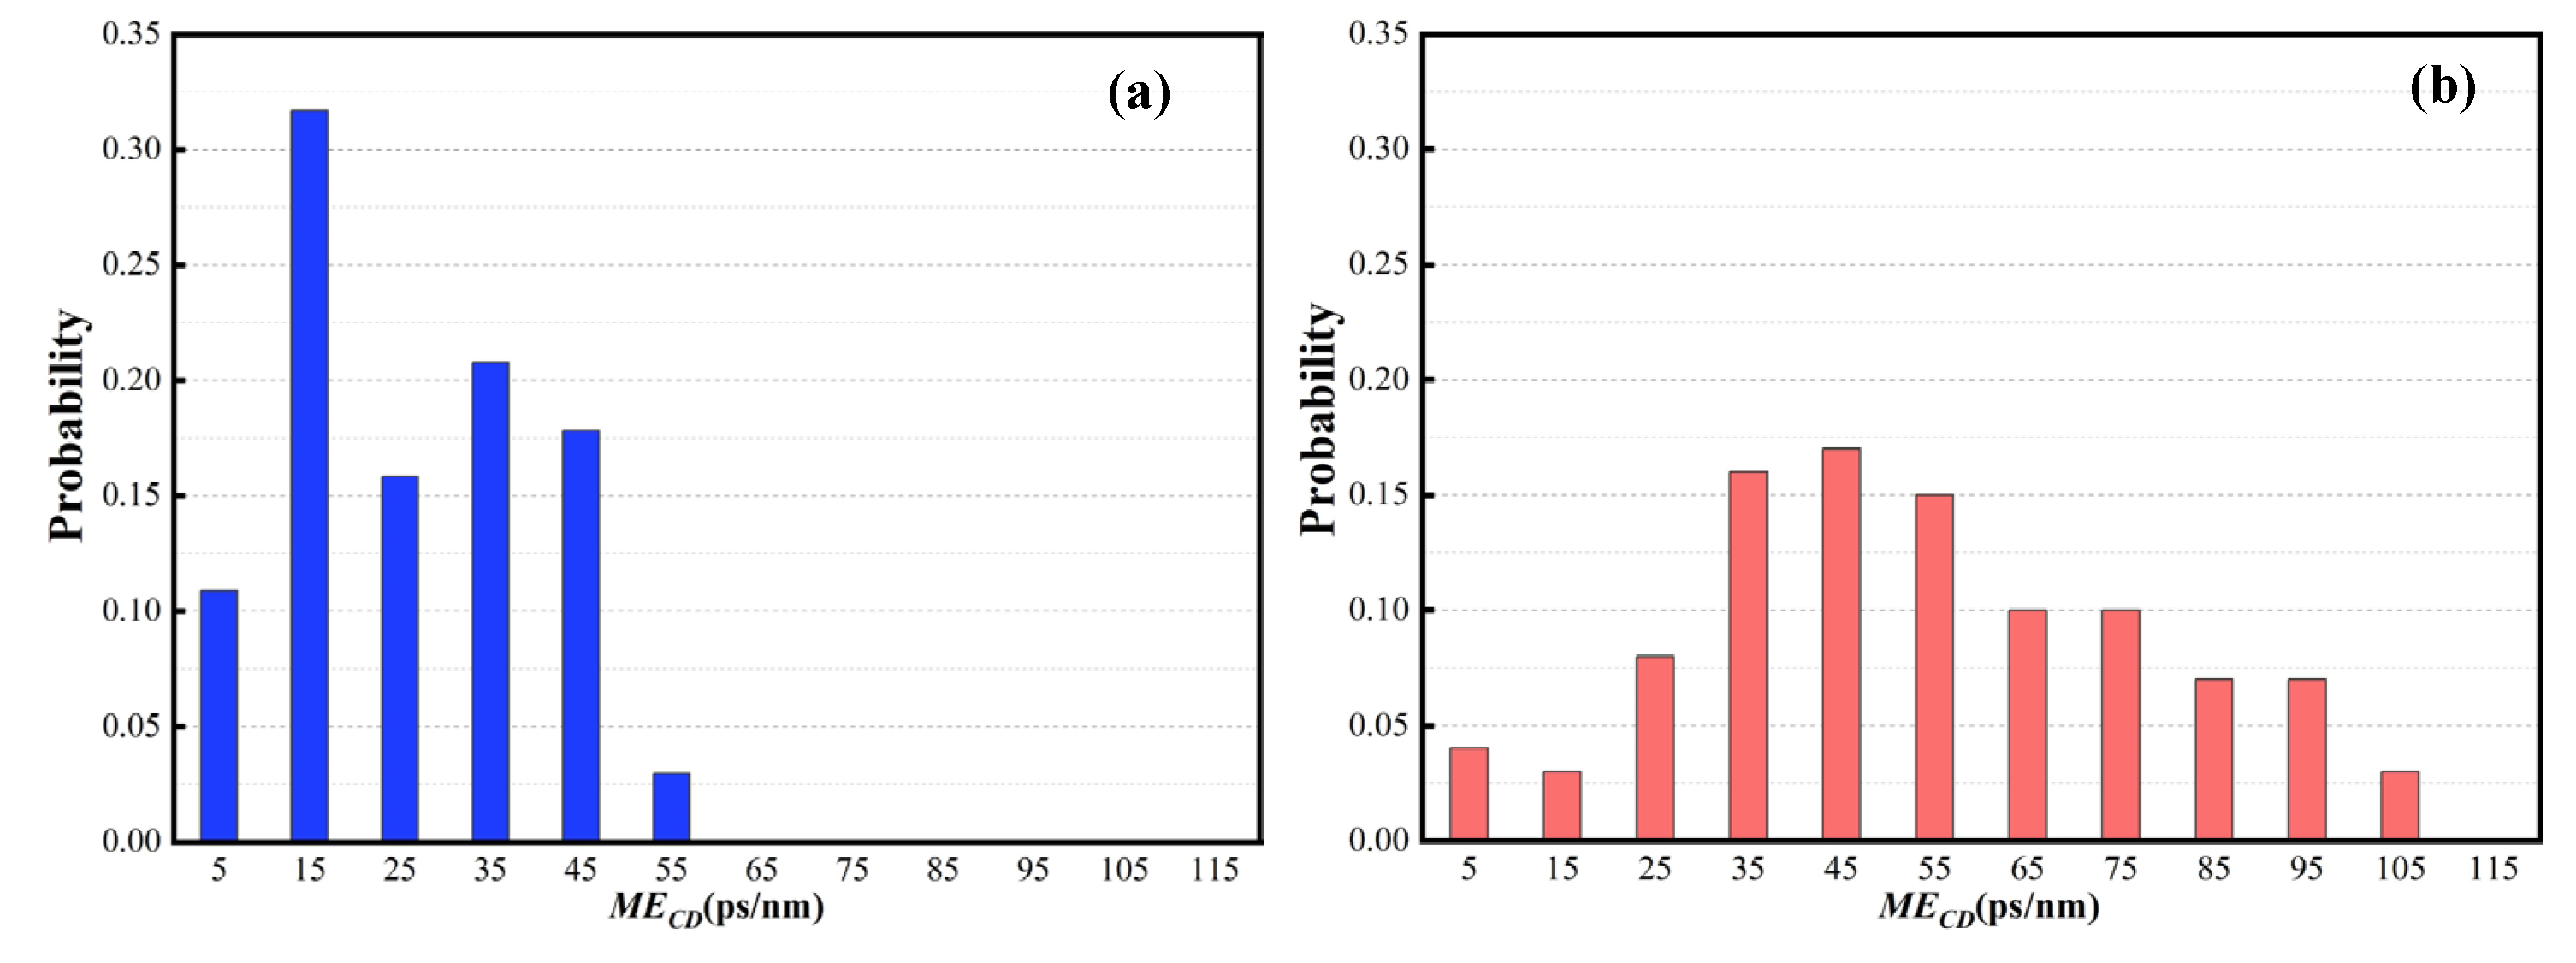
3.2. Analysis of the Impact of the Algorithm Key Parameter

Obviously, the performance of the channel estimation depends on the length of the TS. To some extent, the longer the sequence used to fit the channel phase response, the better the fitting effect will be. Therefore, CDest will be more close to practical CDreal. However, excessively long training sequences lead to excessive overhead that will decrease the data transmission efficiency. On the contrary, when the length of TS is short, the estimation will not be accurate enough. It is of great significance to find out the most suitable parameters of the CD estimation algorithm considering the performance and overhead costs.
Theoretically, the length of a single training sequence is required when the training sequence is used to accurately detect CD, as follows [19]:
L = D z λ 0 2 B N t / c T
where B represents the signal Baud rate and Nt = 2 when the system has two polarizations, and T is the sampling period. In these systems of around 1000-km fiber transmission, the minimum length of TS samples is calculated as 2100. Because the overall CDE accuracy depends on the estimation accuracy of the second-stage, it is enough for L to be a value of 512 in order to obtain a coarse CD in the first stage. Meanwhile, the CDE range of the second-stage can be reduced to about 1/8 of the maximum CD. This indicates that the CDE in the second stage only needs to meet the requirement of a high accuracy within the CD range from −2000 ps/nm to 2000 ps/nm.
Obviously, from the basic principle of the algorithm, we can find that the sample number used in the second fine-stage CDE and the step of the search order p both influence the final CDE accuracy. Due to the first stage of CDE, the search range of the second fine-stage CDE is reduced to [−2000–2000] ps/nm. The range of order p varies with the number of samples. In order to fully estimate the residual CD after the first-stage CDE and compensation, we set the range to be slightly larger than [−2000–2000] ps/nm for the second-stage CDE. Therefore, when the sample numbers are 4096 and 8192, we can obtain from Equation (10) that the search ranges of the order are [−0.048–0.048] and [−0.024–0.024], respectively.
In order to balance the estimation performance and computational complexity of the algorithm, the granularity of the CD scanning, calculated from the sample number and the step of the search order, is set as 100 ps/nm and 200 ps/nm, respectively. Thus, we used 4096 and 8192 samples to evaluate the performance of CDE, and the step size p of the order search is set as 0.002 and 0.004, and 0.001 and 0.002, respectively. The CDreal is randomly generated from 160 to 960 km, and each configuration is evaluated 100 times.
Figure 4a,b show the distribution of the mean value of the absolute CDE error using 4096 samples when the step size of the order scanning is 0.002/0.004 and the granularity of the CD scanning is 100/200 ps/nm, respectively. It can be seen that the smaller the CD scanning granularity, the smaller the mean value of the CD estimation error, which is mainly concentrated in the range of less than 65 ps/nm. When the CD scanning granularity is 200 ps/nm, the maximum CD estimation error reaches 115 ps/nm, and the estimation error distribution is relatively uniform. In order to achieve higher CD estimation performance, we increase the number of samples to 8192 for CD estimation. The results in Figure 5 show that the CD estimation performance using 8192 samples is slightly better than that using 4096 samples, and the CD estimation error distributions of the two cases are basically similar.
In Table 2, MECD is the absolute mean error of CDE, and RCD represents the range of the CDE error. We can see that the performance of CDE is similar when scanning the CD with the same granularity. This also indicates that the more sampling points there are, the higher the accuracy of the CDE. With the increase of the step of CD scanning, the effect of CDE becomes worse. When taking the overall complexity of the algorithm proposed into consideration, we select a granularity of CD scanning of 200 ps/nm, and p is 0.004 and 0.002. Besides this, the computational complexity of the two cases with different sample numbers is nearly equivalent. However, in multiple simulations of various link conditions, we found that the CD estimation performance with the sample number of 8192 is more stable; that is, the ability to resist various system impairments (such as PMD, timing error, phase noise, etc.) is stronger. Therefore, considering the ability and stability, the number of sampling symbols is selected as 8192, corresponding to the p of 0.002. In addition, according to the analysis of the algorithm complexity, with the same parameter, i.e., 8192 sampling symbols and a 0.002 step size of order scanning, the overall CC of the proposed CDE algorithm is reduced by about 97% compared with the conventional, completely blind CDE scheme. In addition, as shown in Table 2, we can also compare the CC under different parameters with different CDE performances. When the number of sampling symbols and p are 4096 and 0.002, respectively, the overall CC of the proposed CDE algorithm is reduced by about 95%. If p is 0.004, the overall CC of the proposed CDE algorithm is reduced by about 94.7%. When the number of sampling symbols and p are 8192 and 0.001, respectively, the overall CC of the proposed CDE algorithm is reduced by about 97.5%. Therefore, the proposed CDE algorithm benefits from the two-stage structure, which greatly reduces the CC compared with the traditional algorithm.

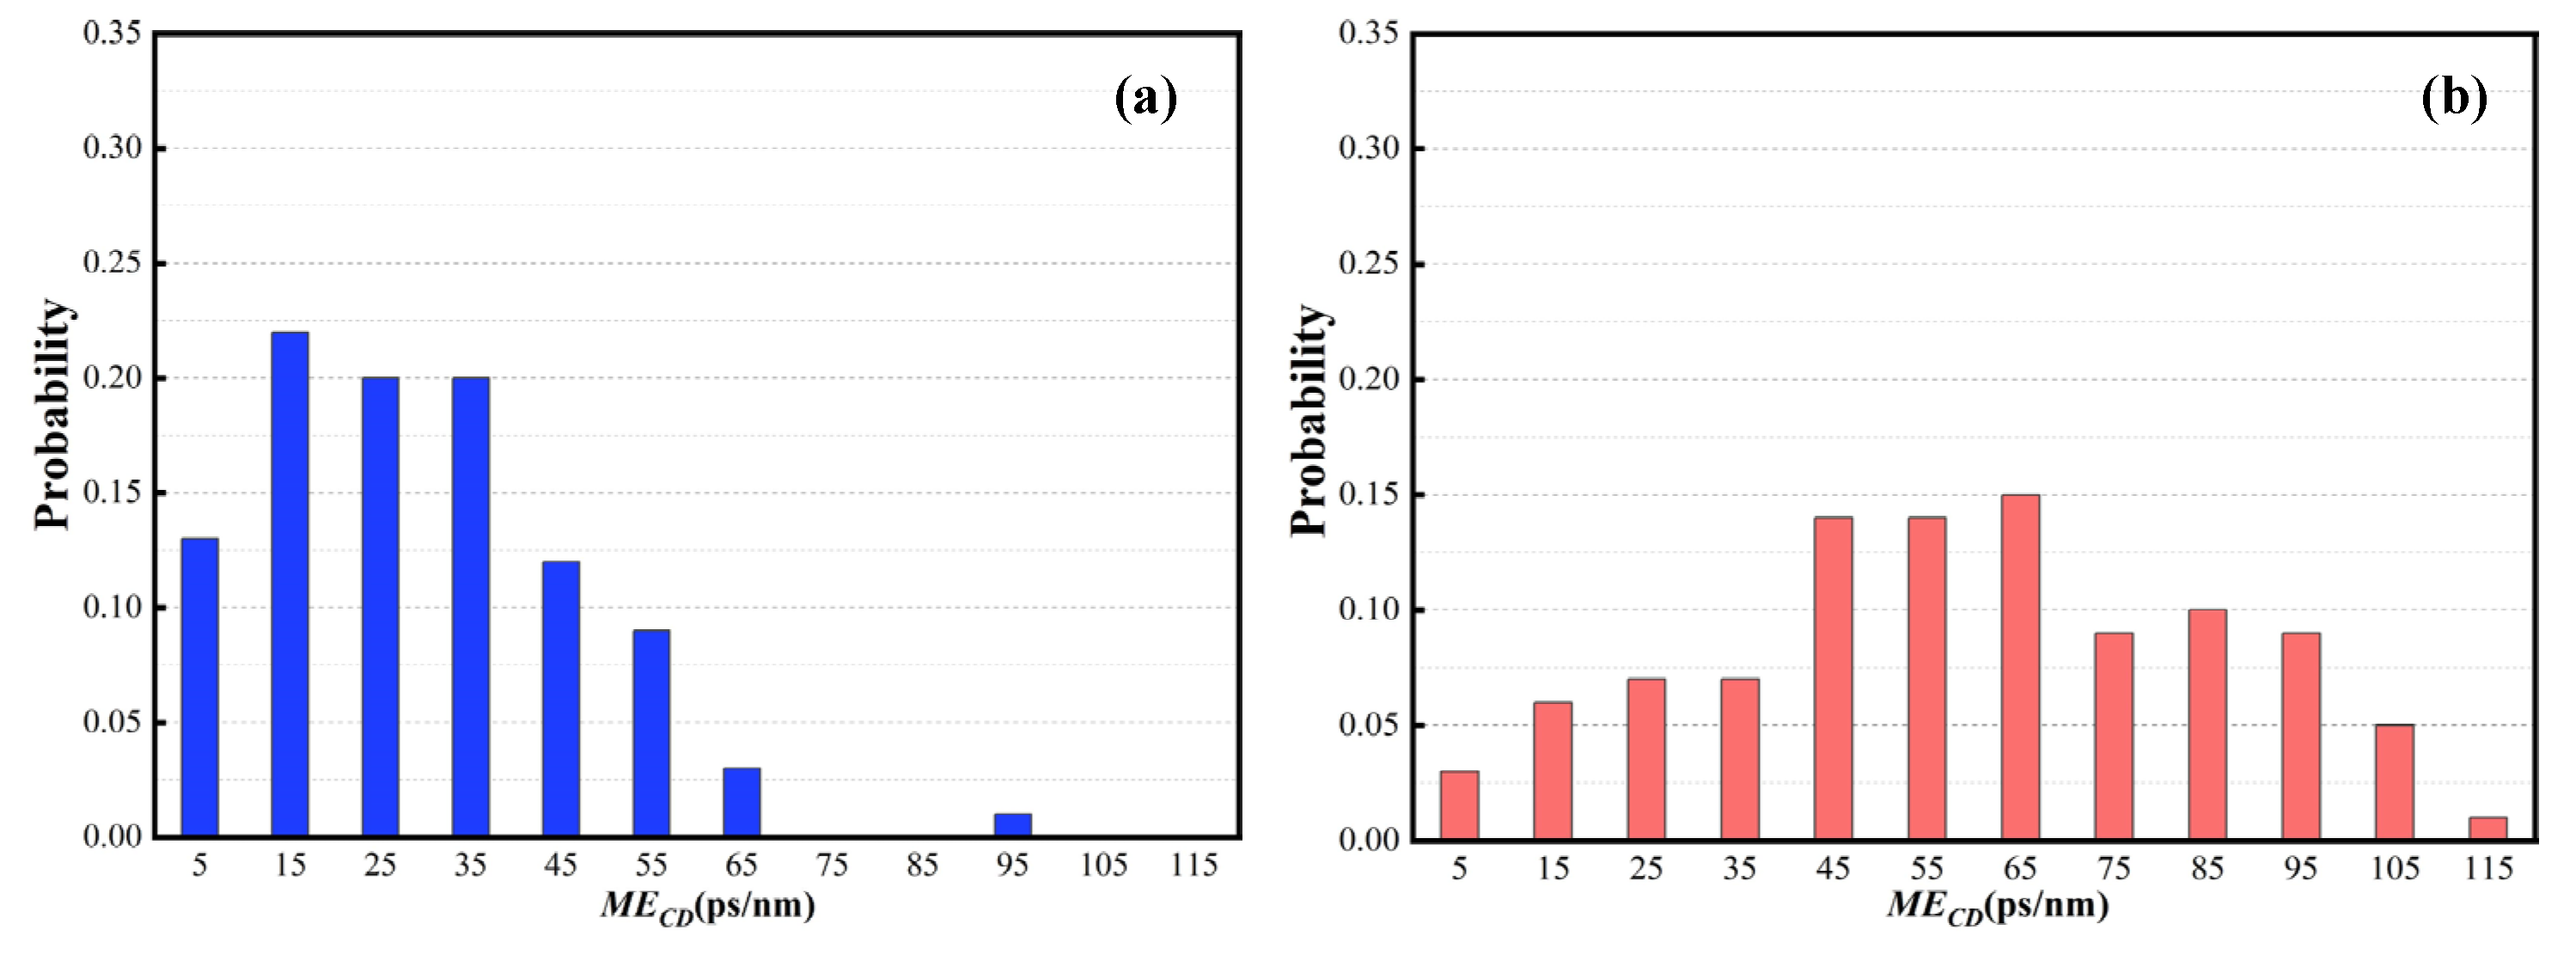
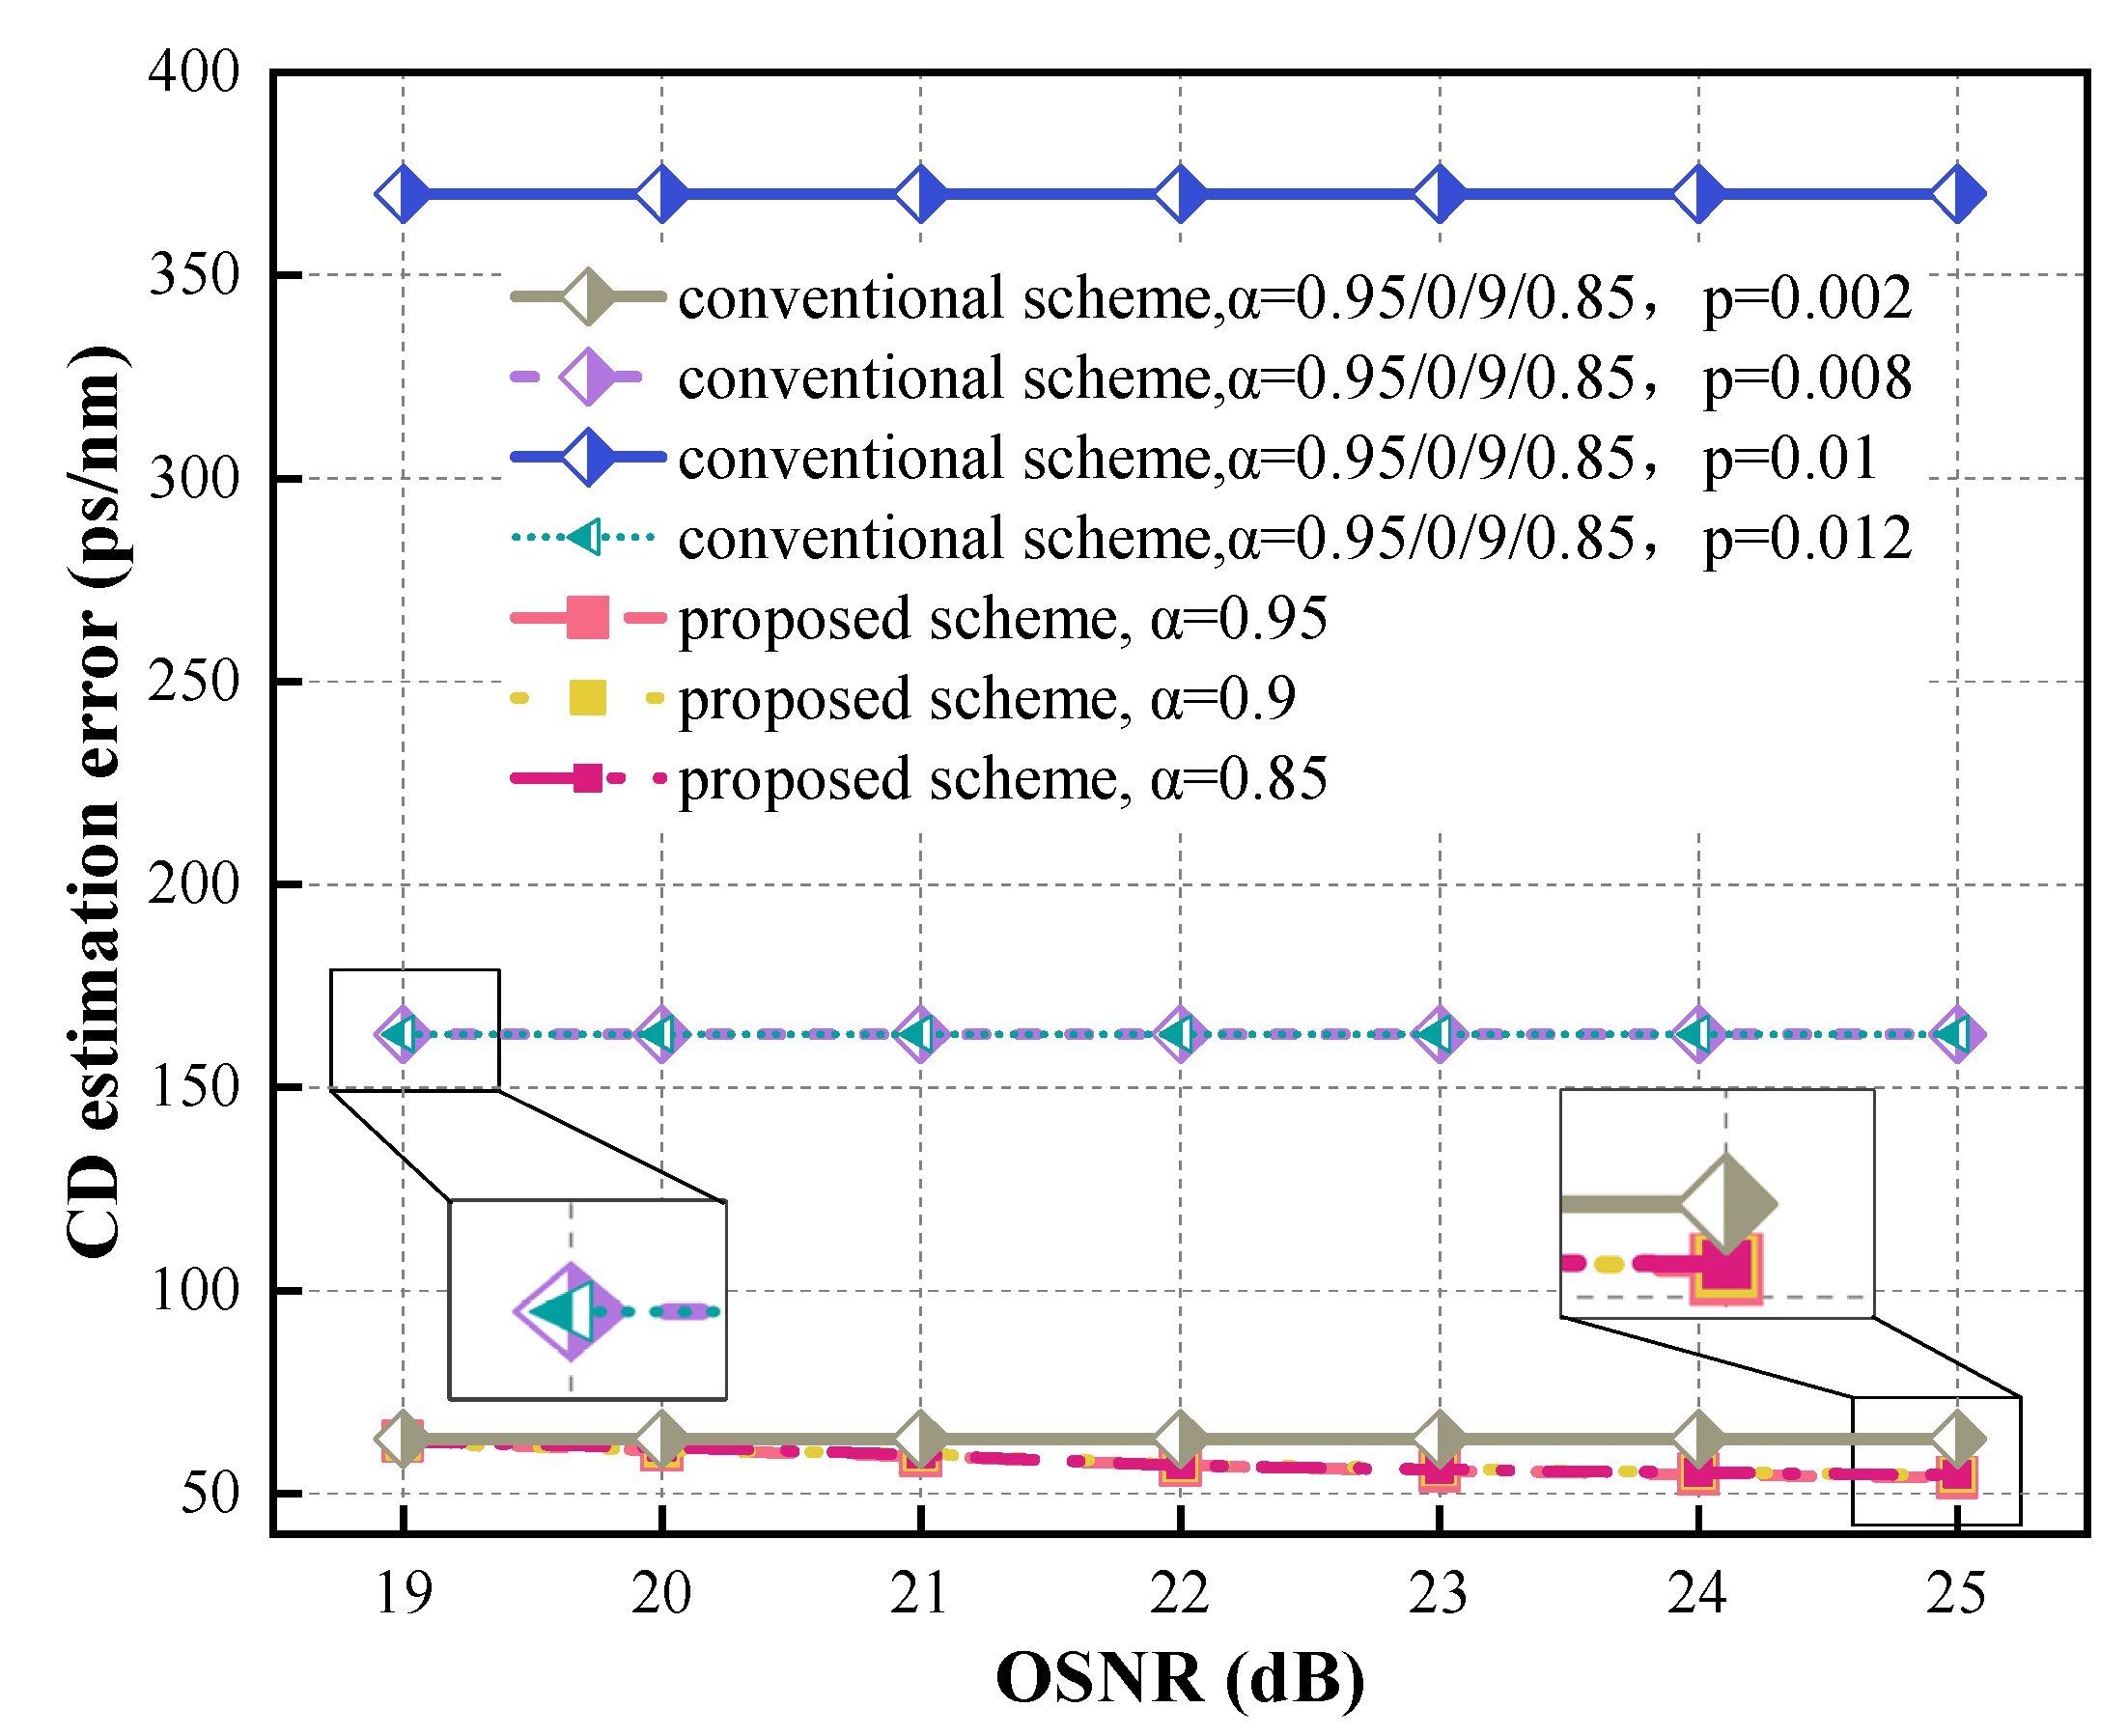
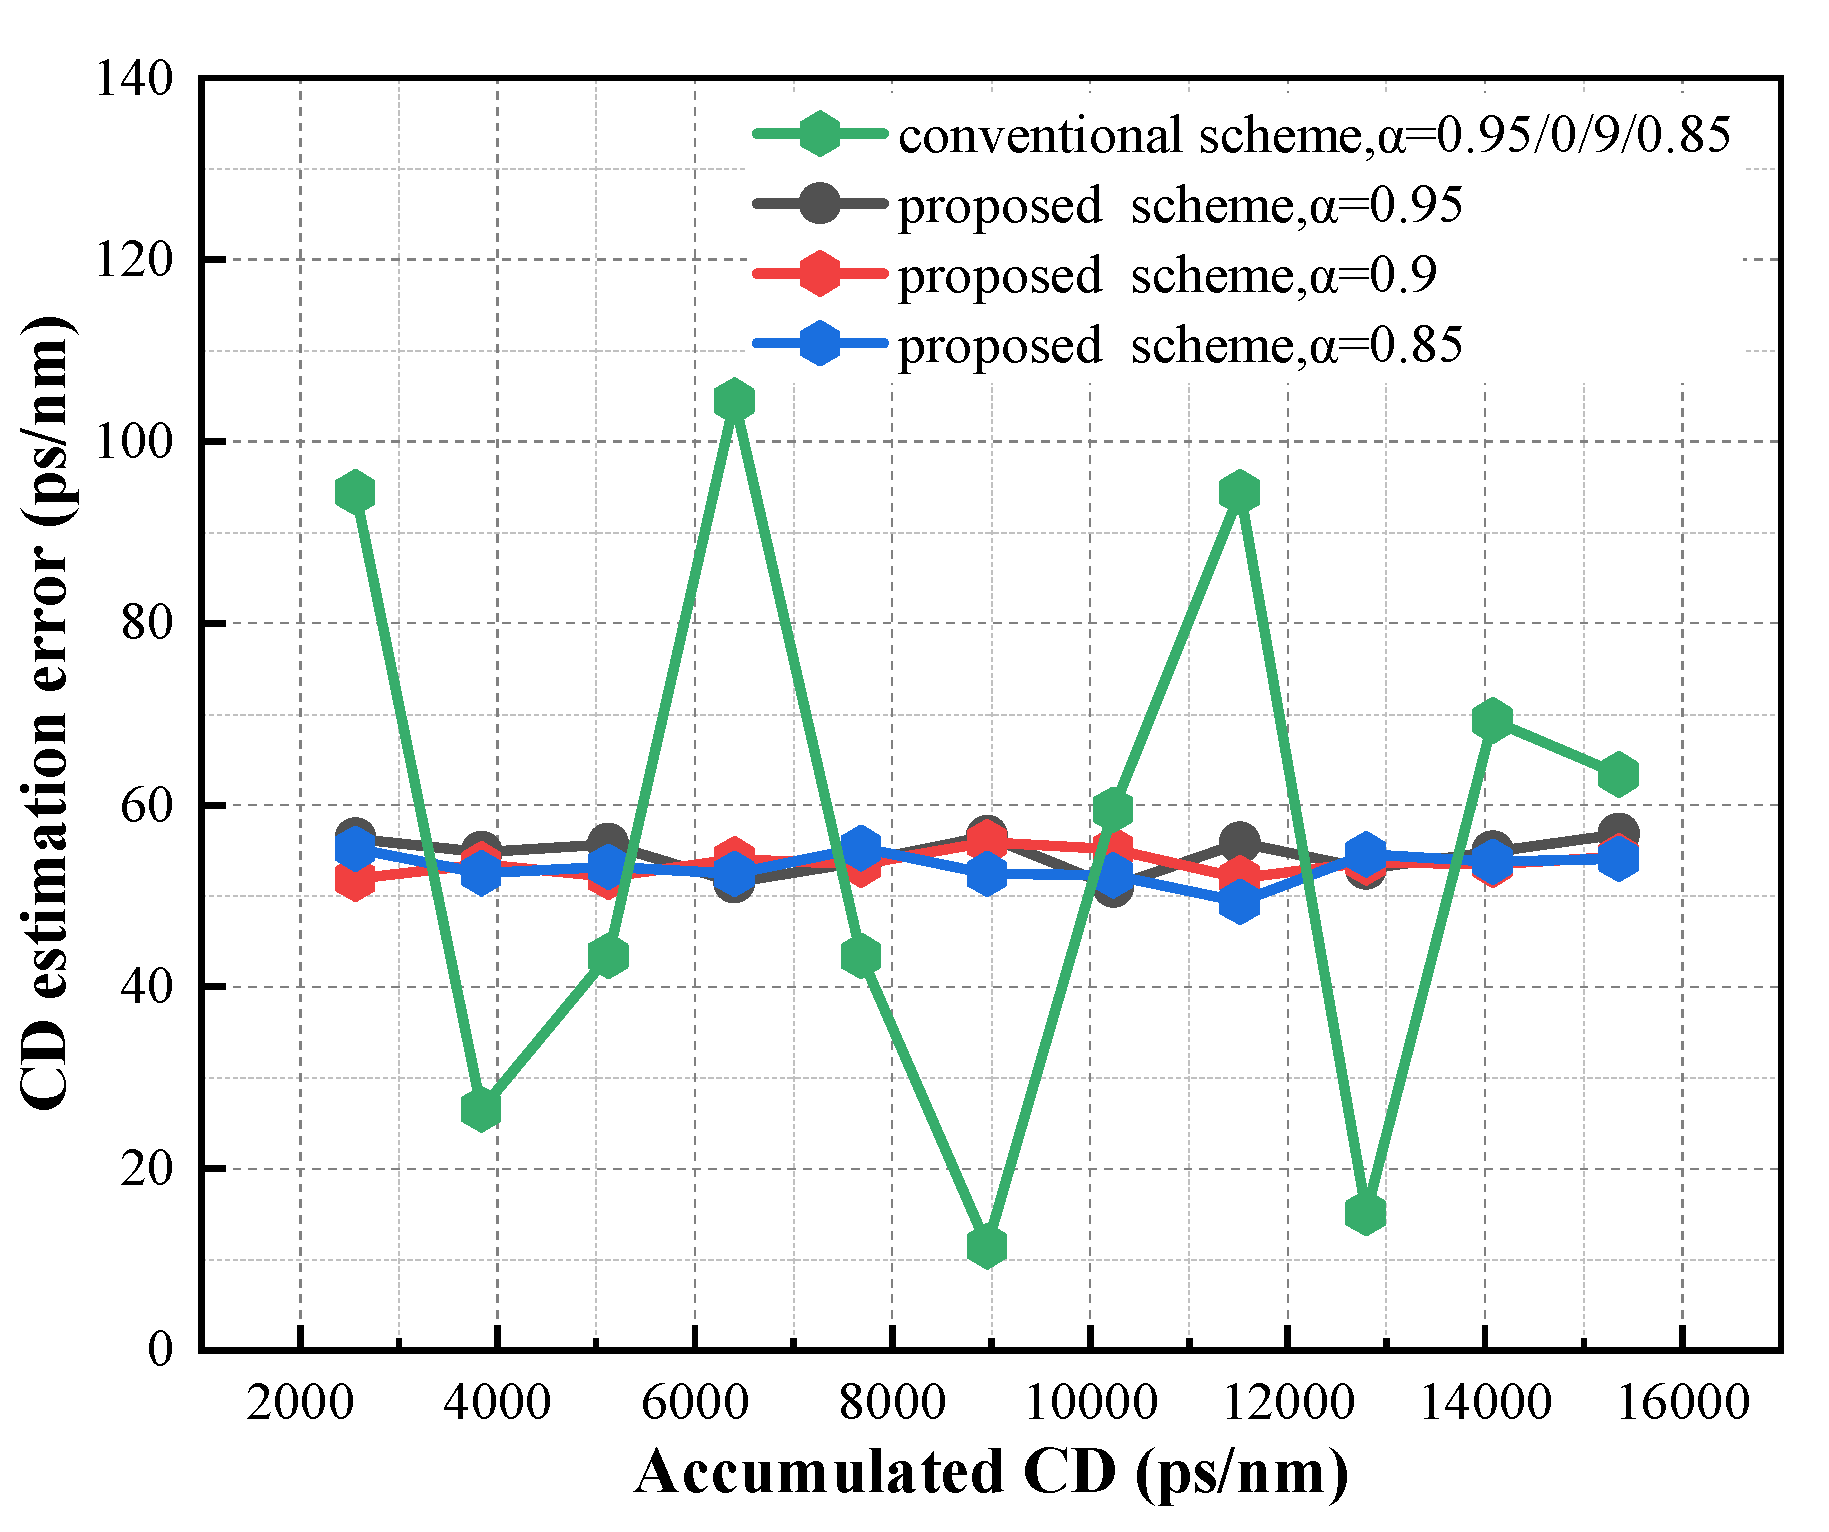
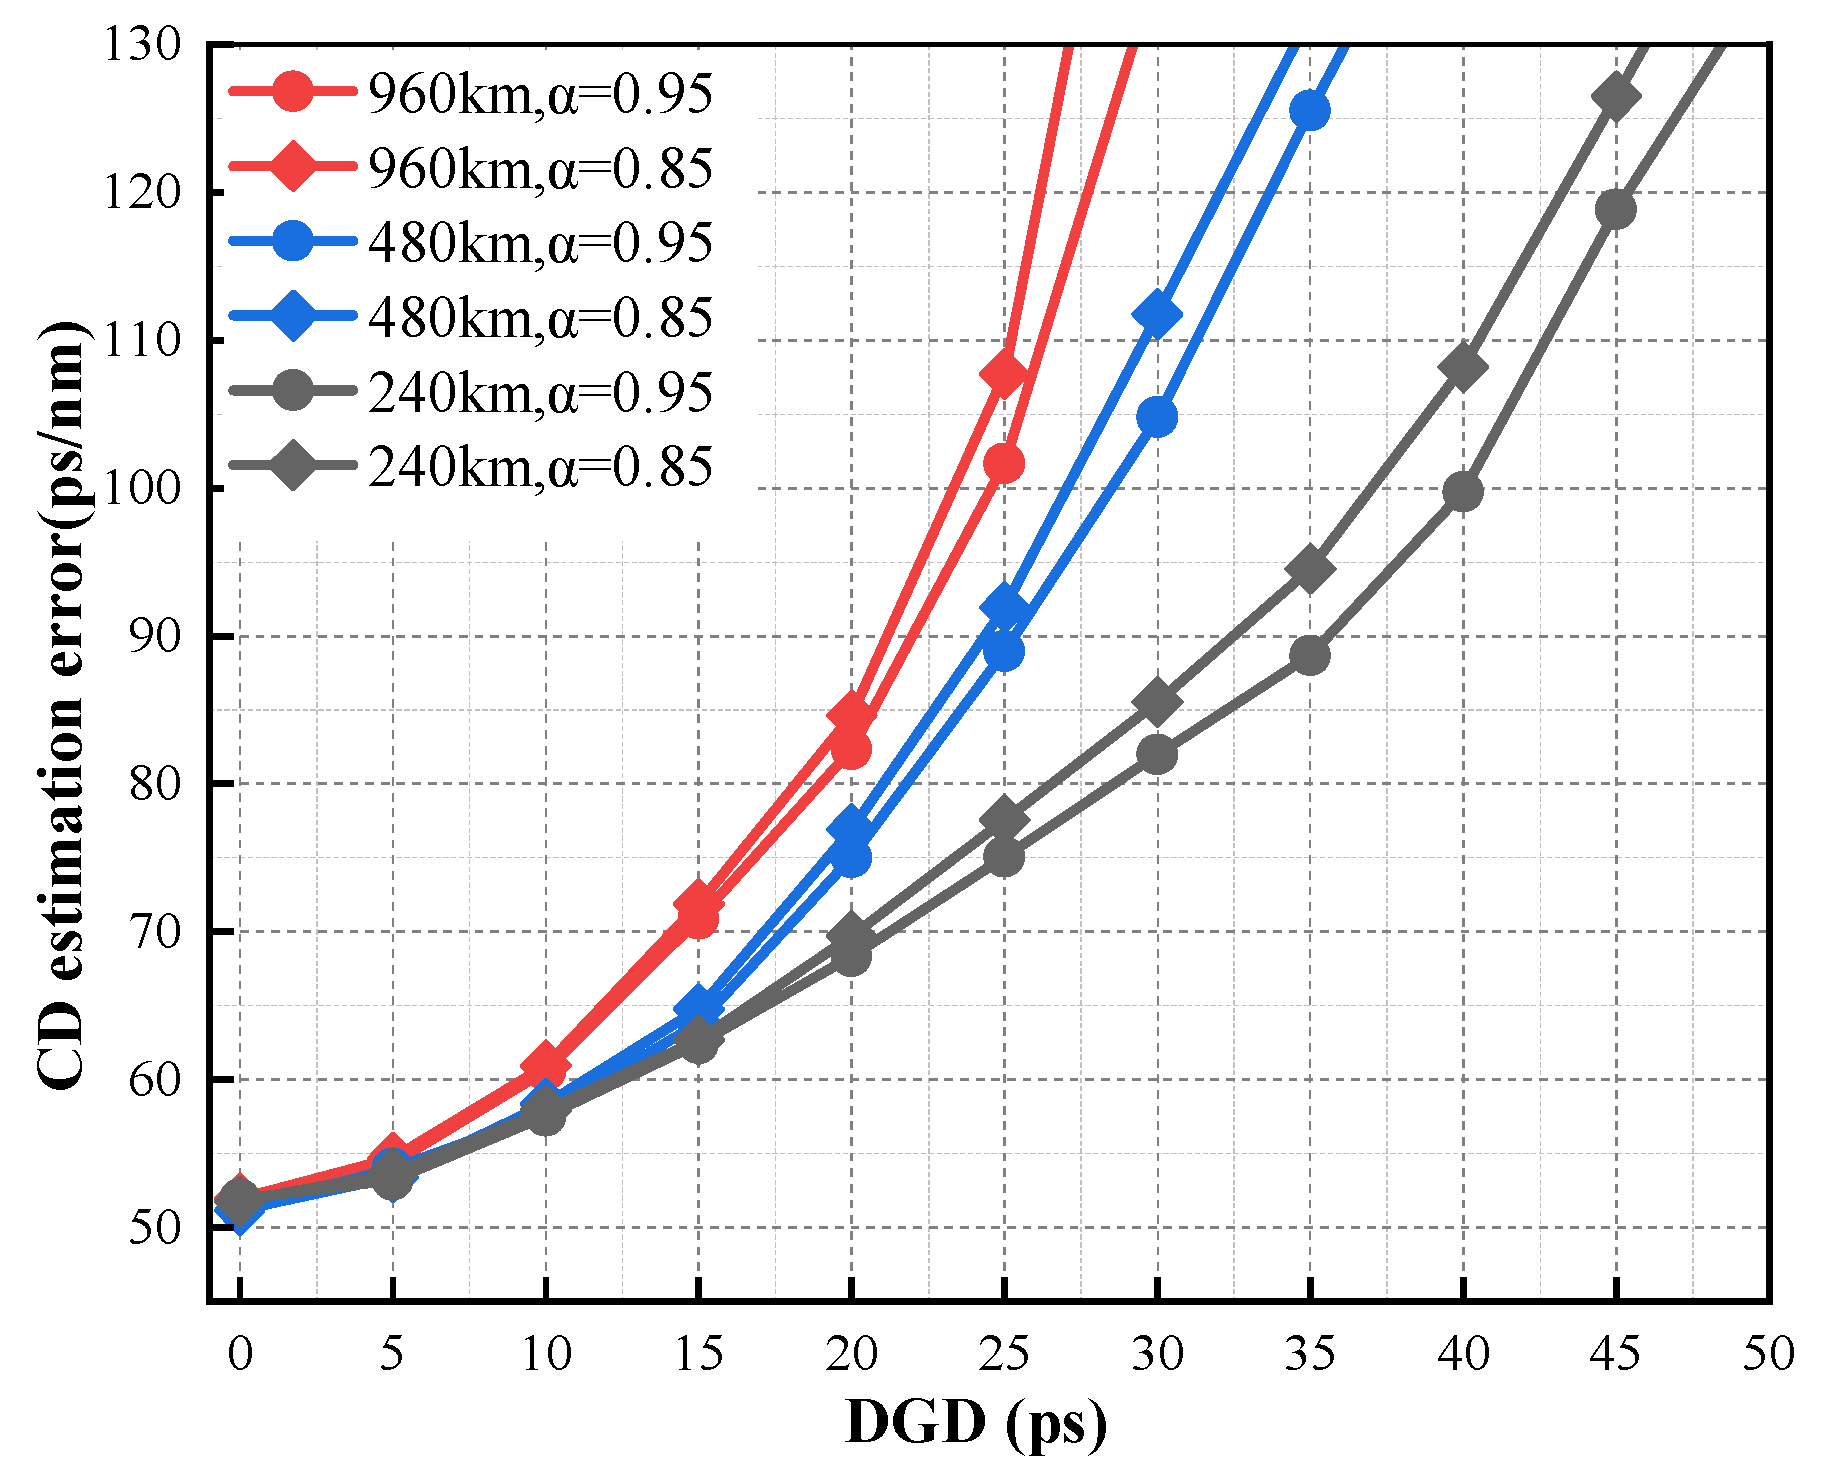
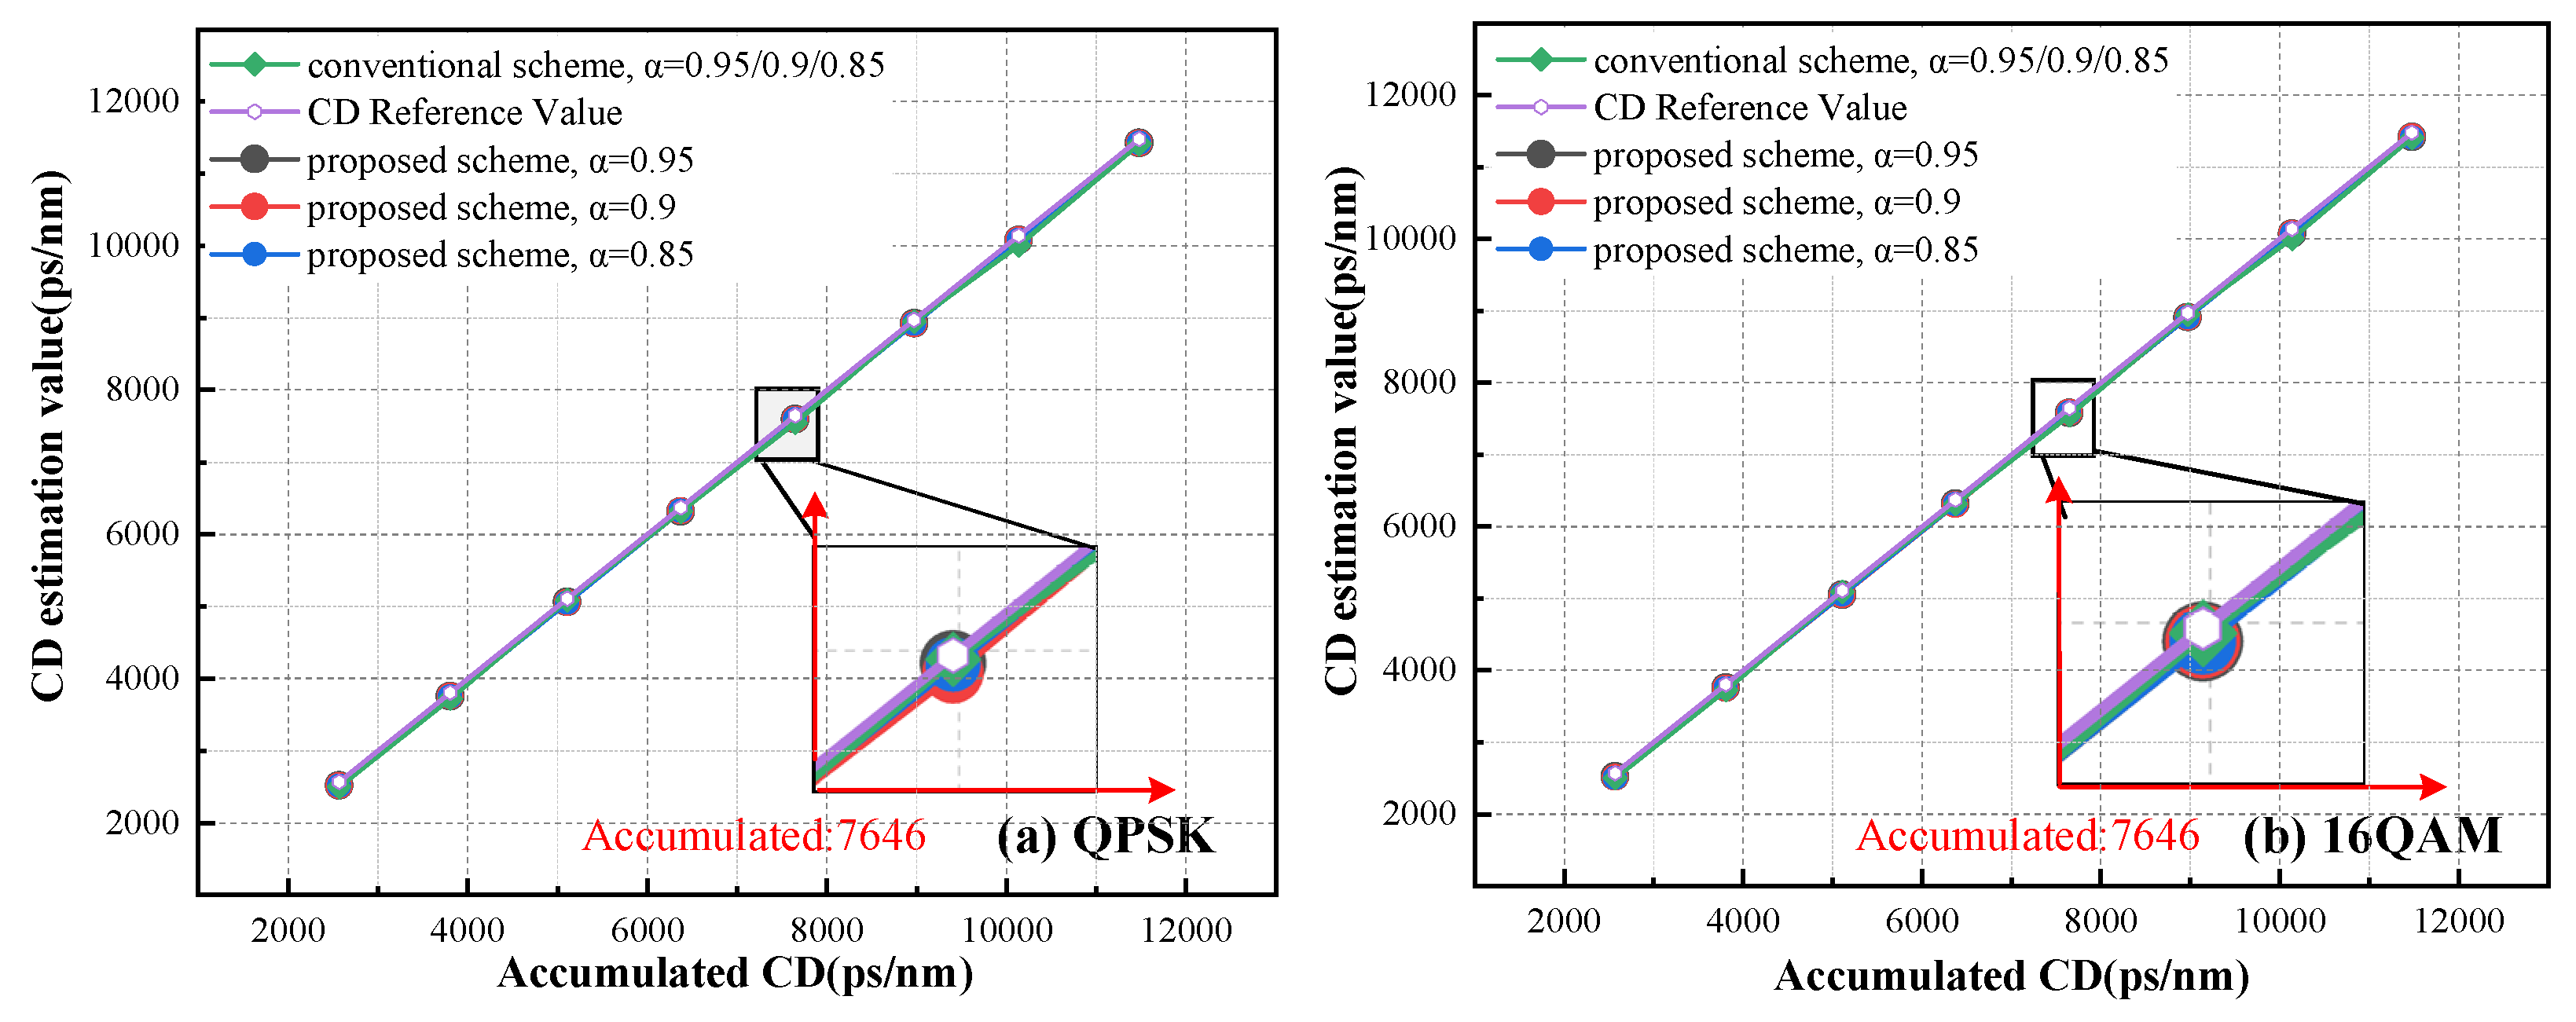
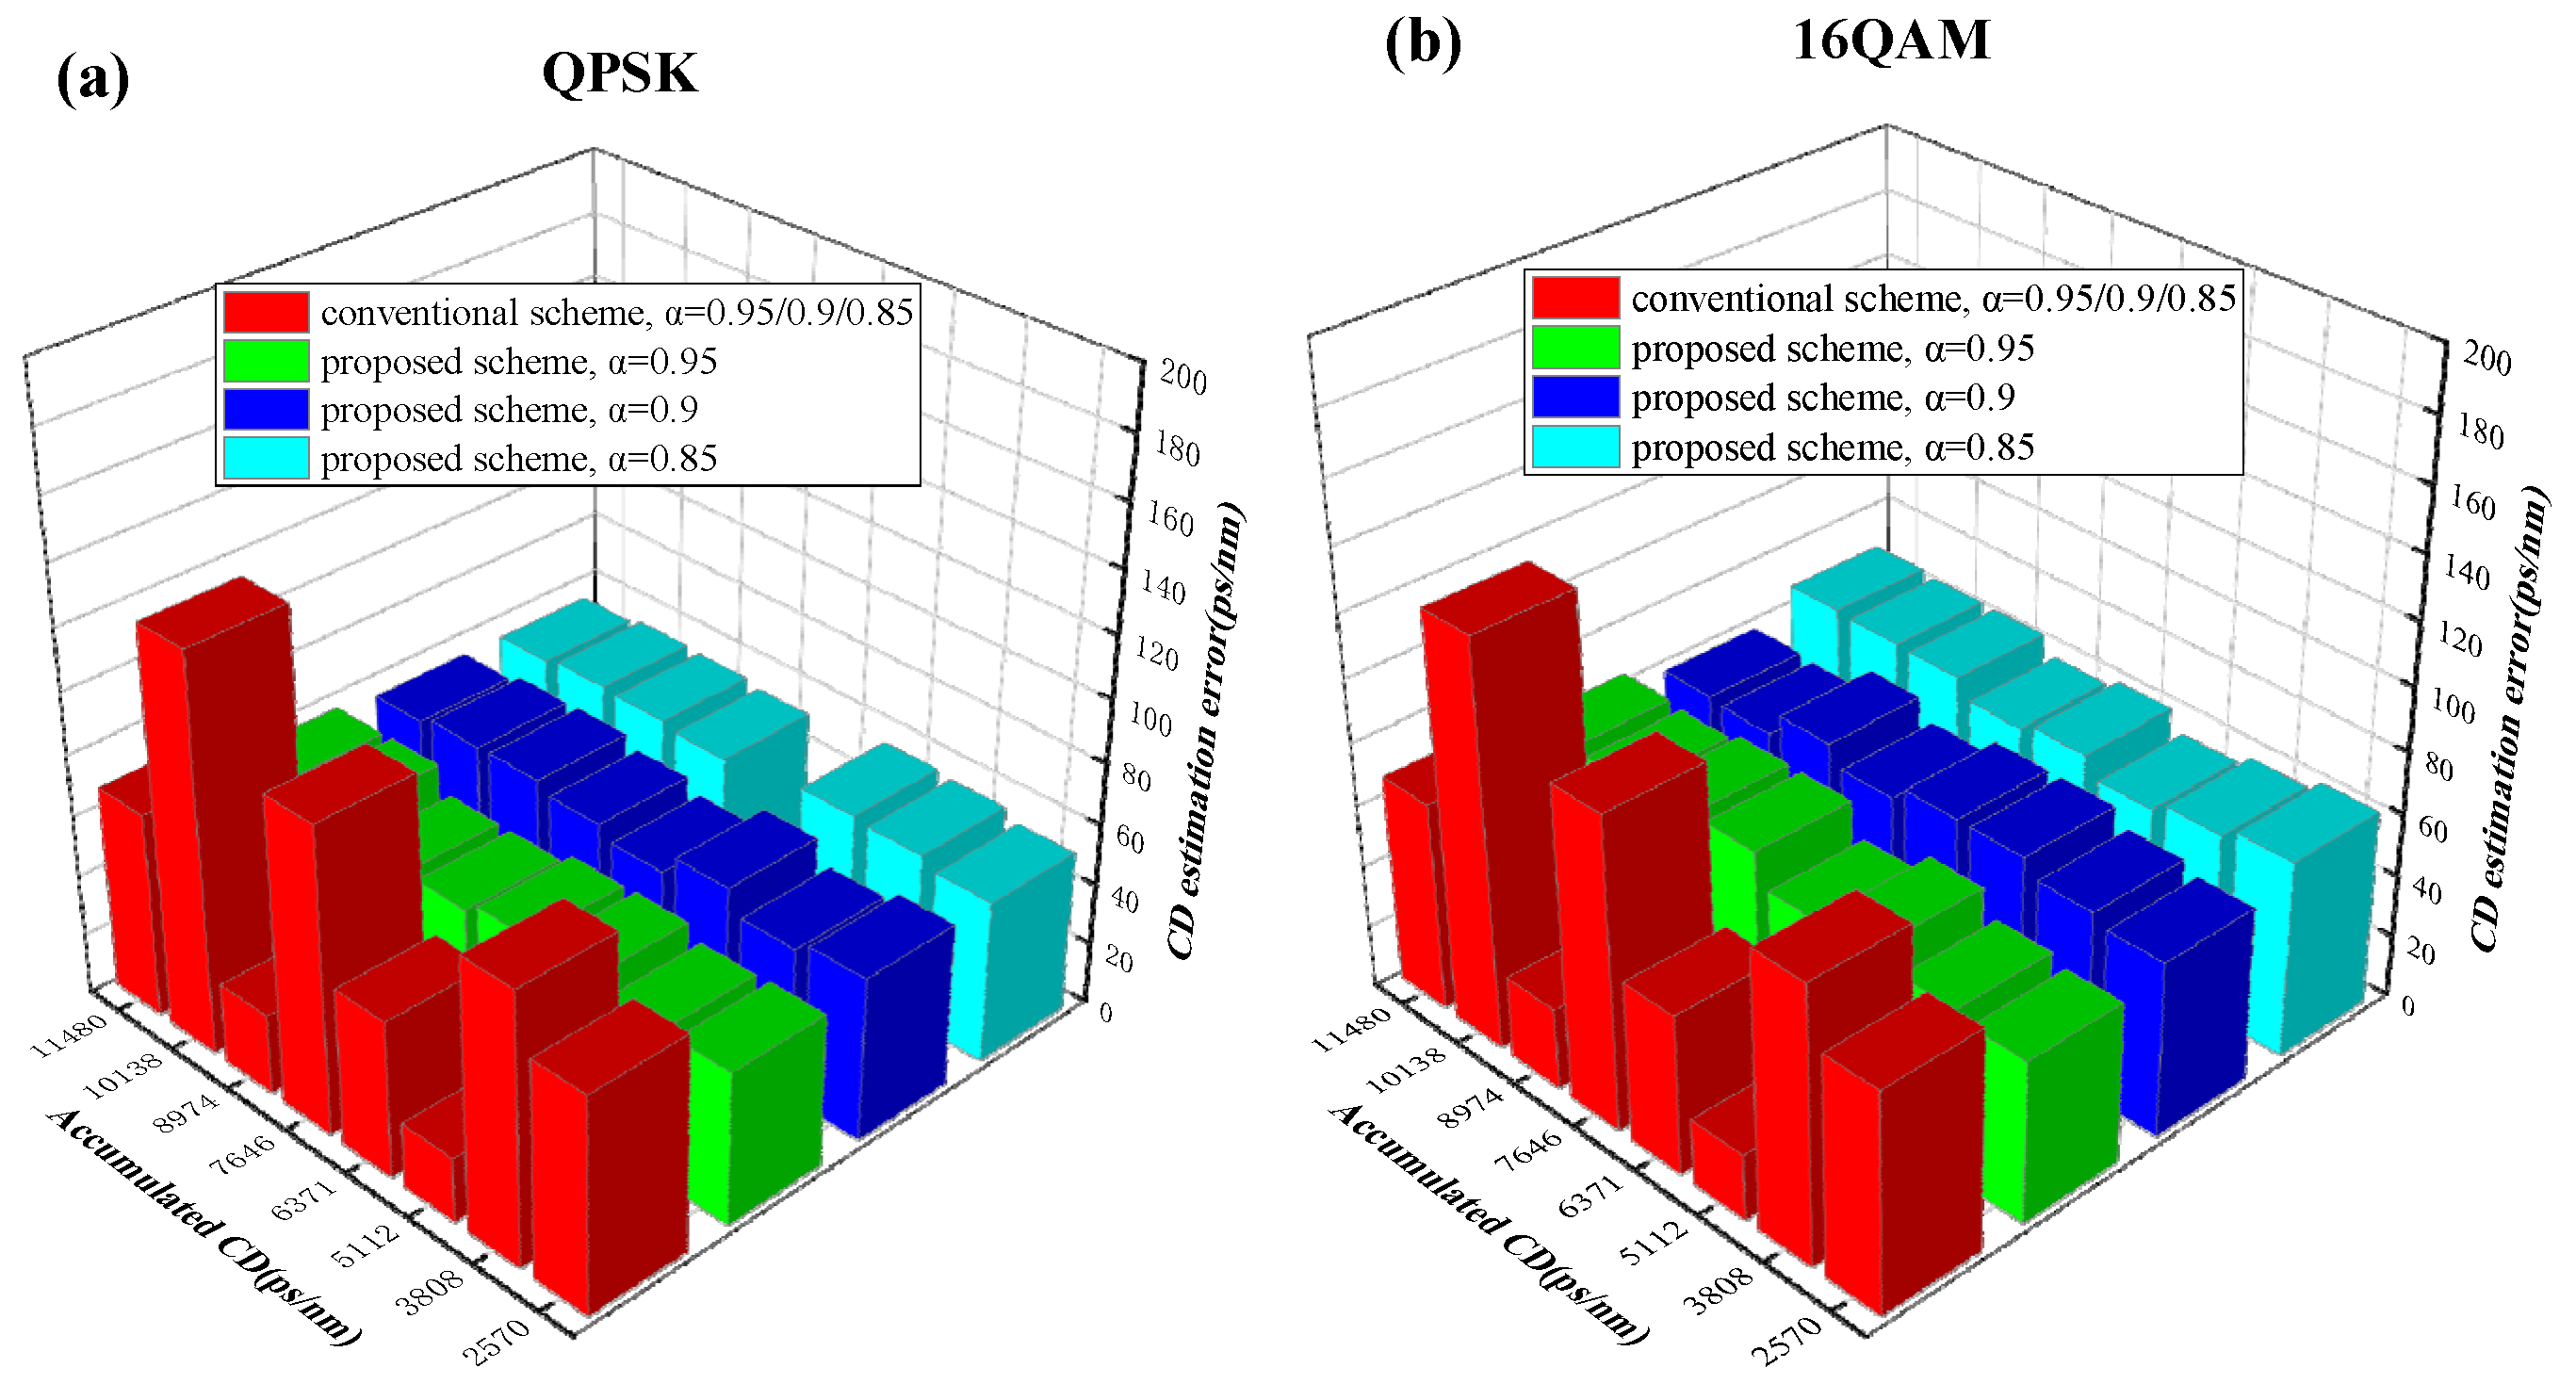
3.3. Evaluation of the CD Estimation Performance

Firstly, in order to verify the tolerance of the ASE noise of the CDE scheme, we set different OSNR values and test the mean error of the CDE for 16QAM, when other system parameters are kept constant. The standard single-mode fiber (SSMF) transmission length is 960 km here. We also set p as 0.002, 0.008, 0.01, and 0.012 in order to fully evaluate the performance of the conventional blind CDE algorithm. The steps of CD scanning are about 200, 800, 1000 and 1200 ps/nm, respectively. Figure 6 shows the simulation results for CD estimation performance against different levels of OSNR for 16-QAM systems using the proposed two-stage scheme. It can be seen that a higher OSNR has a slightly positive impact on the estimation performance.
When the FTN acceleration factor α is greater than or equal to 0.85, the CDE performance decreases slightly with the decrease of α, but the difference between the conventional scheme and the proposed one is very small. Overall, the proposed CDE scheme exhibits a CDE accuracy better than 65 ps/nm. Theoretically, for the conventional scheme, the relationship between CDest and p is based on a set trigonometric function instead of a linear function such as formula (10). Besides this, accumulated CD is definite, and the principle of the algorithm makes the searchable CD a discrete value, such that there is a theoretical CDE deviation value. It can be calculated that the CDE errors are about 40, 160, 360 and 160 ps/nm, and we can see that the simulation results are consistent with the theory. Moreover, under the same CDE parameters, i.e., p = 0.002, the accuracy of the conventional blind CDE algorithm based on FrFT is almost equivalent to the CDE we proposed. At this time, the overall CC is reduced by about 97%. With the same fixed number of samples, the computational complexity of the blind CDE algorithm is reduced by increasing p. Even so, the computational complexity of the proposed CDE algorithm is still reduced by at least 85%, while the proposed method has better performance than the conventional one.
In addition, in order to further explore how different transmission distances, i.e., different accumulated CD, affect the performance of the CDE method, the simulation for CD estimation performance against different levels of CD is carried out in a 64Gbaud DP-16QAM FTN-WDM system. Here, accumulated CD is the product of the transmission distance and the CD coefficient of 16 ps/nm/km. Theoretically, the first-stage CDE only determines the residual CD of the second-stage within a certain range that is not fixed. Therefore, as long as the accuracy of the second-stage estimation is high enough, the CDE error of our scheme should be random and relatively small, and the error should basically remain at the same level under different transmission distances. The simulation result proves the above analysis. It can be seen from Figure 7 that the performance of the CDE algorithm is very robust even when the acceleration factor is 0.85. The MECD is about 55 ps/nm. However, for the conventional blind CDE, the accumulated CD of transmission in one circle is 1280 ps/nm, which is not integer times of the CD search granularity, such that the estimated error varies periodically under such a 200 ps/nm CD search granularity. This is because with the fixed CD searching granularity, the CD estimation performance is very stable even when the acceleration factor is as low as 0.85. If the CD search granularity becomes very small, the differences among different α will become apparent with larger CC. On the contrary, benefitting from the two-stage structure of the proposed algorithm, the proposed algorithm exhibits more stable and accurate CD estimation performance.
As we all know, differential group delay (DGD) is one of the important link impairments affecting signal quality, especially in a high-order QAM system. Here, we also simulate the average error of CDE under different DGD in to explore the effect of DGD on the performance of the CDE method. The residual CD and DGD can be compensated using an adaptive equalization algorithm based on a multi-tap finite impulse response (FIR) filter. The results show that the performance of the proposed CDE algorithm decreases with the increase of DGD regardless of the transmission distance in Figure 8. When the DGD is small, the CD estimation performance is mainly determined by the algorithm parameters, and the influence of the acceleration factor α is very small, such that the performance of the CDE is basically the same. However, as the transmission distance increases, the DGD increases, and the ASE noise on the link becomes more and more serious; thereby, the CD estimation is worse for long-distance transmission than for short transmissions. Besides, in the case of large DGD, due to the small acceleration factor, the ISI of the FTN signal is severe, and the CD estimation performance is relatively degraded. Taking the 130 pm/nm residual CD that the FIR equalizer can tolerate as the threshold, the minimum tolerable DGD of the proposed algorithm is about 27 ps.

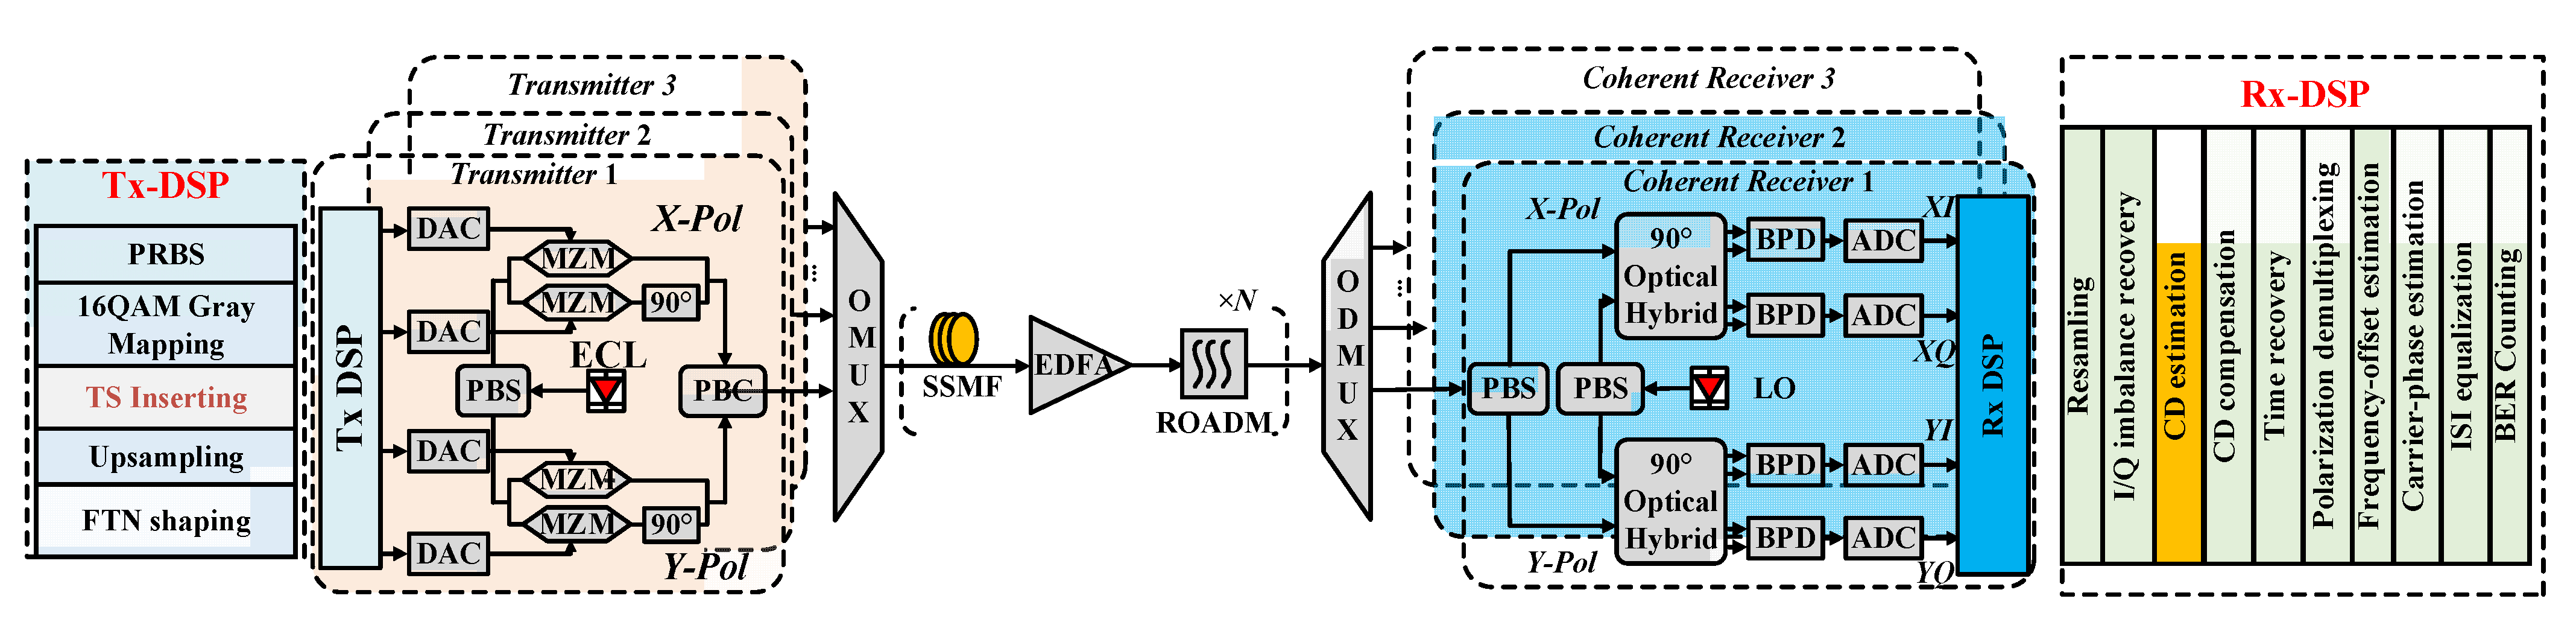
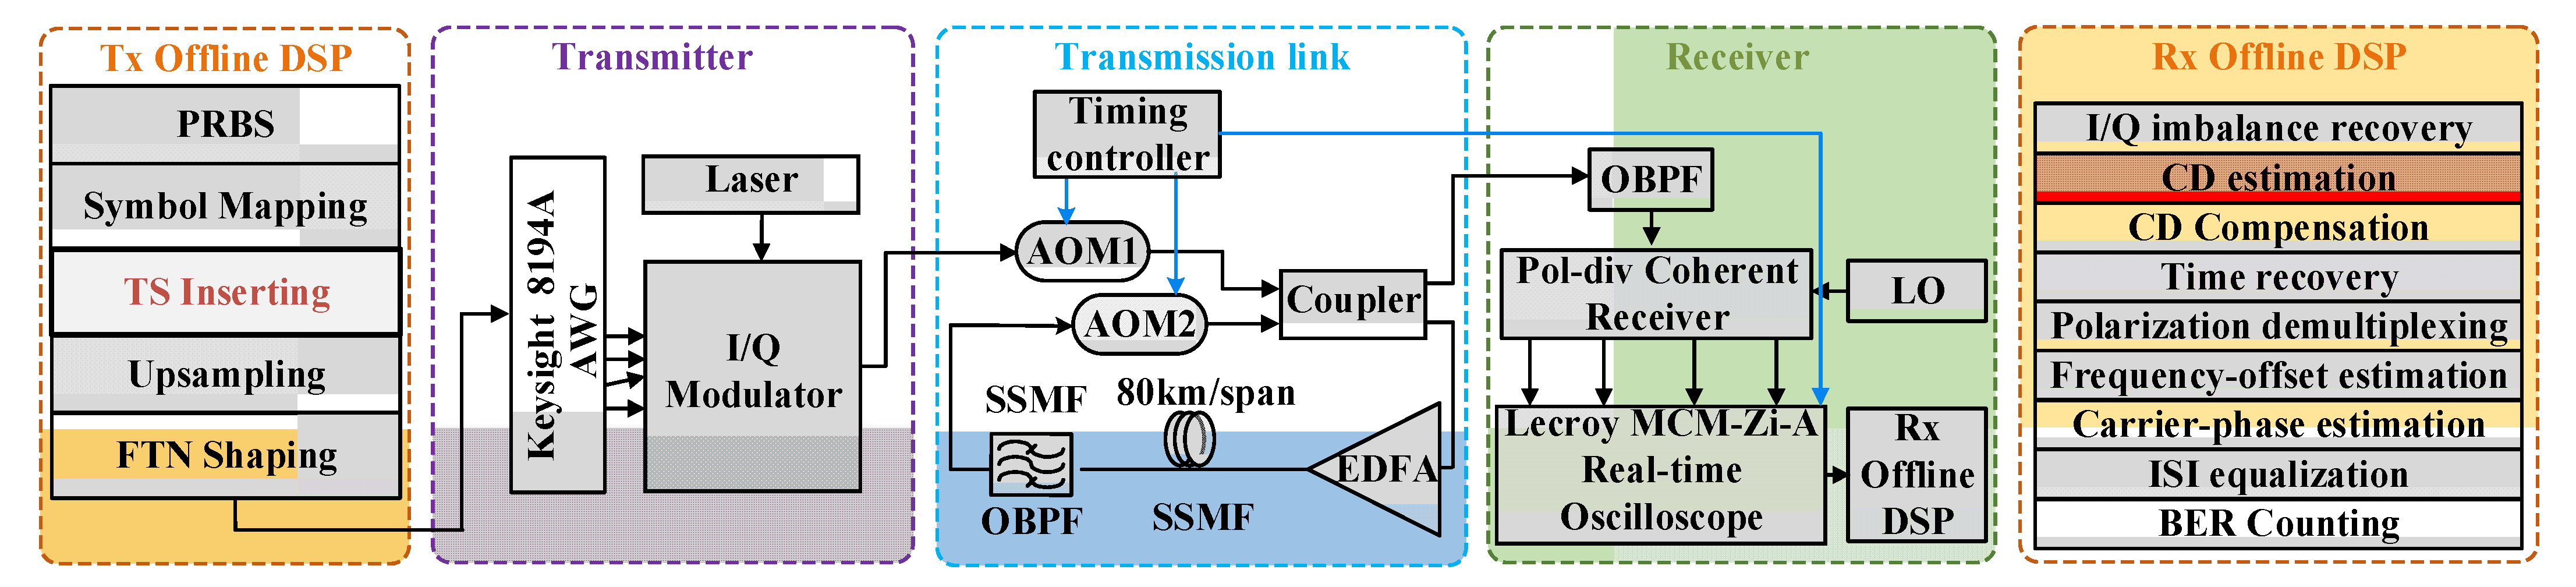
4. Experimental Setup and Performance Analysis

In order to further verify the practical performance of the proposed CDE algorithm, multi-span fiber transmission experiments were carried out. Figure 9 shows the experimental setup of 60-GBaud DP-QPSK and DP-16QAM coherent optical systems. In the transmitter-side offline DSP, firstly, 219-1 pseudorandom bit sequences (PRBS) were generated and then mapped into Gray-mapped DP-QPSK/16QAM symbols. The TS was inserted at the transmitter side, as shown in Figure 1. Note that the FEC encoding was not employed in the experiment, and FTN pulse shaping was realized in the digital domain by FIR filters here. Then, the discrete signals after FTN filtering were sent into four synchronized channels of an arbitrary waveform generator (AWG, Agilent 8194A) working at 120 GSa/s with a ~36-GHz 3-dB analog bandwidth. Double oversampling was performed to generate 60Gbaud electrical signals, and tunable external cavity lasers (ECL) with a ~50 kHz measured linewidth were used as the carrier laser. The AWG output differential electrical signals drove a DP I/Q modulator. Then, the modulated carrier was launched into a re-circulating transmission fiber loop, which consisted of a timing controller, an optical coupler, an acousto-optic modulator (AOM)-based optical switch, a fiber span of 80 km SSMF with an attenuation of 0.17 dB/km and CD of 16 ps/nm/km, and an EDFA. Here no inline or pre/post-optical CD compensation were used in the experiment. Note that due to experimental equipment limitation, the shortest distance supported by the fiber loop was 80 × 2 km. After each fiber loop transmission, FTN DP-QPSK/16QAM signals were send to a programmable optical band pass filter (OBPF) with 0.5 nm 3-dB bandwidth and 1 GHz resolution. At the receiver side, another ECL with ~50-kHz linewidth was used as the LO in order to realize coherent detection. The FTN DP-QPSK/16QAM optical signal was sampled using an 80-GSa/s real-time sampling oscilloscope after photoelectric conversion for offline processing. The offline DSP flow is also shown in Figure 9. Firstly, it lowered the sample to two samples per symbol and compensated for IQ imbalance. Then, the proposed and referenced CDE algorithms were implemented before CD compensation. Next, after timing recovery, a radius-directed equalization (RDE) algorithm was employed for the purpose of ISI pre-equalization and polarization de-multiplexing. The frequency offset estimation and carrier phase estimation were subsequently carried out before performing the ISI mitigation based on the post-filter + MLSE scheme. Finally, more than 106 symbols were used for BER counting.
Figure 10 shows the total accumulated CD versus the estimated CD under different FTN acceleration factors α, in the case of an 160–720 km SSMF optical fiber transmission distance. It was observed that both the proposed CDE and conventional blind scheme exhibit substantially equivalent performance. However, because the FTN coherent optical system was extremely sensitive to residual CD, the large CD estimation error will cause the subsequent DSP algorithm to fail to work. Therefore, it was necessary to further quantitatively analyze the error of CD estimation.
Figure 11a,b show the mean value of the absolute CDE error in a 60Gbaud DP-QPSK and DP-16QAM experimental system with various link lengths. Although the CDE accuracy fluctuates, it is in the overall range of 40–70 ps/nm. The CDE performance of the 16QAM system was slightly lower than that of the QPSK system, but the difference was small, and the performance has no obvious correlation when α is greater than or equal to 0.85. Compared with the traditional blind CDE algorithm, the CD estimation performance of the proposed algorithm was more stable in both QPSK and 16QAM systems. In addition, as is consistent with the simulation, the CDE error of the blind CDE algorithm varied periodically with the CDreal value. Therefore, our proposed CDE algorithm has better estimation accuracy and more robust working stability under different modulation formats with different transmission distances and acceleration factors.

5. Conclusions

In this paper, a low-complexity and highly robust CD estimation scheme for FTN signals was proposed and demonstrated. Taking advantage of a structure combining a designed training sequence with an improved FrFT method, our proposed scheme could estimate CD roughly but reliably in the first stage, and could further facilitate accurate CDE in second stage with very low CC. Complexity analysis showed that, compared with the conventional blind CDE scheme based on FrFT, the overall CC of the proposed scheme is reduced by about 97%, whilst it still maintains better CD estimation performance. Comprehensive simulation results of triple-carrier 64-GBaud FTN-WDM systems show that the CDE accuracy of the proposed scheme is 65 ps/nm over various transmission distances with CD ranges of 2560~15,360 ps/nm for 64-GBaud DP-16QAM signals. Besides this, the long-haul transmission simulation results show that it can tolerate a DGD of at least 27 ps. Furthermore, 60-GBaud DP-QPSK and DP-16QAM signals were generated in experiments for transmission over various distances, and the worst CD estimation errors were 60 ps/nm and 70 ps/nm for QPSK and the 16QAM system, further proving that compared with the conventional CDE methods, only 256 training symbols and overall 3% CC are needed in order to achieve more accurate and more robust CD estimation no matter the different modulation formats, different acceleration factors, and different CD ranges. Therefore, with its low complexity and strong robustness, this CD estimation scheme is a preferable candidate for practical FTN coherent optical systems.

Author Contributions

Conceptualization, T.Y. and X.C.; formal analysis, T.Y. and Y.J.; investigation, T.Y., Y.J. and Y.W.; data curation, T.Y. and X.C.; writing—original draft preparation, T.Y., Y.J. and J.Y.; writing—review and editing, T.Y., L.W. and X.C.; visualization, T.Y. and Y.J.; supervision, T.Y., Y.J., Y.W., J.Y., L.W. and X.C.; project administration, T.Y. and X.C. All authors have read and agreed to the published version of the manuscript.

Funding

This work is partly supported by the National Natural Science Foundation of China (62001045), Beijing Municipal Natural Science Foundation (4214059), the Fund of State Key Laboratory of IPOC (BUPT) (IPOC2021ZT17), and Fundamental Research Funds for the Central Universities (2022RC09).

Institutional Review Board Statement

Not applicable.

Informed Consent Statement

Not applicable.

Data Availability Statement

The data presented in this study are available on request from the corresponding author. The data are not publicly available because the data also form part of an ongoing study.

Acknowledgments

The authors express their appreciation to the reviewers for their valuable suggestions.

Conflicts of Interest

The authors declare no conflict of interest.

References

  1. Zhou, G.; Jiang, T.; Xiang, Y.; Tang, M. FrFT based blind chromatic dispersion estimation mitigating large DGD induced uncertainty. In Proceedings of the Asia Communications and Photonics Conference 2020, Beijing, China, 24–27 October 2020; p. M4A.305. [Google Scholar]
  2. Jiang, H. Joint Time/Frequency Synchronization and Chromatic Dispersion Estimation with Low Complexity Based on a Superimposed FrFT Training Sequence. IEEE Photonics J. 2018, 10, 1–10. [Google Scholar]
  3. Wang, Y.; Liang, J.; Zhou, W.; Wang, W. Accurate chromatic dispersion estimation for Nyquist and Faster Than Nyquist Coherent Optical Systems. In Proceedings of the Asia Communications and Photonics Conference 2021, Shanghai, China, 24–27 October 2021; p. T4A.61. [Google Scholar]
  4. An, S.; Li, J.; Li, X.; Su, Y. FTN SSB 16-QAM Signal Transmission and Direct Detection Based on Tomlinson-Harashima Precoding with Computed Coefficients. J. Lightwave Technol. 2021, 39, 2059–2066. [Google Scholar] [CrossRef]
  5. Li, S.; Yuan, W.; Yuan, J.; Bai, B.; Wing Kwan Ng, D.; Hanzo, L. Time-Domain, vs. Frequency-Domain Equalization for FTN Signaling. IEEE Trans. Veh. Technol. 2020, 69, 9174–9179. [Google Scholar] [CrossRef]
  6. Ibrahim, A.; Bedeer, E.; Yanikomeroglu, H. A Novel Low Complexity Faster-than-Nyquist (FTN) Signaling Detector for Ultra High-Order QAM. IEEE Open J. Commun. Soc. 2021, 2, 2566–2580. [Google Scholar] [CrossRef]
  7. Hauske, F.N.; Geyer, J.; Kuschnerov, M.; Piyawanno, K.; Lankl, B.; Duthel, T.; Fludger, C.R.S.; van den Borne, D.; Schmidt, E.-D.; Spinnler, B. Optical performance monitoring from FIR filter coefficients in coherent receivers. In Proceedings of the Optical Fiber Communication Conference, San Diego, CA, USA, 24–28 February 2008; p. OThW2. [Google Scholar]
  8. Hauske, F.N.; Zhang, Z.; Li, C.; Xie, C.; Xiong, Q. Precise, robust and least complexity CD estimation. In Proceedings of the Optical Fiber Communication Conference, Los Angeles, CA, USA, 6–10 March 2011; p. JWA032. [Google Scholar]
  9. Malouin, C.; Thomas, P.; Zhang, B.; O’Neil, J.; Schmidt, T. Natural Expression of the Best-Match Search Godard Clock-Tone Algorithm for Blind Chromatic Dispersion Estimation in Digital Coherent Receivers. In Proceedings of the Photonics Congress, Colorado Springs, CO, USA, 19–21 June 2012; p. SpTh2B.4. [Google Scholar]
  10. Xie, C. Chromatic Dispersion Estimation for Single-Carrier Coherent Optical Communications. IEEE Photonics Technol. Lett. 2013, 25, 992–995. [Google Scholar] [CrossRef]
  11. Ospina, R.S.B.; dos Santos, L.F.D.; Mello, A.A.; Ferreira, F.M. Scanning-Based Chromatic Dispersion Estimation in Mode-Multiplexed Optical Systems. In Proceedings of the 21st International Conference on Transparent Optical Networks (ICTON), Angers, France, 9–13 July 2019; pp. 1–4. [Google Scholar]
  12. Pereira, F.C.; Rozental, V.N.; Camera, M. Experimental Analysis of the Power Auto-Correlation-Based Chromatic Dispersion Estimation Method. IEEE Photonics J. 2013, 5, 7901608. [Google Scholar] [CrossRef]
  13. Sui, Q.; Lau, A.P.T.; Lu, C. Fast and Robust Blind Chromatic Dispersion Estimation Using Auto-Correlation of Signal Power Waveform for Digital Coherent Systems. J. Lightwave Technol. 2013, 31, 306–312. [Google Scholar] [CrossRef]
  14. Zhou, H. A fast and robust blind chromatic dispersion estimation based on fractional fourier transformation. In Proceedings of the European Conference on Optical Communication (ECOC), Valencia, Spain, 27 September–1 October 2015; pp. 1–3. [Google Scholar]
  15. Sun, X.; Zuo, Z.; Su, S.; Tan, X. Blind Chromatic Dispersion Estimation Using Fractional Fourier Transformation in Coherent Optical Communications. In Proceedings of the IEEE International Conference on Artificial Intelligence and Information Systems (ICAIIS), Dalian, China, 20–22 March 2020; pp. 339–342. [Google Scholar]
  16. Zhou, H. Fractional Fourier Transformation-Based Blind Chromatic Dispersion Estimation for Coherent Optical Communications. J. Lightwave Technol. 2016, 34, 2371–2380. [Google Scholar] [CrossRef]
  17. Wang, W.; Qiao, Y.; Yang, A.; Guo, P. A Novel Noise-Insensitive Chromatic Dispersion Estimation Method Based on Fractional Fourier Transform of LFM Signals. IEEE Photonics J. 2017, 9, 1–12. [Google Scholar] [CrossRef]
  18. Do, C.C. Data-Aided Chromatic Dispersion Estimation for Polarization Multiplexed Optical Systems. IEEE Photonics J. 2012, 4, 2037–2049. [Google Scholar] [CrossRef]
  19. Ma, Y. Training Sequence-Based Chromatic Dispersion Estimation with Ultra-Low Sampling Rate for Optical Fiber Communication Systems. IEEE Photonics J. 2018, 10, 1–9. [Google Scholar] [CrossRef]
  20. Wu, F.; Guo, P.; Yang, A.; Qiao, Y. Chromatic Dispersion Estimation Based on CAZAC Sequence for Optical Fiber Communication Systems. IEEE Access 2019, 7, 139388–139393. [Google Scholar] [CrossRef]
  21. Li, J.; Wang, D.; Zhang, M. Low-Complexity Adaptive Chromatic Dispersion Estimation Scheme Using Machine Learning for Coherent Long-Reach Passive Optical Networks. IEEE Photonics J. 2019, 11, 1–11. [Google Scholar] [CrossRef]
  22. Tang, D.; Wang, X.; Zhuang, L.; Guo, P.; Yang, A.; Qiao, Y. Delay-Tap-Sampling-Based Chromatic Dispersion Estimation Method with Ultra-Low Sampling Rate for Optical Fiber Communication Systems. IEEE Access 2020, 8, 101004–101013. [Google Scholar] [CrossRef]
Figure 1. Frame structure diagram.
Photonics 09 00657 g001
Figure 2. Block diagram of the proposed CDE scheme consisting of two stages: (a) the first coarse stage using TSs, and (b) the second fine stage using optimized FrFT.
Photonics 09 00657 g002
Figure 3. Simulation platform for a 64Gbaud DP-16QAM FTN-WDM system with the proposed CD estimation scheme.
Photonics 09 00657 g003
Figure 4. Distribution of the mean value of the absolute CDE error using 4096 samples when the step size of the order scanning and the granularity of the CD scanning are (a) 0.002 and 100 ps/nm, and (b) 0.004 and 200 ps/nm.
Photonics 09 00657 g004
Figure 5. Distribution of the mean value of the absolute CDE error using 8192 samples when the step size of the order scanning and the granularity of the CD scanning are (a) 0.001 and 100 ps/nm, and (b) 0.002 and 200 ps/nm.
Photonics 09 00657 g005
Figure 6. The mean value of the absolute CDE error vs. different OSNRs.
Photonics 09 00657 g006
Figure 7. The mean value of the absolute CDE error vs. different CDreal.
Photonics 09 00657 g007
Figure 8. The mean value of the absolute CDE error vs. different DGD.
Photonics 09 00657 g008
Figure 9. Experimental setup for 60-GBaud FTN DP-QPSK/16QAM coherent transmission systems.
Photonics 09 00657 g009
Figure 10. Accumulated CD vs. the CD estimated in (a) DP-QPSK and (b) DP-16QAM systems.
Photonics 09 00657 g010
Figure 11. (a) The mean value of the absolute CDE error in (a) DP-QPSK and (b) DP-16QAM systems.
Photonics 09 00657 g011
Table 1. Complexity comparison between the proposed and conventional CDE scheme.
AlgorithmReal MultiplicationReal Addition
Conventional CDE based on FrFT 4   log 2 N p 2   log 2 N p
Proposed two-stage CDE 4   log 2 2 L + 4 k · log 2 N p + 22 2   log 2 2 L + 2 k · log 2 N p + 18
Table 2. Performance of the CD estimation.
SamplepGranularity 100 ps/nm SamplepGranularity 200 ps/nm
MECDRCDMECDRCD
40960.002292~954096 0.004591~114
81920.001261~5781920.002540~109
Publisher’s Note: MDPI stays neutral with regard to jurisdictional claims in published maps and institutional affiliations.

