Article

Unidirectional Coherent Phonon Emission in an Optomechanic Nanobeam Containing Coupled Cavities

by
Alexander V. Korovin
1,2,
Yan Pennec
2 and
Bahram Djafari-Rouhani
2,*
1
V.E. Lashkaryov Institute of Semiconductor Physics NAS of Ukraine, 41 pr. Nauki, 03028 Kiev, Ukraine
2
Institut d’Electronique, de Microelectronique et de Nanotechnologie (IEMN), UMR CNRS 8520, Departement de Physique, Universite de Lille, 59655 Villeneuve d’Ascq, France
*
Author to whom correspondence should be addressed.
Photonics 2022, 9(9), 610; https://doi.org/10.3390/photonics9090610
Submission received: 29 July 2022 / Revised: 20 August 2022 / Accepted: 22 August 2022 / Published: 28 August 2022

Abstract

:
Nonreciprocal phonon emission is predicted theoretically from the coherent excitation of two coupled optomechanical cavities arranged along a phoxonic crystal nanobeam. The latter consists of a periodic array of holes and stubs and exhibits simultaneous photonic and phononic bandgaps. It is shown that nonreciprocal phonon emission arises from a combined effect of the spatial symmetry of the cavities and their underlying coupled phononic modes and the temporal phase shift between the excitation sources. This demonstration paves the way for the development of advanced integrated phonon networks and circuits, in which mechanical waves connect different elements in phononic and optomechanical structures.

1. Introduction

Resonant optomechanical (OM) systems [1,2,3] enhance the interaction of light with mechanical oscillators based on light and acoustic waves confinement in the same photonic/phononic (often referred as “phoxonic”) cavities [4,5,6,7,8,9,10,11,12], by means of high mechanical and optical Q resonances. Such cavities have been designed in phoxonic (or OM) crystals that exhibit simultaneously photonic and phononic band gaps [13,14,15]. Current research trends on OM structures include topics such as radiation–pressure cavity cooling [16,17], quantum coherent optomechanics [1,18], coherent coupling of optical and mechanical waves in piezoelectric optomechanical microcavities [19,20,21,22,23,24], and high resolution sensing, in particular the case of biomolecules [25,26,27]. The basic phonon circuits, typically taken into consideration, contain resonant mechanical cavities as promising building blocks of more complex devices, including filters, couplers, and mechanical sources/detectors. GHz phonons travelling in suspended nanobeams are good candidates as new state variable for signal transmission and processing in the microwave range of frequencies, owing to their small wavelength and radiationless propagation. The emerging field of OM cavities is expecting to enable on-chip photonic-operated phononic circuits [28]. The main drivers are the advanced nanofabrication techniques currently available for high spatial resolved microcavities, as well as the demonstration of self-oscillations/phonon lasing, up to the GHz range.
In addition, the mechanical interaction between two OM cavities can be exploited for synchronization purpose. A demonstration of such systems is provided in [29], where OM cavities, intercoupled by mechanical link, support independent optical modes oscillating in antiphase. Those modes can be temporarily de-synchronized by actuating one of the cavities with a heating laser, so that the two cavities oscillate independently. The control of the mechanical interaction opens the way to the realization of distributed networks of OM resonators, for a future technology platform, possibly CMOS compatible.
In this contribution, we perform a rigorous analysis of the phonon modulation resulting from opto-mechanical coupling in a system of two resonant cavities in a 1D corrugated silicon nanobeam. The numerical analysis is qualitatively explained with an analytical calculation with the help of a simple equivalent multilayer system. In the realistic OM nanobeam, the corrugation is made in the form of a quasi-periodic structure consisting of repeated holes and “wings” (lateral stubs) acting as periodic scatterers for bandgap engineering [10,11]. Two types of coupled resonant cavities will be considered, for which we recently demonstrated cavity phonon mode splitting [30]. In shape A, two cavities are introduced as two defects in the same quasi-1D phoxonic crystal, and in shape B, two quasi-1D phoxonic beams, each containing a single defect, are connected through a straight nanobeam. Before going to a full 3D finite element analysis of the coupled cavities in our OM nanobeam, we briefly explain the principle of unidirectional phonon propagation due to the interaction of phonons produced by the two defects acting as coherent sources.
The paper is organized as follows: Section 2 outlines the theory of unidirectional phonon propagation, based on the interaction of plane waves produced by two planar coherent sources, taking into account their specific symmetry. Section 3 presents the numerical 3D finite-element simulations of unidirectional phonon propagation for a system of two phonon resonators in 1D quasiperiodic nanobeam based structures. Final considerations will conclude the work.

2. Fundamentals for Two Levels Switching

To demonstrate the effect of unidirectional phonon emission, let us first consider the simpler case of a single homogeneous nanobeam along the x-axis with two harmonic sources of longitudinal displacement located at the points x1 and x2. Longitudinal displacement sources are characterized by positive real amplitudes S j ( S j > 0 , where j = 1 , 2 is the number of the source) and phases, ϕ j , (we will call them temporal phase shifts) and produce guiding waves with a wave vector k . Assuming the sources are coherent, the displacement in the nanobeam can be presented in the form:
u x ( x ) = S 1 e i ϕ 1 i k | x x 1 | + S 2 e i ϕ 2 i k | x x 2 | ,
As a result, the longitudinal component of the Poynting vector, averaged over the high frequency cycle, P x ( x , ω ) = c 11 ω Im ( u x * u x / x ) in the case of lossless medium ( Im ( k ) = 0 ), takes the form:
P x ( x ) = c 11 ω k { ( S 1 2 + S 2 2 + 2 S 1 S 2 cos ( k d ϕ ) ) , x < x 1 S 1 2 S 2 2 , x 1 < x < x 2 S 1 2 + S 2 2 + 2 S 1 S 2 cos ( k d + ϕ ) x 2 < x ,
where ϕ = ϕ 2 ϕ 1 is the temporal phase shift and d = x 2 x 1 is the spatial distance between the two sources, leading to the spatial phase k d , ω is the operation frequency, c 11 is the 11 (or xx)-components of the stress tensor (normal stress).
The corresponding power consumption form Equation (2) takes the form:
Δ P x P x ( x > x 2 ) P x ( x < x 1 ) = 2 c 11 ω k [ S 1 2 + S 2 2 + 2 S 1 S 2 cos ( k d ) cos ( ϕ ) ] .
From Equation (3), it results that the power consumption changes from a minimum value of Δ P x min = 2 c 11 ω k ( S 1 S 2 ) 2 (that is zero in the case S 1 = S 2 ) to a maximum value of Δ P x max = 2 c 11 ω k ( S 1 + S 2 ) 2 .
The case of equal amplitudes ( S 1 = S 2 = 1 ) is interesting to realize efficient redirection of the phonon flux from one port to another. Thus, the flux at the output port from Equation (2) is simplified as:
P x ( x ) = 2 c 11 ω Re ( k ) { 1 cos ( k d ϕ ) , x < x 1 0 x 1 < x < x 2 1 + cos ( k d + ϕ ) x 2 < x ,
and the power consumption given by Equation (3) takes the form:
Δ P x = 4 c 11 ω Re ( k ) ( 1 + cos ( ϕ ) cos ( k d ) ) ,
with a maximal power consumption of Δ P x max = 8 c 11 ω k , which corresponds to the quadruple value of the x-component of the Poynting vector for the single source. One can notice that the energy flux is always zero inside the region between the two sources in the case of equal amplitude due to reverse contribution of two identical energy fluxes with opposite propagation directions.
The relative output of the port can be defined as a ratio between the x component of the Poynting vector and the power consumption. Thus, using Equations (4) and (5), the relative output takes the following form:
T = 1 2 [ 1 + cos ( ϕ ) cos ( k d ) ] { 1 cos ( k d ϕ ) , x < ( x 1 < x 2 ) 0 , x 1 < x < x 2 1 + cos ( k d + ϕ ) ( x 1 < x 2 ) < x .
We considered two sources S1 and S2 distant of d and placed in a homogeneous medium, for a wave vector k. As we can see from Equation (4), playing with the temporal ( ϕ ) and spatial ( k d ) phase shifts, we can change the outputs of the ports. The energy flux, the power consumption and the relative outputs at ports P1 (blue) and P2 (red) are presented in Figure 1 for three spatial phases k d : π / 2 , 3 π / 4 and π . In Figure 1, we can observe two limit cases. In the first one (right panels in Figure 1), when the spatial phase k d = ± π + 2 π m ( m = 0 ; ± 1 ; ± 2 ; integer), the same output signals is obtained at each port, and they are zero when ϕ = 2 π m and maximum when ϕ = ± π + 2 π m . The opposite sign between the two outputs specifies the different direction of propagation. We will refer to this case as a “symmetric output”. In the second case (left panels in Figure 1), when the spatial phase k d = ± π / 2 + 2 π m , the same non-zero output signal is obtained at each port only at ϕ = π m . Moreover, the output signal is zero (resp. maximum) at port 1, and maximum (resp. zero) at port 2, when the temporal phase shift is ϕ = ± π / 2 + 2 π m (resp. ϕ = ± 3 π / 2 + 2 π m ). We will refer to this case as an “antisymmetric output”. In other words, the output level will be the same at ϕ = π m , and unidirectional at ϕ = ± π / 2 + 2 π m . The power consumption strongly depends on the interrelation between the spatial and the temporal phases, constant in the case of the spatial phase k d = ± π / 2 + 2 π m , and with an oscillation for the other spatial phases. In addition, other situations can occur like the zero-power consumption at k d = ± π + 2 π m and ϕ = 2 π m or the reverse situation for k d = ± π + 2 π m where the outputs are constant contrariwise to the power consumption.
Figure 2 presents deeply the evolution of the relative output at P2 as a function of the temporal phase, ϕ, and the spatial phase, k d . One can see the transformation of the output signal from a constant behavior ( k d = 0 or π ) to an oscillating curve when ( k d = π / 2 ).

3. Numerical Simulations

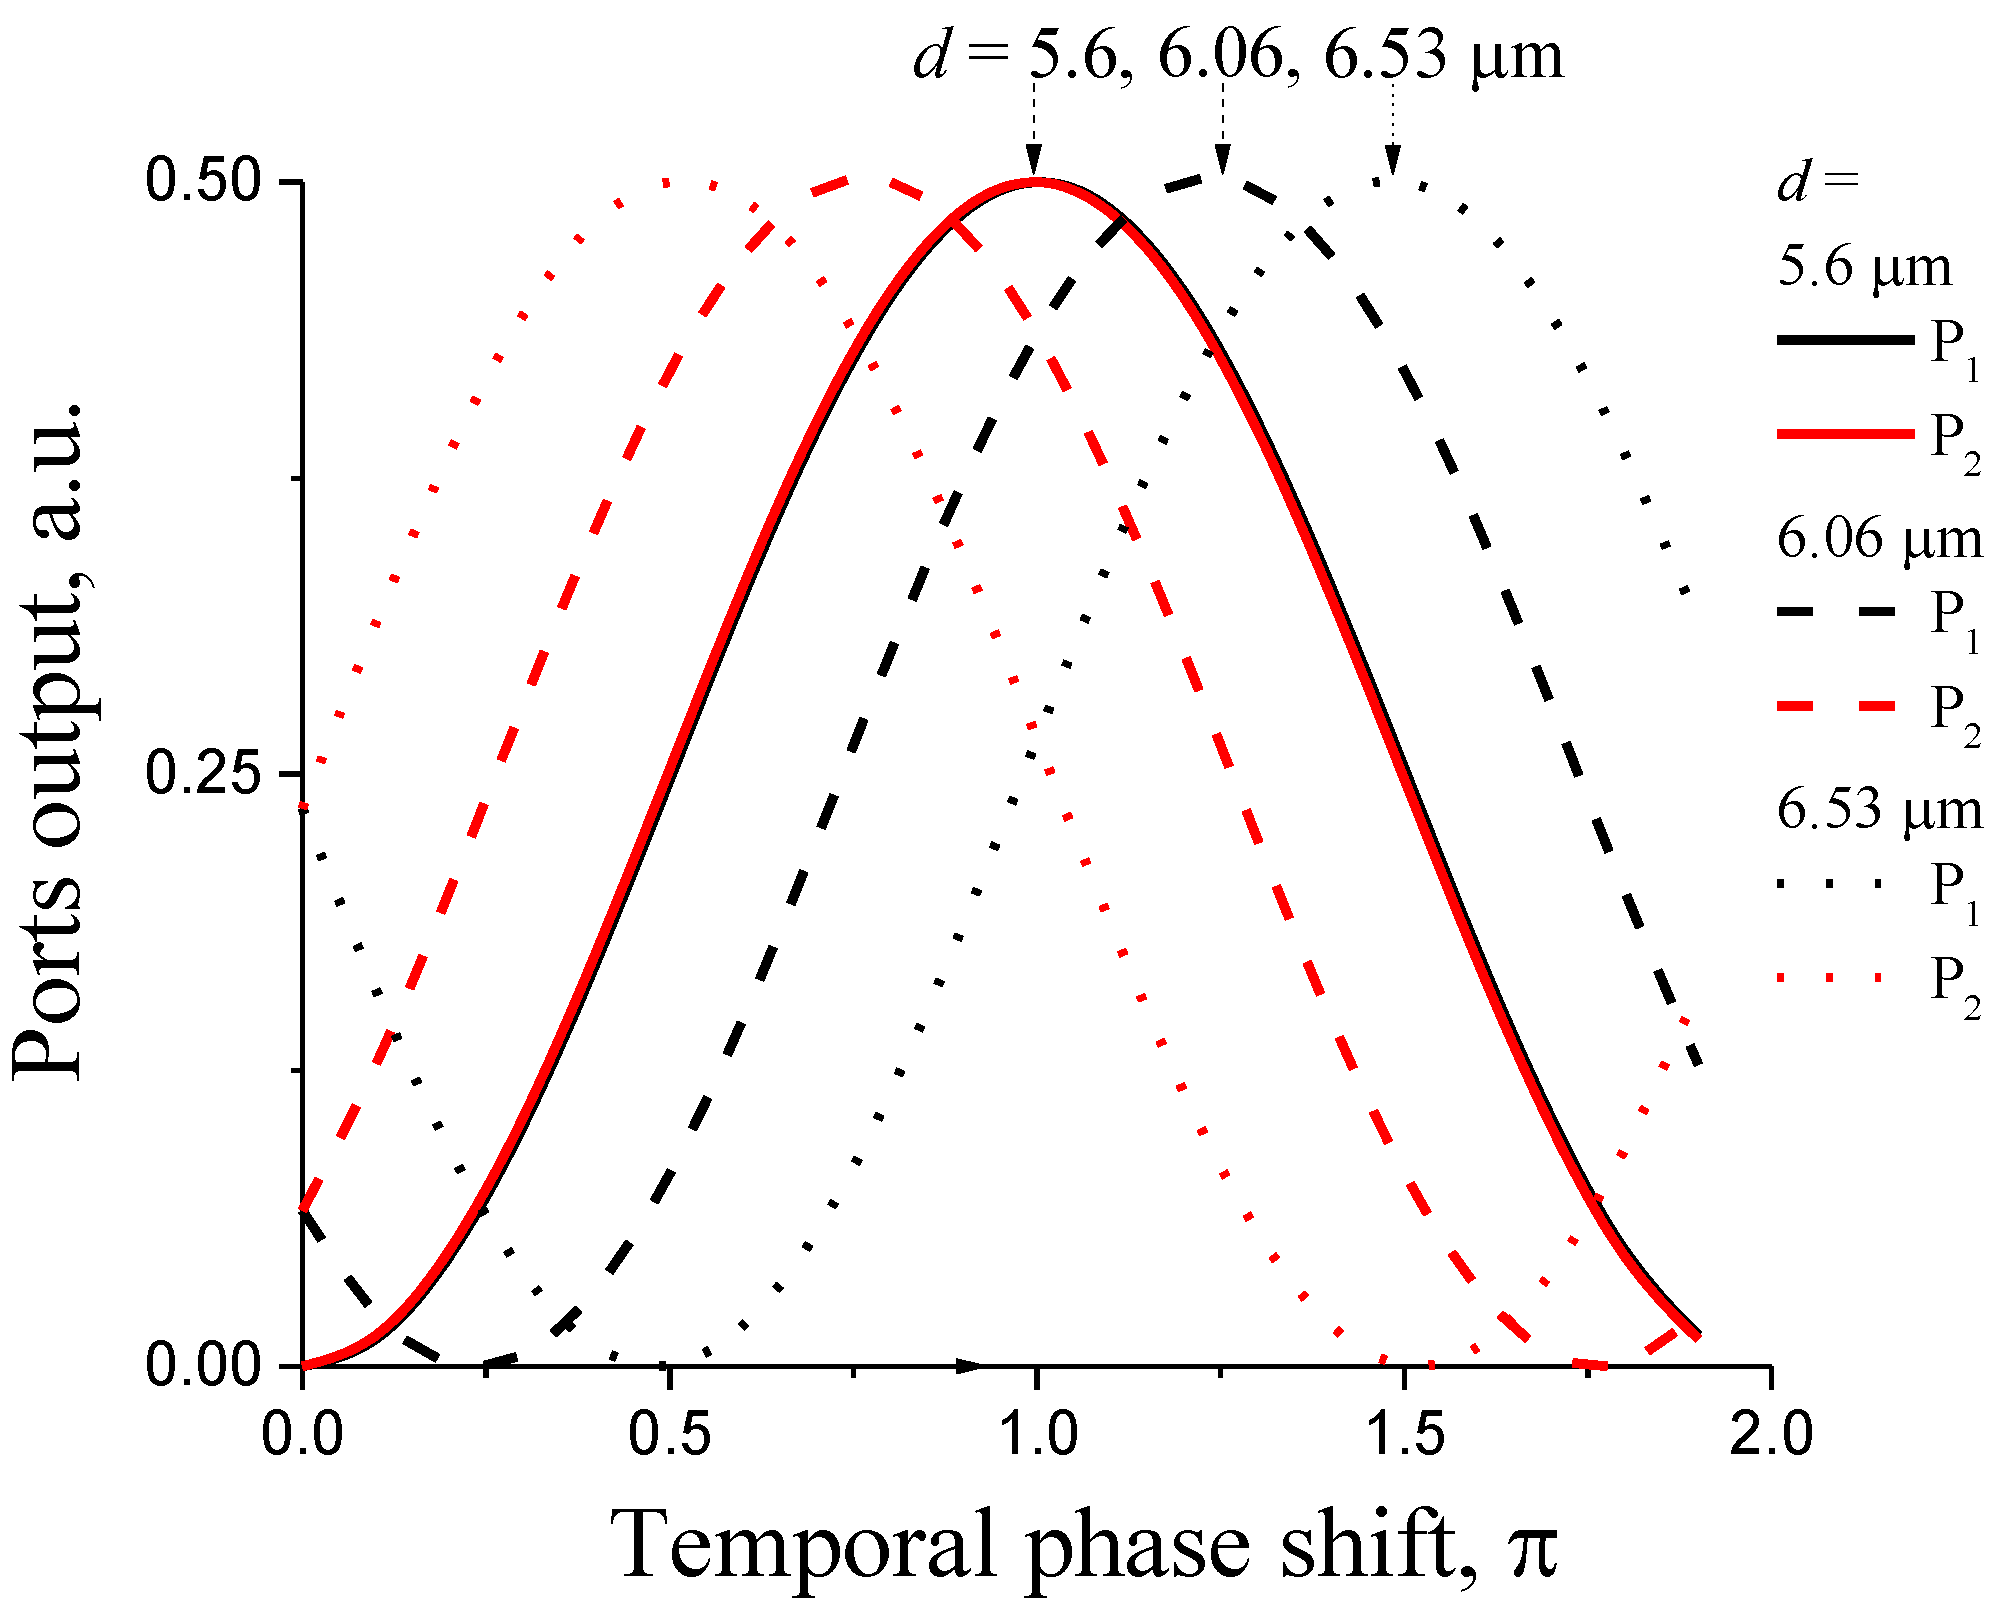
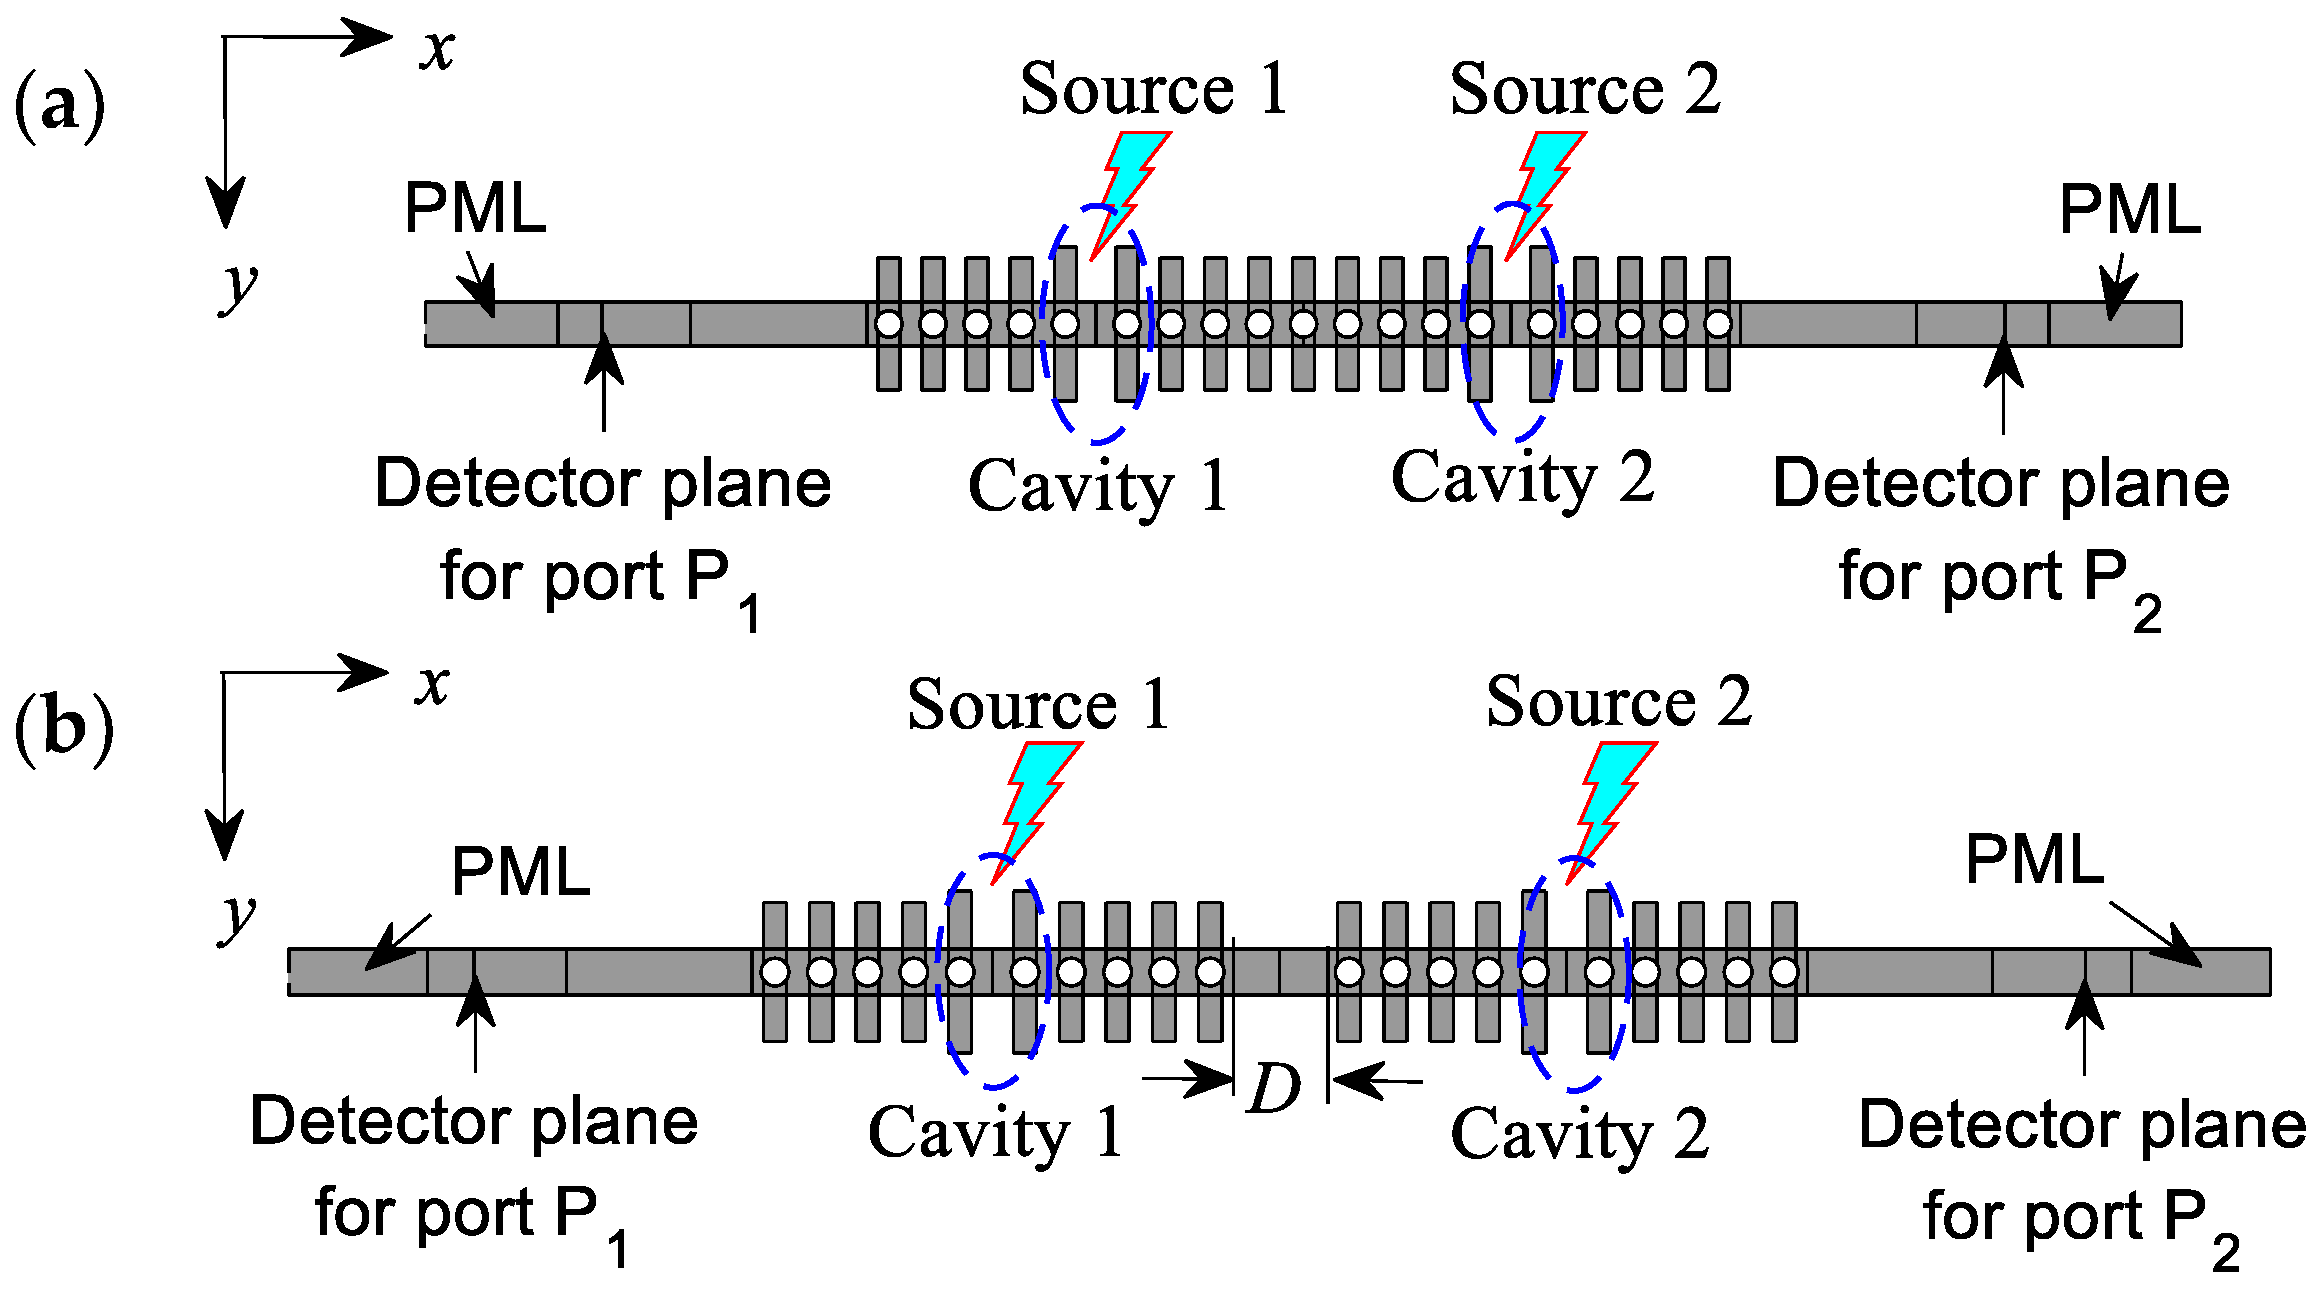
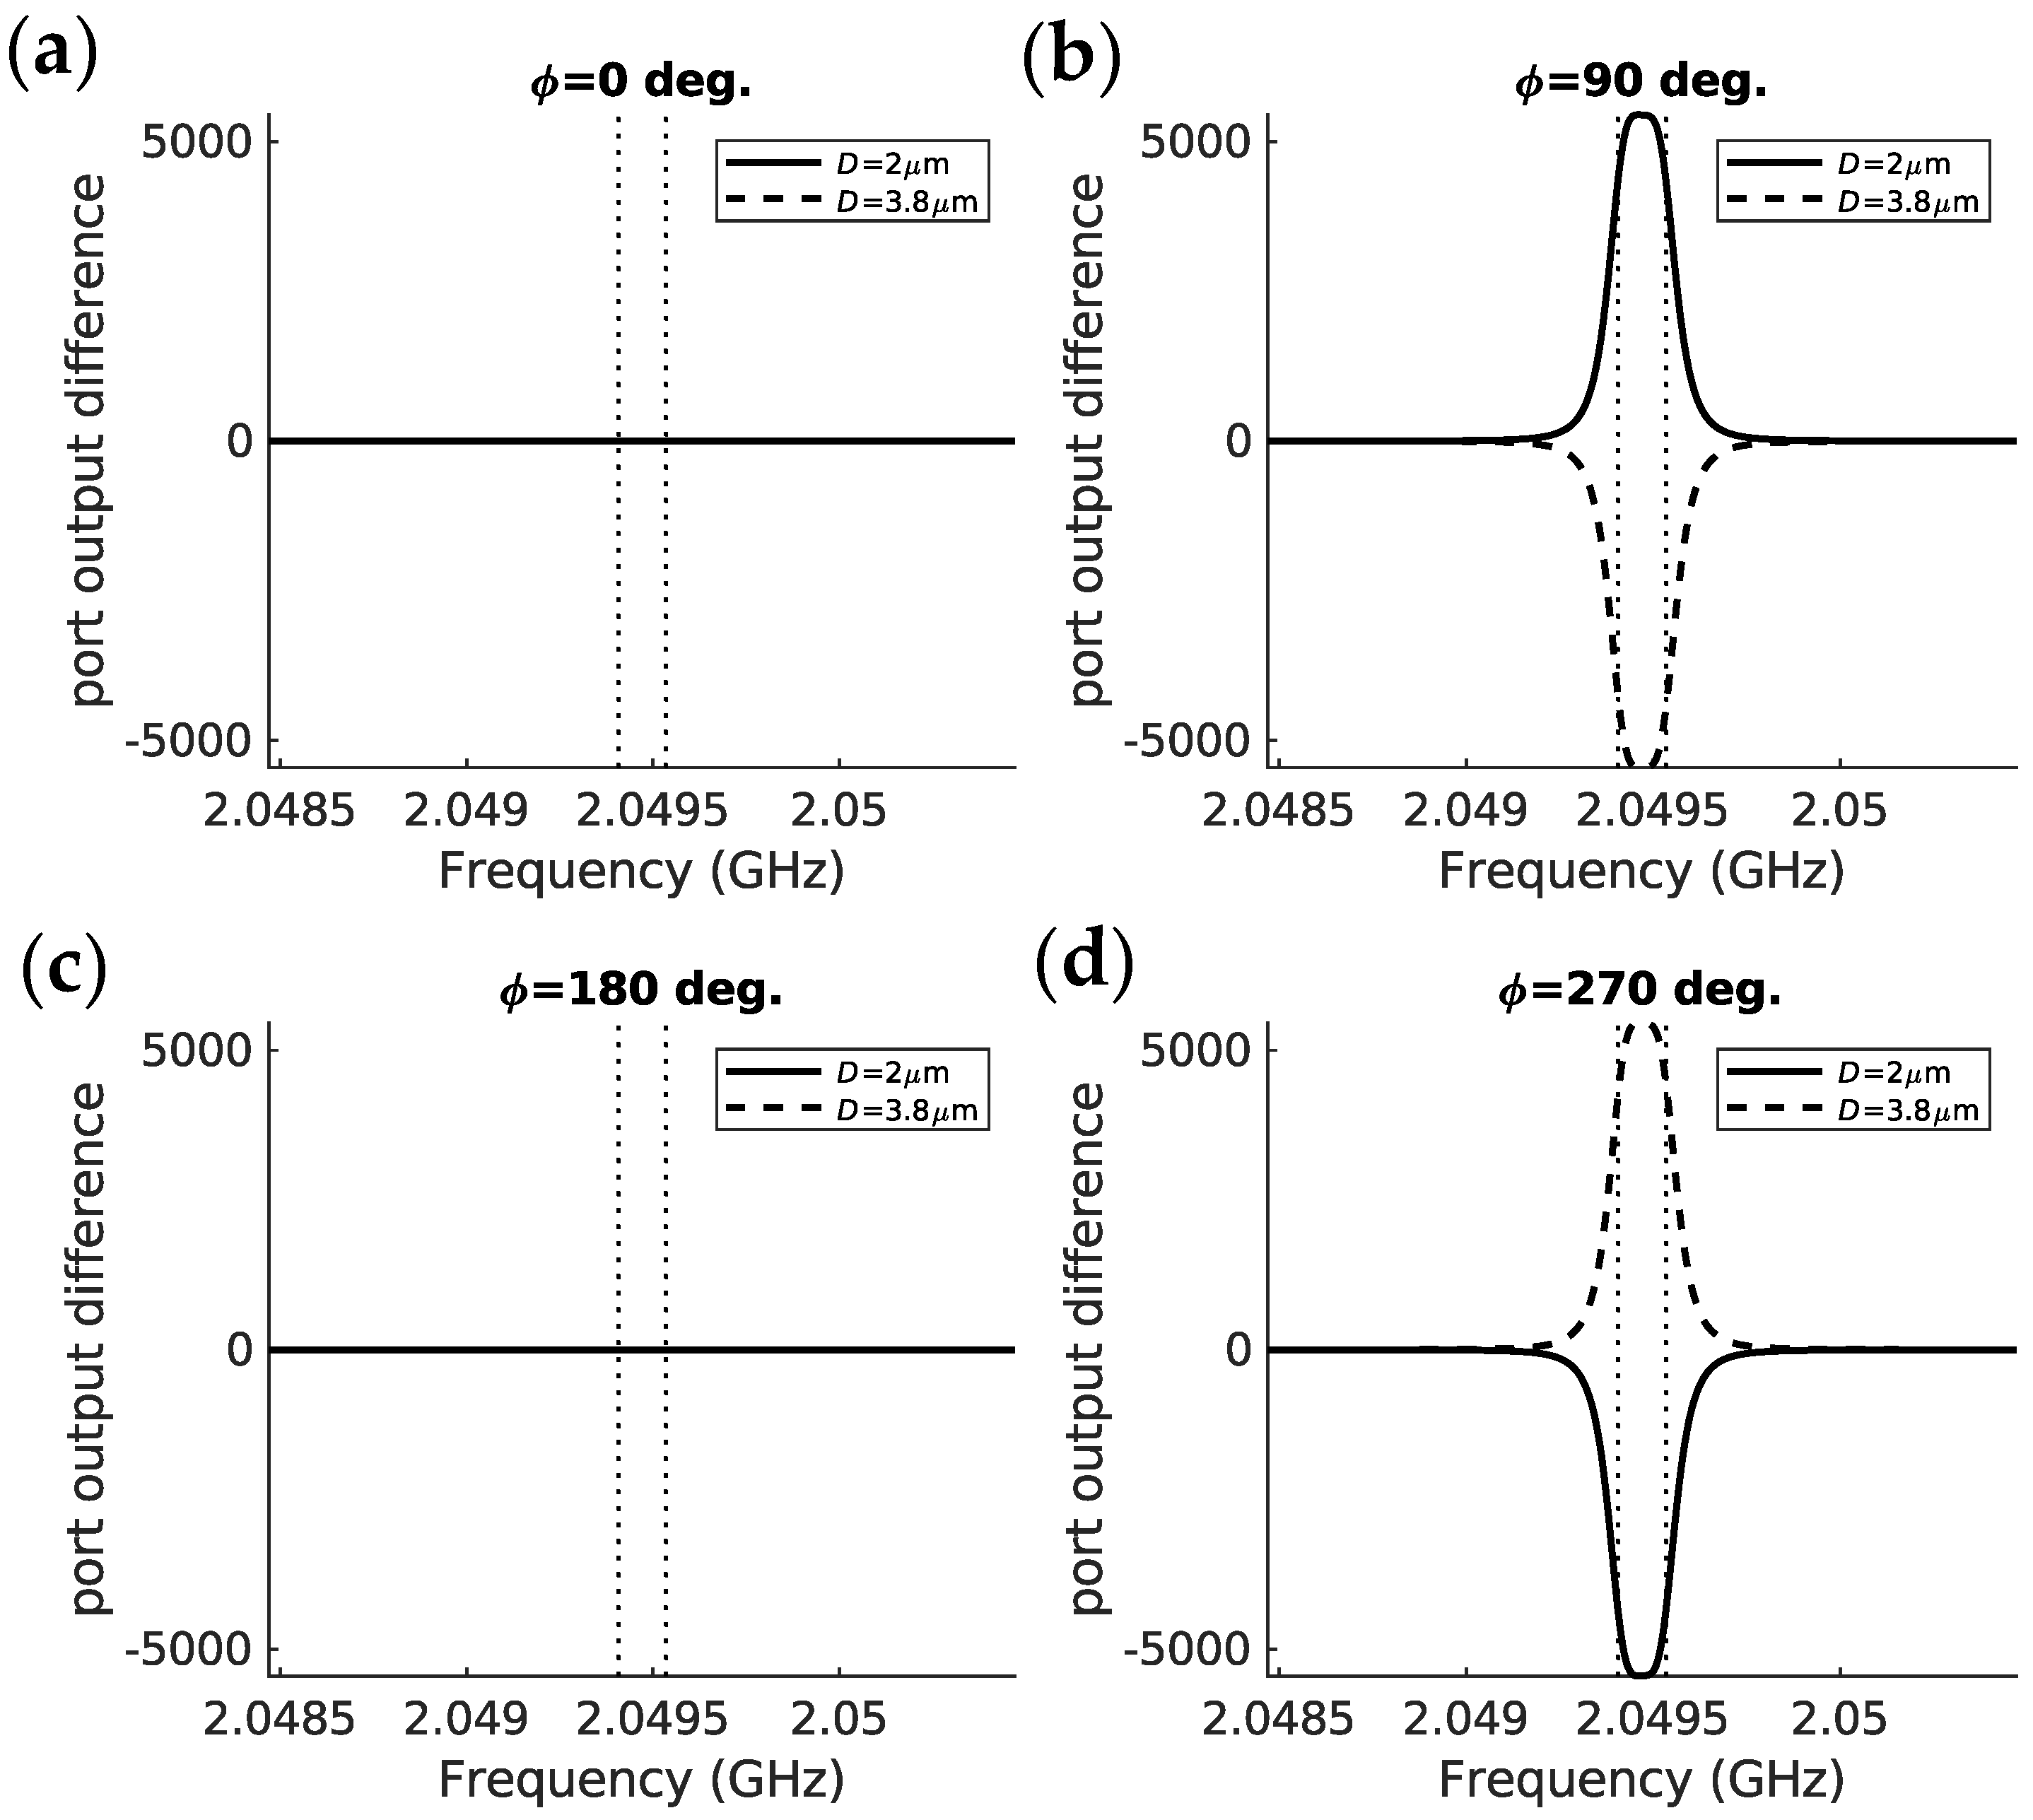
3.1. Two Coherent Sources in a Straight Phononic Waveguide

Let us consider two sources, distant of d from each other, inside a simple silicon nanobeam with a rectangular section ( a × e ) = (500 nm × 220 nm) (Figure 3a), where a is the width and e the thickness of the nanobeam. The structure presents a symmetric plane Π′′, parallel to the section. In the simulations, we used the finite-element method code (COMSOL® multiphysic). The silicon is considered as a cubic material with the elastic constants c11 = 166 GPa, c12 = 64 GPa and c44 = 79.6 GPa, and a mass density ρ = 2330 kg/m3. The two sources are generated under the excitation of two homogeneous forces per area with a longitudinal component along x of value 108 N/m2 and 108·eiφ N/m2. For ports, perfectly matched layers (PML) of length 9 a , as well as a free tetrahedral mesh (except for PML regions, where 6-layer swept meshes are used) with a minimal characteristic height of 2 nm were used.
Figure 3b shows the dispersion curves of the nanobeam, in which the blue line corresponds to the mode 4 with a displacement profile symmetric according to the planes Π′ and Π (symmetric in both y- and z-directions). Such longitudinal mode is well adapted to the optomechanical cavity studied in the next section. At the frequency of 2 GHz, which is well adapted to our optomechanic cavity studied in the next section the wavevector is k = 1.6848 × 10⁶ m−1. The corresponding value is indicated with an open black circle in the dispersion curves of Figure 3b.
As detailed in the previous section, the power at ports P1 and P2 depends on the distance between the two sources. The analytical model based on the equivalent stratified multilayer system with two coherent sources presented in Appendix A gives us two limit cases:
(a) if the spatial phase k d   between the two sources is ± π + 2 π m   , we deduce the spatial distance between the two sources d = (   ± 1 + 2 m   ) π / k = (1.9; 5.6; …) μm and we get the same power flux at both ports P1 and P2.
(b) if the spatial phase is k d   = ± π   / 2 + 2 π m   , we deduce d = ( ± 1 / 2 + 2 m ) π / k = (2.8; 6.53; …) μm leading to a redirection of the energy flux toward one direction, either P1 or P2. The bold values are the ones chosen for the illustrations given in the following.
This conclusion is supported by the illustration in Figure 4 where we reported the output at ports P1 and P2 as a function of the temporal phase shift, ϕ , between the two sources at different values of the distance d . As we can see from Figure 4, at d = 5.6 µm, the transmitted signal is the same at both ports whatever is the temporal phase between the two sources. We can tune the amplitude of the output signals from a maximum value ( ϕ = π ( m + 1 ) ) to zero ( ϕ = 2 π m ). When d = 6.53 µm, one can tune the signal from one port to another by changing the temporal phase between the two sources. This value of d = 6.53 µm is especially interesting, because the output results are very dependent on the temporal phase shift between the two sources. Indeed, we can get the following situations:
(i)
ϕ = 3 π / 2 (or - π / 2 ), the output is maximum at port P1 while at port P2 the output stays at zero;
(ii)
ϕ = π , the output is the same at both ports;
(iii)
ϕ = π / 2 , there is a situation opposite to (i), namely, the signal is maximum at port P2 and zero at P1, which in relation to (i) means switching the phonon flux from P1 to P2 when the phase changes from - π / 2 to π / 2 .
For other values of the distance, for example d = 6.06 µm, the modulation of the signal from one port to another is still possible but less efficient.

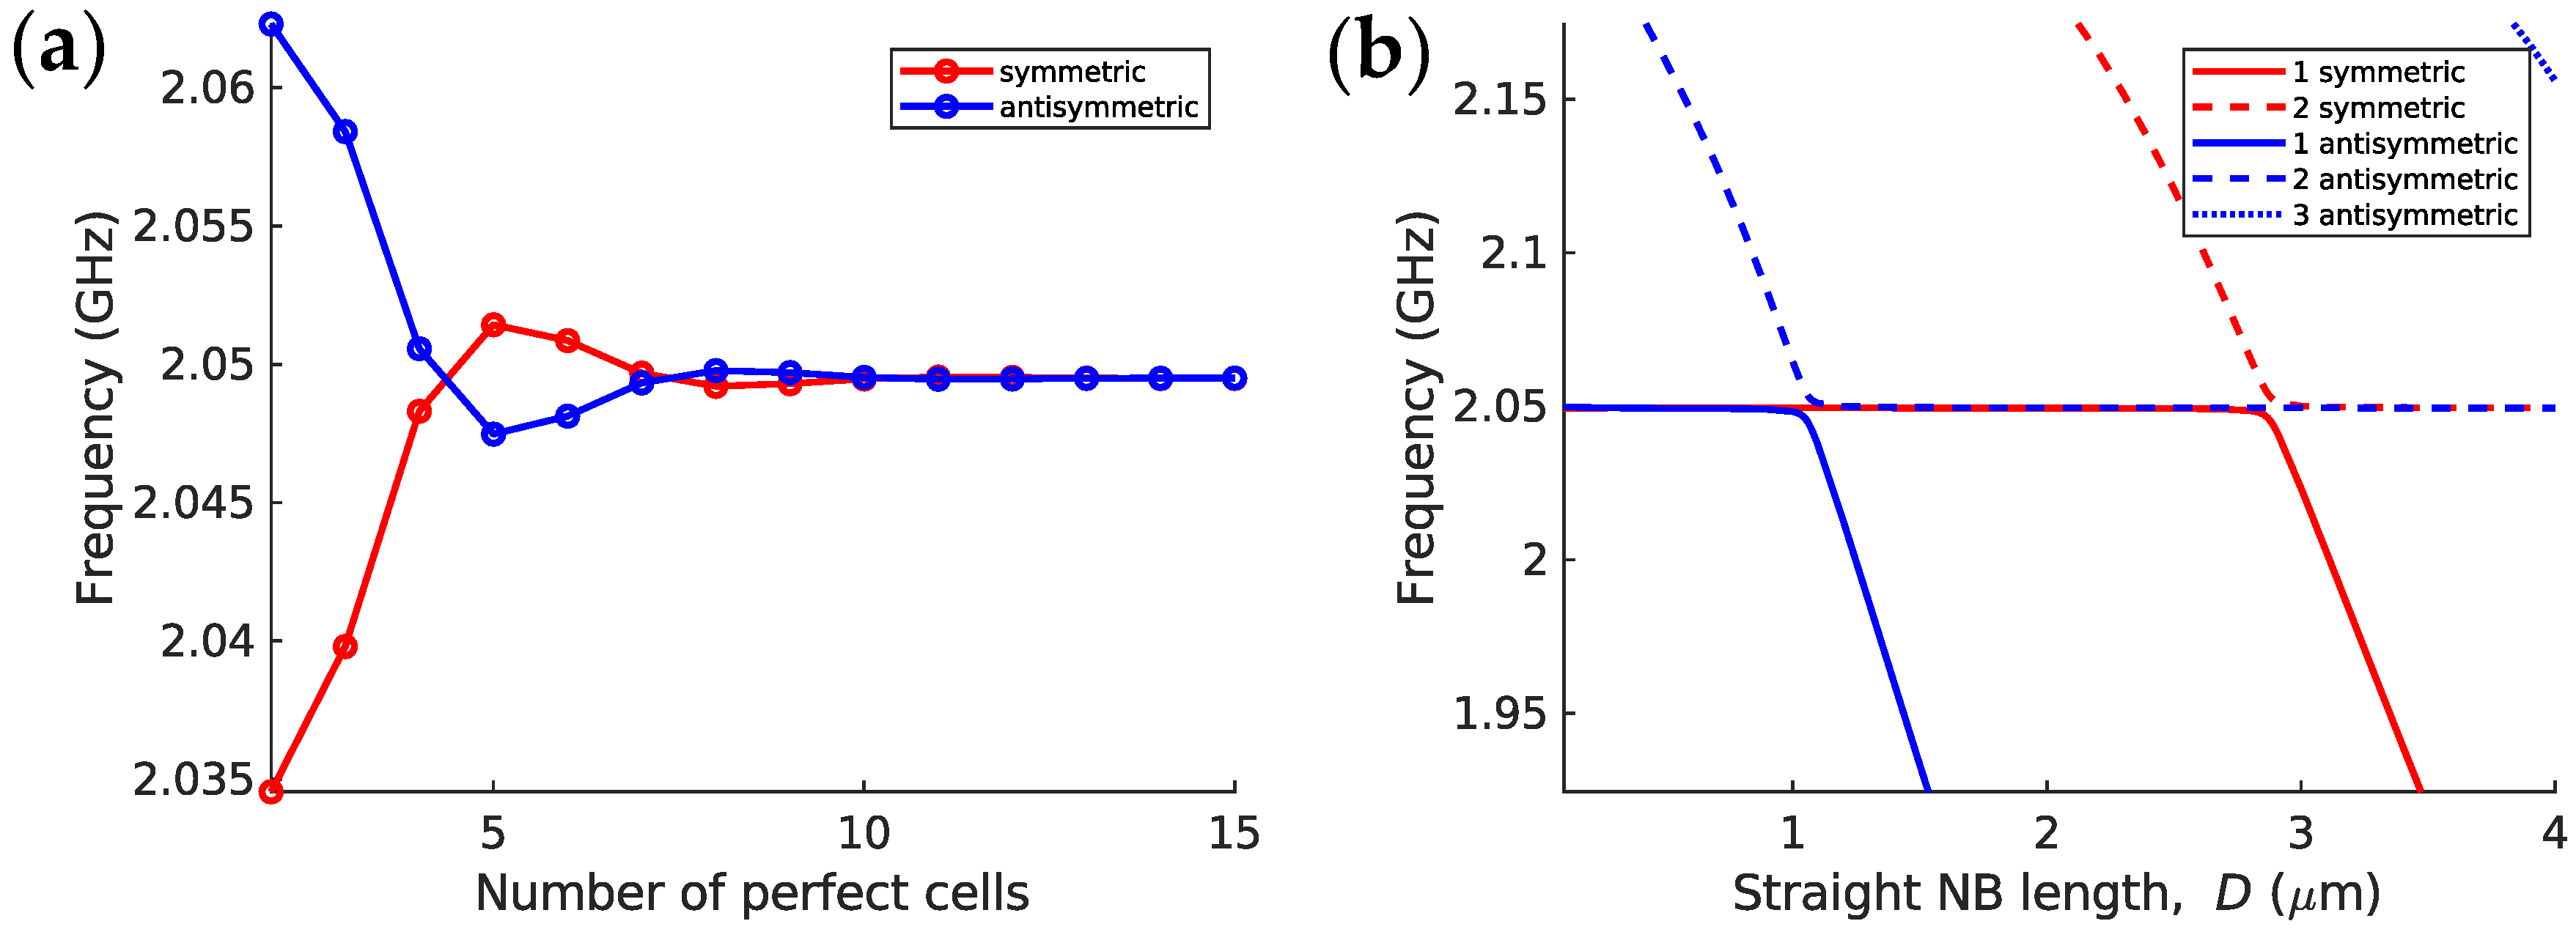
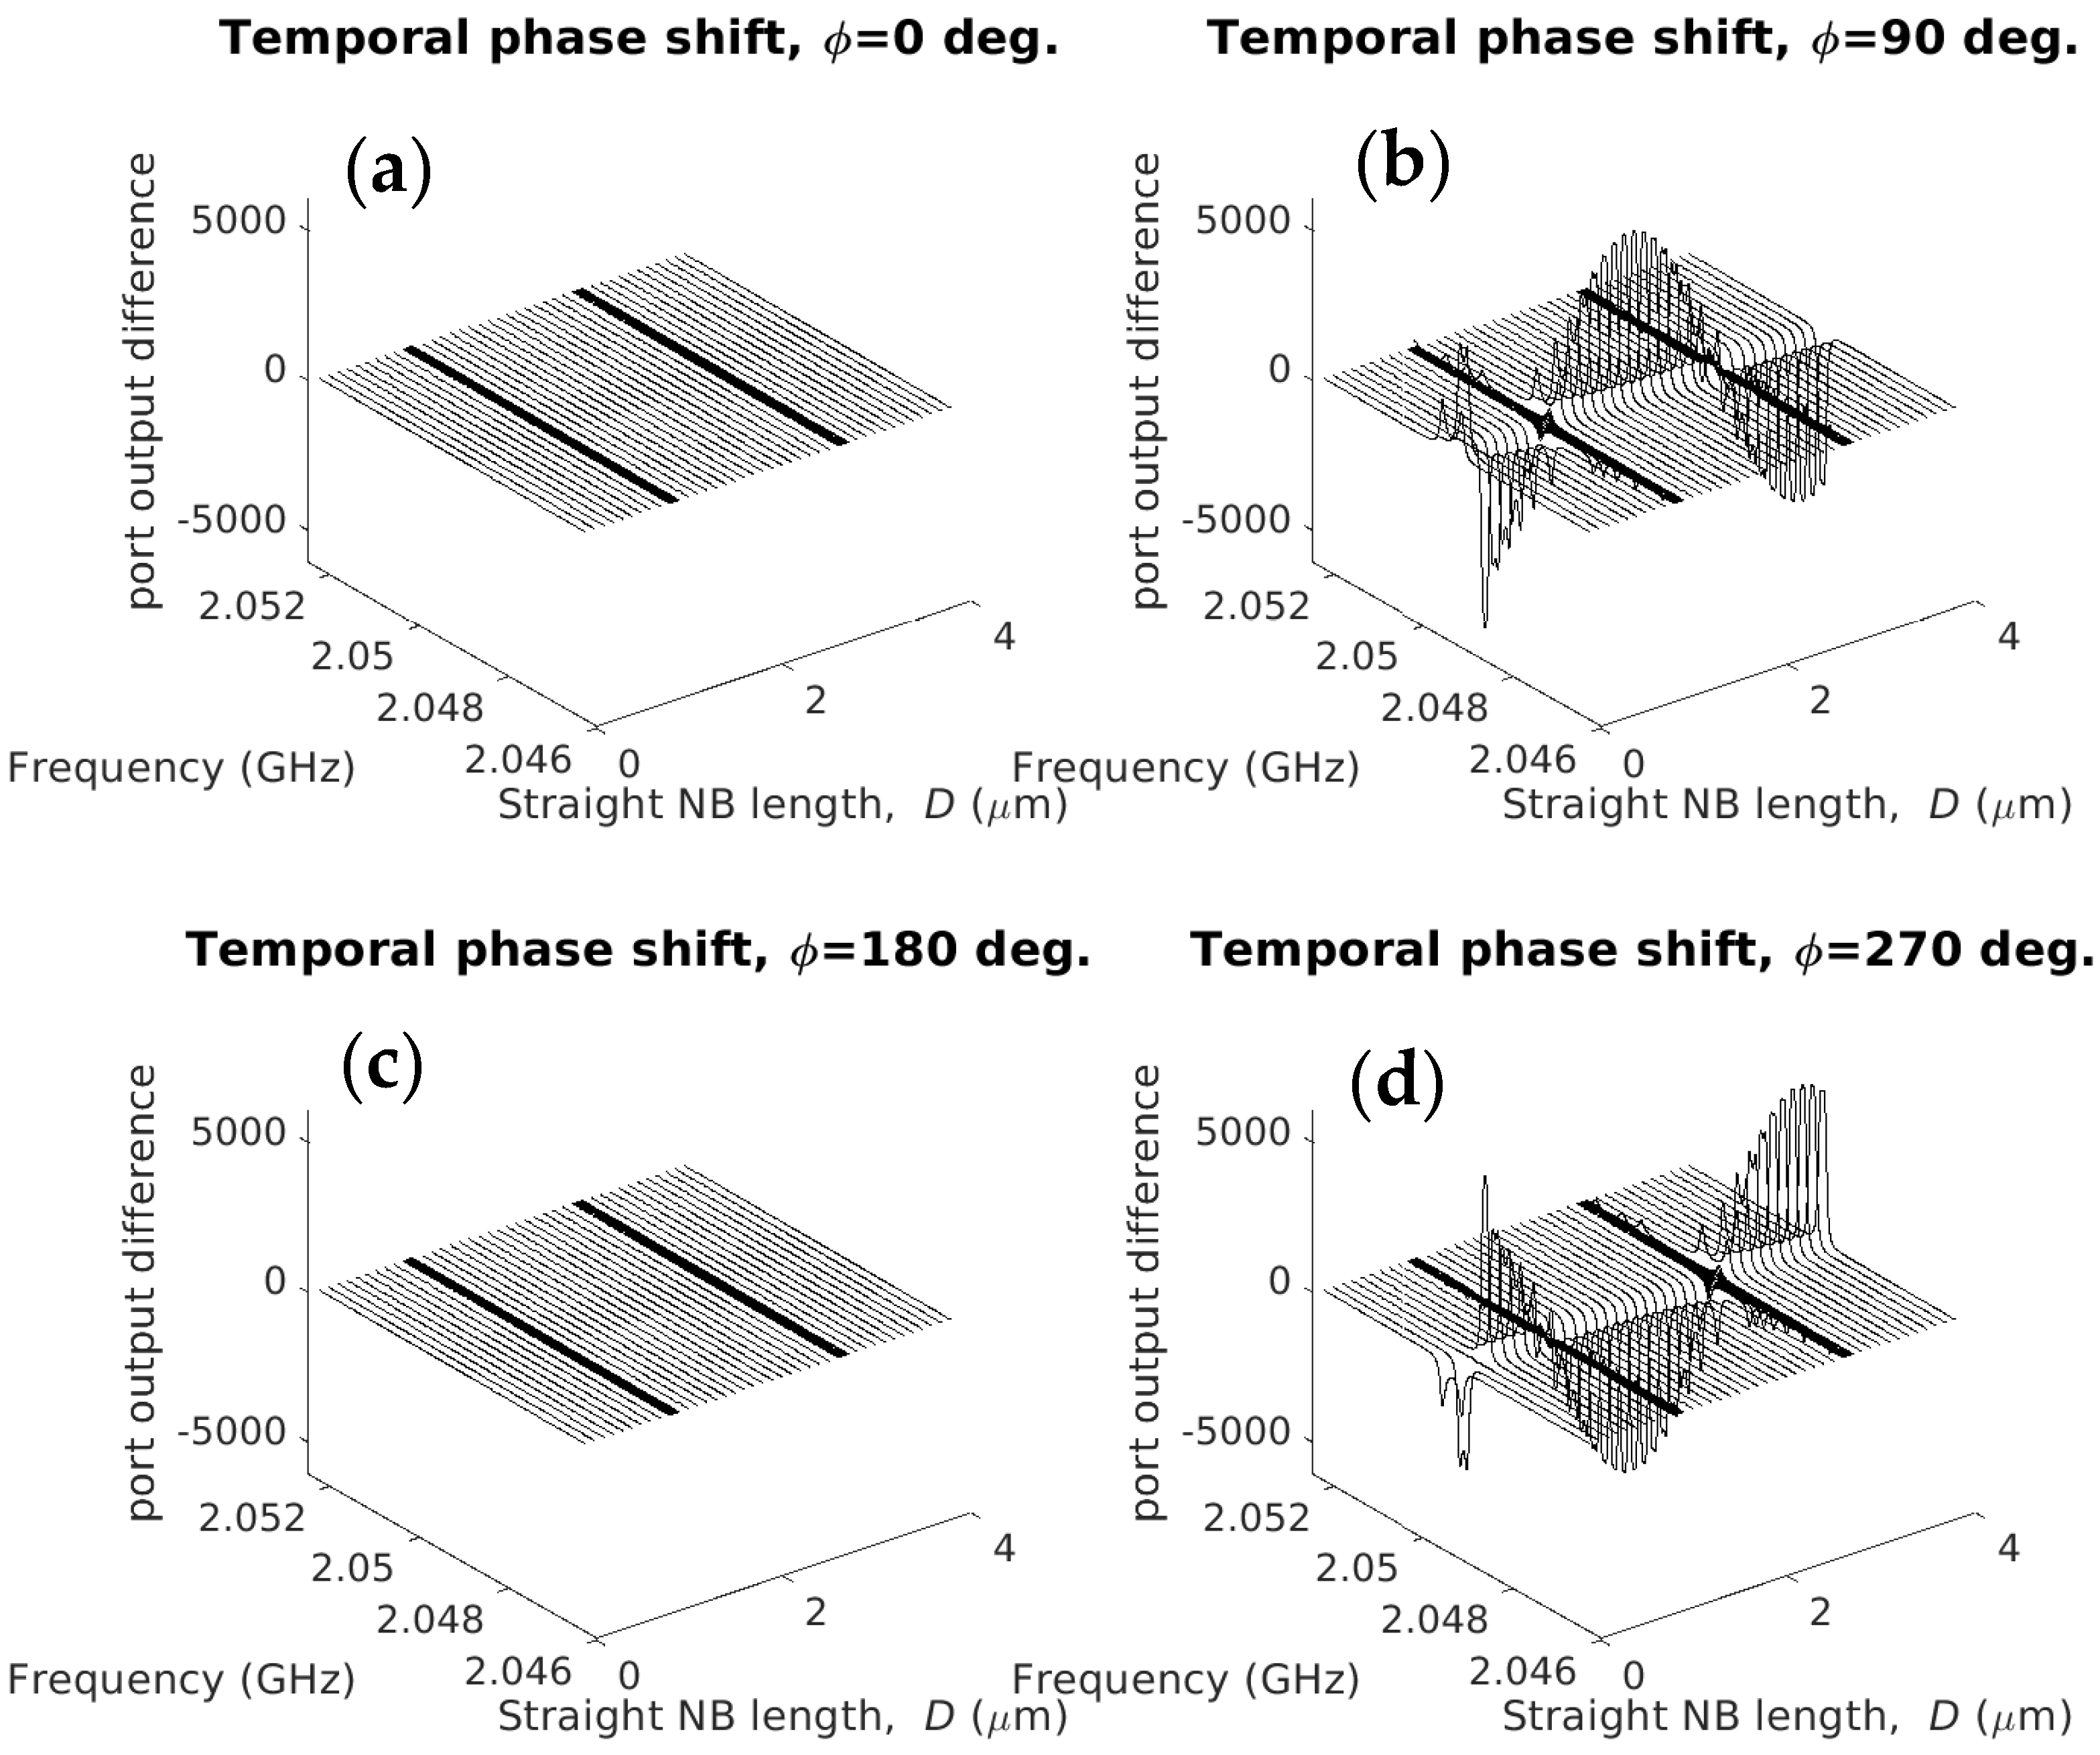
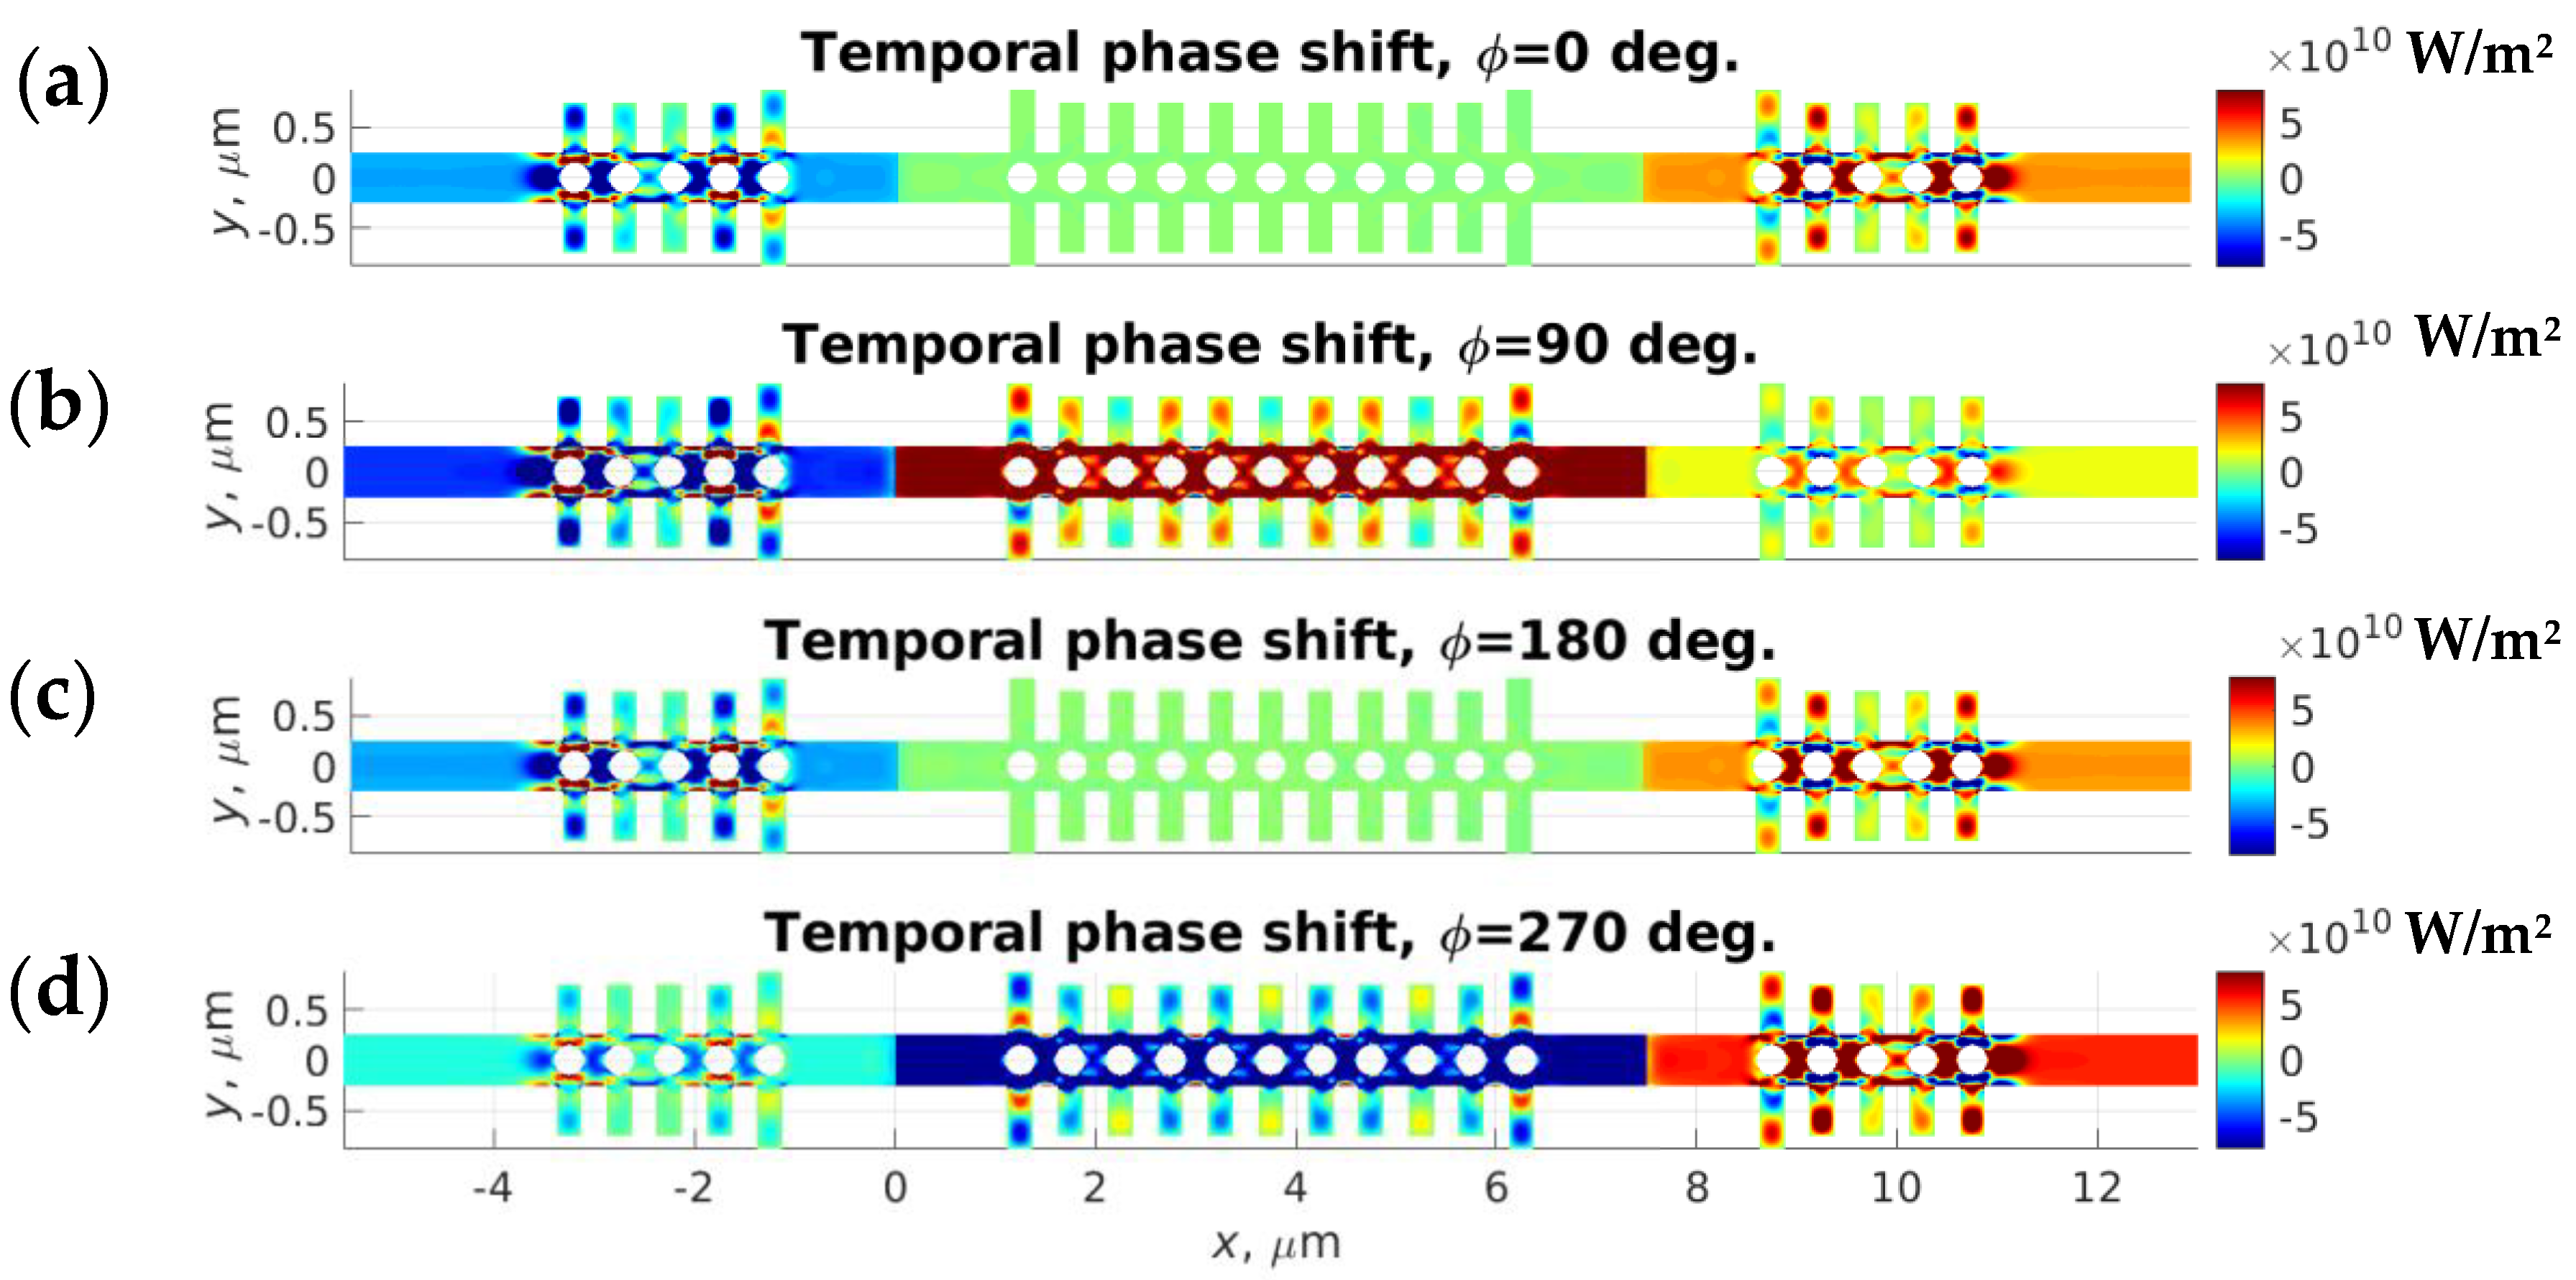
3.2. Coherent Phonon Emission by Activating Two Coupled Cavities

In the previous section, we have considered a homogeneous nanobeam with two virtual sources of mechanical waves. Such sources can be implemented, for instance, by using locally piezoelectric materials. Local phonon sources can also be implemented by optomechanical coupling. Therefore, to analyze the coherent emission of acoustic waves, we consider the coupling of two phonon modes in two coupled optomechanical cavities inside a phoxonic nanobeam crystal [9,10,11,30]. Our crystal is constituted by a periodic repetition of period a of stubs and holes along a backbone nanobeam, in favor of the creation of a dual phononic and photonic band gap. An optomechanic cavity of high-quality factors Q can be created by a tapered variation in size of the holes and/or stubs. The cavity supports photonic/phononic modes at the telecommunication wavelength of 1.55 µm, meaning a photonic frequency of few hundreds of THz and phononic modes in the GHz range [9,10,11]. In the following, the cavity defect is formed with the period ( δ = 4 a ) and a stub height mismatch ( Δ h = 0.5 a ) [30], where δ is the distance between centers of neighbor cells, and h is the height of the stubs. With such geometrical parameters of the cavity, we target a mechanical frequency close to 2 GHz. In Figure 5, we show a schematic representation of two geometries of coupling between two optomechanical cavities inserted in a nanobeam [30]. In the first geometry (Figure 5a) both cavities belong to the same phoxonic crystal and are separated by a few unit cells. In the second geometry (Figure 5b), the cavities belong to two different phoxonic crystals attached to each other by a straight waveguide of length D. In order to give a simple representation of the structures, we designate the first corrugated nanobeams in shape A by “−ο4×οN×ο4−” and the second one B by “−ο4×ο4−ο4×ο4−”. In this representation, the “−” means a straight nanobeam, “ο” one-unit cell of the perfect phoxonic crystal with one hole and two stubs, repeated as much as the upper subscript (4 or N), and “×” corresponds to the optomechanic cavity.
Figure 6 presents the influence of the distance between the two cavities on the phonon cavity modes frequencies, already investigated in our previous paper [30], and for the two cases shown in Figure 5. The simulations are performed in the framework of the finite element method (FEM) using COMSOL software. Let us note that a qualitative description of resonators’ modes splitting can be obtained in a more simplified model of an effective medium. As a support to the numerical simulations discussed below, we also add in Appendix A the analytical model based on the equivalent stratified multilayer system.
For the first structure, “−ο4×οN×ο4−”, the distance between cavities is changed by an integer number of periodic cells N, so that the distance changes in discrete steps. Then, due to the coupling between the cavities, we observe, when N < 4 , the splitting of the cavity mode at 2.05 GHz into two resonances, that exhibit symmetric and antisymmetric displacement profiles along x-axis with respect to the middle nanobeam section between the two cavities (see Figure 6a). For the second structure, “−ο4×ο4−ο4×ο4−”, the distance between the cavities is continuously changing with the length of the central straight part, D, noted as “−ο4×ο4−<D>−ο4×ο4−”. In this case, in addition to the cavity mode at 2.05 GHz, which can be either symmetric or antisymmetric, Fabry-Pérot type modes coming from the straight nanobeam arise. These latter can also exhibit a symmetric or antisymmetric displacement profiles along the x-axis with respect to the middle of the straight nanobeam. Therefore, we can observe in Figure 6b the interaction between a symmetric (resp. antisymmetric) Fabry-Pérot mode with a symmetric (resp. antisymmetric) cavity mode when D ~ 1 μm (resp. 3 μm).
Figure 7 represents the evolution of the difference between the output at ports P1 and P2 in shape A (“−ο4×οN×ο4−”) as a function of the number of perfect cells N, for four temporal phase shifts between the two sources. In parallel, Figure 8 represents the same evolution but for shape B (“−ο4×ο4−<D>−ο4×ο4−”), as a function of the length of the straight phononic waveguide of length D. The frequency spectrum range was chosen near the resonant frequency of uncoupled cavity resonance (2.05 GHz). The outputs at the ports are calculated as a ratio between longitudinal components of the Poynting vector for the corrugated nanobeam based cavity system and a straight nanobeam.
Figure 7 and Figure 8 show that the difference between the two outputs is zero for the temporal phases ϕ = 0 and ϕ = π . These phase shifts correspond to either a symmetric or an anti-symmetric profile of the two sources, which, as a consequence, leads to the excitation of a mode of same symmetry. But in any case, as seen in Figure 4, the two outputs are equal, meaning that the difference will be always equal to zero. When the temporal phase shift is ϕ = π / 2 or 3 π / 2 , the source profile leads to the excitation of both symmetric and antisymmetric coupled modes of same amplitude. However, now the output can be different from one port to the other, depending on the spatial distance between the two cavities. The maximum value of the difference between the output ports is observed for D = 2 μm and 3.8 μm. In the first case, the signal is maximum at port P1 whereas in the latter, the signal is maximum at port P2. The distance between two sources in the case of the shape B structure “−ο4×ο4−<D>−ο4×ο4−” is d = 2 ( 4 a ) + δ + D , where “4” corresponds to the number of perfect unit cells between the cavity centers and the straight nanobeam. Thus, the centers of the two cavities are separated by 8 µm ( ϕ = π / 2 ) in the first case and 9.8 µm in the second one ( ϕ = 3 π / 2 ).
As we can see from Figure 7 and Figure 8, the maximum of difference between the two ports is almost the same for shape A ( N = 10 and 11 unit cells) and B ( D = 2 µm and 9.8 µm). But in shape B, smoother adjustment of the length D can be achieved in contrast to shape A, where only discrete changes are possible by adding/dropping one periodic element. The individual signals at ports P1 and P2 and their differences for shape B are presented Figure 9 and Figure 10 respectively. As deduced previously from Figure 8, the output spectra at ports P1 and P2 are the same for ϕ = 0 and ϕ = π , leading to zero for the difference in Figure 10. Moreover, for ϕ = 0 , one can see the occurrence of one peak at 2.0494 GHz, corresponding to the coupling of symmetric sources. At ϕ = π , the sources are antisymmetric and the coupling mode, also antisymmetric, appears at 2.0495 GHz. In the case of ϕ = π / 2 and 3 π / 2 , there are two peaks in the spectra due to presence of both symmetric and anti-symmetric resonances. From Figure 10, one can say that a maximum of signal is obtained at port P1 (resp. P2) when ϕ = π / 2 (resp. ϕ = 3 π / 2 ). The discrimination between the two ports, maximal in one and zero in the second, can be achieved over a narrow frequency range and leads to the non-reciprocity property of the structure. By tuning the temporal phase shift between the two sources we can change the unidirectional way of propagation from one port to the other.
As a matter of illustration, the spatial distribution of the x-component of the Poynting vector is presented Figure 11 for shape B for four temporal phase shifts. In the color bar, the green corresponds to the zero value of the Poynting vector, the “blue” and “red” colors correspond, respectively, to the negative and positive directions of propagation of the mechanical wave. As can be seen from Figure 11, the distribution of the Poynting vector is zero in the area between external sources as it can be described by Equation (4). The Poynting vectors on the left and on the right sides of the nanobeam has the same value but different signs. For ϕ = π / 2 and 3 π / 2 , Figure 11 clearly demonstrates the effective unidirectional phonon emission, respectively to the left ( ϕ = π / 2 ) or to the right ( ϕ = 3 π / 2 ) side of the structure under consideration. A similar picture can be observed for shape A (see Appendix B), even if providing a perfect resonant state is more difficult due to the discrete changes in the number of perfect cells between sources. This lack of fine adjustment of the distance between defects, by a discrete change in the number of perfect cells, leads to limit the efficiency of the unidirectional phonon emission in shape A.

4. Conclusions

In this paper, we have theoretically investigated the nonreciprocal emission of phonons in a system constituted by two coupled phonon cavities. The coupling of phononic modes was considered in a phoxonic crystal inside a 1D corrugated silicon optomechanic nanobeam with a rectangular cross section, which combined symmetrical stubs grafted on each side of the nanobeam and cylindrical holes drilled in the middle of the nanobeam. To understand the nature of the unidirectional phonon emission in such a system, we first considered an equivalent multilayer modeling and then considered a realistic 3D system of an optomechanical structure using finite element modeling. It was shown that symmetric and antisymmetric phonon modes are formed due to the interaction between two phononic sources implemented in the structured nanobeam. The coherent excitation of the symmetric and antisymmetric phononic emissions can be tuned by the temporal phase shift between the sources. It was shown that unidirectional phonon emission in such a system arises as a result of the competition of two processes associated with the spatial symmetry of phononic cavity resonances and the temporal symmetry of a double coherent source. In our simulation, we have considered two types of phononic interaction in the optomechanic nanobeam. In the first one, the two cavities are connected through a set of perfect unit cells. In the second one, a straight waveguide is introduced in-between. We found that the second implementation of the phonon coupler is more efficient for the control of the nonreciprocal phonon emission, since it is much easier to provide resonance conditions by smoothly changing the length of the connecting straight nanobeam.
This work demonstrates the possibility of creating optomechanical or electromechanical switching devices for on-chip implementation for further application in sensing, metrology and quantum information.

Author Contributions

Conceptualization: B.D.-R., A.V.K. and Y.P. Investigation: A.V.K. Resources: Y.P. and B.D.-R. Software: A.V.K. Supervision: B.D.-R. Visualization: All Authors. Writing—original draft: A.V.K. and B.D.-R. Writing—review & editing: All Authors. All authors have read and agreed to the published version of the manuscript.

Funding

The authors acknowledge the support by the European Commission H2020 project PHENOMEN, under Grant Agreement No. 713450.

Institutional Review Board Statement

Not applicable.

Informed Consent Statement

Not applicable.

Data Availability Statement

Not applicable.

Acknowledgments

This work was supported by the European Commission H2020 project PHENOMEN, under Grant Agreement No. 713450.

Conflicts of Interest

The authors declare no conflict of interest.

Appendix A. Equivalent Stratified Multilayer Systems Corresponding to Corrugated Nanobeams

The qualitative behavior of guided modes of a nanobeam can be described in the framework of an equivalent media model. Since the propagation of waveguide modes in confined systems differs from the propagation of bulk plane waves mainly by the presence of localization in directions perpendicular to propagation, then for a qualitative description of waveguide modes, it suffices to consider a simpler model of propagation of bulk plane waves, where localization is taken into account by introducing an effective medium with mass density, ρ e f f . In this case, the transverse component of the wave vector is described by the effective value, n e f f . Noting that n e f f is less than the ratio between transverse and longitudinal sound velocities in this medium. Then, the quasi-periodic system can be presented in the form of a medium with a mass density for which the ratio between the transverse sound velocity in the first medium and the longitudinal sound velocities in another medium (with index m), v 1 t / v m l , is less than n e f f and ( v 1 t / v m l < n e f f < v 1 t / v 1 l ). In this case, there are only evanescence waves inside such medium and we can consider it as a barrier for propagating guided modes. We can estimate mass density in the framework of effective medium approximation: ρ e f f = ρ S i f + ρ a i r ( 1 f ) , where ρ S i is the mass density in silicon and ρ a i r ρ S i is the mass density in air or vacuum, f is the air/vacuum filling factor ( f = π r 2 / ( a 2 + 2 h w ) in the case of an elementary cell with stubs and a central hole, shown in Figure 5, where r is the radius of the hole, w and h are the width and height of the stubs, respectively). The profile of equivalent mass density and sketch of corresponding 1D quasi-periodic nanobeam based phononic structures (see in Figure 5) and the results of resonant frequency simulations is presented in Figure A1. The incoming wave is assumed to be launched from one of sides of the structure under consideration. As can be seen, the mode splitting within the framework of the effective medium model (Figure A1) qualitatively coincides with numerical calculations by the finite element method (Figure 6).
Figure A1. (a) The mass density profile of the two cavities linked directly in quasi 1D-periodic phononic crystal of length d. (b) Resonant wavelength as a function of the cavities distance d corresponding to N cells in panel (a) for two cavities linked directly in quasi 1D-periodic phononic crystal. (c) The mass density profile of the two cavities linked through a straight phononic waveguide of length D. (d) Resonant wavelength as function of length D of middle layer (corresponding to a straight phononic beam) in panel (c) that connects the two crystals containing the cavities.
Photonics 09 00610 g0a1

Appendix B. Unidirectional Coherent Phonon Emission in the Quasi-One-Dimension Corrugated Nanobeams of Shape A

Figure A2. Spatial distribution of the x-component of the Poynting vector in a corrugated nanobeam with two cavities in shape A separated by 9 perfect unit cells (“−ο4×ο9×ο4−”) for four temporal phaseshifts: 0 (a), π / 2 (b), π (c) and 3 π / 2 (d).
Photonics 09 00610 g0a2

References

  1. Aspelmeyer, M.; Kippenberg, T.; Marquardt, F. Cavity optomechanics. Rev. Mod. Phys. 2014, 86, 1391–1452. [Google Scholar] [CrossRef]
  2. Kippenberg, T.; Vahala, K. Cavity optomechanics: Back-action at the mesoscale. Science 2008, 321, 1172–1176. [Google Scholar] [CrossRef] [PubMed]
  3. Favero, I.; Karrai, K. Optomechanics of deformable optical cavities. Nat. Photonics 2009, 3, 201–205. [Google Scholar] [CrossRef]
  4. Eichenfield, M.; Chan, J.; Camacho, R.; Vahala, K.; Painter, O. Optomechanical crystals. Nature 2009, 462, 78–82. [Google Scholar] [CrossRef] [PubMed]
  5. Gavartin, E.; Braive, R.; Sagnes, I.; Arcizet, O.; Beveratos, A.; Kippenberg, T.; Robert-Philip, I. Optomechanical coupling in a two-dimensional photonic crystal defect cavity. Phys. Rev. Lett. 2011, 106, 203902. [Google Scholar] [CrossRef]
  6. Fuhrmann, D.; Thon, S.; Kim, H.; Bouwmeester, D.; Petroff, P.; Wixforth, A.; Krenner, H. Dynamic modulation of photonic crystal nanocavities using gigahertz acoustic phonons. Nat. Photonics 2011, 5, 605–609. [Google Scholar] [CrossRef]
  7. Chan, J.; Safavi-Naeini, A.; Hill, J.; Meenehan, S.; Painter, O. Optimized optomechanical crystal cavity with acoustic radiation shield. Appl. Phys. Lett. 2012, 101, 81115. [Google Scholar] [CrossRef]
  8. Rolland, Q.; Oudich, M.; El-Jallal, S.; Dupont, S.; Pennec, Y.; Gazalet, J.; Kastelik, J.; Lévêque, G.; Djafari-Rouhani, B. Acousto-optic couplings in two-dimensional phoxonic crystal cavities. Appl. Phys. Lett. 2012, 101, 61109. [Google Scholar] [CrossRef]
  9. Djafari-Rouhani, B.; El-Jallal, S.; Pennec, Y. Phoxonic crystals and cavity optomechanics [Cristaux phoxoniques et optomécaniques dans les cavités]. Comptes Rendus Phys. 2016, 17, 555–564. [Google Scholar] [CrossRef]
  10. Oudich, M.; El-Jallal, S.; Pennec, Y.; Djafari-Rouhani, B.; Gomis-Bresco, J.; Navarro-Urrios, D.; Sotomayor Torres, C.M.; Martínez, A.; Makhoute, A. Optomechanic interaction in a corrugated phoxonic nanobeam cavity. Phys. Rev. B 2014, 89, 245122. [Google Scholar] [CrossRef] [Green Version]
  11. Gomis-Bresco, J.; Navarro-Urrios, D.; Oudich, M.; El-Jallal, S.; Griol, A.; Puerto, D.; Chavez, E.; Pennec, Y.; Djafari-Rouhani, B.; Alzina, F.; et al. A one-dimensional optomechanical crystal with a complete phononic band gap. Nat. Commun. 2014, 5, 4452. [Google Scholar] [CrossRef] [PubMed]
  12. Maire, J.; Arregui, G.; Capuj, N.; Colombano, M.; Griol, A.; Martinez, A.; Sotomayor-Torres, C.; Navarro-Urrios, D. Optical modulation of coherent phonon emission in optomechanical cavities. APL Photonics 2018, 3, 126102. [Google Scholar] [CrossRef]
  13. Mohammadi, S.; Eftekhar, A.; Khelif, A.; Adibi, A. Simultaneous two-dimensional phononic and photonic band gaps in opto-mechanical crystal slabs. Opt. Express 2010, 18, 9164–9172. [Google Scholar] [CrossRef]
  14. Pennec, Y.; Djafari Rouhani, B.; El Boudouti, E.; Li, C.; El Hassouani, Y.; Vasseur, J.; Papanikolaou, N.; Benchabane, S.; Laude, V.; Martinez, A. Simultaneous existence of phononic and photonic band gaps in periodic crystal slabs. Opt. Express 2010, 18, 14301–14310. [Google Scholar] [CrossRef] [PubMed]
  15. Maldovan, M. Sound and heat revolutions in phononics. Nature 2013, 503, 209–217. [Google Scholar] [CrossRef] [PubMed]
  16. Arcizet, O.; Cohadon, P.F.; Briant, T.; Pinard, M.; Heidmann, A. Radiation-pressure cooling and optomechanical instability of a micromirror. Nature 2006, 444, 71–74. [Google Scholar] [CrossRef] [PubMed]
  17. Gigan, S.; Böhm, H.; Paternostro, M.; Blaser, F.; Langer, G.; Hertzberg, J.; Schwab, K.; Bäuerle, D.; Aspelmeyer, M.; Zeilinger, A. Self-cooling of a micromirror by radiation pressure. Nature 2006, 444, 67–70. [Google Scholar] [CrossRef] [PubMed]
  18. Aspelmeyer, M.; Meystre, P.; Schwab, K. Quantum optomechanics. Phys. Today 2012, 65, 29–35. [Google Scholar] [CrossRef]
  19. Balram, K.; Davanço, M.; Song, J.; Srinivasan, K. Coherent coupling between radiofrequency, optical and acoustic waves in piezo-optomechanical circuits. Nat. Photonics 2016, 10, 346–352. [Google Scholar] [CrossRef]
  20. Vainsencher, A.; Satzinger, K.; Peairs, G.; Cleland, A. Bi-directional conversion between microwave and optical frequencies in a piezoelectric optomechanical device. Appl. Phys. Lett. 2016, 109, 33107. [Google Scholar] [CrossRef] [Green Version]
  21. Balram, K.; Davanço, M.; Ilic, B.; Kyhm, J.H.; Song, J.; Srinivasan, K. Acousto-Optic Modulation and Optoacoustic Gating in Piezo-Optomechanical Circuits. Phys. Rev. Appl. 2017, 7, 24008. [Google Scholar] [CrossRef] [PubMed]
  22. Munk, D.; Katzman, M.; Hen, M.; Priel, M.; Feldberg, M.; Sharabani, T.; Levy, S.; Bergman, A.; Zadok, A. Surface acoustic wave photonic devices in silicon on insulator. Nat. Commun. 2019, 10, 4214. [Google Scholar] [CrossRef] [PubMed]
  23. Korovin, A.; Pennec, Y.; Stocchi, M.; Mencarelli, D.; Pierantoni, L.; Makkonen, T.; Ahopelto, J.; Djafari Rouhani, B. Conversion between surface acoustic waves and guided modes of a quasi-periodic structured nanobeam. J. Phys. D Appl. Phys. 2019, 52, 32LT01. [Google Scholar] [CrossRef]
  24. Forsch, M.; Stockill, R.; Wallucks, A.; Marinkovi´c, I.; Gärtner, C.; Norte, R.; van Otten, F.; Fiore, A.; Srinivasan, K.; Gröblacher, S. Microwave-to-optics conversion using a mechanical oscillator in its quantum ground state. Nat. Phys. 2020, 16, 69–74. [Google Scholar] [CrossRef] [PubMed]
  25. Yu, W.; Jiang, W.; Lin, Q.; Lu, T. Cavity optomechanical spring sensing of single molecules. Nat. Commun. 2016, 7, 12311. [Google Scholar] [CrossRef] [PubMed]
  26. Deli´c, U.; Reisenbauer, M.; Dare, K.; Grass, D.; Vuleti’c, V.; Kiesel, N.; Aspelmeyer, M. Cooling of a levitated nanoparticle to the motional quantum ground state. Science 2020, 367, 892–895. [Google Scholar] [CrossRef]
  27. Djorwe, P.; Pennec, Y.; Djafari-Rouhani, B. Exceptional Point Enhances Sensitivity of Optomechanical Mass Sensors. Phys. Rev. Appl. 2019, 12, 24002. [Google Scholar] [CrossRef]
  28. Fang, K.; Matheny, M.; Luan, X.; Painter, O. Optical transduction and routing of microwave phonons in cavity-optomechanical circuits. Nat. Photonics 2016, 10, 489–496. [Google Scholar] [CrossRef]
  29. Colombano, M.F.; Arregui, G.; Capuj, N.E.; Pitanti, A.; Maire, J.; Griol, A.; Garrido, B.; Martinez, A.; Sotomayor-Torres, C.M.; Navarro-Urrios, D. Synchronization of Optomechanical Nanobeams by Mechanical Interaction. Phys. Rev. Lett. 2019, 123, 17402. [Google Scholar] [CrossRef]
  30. Korovin, A.V.; Pennec, Y.; Djafari-Rouhani, B. Strong coupling of phononic cavity modes in one-dimensional corrugated nanobeam structures. Phys. Rev. B 2017, 96, 184302. [Google Scholar] [CrossRef]
Figure 1. Energy flux (Pi), power consumption (ΔPi), and relative outputs (Ti) at ports P1 (blue) and P2 (red) for two sources S1 and S2 distant of d and placed in a homogeneous nanobeam, for a wave vector k as a function of the temporal phase for three spatial phases: π / 2 (a), 3 π / 4 (b) and π (c).
Photonics 09 00610 g001
Figure 2. Relative output at port P2 for two sources S1 and S2, distant of d placed in a homogeneous nanobeam, at the wave vector k, as function of temporal and spatial phases.
Photonics 09 00610 g002
Figure 3. (a) Representation of the simple nanobeam of section ( a × e ) , the symmetry planes and the relative position of the two sources S1 and S2, distant of d. (b) Dispersion curve of the silicon nanobeam of section ( a × e ) = (500 nm × 220 nm). The symmetry (S) or anti-symmetry (A) of the mode is indicated with respect to the (Π′, Π) plane.
Photonics 09 00610 g003
Figure 4. Output at ports P1 and P2 as a function of the phase shift ϕ between the two sources S1 and S2, and for different distances d corresponding to the spatial phase shifts: 0, −π/2 and ±π. Notice that the red and black solid lines (corresponding to d = 5.6 μm) are superposed to each other.
Photonics 09 00610 g004
Figure 5. Schematic presentation of the phononic nanobeams including two connected defects with the schematic representation (a) shape A, “−ο4×οN×ο4−” and (b) shape B, “−ο4×ο4−ο4×ο4−”.
Photonics 09 00610 g005
Figure 6. (a) Evolution of the resonant frequency as a function of the number of perfect unit cells separating the two cavities (Figure 5a). (b) same as (a) as a function of length D of the straight waveguide connecting the two phononic crystals containing the cavities (Figure 5b). The assignments (1, 2, 3) in the legend of panel (b) represent the symmetries of the modes.
Photonics 09 00610 g006
Figure 7. Spectra of the difference between ports P1 and P2 in shape A (“−ο4×οN×ο4−”) as a function of the perfect cells number N between the two cavities, for four principal values of the temporal phase shift between the two sources in the cavity centers (ad).
Photonics 09 00610 g007
Figure 8. Spectra of the difference between ports P1 and P2 in shape B “−ο4×ο4−<D>−ο4×ο4−” as a function of the straight nanobeam length D, for four principal values of the temporal phase shift between two sources in the cavity centers (ad).
Photonics 09 00610 g008
Figure 9. Outputs at ports P1 and P2 in shape B with D = 2 µm (a) and 3.8 µm (b) under the excitation of two sources at four fixed temporal phase shifts.
Photonics 09 00610 g009
Figure 10. Difference between the output ports P1 and P2 in shape B with D = 2 µm (solid lines) and 3.8 µm (dashed lines) under the excitation of two sources at four fixed temporal phase shifts (a–d).
Photonics 09 00610 g010
Figure 11. Spatial distribution of the x-component of the Poynting vector in a corrugated nanobeam with two cavities in the shape B with a straight nanobeam separation of D = 2 µm for four temporal phase shifts: 0 (a), π / 2 (b), π (c) and 3 π / 2 (d).
Photonics 09 00610 g011
Publisher’s Note: MDPI stays neutral with regard to jurisdictional claims in published maps and institutional affiliations.

