Article

Identifying Collector Channel Orifices In Vivo with Phase-Sensitive Optical Coherence Tomography: A Preliminary Study

1
School of Electronic and Information Engineering, Tiangong University, Tianjin 300387, China
2
Tianjin Optoelectronic Detection Technology and System Laboratory, Tianjin 300387, China
Photonics 2022, 9(8), 593; https://doi.org/10.3390/photonics9080593
Submission received: 26 June 2022 / Revised: 16 August 2022 / Accepted: 17 August 2022 / Published: 20 August 2022

Abstract

:
Collector channels are openings located in the trabecular meshwork (TM) of the human eye that function as conduits, connecting the anterior chamber to the episcleral veins. Identifying the positions of collector channel orifices (CCOs) is essential for positioning implants in microinvasive canal-based glaucoma surgery, which is still not possible in vivo currently. Considerable evidence indicates that aqueous outflow becomes more active near the CCOs. Because the TM movement regulates the aqueous outflow, identification of the TM motion signal has the potential to locate the CCOs. Phase-sensitive optical coherence tomography (PhS-OCT) is an effective tool for the instantaneous detection of TM motion in vivo with sensitivity at the nanometer scale. However, the downside of this method is that phase measurement is prone to mix noises that negatively distinguish between biomedical signals. The TM motion was considered initially to be set up by the cardiac pulse. In this paper, a signal quality index related to blood pressure monitoring was applied to assess the validity of the TM motion signal. Measurements were carried out on two pairs of healthy human eyes. Quantitative measurements of the TM motion signal region such as size and frequency were recorded as the judgment indicator for CCOs. These results demonstrate that the PhS-OCT is a valuable tool capable of revealing the aqueous outflow pathway in vivo, offering a novel alternative to optimize glaucoma surgery.

1. Introduction

Elevated intraocular pressure (IOP) is a risk factor for glaucoma, one of the leading causes of irreversible vision loss worldwide. Understanding the mechanisms of aqueous humor outflow (AHO) regulation is essential for the management of glaucoma [1]. Aqueous humor is produced by the ciliary body. It flows from the posterior chamber through the pupil into the anterior chamber. As the Figure 1 demonstrates, the conventional route of AHO includes the trabecular meshwork (TM), Schlemm’s canal (SC), collector channels (CCs), aqueous veins (AVs), and episcleral veins (Evs) successively, which account for 80–90% of AHO volume [2]. It transports 2 to 3 μ L per minute of aqueous humor, from 25 to 30 CCs, to the venous plexus [3]. The TM is described as an elastic porous membrane with parallel cylindrical micropores embedded. The SC is a circumferential channel surrounded by connective tissues. The biomechanical properties of tissue changes are considered critical to outflow resistance.
Minimally invasive glaucoma surgery (MIGS) is an invasive procedure aiding in restoring AHO drainage in primary open-angle glaucoma (POAG) [5]. There are different surgical options. Schlemm’s canal surgeries aim to reconstruct the outflow pathway by dilating the SC, using surgical methods such as viscocanalostomy and canaloplasty [6]. Enthusiasm for SC surgeries is increasing due to the innovation of more delicate surgical devices and the demands to enhance the natural physiological outflow by the external bleb formation (which removes part of the TM and creates a new escape route for AHO) [7]. In the canaloplasty procedure, such as the iStents glaucoma surgery, there is distension of the SC and microruptures are formed to facilitate AHO. Evaluation of the distal portion of the AHO, as well as the positioning of the implants, has a vital role in determining the surgical success [8,9,10]. Therefore, an imaging probe for anatomical and dynamic information of aqueous humor system is a major concern currently.
The collector channel is considered a structural indicator related to the drainage of the distal outflow pathway. The AHO in Schlemm’s canal appears preferentially at specific locations. To search for the preferential pathways that exist within the human TM, Hann and Fautsch [11] perfused the TM-SC regions with fluorescent beads. The dissected tissues were examined by confocal microscopy. Different levels of beads in pigmented and nonpigmented areas adjacent to CCs suggested the CCs were the preferential flow pathways of the AHO. Moreover, histological research on human eyes has revealed that the collector channel orifices (CCOs) are randomly distributed around the circumference of the eye and are diverse in size [12,13]. A simulation result shows that the magnitude of improvement in the outflow facility was sensitive to the position of implants [6]. Hence, many ex vivo and in vivo studies have been carried out to reveal the CCs’ structure and function, i.e., the path of the AHO.
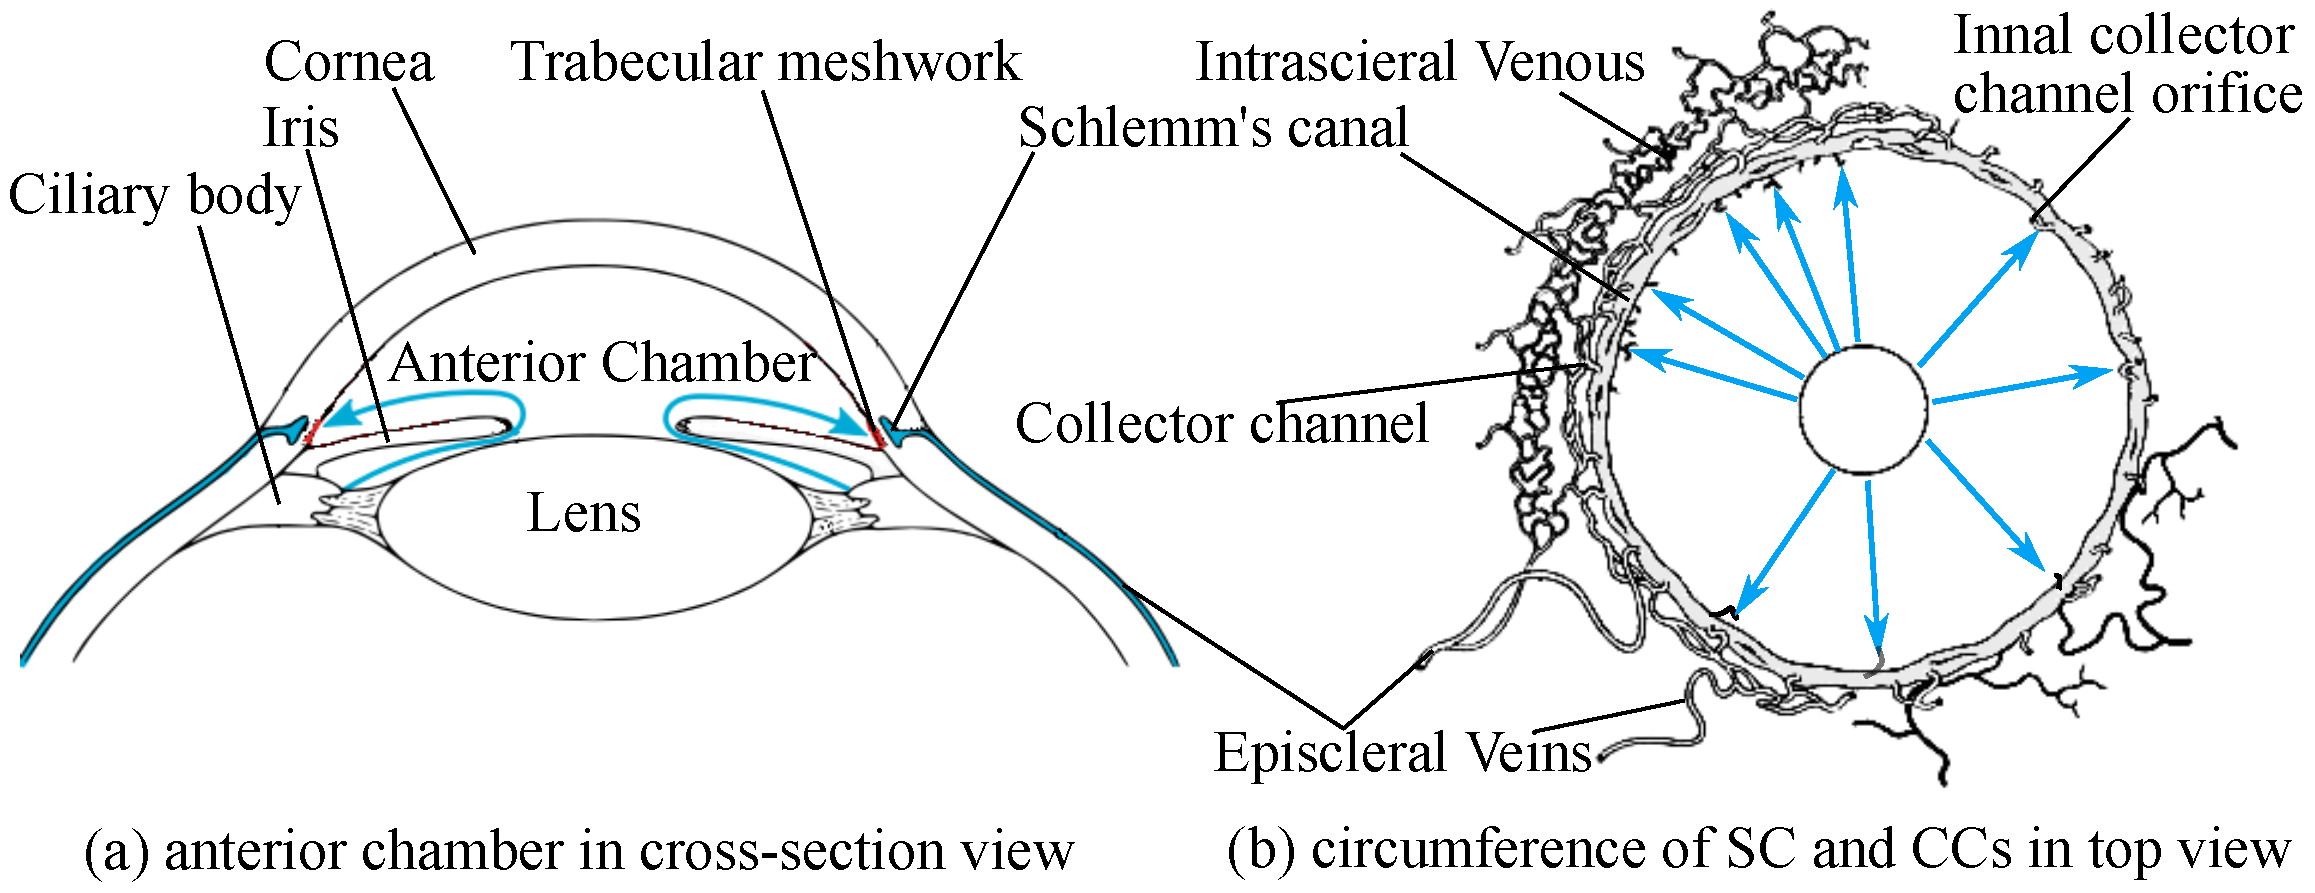
  • Imaging AHO pathways in vivo
Video imaging reported by Johnstone [14,15] demonstrated pulse-dependent patterns of aqueous outflow from the SC into the CCs. He built a dynamic model describing the ocular pulse results from the changes in choroidal volume that occur with the cardiac cycle. To examine variations in collector channel orifices and their relation to the SC, Bentley et al. utilized scanning electron microscopy to examine nonpathological human eyes after being fixed by immersion [16]. Fellman et al. [17] described the episcleral venous fluid wave (EVFW), a phenomenon of the blanching of episcleral vessels for the success of the Trabectome procedure. A significant negative correlation was found between postoperative IOP and the decreased blanching of the EVFW. This method provided more objective data to evaluate the patency of the trabecular outflow pathway. Vital dyes such as Fluorescein [18] and Trypan Blue (TB) [19] were also used to enhance the visibility of the aqueous-humor-system-related lumen structures during the surgery and the AHO facility. These studies implicated AHO-coupled pressure-dependent tissue motion indirectly. With various tracers, studies have shown that fluid flow is not equal within the TM, and that preferential pathways (lower flow resistance) exist in the TM [11].
  • OCT for imaging AHO pathways
Optical coherence tomography (OCT) provides a precise interpretation and a different view of the pachymetry from gonioscopy or ultrasound. It has become a valuable tool for elaborate ocular structure demonstration and ocular disease analysis [20,21]. In glaucoma investigation, OCT-based assessment methods have become critical for clinics and research [22,23,24]. Kagemann et al. [25] provided evidence of outflow imaging in humans using spectral domain optical coherence tomography (SD-OCT). They demonstrated a decrease in the SC cross-sectional area in response to an increase in the IOP.
Phase-based OCT aims to detect signal phase changes between successive OCT scans, which occur on moving scattering particles. The statistical properties of particle motion are relevant to the vibration of tissues. This idea has been developed in a series of configurations, such as Doppler OCT [26], phase-resolved OCT [27,28], phase-sensitive OCT (PhS-OCT) [29,30], joint spectral and time domain OCT [31] and phase-contrast OCT [32]. Due to its high sensitivity of spatial resolution, PhS-OCT is considered a good potential method for AHO process visualization. Trabecular meshwork activity using PhS-OCT was firstly reported by Li et al. [33]. They provided a quantitative measurement for pulsatile motion in enucleated monkey eyes under various IOP conditions. In subsequent works, they also realized in vivo observation of the TM displacement of a human eye [34]. One hypothesis was that AHO was set up by the cardiac pulse, and sensitive to IOP changes. In these works, the sampling positions of the TM were estimated by the SC anatomy on the corresponding intensity images. However, in most cases, the SC position is indistinguishable. Gao et al. [35] compared healthy eyes and POAG eyes assessed with PhS-OCT. Evidence of pulsatile TM motion depression was observed in patients with POAG. Xin et al. [36] described a perfusion pump system to add an external drive to the IOP. They measured peak-to-peak TM displacements (ppTMDs) with a rise in the pulse amplitude. The experimental results show that the ppTMDs had a negative correlation with the mean ocular pressure. Wu et al. [37] investigated the relationship between the biomechanical properties of the crystalline lens and IOP using a confocal acoustic radiation force (ARF) and optical coherence elastography (OCE).
To test whether the fluid outflow increased when stents were implanted close to CCOs, Ren et al. [38] developed a rotatable scanning endoscopic probe OCT system. The results show the CCs’ openings on the wall of the SC with the channel going into the sclera. This agreed with the imaging results achieved via scanning electron microscopy. Xin et al. developed a side-view catheter probe based on swept-source optical coherence tomography (SS-OCT) to position the collector channel orifice in cadaver eyes [39]. Akagi et al. [40] investigated optical coherence tomography angiography (OCTA) to assess conjunctival and intrascleral vasculatures in normal eyes. Periocular venous plexuses could be demonstrated in 3D. Furthermore, the authors indicated that, because SC and CCs do not contain red blood cells under normal conditions, they are undetectable by OCTA.
The evidence suggests that a more significant pressure gradient is present at the CCOs due to aqueous flow [11,15,41]. Accordingly, the TM motion signals should be more active and consistent near CCOs. This study aimed to locate CCOs in vivo using PhS-OCT. To reduce the influence of the phase signal noises, an optimal signal quality index is proposed for the signal screening. Finally, the signal consistency was measured in both frequency and amplitude, the basis from which the positions of CCOs were scoped.

2. Phs-OCT Displacement Methods
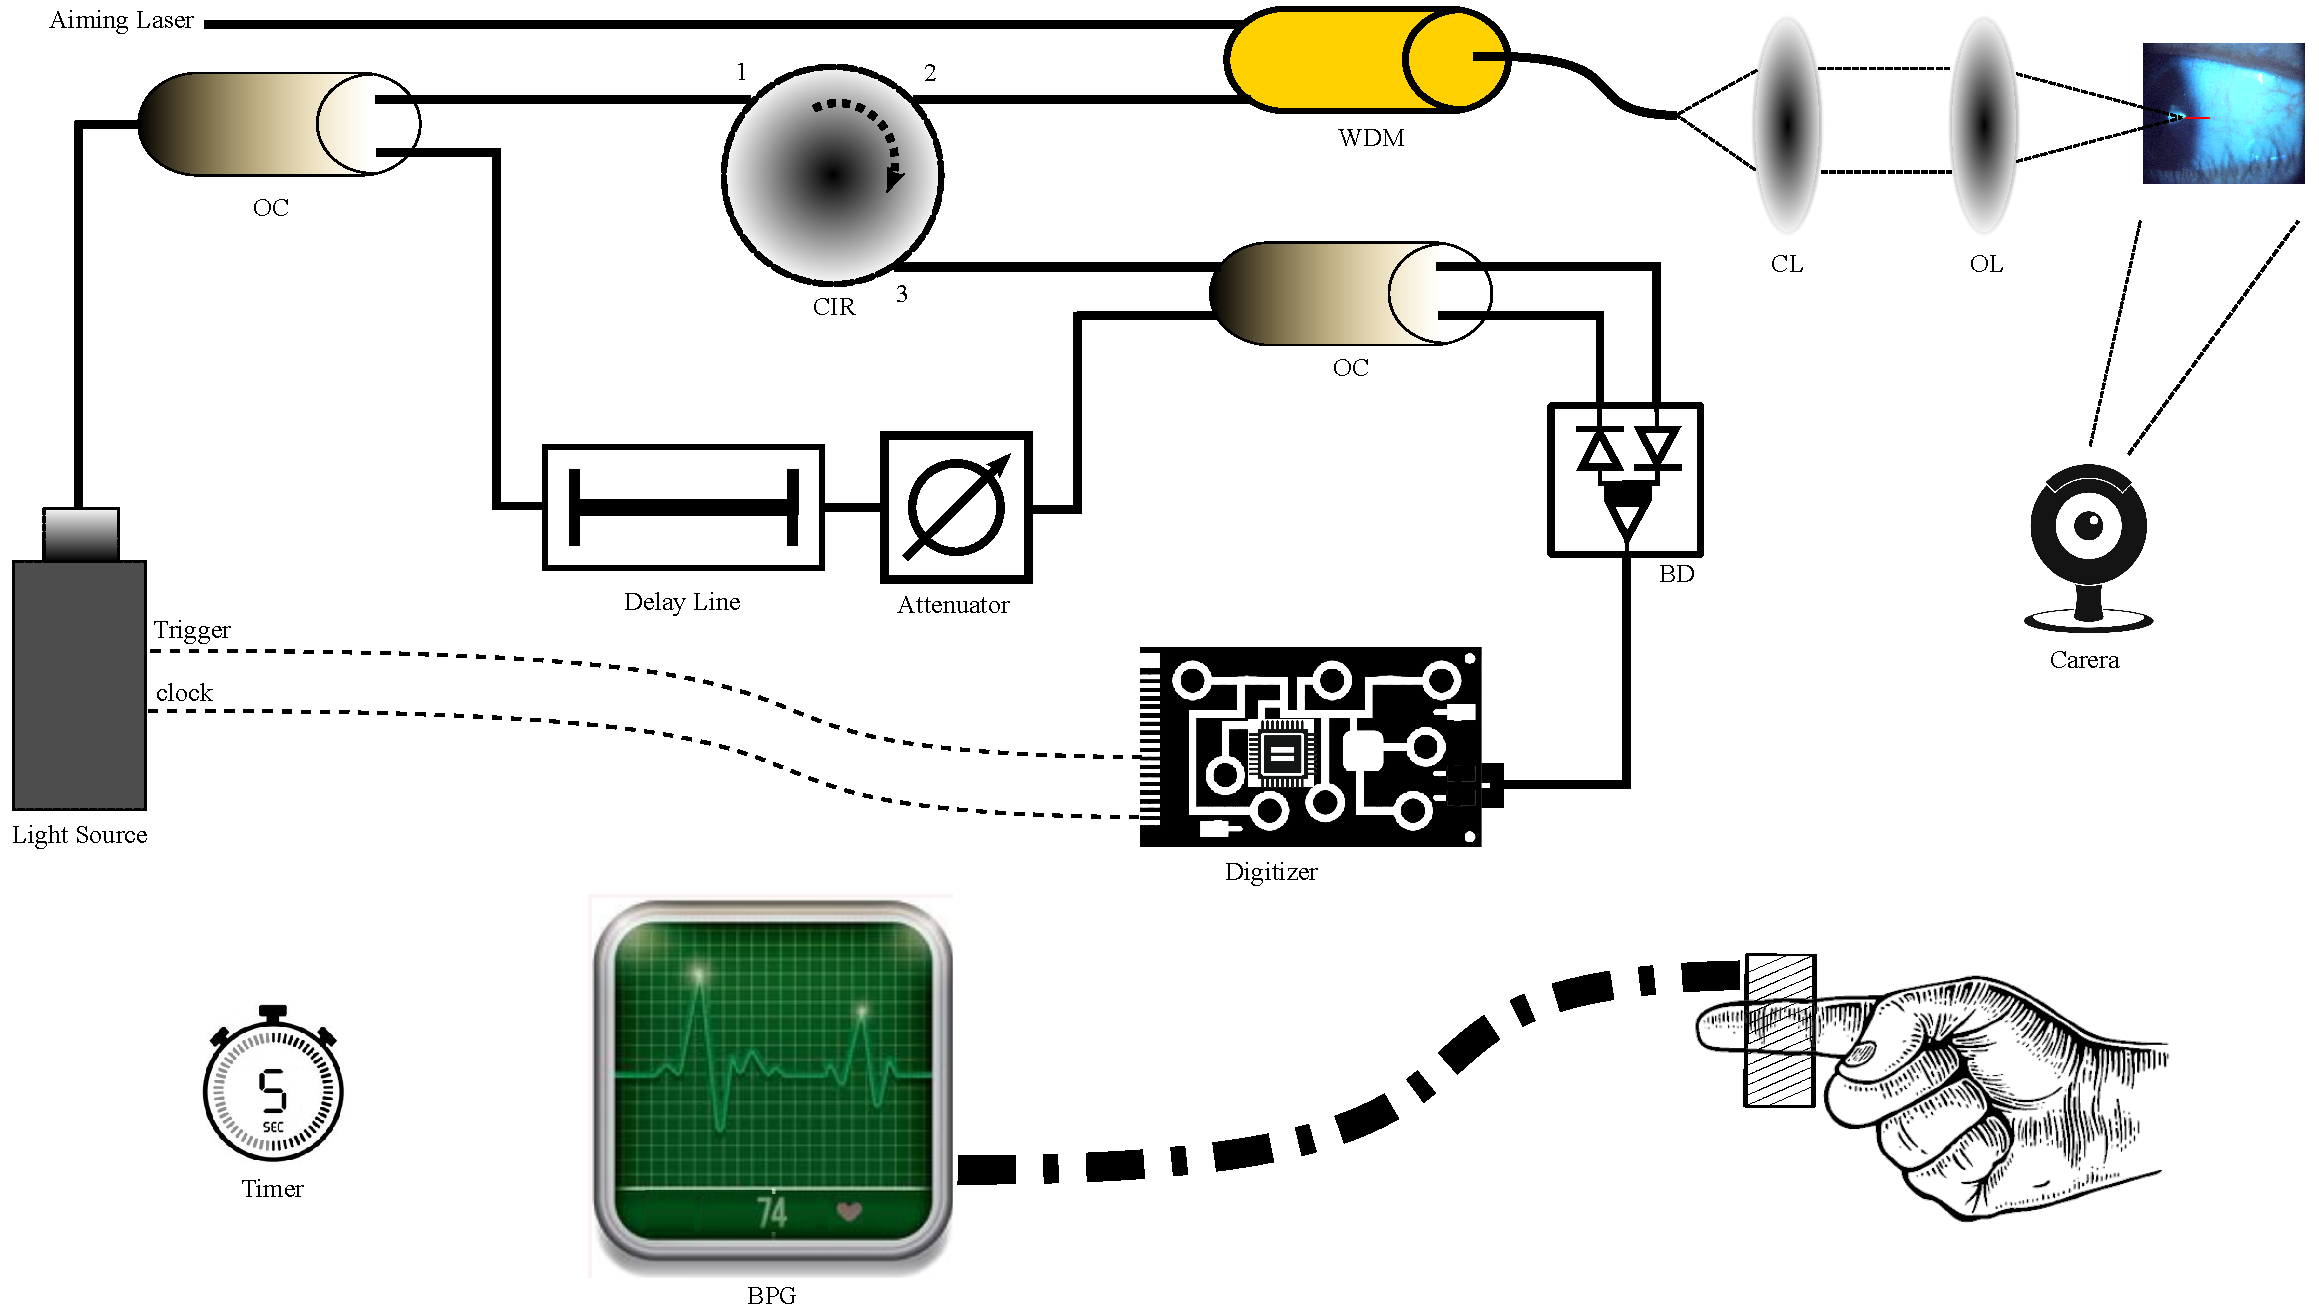
2.1. System Setup

A laboratory-built SS-OCT system [42,43] attached to a positing camera was used, as shown in Figure 2. The light from the laser source was (SL1310V1-20048, Thorlabs Inc., Newton, NJ, USA) delivered to a fiber-based Michelson interferometer via an optical fiber circulator. A fiber coupler split the beam into the reference arm and sample arm equally. In the reference arm, the light was focused on a reference mirror, and coupled back to a collimator. The optical path length difference was precisely regulated by means of a translation mechanism. The sample arm consisted of a collimating lens, a two-axis galvanometer scanner and lens assembly. The components of the sample arm were compacted into a handheld scan probe to facilitate clinical operation [43]. The incident power on the sample was 5 mW, which is below the FDA safe limit for ophthalmic imaging. The optical clock arm consisted of a Mach–Zehnder interferometer (MZI) to generate a peak sampling frequency of 400 MHz. Furthermore, the MZI signal was acquired by a dual-balanced detector. A 12-bit digitizer (ATS9360, AlazarTech, Inc., Montreal, QC, Canada) was applied to record the OCT signals with a 1.8 GSam/s sampling rate.
The phase difference (PhDiff) was decomposed from the OCT complex signal interframe [29]. The configuration of the system and imaging protocol are summarized in Table 1. The beam spot was scanned by a paired X-Y galvo scanner to form a raster sampling pattern comprising the A scan and B scan. The field of view was 4 mm with a depth of 2 mm. The refractive index of the sample was set to 1.38 empirically [34].
As a reference to the signal frequency, a blood pressure gauge (BPG) meter was used to measure the pulsatile waveform of the same subject. The OCT signal and the BPG signal were triggered to start recording simultaneously by the hardware setting.

2.2. Principle of PhS-OCT

Regardless of the self-interference, the interference density I d ( ω ) of the scatters at position d can be expressed as
I d ( ω ) = 1 π S ω R ( τ ) cos ( 2 ω τ + ϕ ^ ) d τ
where ω is the angular frequency of the light source [44]. According to the OCT principle, the range of I d ( ω ) is determined from the propagation time τ of the light backscattered by the particles within the sample. The term ϕ ^ denotes system noise, a crude representation of path length distortion due to factors such as vibration in the reference arm. S ω is the spectral density of the light source, and R ( τ ) is the normalized back-scattered intensity at τ .
PhS-OCT works under the simplifying assumption of a single-scattering particle motion. In most practical cases, the scattering/reflecting objects in a resolution element move approximately at the same velocity. Although the motion scope of the particle is within a lateral resolution element of OCT, interference signal changes are measured. This effect is approximated as
I d ( ω ) cos 2 ω τ
It is a function of the wavenumber k with modulation frequency ω [26]. R ( τ ) in Equation (1) can appear as constant, denoted as R τ [30]. Then, Equation (1) can be represented as
I d ( ω ) = C sinc ( ω τ + ϕ ^ )
where C = 1 π S ω R τ . A time domain signal I ( z ) at position z is obtained from a Fourier transform of I d ( ω )
I ( z ) = F I d ( ω ) = C 2 π rect ( τ ) + ξ
ξ is summed as the result of system noise, as the factor caused by vibration in the reference arm. The rectangular function rect ( τ ) corresponds to the fact that the speckle pattern can be viewed as the interaction between all possible pairs of point scatters [45]. This processing transforms the k-dependent intensity signal into a time-dependent signal; i.e., it becomes frequency-dependent when the particles vibrate. Phase-based OCT methods describe the phase change from sequential measurements. The spectral interference density is represented in the complex form I ( z ) : = A ( z ) exp i Φ ( z ) . Here, A ( z ) is the amplitude, and Φ ( z ) is the phase term, which can be regarded as relatively fixed in position z for the scatters at sampling time t. Finally, the depth-dependent tissue velocity v ( z , t ) in the beam direction can be obtained by
v ( z , t ) = Δ Φ ( z , t ) λ 0 4 π n Δ t
where n is the refractive index of the sample, and λ 0 is the central wavelength of the light source [29,30,44]. Δ t is the sampling time of consecutive frames (B scan), which is 5 × 10 5 s.

2.3. Phase Stabilization

The phase stability was estimated following [46], which mainly included two steps:
(1)
Phase unwrapping. Since the length of the OCT axial scan was short in this study (less than 12 mm), it can be assumed that phase-wrapping occurred only once along the A scan. Consequently, when phase wrapping occurred, the phase signals were divided into two discontinued sets, and the wrapped phase was recognized as a negative value. The average value of the squared phase signal was used as a criterion to define the origin coordinate. Then, an offset of 2 π was given to the negative set to reverse the wrapping effect. Consequently, the phase ramp trend was recovered.
(2)
Phase disambiguation and jitter compensation. PhDiff can be expressed as δ ϕ ( z , t ) = 2 π σ z + ξ , which is depth-dependent. The value of ξ is a random radian value within a specific range, depending on the amplitude of the synchronization jitter. If the gradient term is depth-z-dependent, the jitter-induced phase change is calculable. One way to exclude the phase noise is median filtering. According to the phase variation statistics, after compensation processing, the phase stability was reduced from 1.8 radians of standard deviation to 89 m r a d [46].

3. Signal Processing

One hypothesis is that the TM motion signal mainly reflects the changes in pulsatile volume in the eye pressure, which is related to the arterial pulse waves. Since the mechanism of TM motion generation is same as the photoplethysmogram (PPG) in this paper, the optimal signal quality indexes (SQIs) that were applied in PPG analysis were utilized to distinguish between irregular PhDiff patterns. In [47], the author compared eight optimal SQIs to classify the PPG signal quality. Taking the annotated data as standard, two indexes were tested to establish which was more effective at distinguishing waveform morphology. In this section, these two indexes are extended to evaluate the acceptability of the PhDiff signal.

3.1. Data Acquisition and Preprocessing

The OCT scanning position was located at the iridocorneal angle, both nasal and temporal. According to the real-time intensity images, the light incident direction was adjusted to the maximum iridocorneal angle degree. A series of cross-section images were recorded in 5 s. Furthermore, the phase signal was decomposed from the fast Fourier transform (FFT) of the OCT. The PhDiff was obtained simply by temporal subtraction of the contentious frames (pair of B scans). To remove the bulk motion, image registration based on the corresponding intensity image and phase compensation were implemented in advance. Figure 3 shows the frequency spectrum of signals sampled in specific regions of the iridocorneal angle, which included the TM-SC region, ciliary body, cornea and iris. Significantly, the fundamental frequency of the PhDiff signal in the TM-SC region was in the range of 1–2 Hz, the same as that of the heartbeat rate.
The flowchart for is demonstrated in Figure 4. The PhDiff signal was filtered using a Butterworth algorithm in the fourth order, with 0.4 Hz and 5 Hz cutoffs. The region of interest (ROI) was defined as a closed region between the band of extracanalicular limbal lamina (BELL) [48] and the corneal epithelium, as subfigure D demonstrates. Subfigure E shows the candidate region of the PhDiff signals that remained after the signal identification mentioned in Section 3.2. Furthermore, subfigure F illustrates the waveform of three PhDiff signals.

3.2. TM Motion Identification and Reconstruction

Generally, in vivo biological signals are biased by physiological dynamics, which always causes loss of OCT imaging quality, which is even more likely when phase-based methods are used. Meanwhile, the phase instability of SS-OCT is also a factor affecting the measurement accuracy. We identified the TM motion signal (high-quality pulse signal) from the candidate PhDiff signals. Then, the screened signals were composited based on the frequency consistency and the amplitude consistency separately, to reconstruct an eigen signal for further analysis.
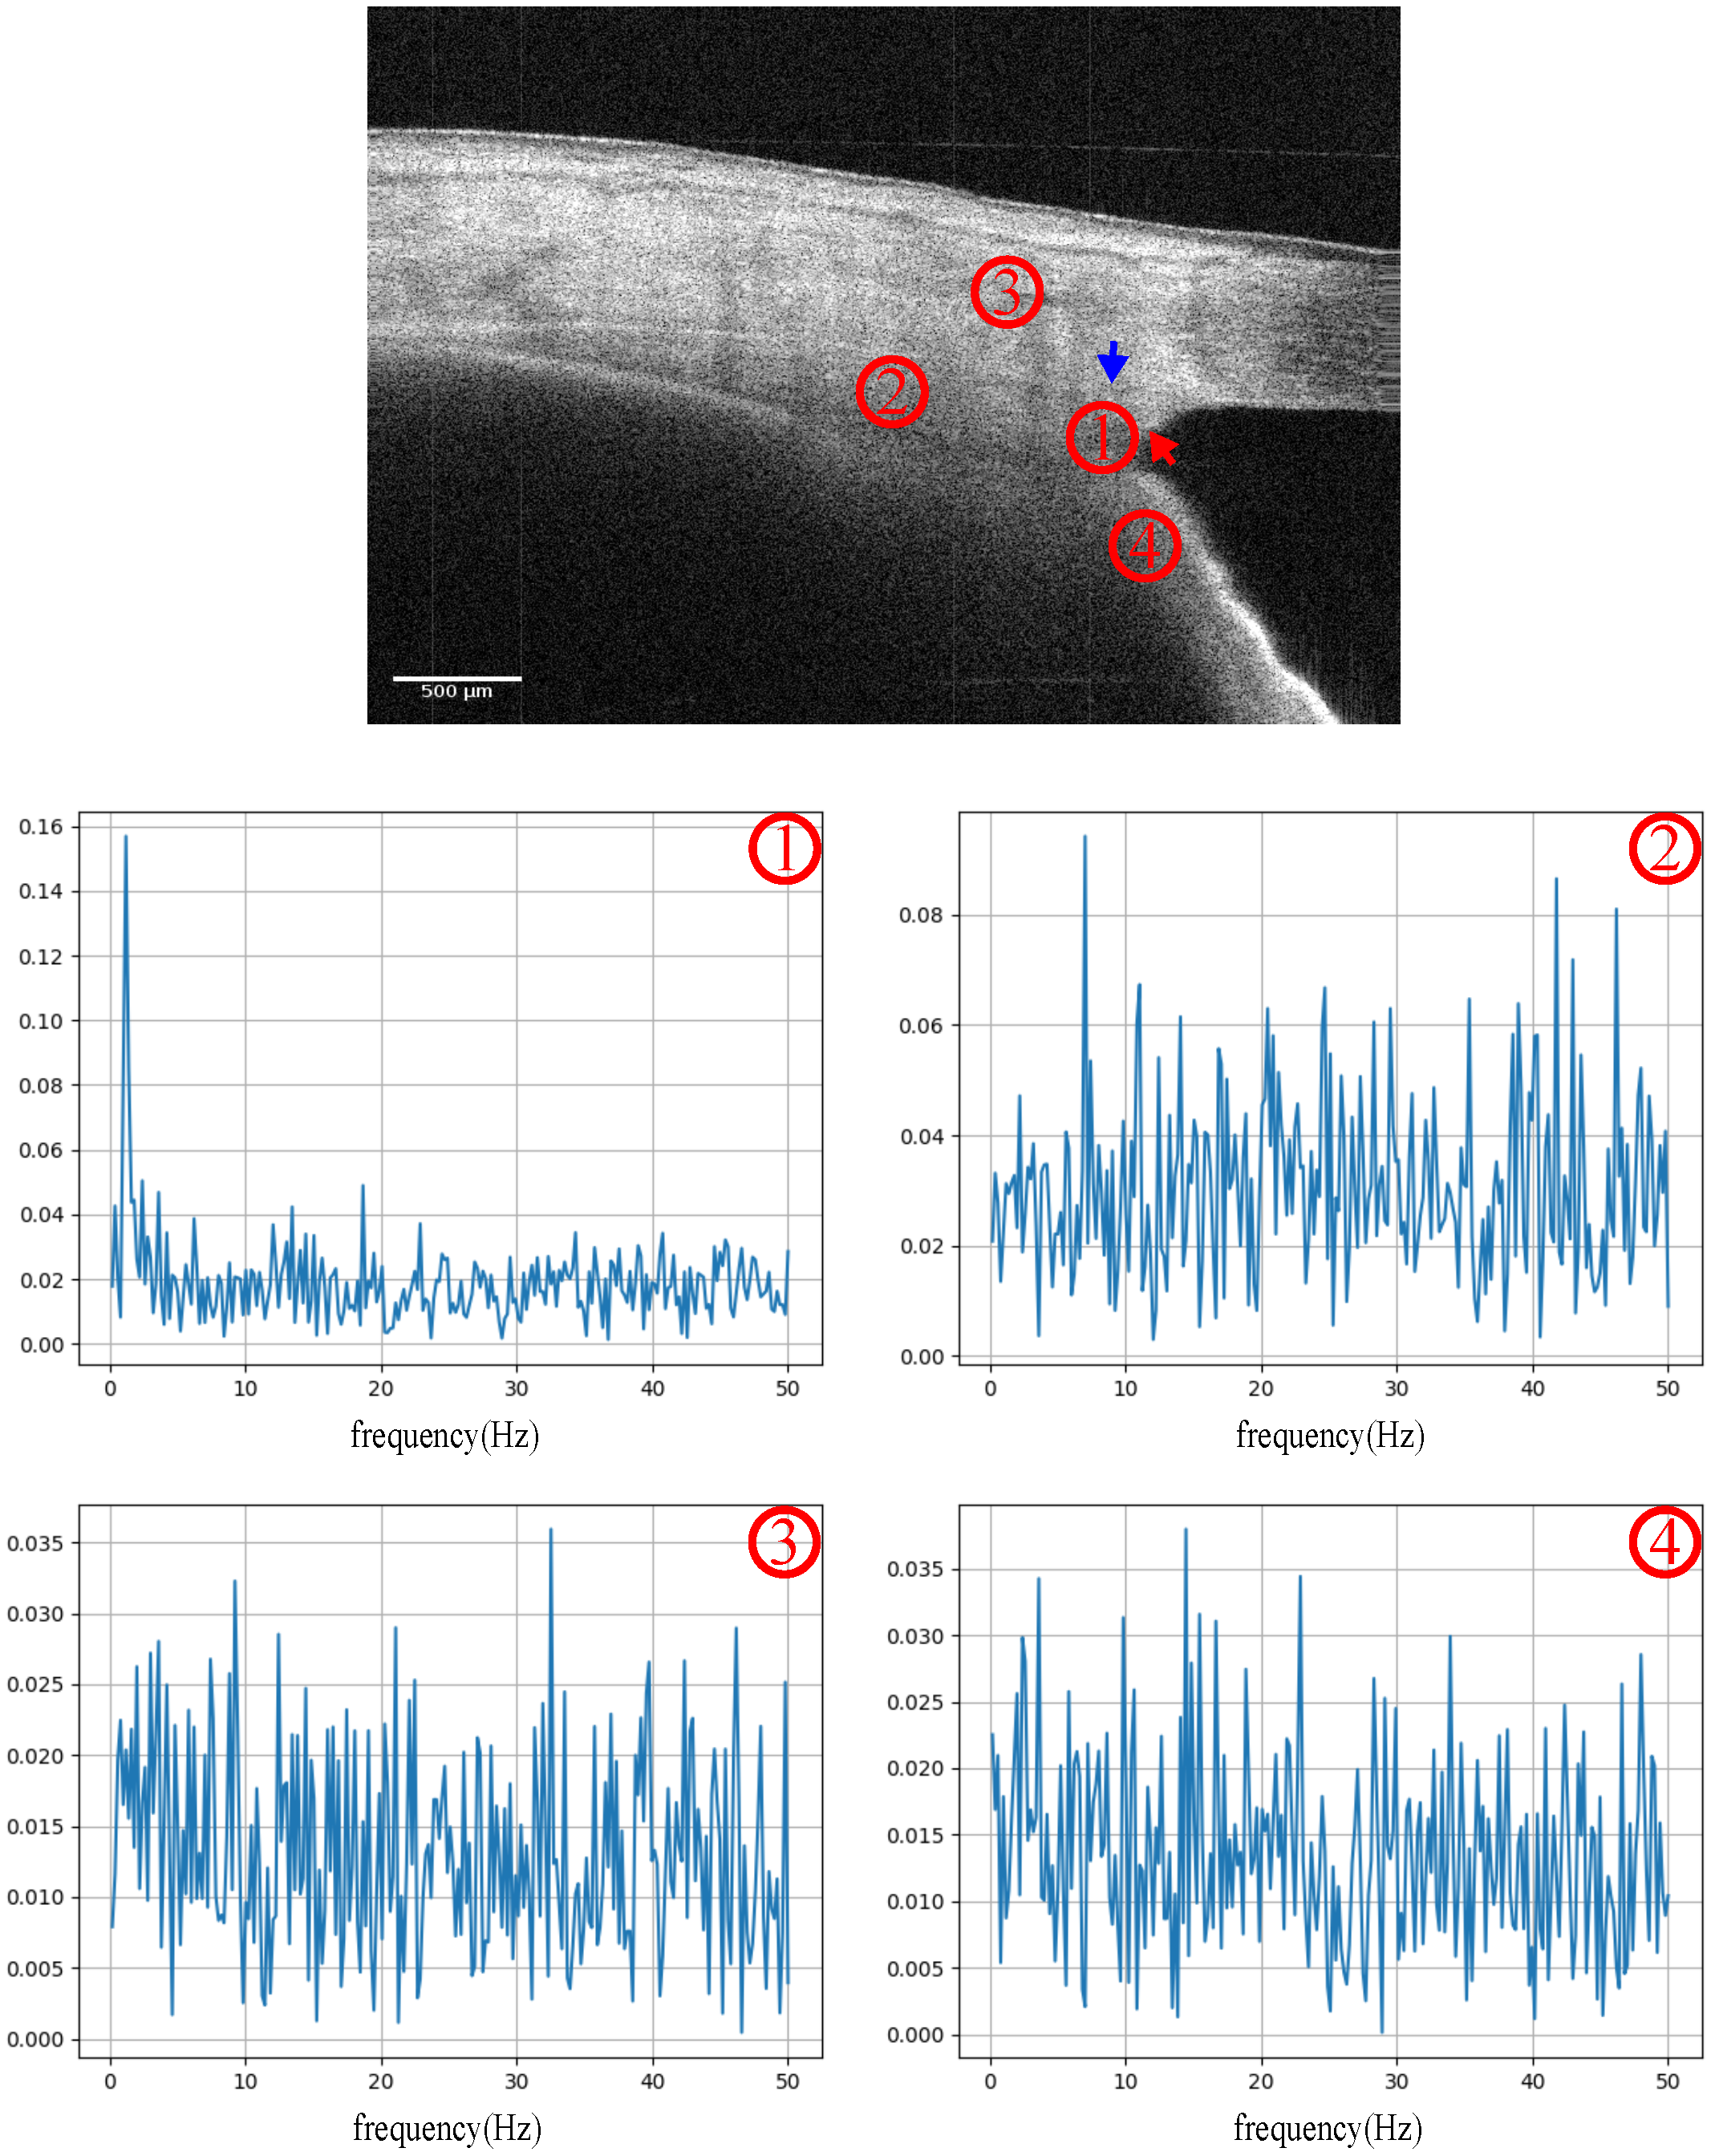
  • Signal screening by waveform quality
The power spectral ratio (PSR) is a criterion used to describe the energy concentration, the ratio of which is represented as
Q p s r = 3 / 4 f p 5 / 4 f p | F | 2 / 4 f p 8 / 4 f p | F |
where F denotes the frequency value of the input signal. f p denotes the reference frequency, which is generally in the range of the 1–2.25 Hz (60–135 beats per minute, bpm) band [49] in a calm state.
Skewness is considered an optimal index for assessing the asymmetry of a probability distribution of signal intensity [47]. The skew of a random variable x is given by
Q s k e w = 1 N k = 1 N ( x k x ¯ ) / σ 3
where x ¯ denotes the mean of x, and σ is the standard deviation.
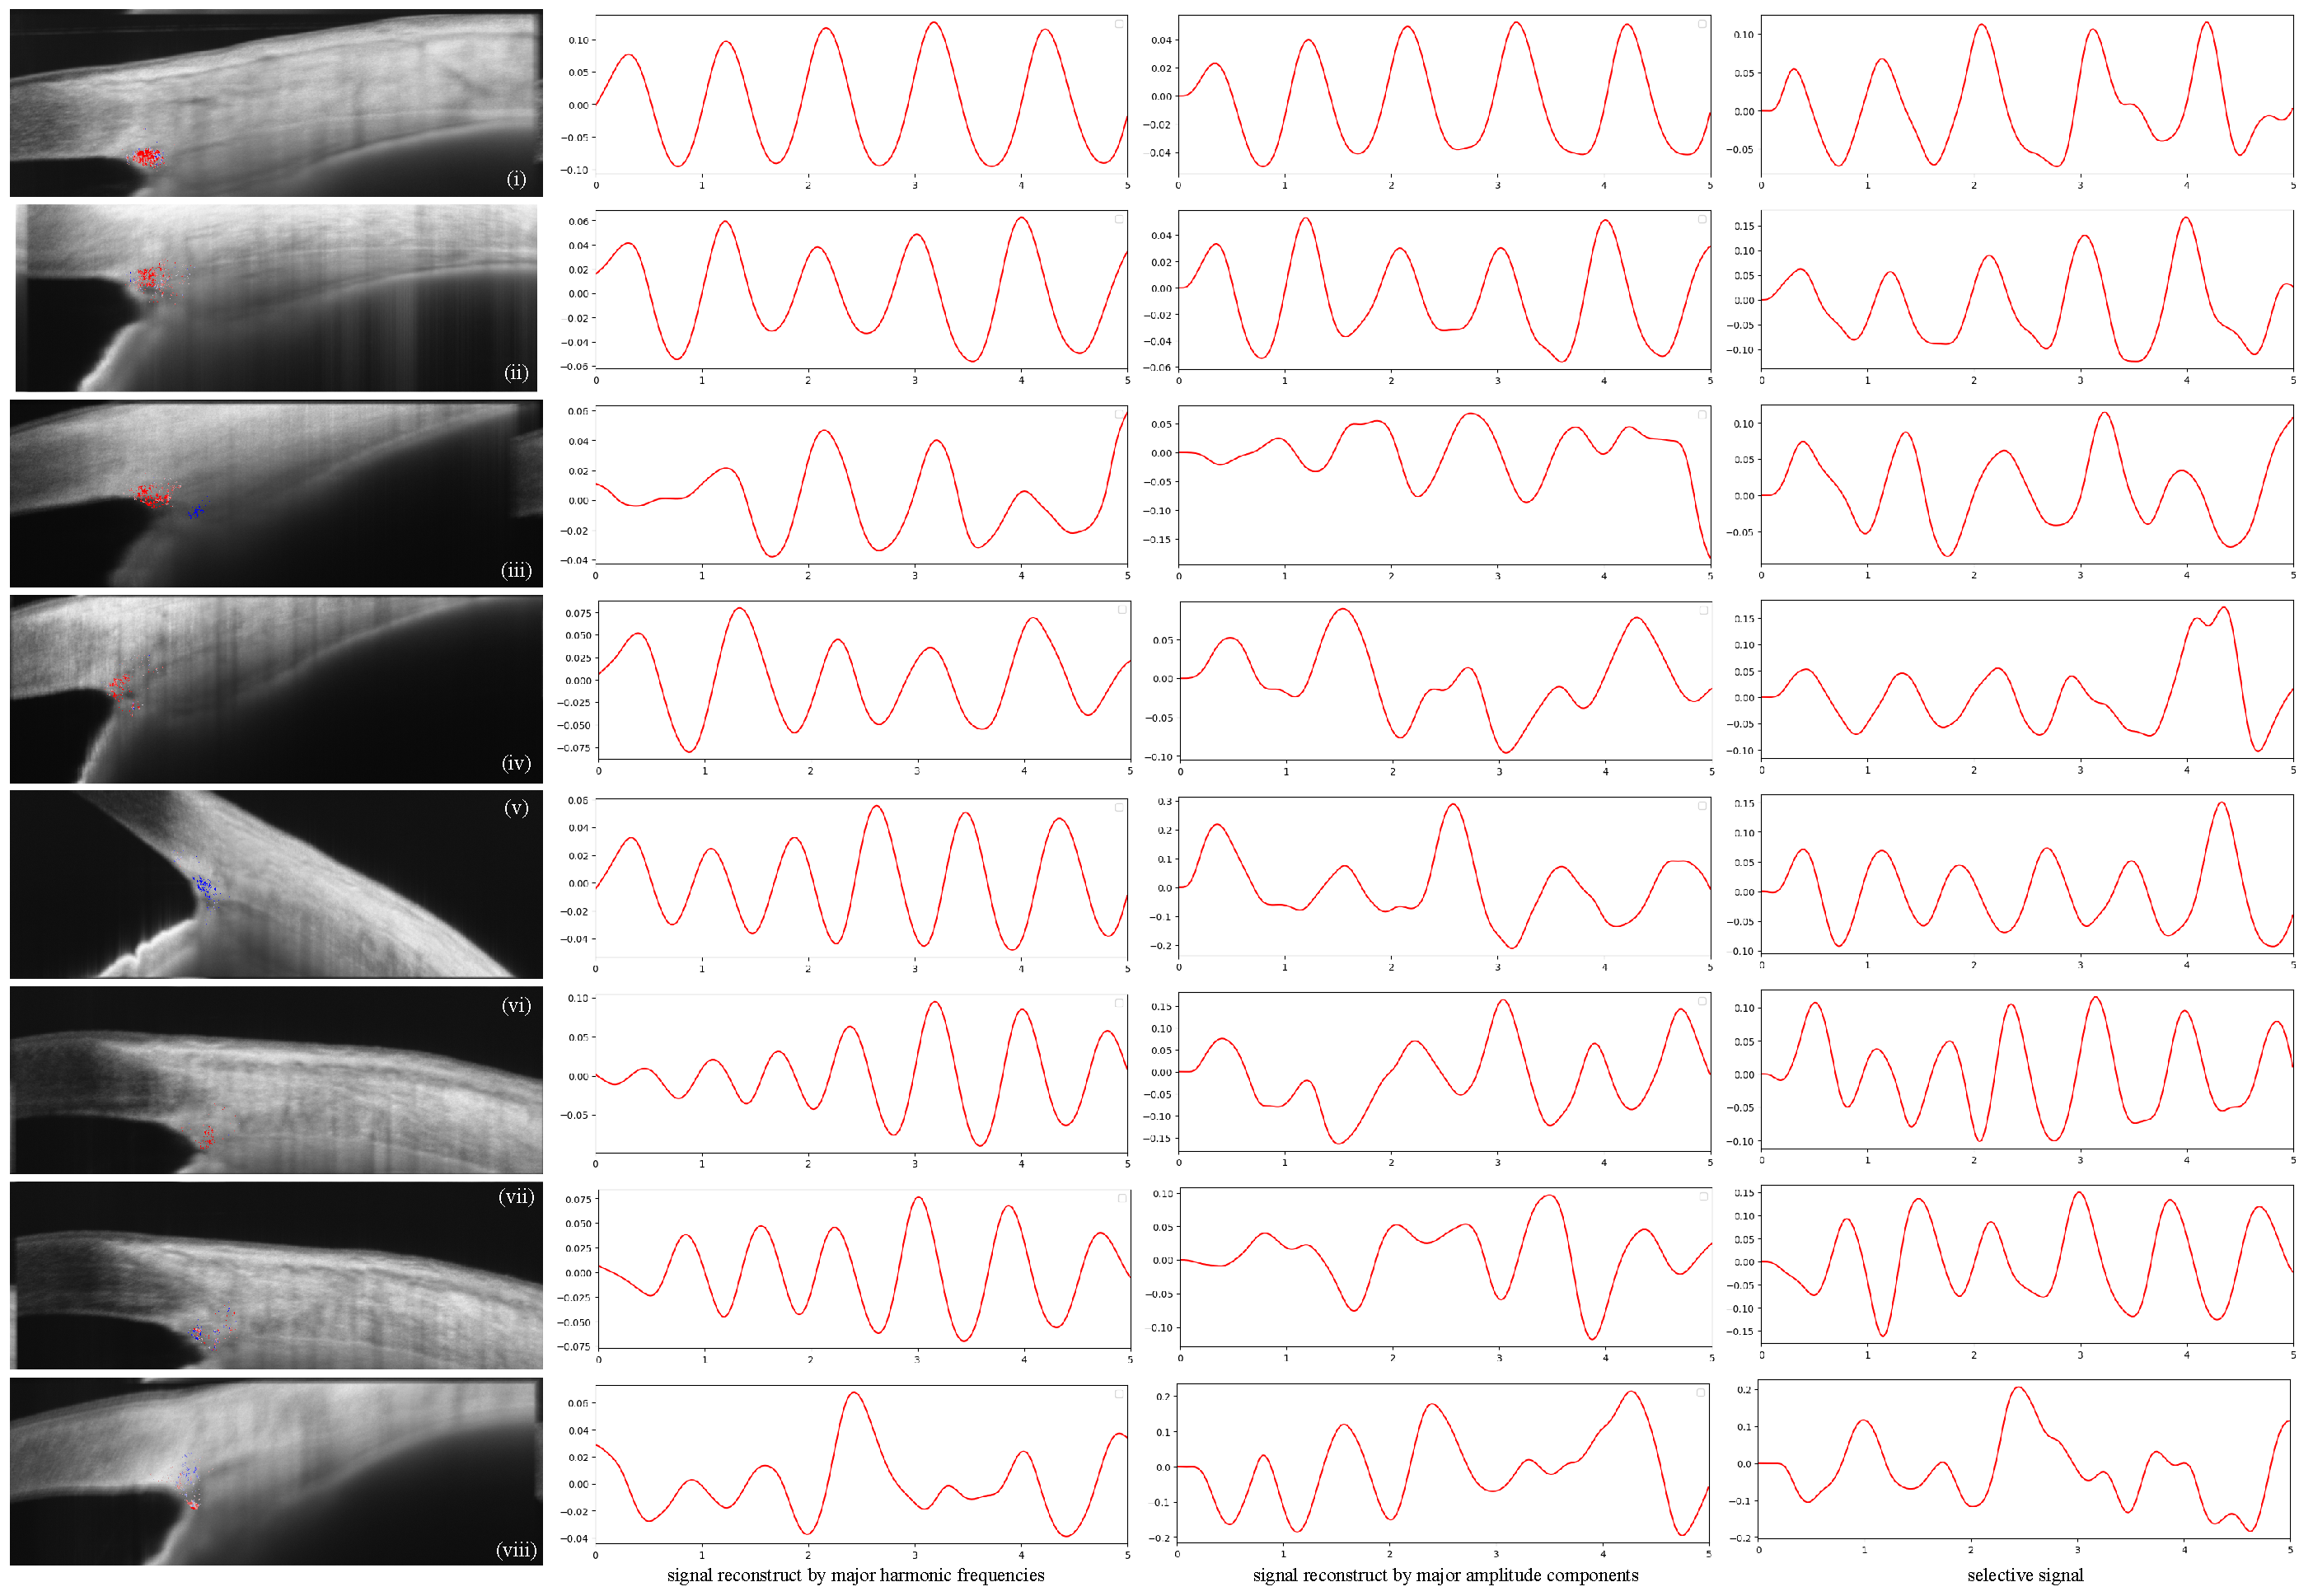
  • Signal reconstruction
Some methods have been applied for the task of “best representing the pulse waveform”, such as manually selecting the sample data, the mean value of all signal amplitudes, harmonic frequencies, etc. Harmonic analysis was used in Li’s work [34] for quantification of the relationship between the TM motion and the heart rate. The TM motion signal was represented using the first three harmonic frequencies.
Singular value decomposition (SVD) was applied in this paper to measure the consistency of the variation in the signal amplitudes. It has been widely used for PPG signal analysis [50]. Due to the low-rank assumption, significant signal changes are aligned to limited singular values. Furthermore, the head maximum values are generally considered as a period for the expected heart rate range. An observed signal matrix S was modeled as a mixture of these source signals X with additive and uncorrelated noise Z
S = AX + ξ Z .
A is the source mixture matrix, and AX is represented by the low-rank singular vectors AX = U Λ V , and Λ is composed of a serial of ordered singular values: σ 1 σ 2 0 . Since the noise level is hard to measure for PhS-OCT systems in general, the method in [51] was utilized:
σ ^ = σ ¯ μ b
where σ ¯ denotes the median operation of σ i . μ b is the median of the Marcenko–Pasturp distribution. Applying this procedure to S reduces the number of nonzero singular values by over 80% on average. When the consistency of the PhDiff was acceptable, the OCT scanning position was considered closed to the CCOs.

4. Results and Discussion

Results of TM Motion Signal Reconstruction

The two participants were Asian, one male and one female, both in their 30 s. Twenty-two cases of OCT sequence data were collected from four normal eyes. The OCT scanning positions were close to 0 and 180 of the iridocorneal angle. TM motion signals were observed in six cases, as shown in Figure 5.
In the first column, the motion signals inside the ROI are shown in pseudo-color. The second column shows the reconstructed signal by the first three harmonic frequencies. The third column shows the reconstructed results aligned to limited singular values.
The distribution of the signals in the first two rows of Figure 5 was significantly centered on the outer wall of the SC. Consistencies in the frequency, as well as the amplitude, were confirmed at the same time. The contrast image for these two cases is shown in Figure 6. The SC was identified. In the enlarged view of the TM-SC region, the CCs were identified.
In the cases of (iii) and (iv), although the SC was also observed in the OCT structural images, the PhDiff signal in the TM-SC regions was scattered. In addition, the consistency of the frequency and/or amplitude demonstrated irregularity. It was considered that the scanned position was biased against the CCOs, and consequently, the TM displacement was small. Despite the PhDiff signal remaining in cases (v) and (vi) with reasonable major harmonic frequency, the reconstructed amplitude signal was scrambled. Generally, physiological motion, such as respiration, eye movement and hemodynamics, may produce signal noise, especially in highly sensitive phase-based methods.
Limited by the line-scan protocol, in the experiment, a high-quality TM motion signal was obtained. According to anatomical research [52], the authors reported the number of collector channels to be in the range of 24 to 35 per eye. Meanwhile, the distribution of the CCs was random around the circumference of the SC. In addition, the diameter of the CC changed with IOP variations and with the cardiac pulse wave [53], from 20 μ m to approximately 50 μ m. Solid clinical experience is required to search for CCs using the cross-sectional OCT imaging method.
The heart rate of the participant was measured by BPG simultaneously. The recording time was 5 s, and the heart rate was in the range of 63.93 bpm to 65.88 bpm. One case of results is shown in Figure 7. The phase lag Δ θ between the BPG signal and the OCT PhDiff signal was approximately equal, the mean value of which was 2.95 rad (approx. 0.56 s). According to the assumption of Johnstone et al. [3], the cardiac cycle’s systole and diastole induce continuous oscillations that cause choroidal volume changes and ocular pulse. The ocular pulse results in cyclic pulse waves impinging on the AH system. Consequently, the PhDiff signal corresponds to variations in anterior chamber volume in synchronization with the cardiac pulse wave.
Figure 8 demonstrates one circle (approximately 0.9 s) of the motion signal sequence. Visually, the rhythm of all the PhDiff signals in the TM-SC region was consistent.

5. Conclusions

MIGS aims to bypass the inner wall of the SC and allow AH more direct access from the anterior chamber to the CCs at the outer aspect of the SC. Evaluation of the distal portion of the AHO, as well as the positioning of the implants, have a vital role in determining surgical success. One challenge of MIGS lies in the fact that the stents may not be positioned near the CCOs [5,6]. Moreover, some CCOs may be more active than others, which are more suitable for implanting [5]. This study provides a method for noninvasive CCO imaging in vivo. It has potential applicability in clinical practice for the canaloplasty surgery plan.
The phase-based OCT method is capable of imaging the variation related to AHO. In this study, the PhS-OCT method was performed to identify CCOs. Unlike the previous work [34], SS-OCT was utilized to image the TM-SC region, and provided a higher signal-to-noise ratio (SNR) than SD-OCT.
Waveform analysis could provide valuable information on TM motion wave recognition. To reduce the influence of bulk motion in vivo, reasonable signal identification is vital for subtle motion measurement when applying phased-based methods. A complete methodology for the evaluation of the PhDiff signal was provided. The PSR and the skewness were considered effective signal screening criteria. The consistency of the observation results (column 1 of Figure 5) and the regulation of the signal waveform (columns 2 and 3 of Figure 5) were confirmed. Compared to the methods of spectral estimation or amplitude, morphology analysis of the waveform provided more accurate and robust measurement of systolic peaks.
The primary deficiency of this study was the lack of anatomical evidence, although in previous studies [11,13,34,38,39], evidence suggested CCs and EVs may have a role in intraocular pressure, which induces TM motion. It is still an open and challenging topic.
The obvious shortcoming of TM-SC functional detection using a recently developed OCT device is the two-dimensional line-scan mode, although the scan arrangement covers the whole iridocorneal angle in a cross-section view. One of the possible reasons is that the motion in the TM-SC region is significant near the CCOs, the entrance of aqueous outflow to the vein. Evidence from imaging demonstrates pulsatile aqueous outflow and the pulse-dependent pressure-induced physical motion of the TM and the CCOs [14]. If the assumption is valid, it would substantially improve the optimal placement of MIGS devices where CCOs are closed and directly move the surgical sites to more appropriate alternatives and prevent blood reflux into the anterior chamber [7,10].

Funding

This research received no external funding.

Conflicts of Interest

There are no conflict of interest.

References

  1. Goel, M.; Picciani, R.G.; Lee, R.K.; Bhattacharya, S.K. Aqueous humor dynamics: A review. Open Ophthalmol. J. 2010, 4, 52–59. [Google Scholar] [CrossRef] [PubMed] [Green Version]
  2. Lütjen-Drecoll, E.; Shimizu, T.; Rohrbach, M.; Rohen, J.W. Quantitative analysis of ‘plaque material’ in the inner- and outer wall of Schlemm’s canal in normal- and glaucomatous eyes. Exp. Eye Res. 1986, 42, 443–455. [Google Scholar] [CrossRef]
  3. Johnstone, M.A. The aqueous outflow system as a mechanical pump: Evidence from examination of tissue and aqueous movement in human and non-human primates. J. Glaucoma 2004, 13, 421–438. [Google Scholar] [CrossRef] [PubMed]
  4. Hogan, M.; Alvarado, J.; Weddell, J. Histology of the Human Eye: An Atlas and Textbook; Saunders: Philadelphia, PA, USA, 1971; pp. 136–153, 260–319. [Google Scholar]
  5. Richter, G.M.; Coleman, A.L. Minimally invasive glaucoma surgery: Current status and future prospects. Clin. Ophthalmol. 2016, 10, 189–206. [Google Scholar]
  6. Yuan, F.; Schieber, A.; Camras, L.; Harasymowycz, P.; Herndon, L.; RR, A. Mathematical Modeling of Outflow Facility Increase with Trabecular Meshwork Bypass and Schlemm Canal Dilation. J. Glaucoma 2016, 25, 355–364. [Google Scholar] [CrossRef]
  7. Xin, C.; Wang, R.K.; Song, S.; Shen, T.; Wen, J.; Martin, E.; Jiang, Y.; Padilla, S.; Johnstone, M. Aqueous outflow regulation: Optical coherence tomography implicates pressure-dependent tissue motion. Exp. Eye Res. 2017, 158, 171–186. [Google Scholar] [CrossRef] [Green Version]
  8. Ahuja, Y.; Pyi, S.M.K.; Malihi, M.; Hodge, D.O.; Sit, A.J. Clinical results of ab interno trabeculotomy using the trabectome for open-angle glaucoma: The Mayo Clinic series in Rochester, Minnesota. Am. J. Ophthalmol. 2013, 156, 927–935. [Google Scholar] [CrossRef]
  9. Hariri, S.; Johnstone, M.; Jiang, Y.; Padilla, S.; Zhou, Z.; Reif, R.; Wang, R.K. Platform to investigate aqueous outflow system structure and pressure-dependent motion using high-resolution spectral domain optical coherence tomography. J. Biomed. Opt. 2014, 19, 1–11. [Google Scholar] [CrossRef]
  10. Huang, A.S.; Mohindroo, C.; Weinreb, R.N. Aqueous Humor Outflow Structure and Function Imaging At the Bench and Bedside: A Review. J. Clin. Exp. Ophthalmol. 2016, 7. [Google Scholar] [CrossRef] [Green Version]
  11. Hann, C.R.; Fautsch, M.P. Preferential fluid flow in the human trabecular meshwork near collector channels. Investig. Ophthalmol. Vis. Sci. 2009, 50, 1692–1697. [Google Scholar] [CrossRef]
  12. Rohen, J.W.; Rentsch, F.J. Morphology of Schlemm’s canal and related vessels in the human eye. Albrecht Von Graefe’S Arch. Clin. Exp. Ophthalmol. 1968, 176, 309–329. [Google Scholar] [CrossRef] [PubMed]
  13. Hann, C.R.; Bentley, M.D.; Vercnocke, A.; Ritman, E.L.; Fautsch, M.P. Imaging the aqueous humor outflow pathway in human eyes by three-dimensional micro-computed tomography (3D micro-CT). Exp. Eye Res. 2011, 92, 104–111. [Google Scholar] [CrossRef] [Green Version]
  14. Johnstone, M.A. A new model describes an aqueous outflow pump and explores causes of pump failure in glaucoma. In Essentials in Ophthalmology; Grehn, F., Stamper, R., Eds.; Springer: Berlin/Heidelberg, Germany, 2006; Chapter Glaucoma; pp. 3–34. [Google Scholar] [CrossRef]
  15. Johnstone, M.; Xin, C.; Tan, J.; Martin, E.; Wen, J.; Wang, R.K. Aqueous outflow regulation—21st century concepts. Prog. Retin. Eye Res. 2021, 83, 100917. [Google Scholar] [CrossRef] [PubMed]
  16. Bentley, M.D.; Hann, C.R.; Fautsch, M.P. Anatomical Variation of Human Collector Channel Orifices. Investig. Ophthalmol. Vis. Sci. 2016, 57, 1153–1159. [Google Scholar] [CrossRef]
  17. Fellman, R.L.; Feuer, W.J.; Grover, D.S. Episcleral Venous Fluid Wave Correlates with Trabectome Outcomes: Intraoperative Evaluation of the Trabecular Outflow Pathway. Ophthalmology 2015, 122, 2385–2391.e1. [Google Scholar] [CrossRef]
  18. Grieshaber, M.C.; Pienaar, A.; Olivier, J.; Stegmann, R. Clinical evaluation of the aqueous outflow system in primary open-angle glaucoma for canaloplasty. Investig. Ophthalmol. Vis. Sci. 2010, 51, 1498–1504. [Google Scholar] [CrossRef] [Green Version]
  19. Jhanji, V.; Chan, E.; Das, S.; Zhang, H.; Vajpayee, R.B. Trypan blue dye for anterior segment surgeries. Eye 2011, 25, 1113–1120. [Google Scholar] [CrossRef]
  20. Simpson, T.; Fonn, D. Optical coherence tomography of the anterior segment. Ocul. Surf. 2008, 6, 117–127. [Google Scholar] [CrossRef]
  21. Leung, C.K.s.; Cheung, C.Y.l.; Lin, D.; Pang, C.P.; Lam, D.S.C.; Weinreb, R.N. Comparison of macular thickness measurements between time domain and spectral domain optical coherence tomography. Investig. Ophthalmol. Vis. Sci. 2008, 49, 4886–4892. [Google Scholar] [CrossRef] [Green Version]
  22. Grewal, D.S.; Tanna, A.P. Diagnosis of glaucoma and detection of glaucoma progression using spectral domain optical coherence tomography. Curr. Opin. Ophthalmol. 2013, 24, 150–161. [Google Scholar] [CrossRef]
  23. Tatham, A.J.; Medeiros, F.A. Detecting Structural Progression in Glaucoma with Optical Coherence Tomography. Ophthalmology 2017, 124, S57–S65. [Google Scholar] [CrossRef] [PubMed]
  24. Ang, M.; Baskaran, M.; Werkmeister, R.M.; Chua, J.; Schmidl, D.; Aranha, D.S.V.; Garhöfer, G.; Mehta, J.S.; Schmetterer, L. Anterior segment optical coherence tomography. Prog. Retin. Eye Res. 2018, 66, 132–156. [Google Scholar] [CrossRef] [PubMed]
  25. Kagemann, L.; Wang, B.; Wollstein, G.; Ishikawa, H.; Nevins, J.E.; Nadler, Z.; Sigal, I.A.; Bilonick, R.A.; Schuman, J.S. IOP elevation reduces Schlemm’s canal cross-sectional area. Investig. Ophthalmol. Vis. Sci. 2014, 55, 1805–1809. [Google Scholar] [CrossRef] [PubMed]
  26. Chen, Z.; Milner, T.E.; Srinivas, S.; Wang, X.; Malekafzali, A.; van Gemert, M.J.C.; Nelson, J.S. Noninvasive imaging of in vivo blood flow velocity using optical Doppler tomography. Opt. Lett. 1997, 22, 1119–1121. [Google Scholar] [CrossRef] [PubMed]
  27. Chen, Z.; Zhao, Y.; Saxer, C.; Xiang, S.; de Boer, J.F.; Nelson, J.S. Phase-resolved OCT/ODT for imaging tissue microcirculation. In Proceedings of the Conference on Lasers and Electro-Optics, San Francisco, CA, USA, 7–11 May 2000; Optical Society of America: Washington, DC, USA, 2000; p. CThF1. [Google Scholar]
  28. Vakoc, B.; Yun, S.; de Boer, J.; Tearney, G.; Bouma, B. Phase-resolved optical frequency domain imaging. Opt. Express 2005, 13. [Google Scholar] [CrossRef] [PubMed] [Green Version]
  29. Wang, R.K.; Kirkpatrick, S.; Hinds, M. Phase-sensitive optical coherence elastography for mapping tissue microstrains in real time. Appl. Phys. Lett. 2007, 90, 164105. [Google Scholar] [CrossRef]
  30. Wang, R.K.; Nuttall, A.L. Phase-sensitive optical coherence tomography imaging of the tissue motion within the organ of Corti at a subnanometer scale: A preliminary study. J. Biomed. Opt. 2010, 15, 056005. [Google Scholar] [CrossRef] [Green Version]
  31. Szkulmowski, M.; Szkulmowska, A.; Bajraszewski, T.; Kowalczyk, A.; Wojtkowski, M. Flow velocity estimation using joint Spectral and Time domain Optical Coherence Tomography. Opt. Express 2008, 16, 6008–6025. [Google Scholar] [CrossRef]
  32. Schwartz, D.M.; Fingler, J.; Kim, D.Y.; Zawadzki, R.; Morse, L.S.; Park, S.S.C.; Fraser, S.E.; Werner, J.S. Phase-variance optical coherence tomography: A technique for noninvasive angiography. Ophthalmology 2014, 121, 180–187. [Google Scholar] [CrossRef] [Green Version]
  33. Li, P.; Reif, R.; Zhi, Z.; Shen, T.; Wang, R.K.; Martin, E.; Johnstone, M. Phase-sensitive optical coherence tomography characterization of pulse-induced trabecular meshwork displacement in ex vivo nonhuman primate eyes. J. Biomed. Opt. 2012, 17, 076026. [Google Scholar] [CrossRef] [Green Version]
  34. Li, P.; Reif, R.; Zhi, Z.; An, L.; Martin, E.; Shen, T.T.; Johnstone, M.; Wang, R.K. Phase-sensitive optical coherence tomography characterization of pulse-induced trabecular meshwork displacement in ex vivo non-human primate eyes. In Proceedings of the Optical Coherence Tomography and Coherence Domain Optical Methods in Biomedicine XVII. International Society for Optics and Photonics, San Francisco, CA, USA, 20 March 2013; Volume 8571, p. 85711S. [Google Scholar] [CrossRef]
  35. Gao, K.; Song, S.; Johnstone, M.A.; Zhang, Q.; Xu, J.; Zhang, X.; Wang, R.K.; Wen, J.C. Reduced Pulsatile Trabecular Meshwork Motion in Eyes With Primary Open Angle Glaucoma Using Phase-Sensitive Optical Coherence Tomography. Investig. Ophthalmol. Vis. Sci. 2020, 61, 21. [Google Scholar] [CrossRef] [PubMed]
  36. Xin, C.; Wang, X.; Wang, N.; Wang, R.; Johnstone, M. Trabecular Meshwork Motion Profile from Pulsatile Pressure Transients: A New Platform to Simulate Transitory Responses in Humans and Nonhuman Primates. Appl. Sci. 2022, 12, 11. [Google Scholar] [CrossRef]
  37. Wu, C.; Aglyamov, S.R.; Han, Z.; Singh, M.; Liu, C.H.; Larin, K.V. Assessing the biomechanical properties of the porcine crystalline lens as a function of intraocular pressure with optical coherence elastography. Biomed. Opt. Express 2018, 9, 6455–6466. [Google Scholar] [CrossRef] [PubMed]
  38. Ren, J.; Gille, H.K.; Wu, J.; Yang, C. Ex vivo optical coherence tomography imaging of collector channels with a scanning endoscopic probe. Investig. Ophthalmol. Vis. Sci. 2011, 52, 3921–3925. [Google Scholar] [CrossRef] [Green Version]
  39. Xin, C.; Chen, X.; Li, M.; Shi, Y.; Wang, H.; Wang, R.; Wang, N. Imaging collector channel entrance with a new intraocular micro-probe swept-source optical coherence tomography. Acta Ophthalmol. 2017, 95, 602–607. [Google Scholar] [CrossRef] [Green Version]
  40. Akagi, T.; Uji, A.; Huang, A.S.; Weinreb, R.N.; Yamada, T.; Miyata, M.; Kameda, T.; Ikeda, H.O.; Tsujikawa, A. Conjunctival and Intrascleral Vasculatures Assessed Using Anterior Segment Optical Coherence Tomography Angiography in Normal Eyes. Am. J. Ophthalmol. 2018, 196, 1–9. [Google Scholar] [CrossRef] [Green Version]
  41. Parc, C.E.; Johnson, D.H.; Brilakis, H.S. Giant vacuoles are found preferentially near collector channels. Investig. Ophthalmol. Vis. Sci. 2000, 41, 2984–2990. [Google Scholar]
  42. Xu, J.; Song, S.; Men, S.; Wang, R.K. Long ranging swept-source optical coherence tomography-based angiography outperforms its spectral-domain counterpart in imaging human skin microcirculations. J. Biomed. Opt. 2017, 22, 1–11. [Google Scholar] [CrossRef]
  43. Song, S.; Zhou, K.; Xu, J.J.; Zhang, Q.; Lyu, S.; Wang, R. Development of a clinical prototype of a miniature hand-held optical coherence tomography probe for prematurity and pediatric ophthalmic imaging. Biomed. Opt. Express 2019, 10, 2383–2398. [Google Scholar] [CrossRef]
  44. Kirkpatrick, S.J.; Wang, R.K.; Duncan, D.D. OCT-based elastography for large and small deformations. Opt. Express 2006, 14, 11585–11597. [Google Scholar] [CrossRef] [Green Version]
  45. Duncan, D.D.; Kirkpatrick, S.J.; Mark, F.F.; Hunter, L.W. Transform method of processing for speckle strain-rate measurements. Appl. Opt. 1994, 33, 5177–5186. [Google Scholar] [CrossRef] [PubMed]
  46. Song, S.; Xu, J.; Men, S.; Shen, T.T.; Wang, R.K. Robust numerical phase stabilization for long-range swept-source optical coherence tomography. J. Biophotonics 2017, 10, 1398–1410. [Google Scholar] [CrossRef] [PubMed] [Green Version]
  47. Elgendi, M. Optimal signal quality index for photoplethysmogram signals. Bioengineering 2016, 3, 21. [Google Scholar] [CrossRef] [PubMed] [Green Version]
  48. Crowell, E.L.; Baker, L.; Chuang, A.Z.; Feldman, R.M.; Bell, N.P.; Chévez-Barrios, P.; Blieden, L.S. Characterizing anterior segment OCT angle landmarks of the trabecular meshwork complex. Ophthalmology 2018, 125, 994–1002. [Google Scholar] [CrossRef]
  49. Elgendi, M.; Norton, I.; Abbott, D.; Schuurmans, D. Systolic peak detection in acceleration photoplethysmograms measured from emergency responders in tropical conditions. PLoS ONE 2013, 8, e76585. [Google Scholar] [CrossRef] [Green Version]
  50. Reddy, K.A.; Kumar, V.J. Motion artifact reduction in photoplethysmographic signals using singular value decomposition. In Proceedings of the 2007 IEEE Instrumentation & Measurement Technology Conference IMTC 2007, Warsaw, Poland, 1–3 May 2007; IEEE: Piscataway, NJ, USA, 2007; pp. 1–4. [Google Scholar]
  51. Gavish, M.; Donoho, D.L. The optimal hard threshold for singular values is 4/ 3 . IEEE Trans. Inf. Theory 2014, 60, 5040–5053. [Google Scholar] [CrossRef]
  52. Ashton, N. Anatomical study of Schlemm’s canal and aqueous veins by means of neoprene casts: Part I. aqueous veins. Br. J. Ophthalmol. 1951, 35, 291. [Google Scholar] [CrossRef] [Green Version]
  53. Xin, C.; Song, S.; Johnstone, M.; Wang, N.; Wang, R.K. Quantification of pulse-dependent trabecular meshwork motion in normal humans using phase-sensitive OCT. Investig. Ophthalmol. Vis. Sci. 2018, 59, 3675–3681. [Google Scholar] [CrossRef] [Green Version]
Figure 1. Aqueous humor pathway (repurposed from [4]). Although the morphology of the trabecular meshwork and Schlemm’s canal appear similar around the circumference of the eye, the collector channels orifices are not evenly dispersed around the outer wall of the SC.
Photonics 09 00593 g001
Figure 2. Schematic of the measurement system used in this study, which includes an SS−OCT, a camera for orienting the scan target and a blood pressure gauge with the finger attached. The detector of the SS−OCT and the BPG device was triggered to record simultaneously. WMD: wavelength division multiplexer; OC: optical coupler; CIR: circulator; CL: collimating lens; BD: balanced detector; OL: objective lens.
Photonics 09 00593 g002
Figure 3. Frequency spectrum of the PhDiff signal sampled on the iridocorneal angle, including ➀: the trabecular meshwork and Schlemm’s canal adjacent region; ➁: the ciliary body region; ➂: the corneal region; and ➃: the iris region. The red arrow points to the trabecular meshwork, and the blue arrow points to the SC. The unit of the horizontal axis of the frequency spectrum graphic is Hertz.
Photonics 09 00593 g003
Figure 4. Flowchart of signal processing. (A), OCT phase signal in the iridocorneal cross section. (B), PhDiff signal after phase images registration and phase compensation. (C), PhDiff signal processed by the Butterworth filter. (D), set region of interest. (E), candidate trabecular meshwork motion signal. (F), trabecular meshwork motion waveform. The color map in (AC) was generated from the “Lookup tables” function of ImageJ software (NIH, USA). The red/blue represent the reverse diffuse directions of the signals.
Photonics 09 00593 g004
Figure 5. The results of the TM motion signal on the OCT cross-sectional images and the corresponding waveform. The first column (iviii) demonstrates the candidate signal region over the OCT structural image. The final signal was reconstructed using the major harmonic frequencies and the SVD method separately, as the second and the third columns shown. The right column is the selected signal from the candidate TM motion signals.
Photonics 09 00593 g005
Figure 6. Contrast OCT structural images for subfigures (i) and (ii) of Figure 5. The trabecular meshwork (TM) and Schlemm’s canal (SC) are marked by the pink and blue dashed lines, respectively. In the enlarged view of the TM-SC region, a microtubule structure is marked by the red arrows.
Photonics 09 00593 g006
Figure 7. Synchronous comparison of the OCT PhDiff signal (OCT) and blood pressure gauge (BPG) signal. The red line denotes the OCT signal, and the blue dashed line denotes the BPG signal. The phase lag in one period of two signals (peak-to-peak) was relatively consistent. The waveform of the BPG signal consisted of local features: the systolic peak (I), dicrotic notch (II) and the diastolic peak (III).
Photonics 09 00593 g007
Figure 8. OCT PhDiff signal at anterior chamber during one period.
Photonics 09 00593 g008
Table 1. Performance indicators of SS-OCT.
OCTCentral WavelengthSpectral BandwidthIncident Energy  1 Sweeping Rate
Protocol1300 nm≥170 nm5 mW20 kHz
imageaxial resolutionlateral resolutionframe rate
information∼9  μ m4.7 μ m200 fps
1 Maximum value of output power on sampling arm..
Publisher’s Note: MDPI stays neutral with regard to jurisdictional claims in published maps and institutional affiliations.

