Article

Measuring of Transverse Energy Flows in a Focus of an Aluminum Lens

by
Elena Kozlova
1,2,*,
Sergey Stafeev
1,2,
Sergey Fomchenkov
1,2,
Vladimir Podlipnov
1,2,
Alexandra Savelyeva
1,2 and
Victor Kotlyar
1,2
1
Image Processing Systems Institute of the RAS—Branch of FSRC “Crystallography & Photonics” of the RAS, 151 Molodogvardeyskaya St., 443001 Samara, Russia
2
Technical Cybernetics Department, Samara National Research University, Moskovskoye Shosse 34, 443086 Samara, Russia
*
Author to whom correspondence should be addressed.
Photonics 2022, 9(8), 592; https://doi.org/10.3390/photonics9080592
Submission received: 20 July 2022 / Revised: 13 August 2022 / Accepted: 17 August 2022 / Published: 20 August 2022
(This article belongs to the Special Issue Light Focusing and Optical Vortices)

Abstract

:
In this study, we theoretically and experimentally investigate the propagation of a second-order cylindrical vector beam through an aluminum lens which forms a tight focus at the distance of the wavelength. Simulation by the finite-difference time-domain method and the Richards–Wolf formulae produces light field distributions which coincide with experimental measurements provided with scanning near-field optical microscopy. We demonstrate that a pyramidal metallized cantilever with a hole is more sensitive to the transversal component of intensity than to the full intensity or to the Umov–Poynting vector in areas of reverse energy flow.

1. Introduction

Scanning near-field optical microscopy (SNOM) is widely used for research in the field of plasmonics, nanophotonics, etc. [1,2,3,4,5]. Due to SNOM, researchers can detect light fields near the interfaces between two media. In addition to propagating light waves, which can be detected by classical optical microscopy, there are also evanescent waves, which conventional microscopes are powerless to detect.
There are two types of cantilevers for detecting radiation with SNOM: apertureless (s-SNOM) [6,7,8] and aperture (a-SNOM) [9,10,11,12]. Even though there has recently been a steady increase in the application of apertureless SNOM, interest in aperture SNOM remains. This can be explained by the great complexity of measurements using apertureless SNOM techniques.
There are two types of aperture SNOM: that based on metallized tapered fiber and that on hollow pyramidal cantilevers. A distinctive feature of aperture SNOM, as it is clear from the designation, is the presence of a small hole—an aperture at the end of the probe. Through this gap, the detection of transmitted radiation is carried out. The hole diameter varies from several tens to hundreds of nanometers. The gap usually has the form of a circle. However, to solve specific problems, another shape of the SNOM cantilever aperture can be used. In [13], the polarization sensitivity of aperture SNOM cantilevers with a rectangular hole was studied. It was shown that the transmission of radiation increased if the polarization of the incident on the cantilever light was directed along the larger side of the rectangle.
In [14], fiber-based aperture SNOM was applied to investigate the interference pattern of surface plasmon polaritons produced by light with different polarizations. A probe was proposed in [15], where a microsphere was fixed in the hole of a pyramidal cantilever. Aperture cantilevers with a gap in the shape of a “bowtie” can be made both in metalized waveguides [16,17] and in pyramidal cantilevers [18]. This aperture shape operates like a nanoantenna, allowing a local amplification of the light field, for example, for lithographic purposes. The polarization properties of pyramidal cantilevers were studied in [19,20]. It was shown that in the near-field region, such cantilevers were more sensitive to the polarization of the radiation passing through them than away from the interface between two media. A cantilever with a square hole was used in [21] to detect luminescent nanoparticles. In [22], the sharp focusing of the light field by a Fresnel zone plate (ZP) was studied. It was shown that the shape of the focal spot recorded with a standard pyramidal SNOM cantilever was closer to the shape of a transversal component of intensity than to the full intensity and was not close to the longitudinal component of the Umov–Poynting vector. Carbon tip aperture cantilevers were introduced in [23,24]. The effect of the aperture cantilever on a process of measurement was studied in [25].
Previously, using numerical modeling, we studied the tight focusing of second-order cylindrical vector beams (CVBs) [26] and optical vortices with a topological charge of two [27] with a phase zone plate. It was shown that there were regions in the center of the focal spots in which the Umov–Poynting vector was directed opposite to the propagation of the laser beam. An experimental study of the tight focusing of such beams using SNOM has not been previously investigated.
Fresnel zone plates and the lenses based on them are widely used in the applications of light focusing [28,29,30,31,32,33,34,35,36]. Of particular interest are spiral zone plates and spiral axicons, which make it possible to simultaneously form and focus a vortex beam [37,38,39,40,41]. Recently, the scientific community has had an increased interest in studying more complex vector field focusing [32,42,43,44,45,46]. For example, in [32], a metalens for the effective control of amplitude, phase, and polarization was considered. This metalens was manufactured with a thin, amorphous silicon film. Amorphous silicon nanobars highly limit magnetic dipole resonances with the phase difference π at an incident wavelength of 635 nm and thus obtain lofty cross-polarization and zero co-polarization transmittance. The manufactured metalens demonstrated 1.5- and 2.3-times higher efficiency of focusing and image contrast, respectively, than those of a conventional zone plate in a chromium film (100 nm). In [42], the characteristics of radially and azimuthally polarized beams after passing through plasmonic subwavelength structures in the form of annular slots were theoretically and numerically studied. In [43], a giant angular spin Hall effect of light was investigated. In [44], using the finite-difference time-domain (FDTD) method, the focusing of CVBs by a helical metasurface with a unit topological charge and unit numerical aperture (NA), which focused light at the distance of the incident wavelength, was studied. It was shown that this lens created near its surface circular and doughnut focal spots for incident TE-waves and TM-waves, respectively. The focal spot diameter for incident TE-waves was less than the diffraction limit. The distribution of intensity in the produced focal spot contained local (dissymmetrical and symmetrical) areas of a reverse energy flow, which could be situated both in the periphery and in the center.
In this research, we studied the propagation of a second-order CVB through an amplitude lens with a diameter equal to 15 μm, which focused the incident beam at a distance of the incident wavelength. The lens was manufactured by means of chemical etching, electron-beam lithography, and a lift-off process in a 50-nm-thick aluminum film. Numerical modeling by applying the FDTD method and the Richards–Wolf formulae demonstrated that such a lens formed a region in the focal spot on the axis, in which the Umov–Poynting vector was directed opposite to the incident light propagation direction (the region of the inverse energy flow). Both the distribution of the Umov–Poynting vector longitudinal component and the intensity had the forms of rings. However, the Umov–Poynting vector longitudinal component had a symmetrical ring, while the intensity had an asymmetric ring due to the uneven contribution of various components. In particular, the transverse intensity component was nonzero on the optical axis and had the form of three peaks located along the x-axis. Then, the region of the energy backflow was investigated using an Ntegra Spectra (NT-MDT) scanning near-field optical microscope based on a hollow pyramidal aperture cantilever. The peak intensity distribution at the focus was experimentally recorded (with the subwavelength sizes FWHMx = 0.39λ and FWHMy = 0.71λ where λ is incident wavelength of 532 nm). This fact proved the sensitivity of the cantilever to the cross-section component of the light field intensity in the reverse energy flow region.
CVB is used in a wide variety of applications, such as nanostructuring, optical capture, and optical telecommunications [47,48]. In addition, studies in the field of spin–orbit conversion in a tight focus of beams with hybrid polarization are topical [45,46]. The research of CVB behavior is significant because of the different polarization effects present, for example, the reverse energy flow in its tight focus. Moreover, the problem of experimental detection of these effects is of particular importance.

2. Materials and Methods

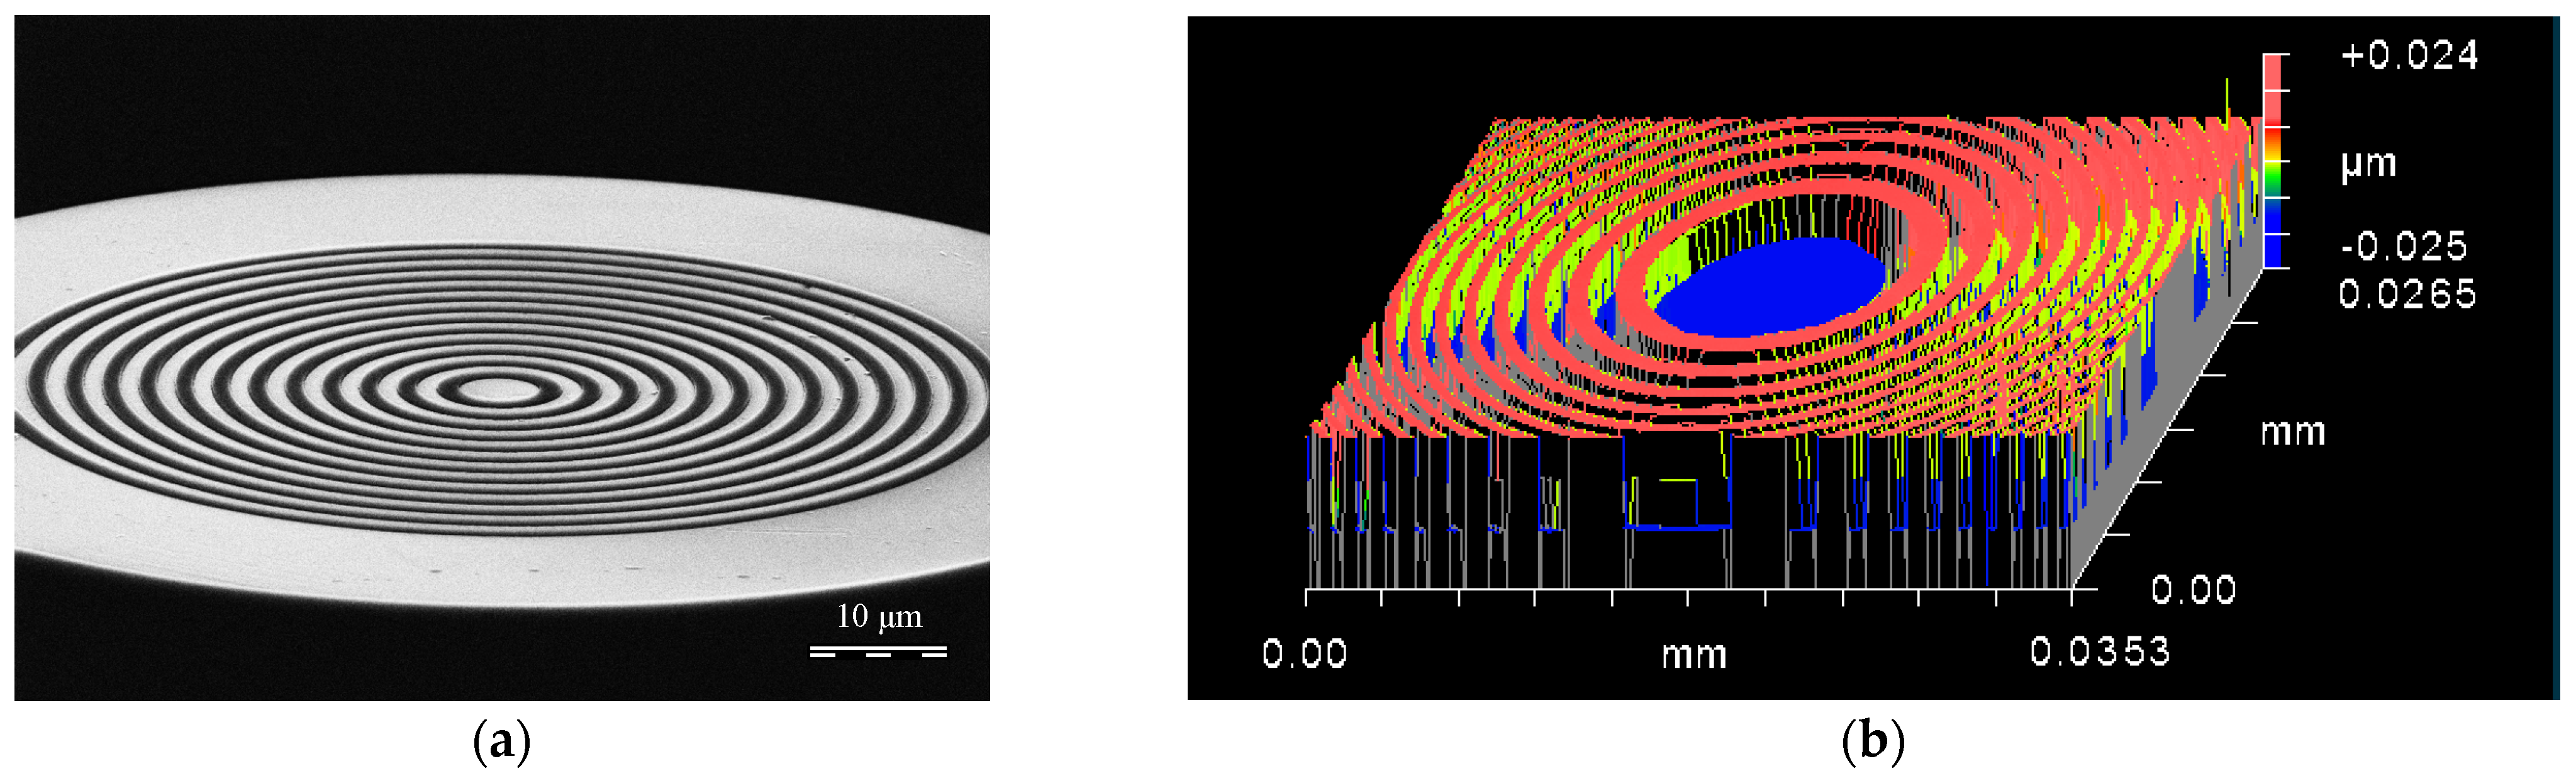
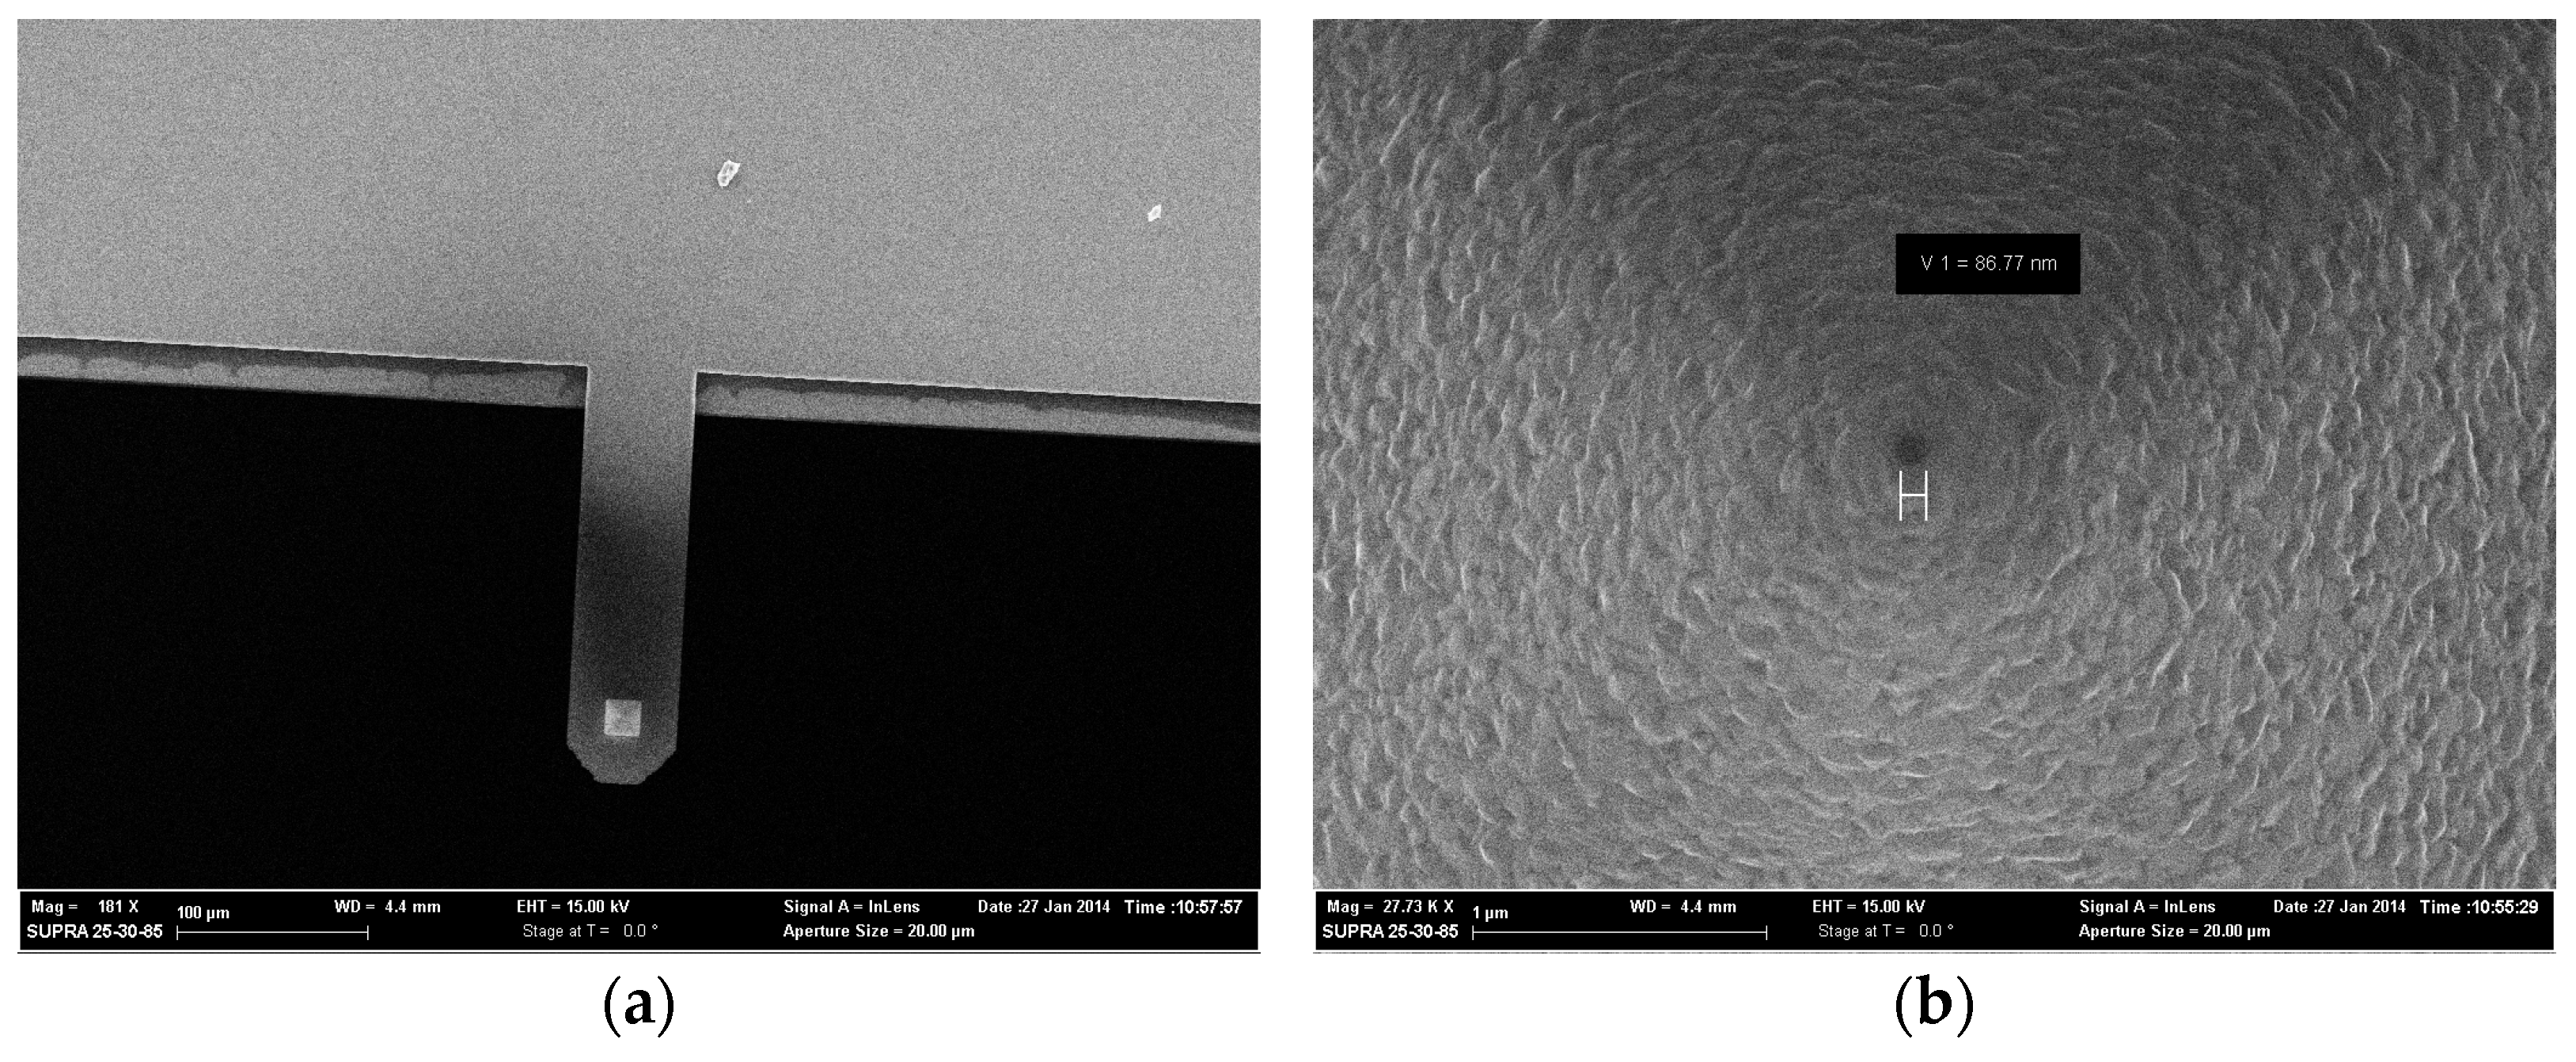
Structure and Manufacturing of the Lens

The proposed lens had the form of concentric rings. The ring radii were calculated using the formula:
r m = ( m λ f m 2 λ 2 4 ) 1 / 2 ,
where rm is the edge radius of the relief ring, m is the concentric zone number, λ is the incident beam wavelength, and f is the focal distance. The proposed lens was calculated for illumination with λ = 532 nm and f = λ. The lens diameter was 15 μm. The NA of the lens with these parameters was 0.99749.
For the manufacturing of the subwavelength diffractive optical element, technologies including lithography, chemical etching, and a lift-off process were used. Quartz was used as the substrate of the future element. The surface roughness was less than 10 nm. A metal film was deposited onto a quartz substrate using a CarolineD12A magnetron deposition system (ESTO-Vacuum, Inc., Moscow, Russia). The metal layer was formed during the deposition of aluminum at a vacuum pressure of 10−3 Pa and a power of 300–700 W. The thickness of the aluminum film was controlled by the deposition time and amounted to 50 nm. Next, a resist for electron-beam lithography was applied in a centrifuge. The thickness of the deposited resist was 400 nm (monitored on a P-16 profilometer (KLA-Tencor, Inc., Milpitas, CA, USA)). The exposure of the resist was performed with a SEM microscope with a resolution of 10 nm. The remaining mask was then chemically removed from the resist. The resulting structure was cleaned and baked to increase adhesive properties. A thin chromium film was deposited by a CarolineD12A magnetron sputtering machine (ESTO-Vacuum, Inc.). The deposition took place at the following parameters: 700 W and 10−3 Pa. The film thickness was 45 nm. Further, a lift-off process was used. The resist was removed by acetone along with the chromium film on it. This made it possible to obtain a negative mask in chromium compared with the mask on the resist. The metal layer was removed through the chromium film with NaOH. At the last stage, the chromium mask was removed by potassium hexacyanoferrate (III) (K3[Fe(CN)6]) for 10 min. The image of the manufactured lens obtained by a SEM microscope is presented in Figure 1a. To check the fabrication quality and parameters of the manufactured element, an optical white light interferometer (“Zygo New View 7300”) was applied. The sizes of the analyzed area were 35 μm × 26 μm and the optical zoom was 200×. The relief height of the lens was 50 nm. The results of measurement are demonstrated in Figure 1b.

3. Results and Discussion

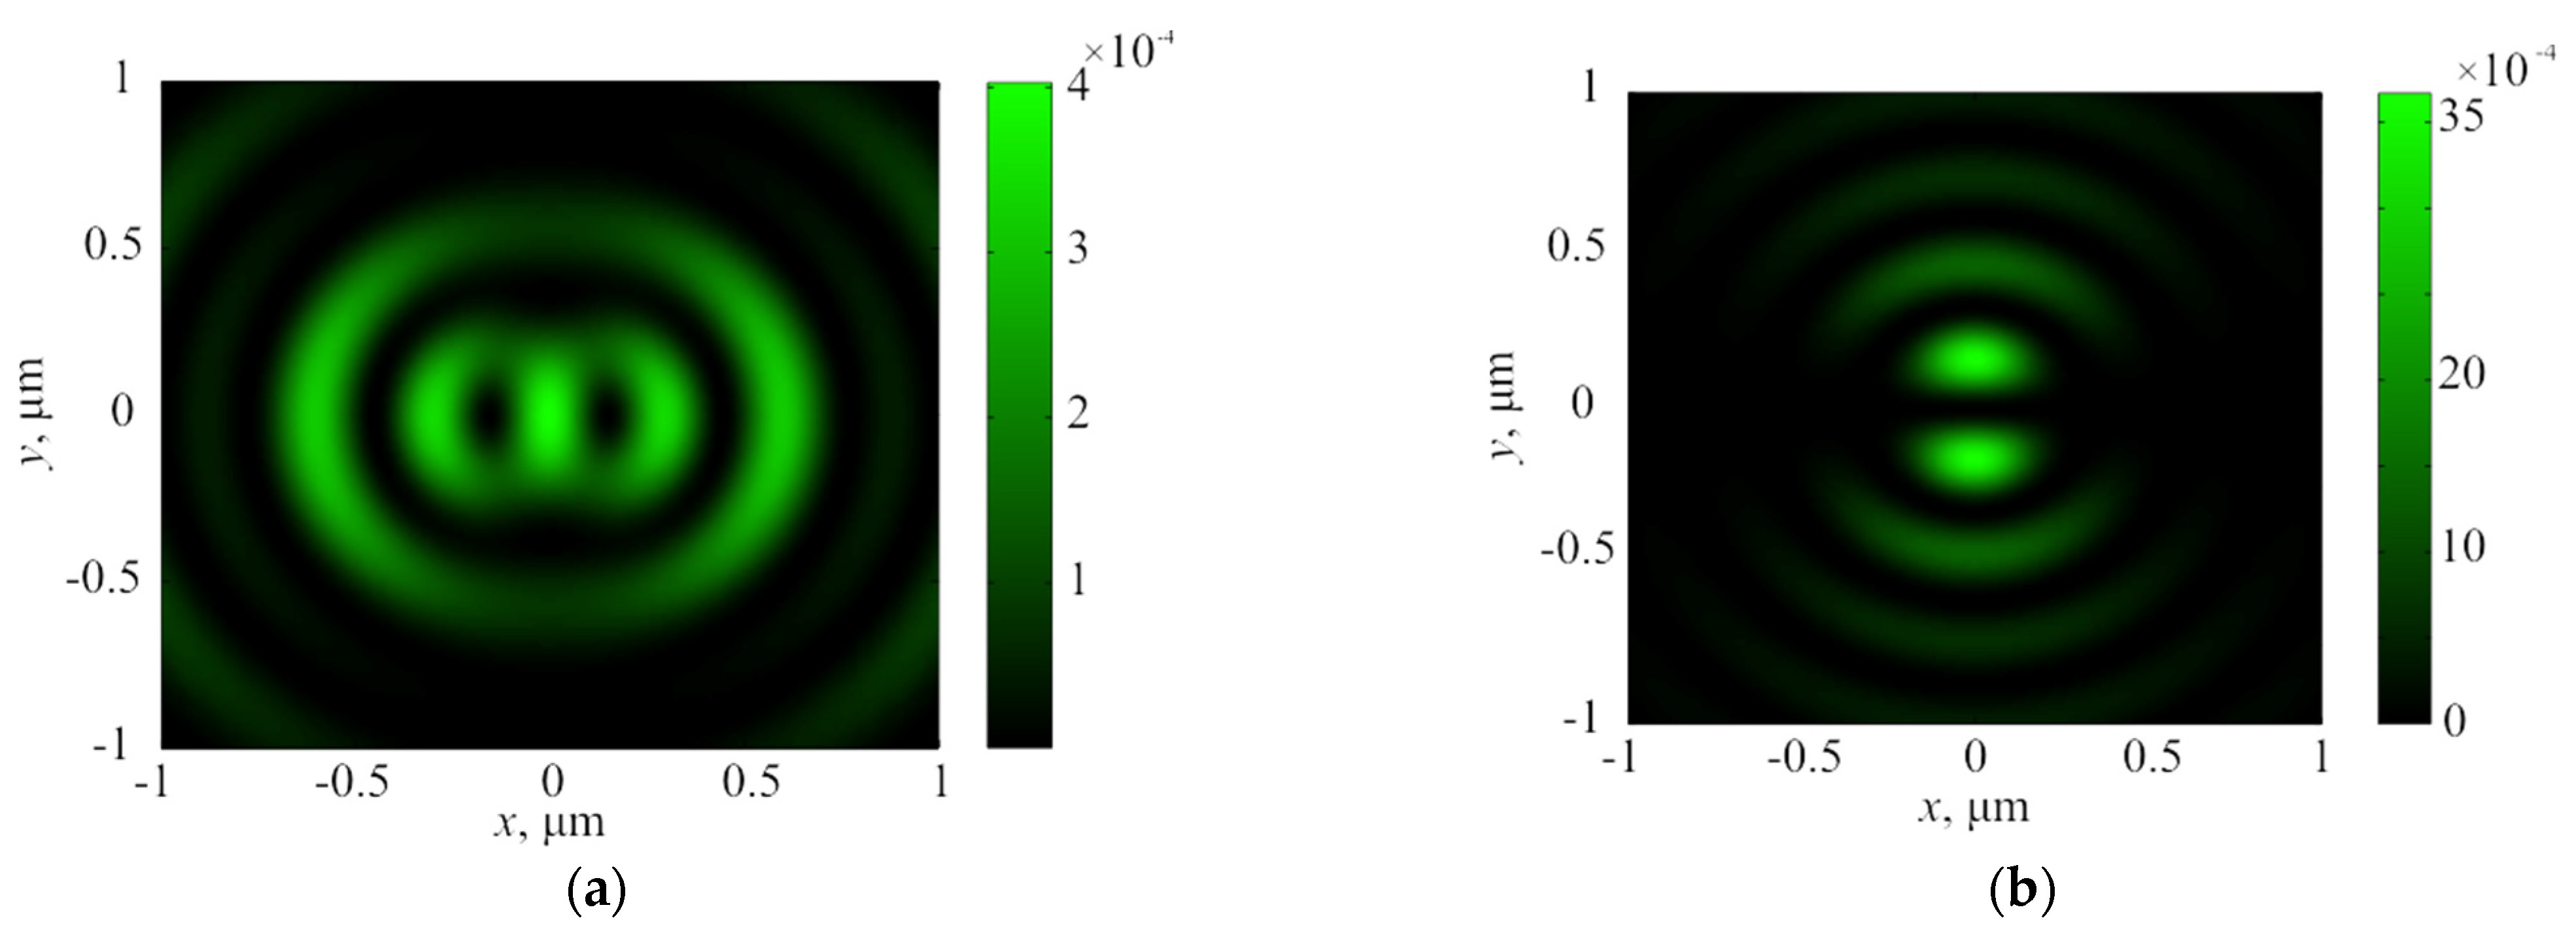
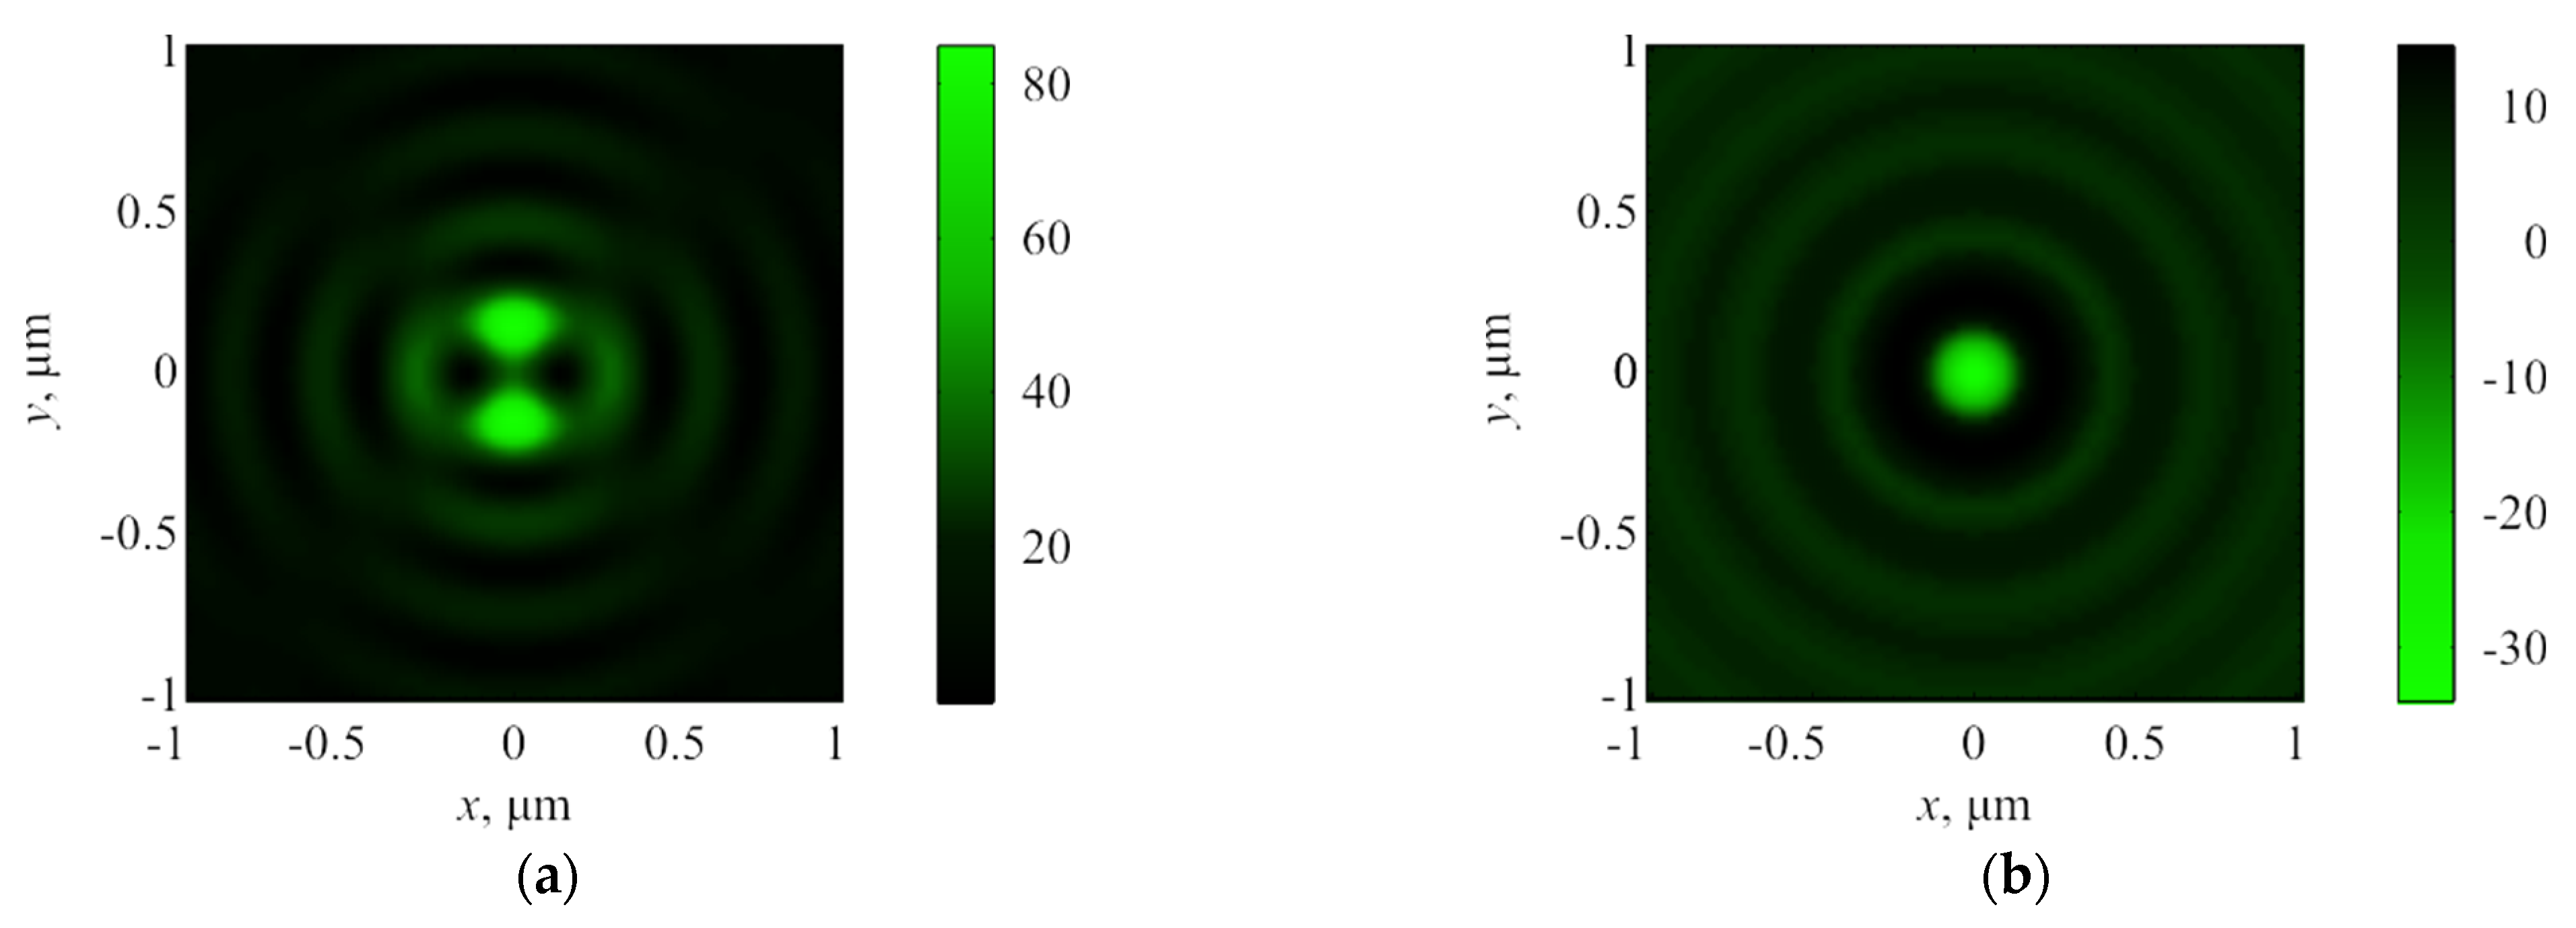
3.1. The Results of Modeling by the FDTD Method

The simulation was performed applying the frequency-dependent FDTD ((FD)2TD) method, implemented in FullWAVE software. The following grid parameters were used in the calculations: the spatial step was 15 nm, and the pseudo-time step cΔt was chosen to be 7.5 nm in conformity with the Courant condition. During the analysis of the simulation results, the field components were averaged over 10 periods. The parameters of the lens in the simulation (diameter, focal length, relief depth) corresponded to the parameters of the manufactured element. Possible manufacturing errors were not considered.
The intensity at the focus was calculated by the formula:
I = | E x | 2 + | E y | 2 + | E z | 2 = I x + I y + I z ,
where Ex, Ey, and Ez are the components of the electric field; Ix, Iy, and Iz are the components of the intensity distribution. The Umov–Poynting vector was calculated with the formula:
S = Re (E* × H),
where E and H are the vectors of the electric and magnetic fields in focus with components (Ex, Ey, and Ez) and (Hx, Hy, and Hz), respectively. The initial light field was chosen as E = (sin 2φ, cos 2φ, 0), where φ is the polar angle in the XY-plane at z = 0. The results of focusing at a distance of f = 532 nm are shown in Figure 2 and Figure 3.
It can be seen from Figure 2 and Figure 3 that the distributions of the intensity and the Umov–Poynting vector longitudinal component in the plane of the focus were ring-shaped: asymmetric for the intensity (Figure 2a) and symmetric in the case of the Umov–Poynting vector longitudinal component (Figure 2b). In this case, negative values were observed in the center of the ring formed by the Umov–Poynting vector longitudinal component (reverse energy flow). The asymmetry of the intensity ring was caused by the uneven contribution of individual intensity components to the formation of this ring; the longitudinal component (Figure 3b) formed the top and bottom of the ring (it had the form of two peaks located along the y-axis), and the transverse component formed the right and left parts of the ring (it had the form of three peaks located along the x-axis). In this case, it was the transverse component of the intensity that was nonzero on the z-axis (Figure 3a).

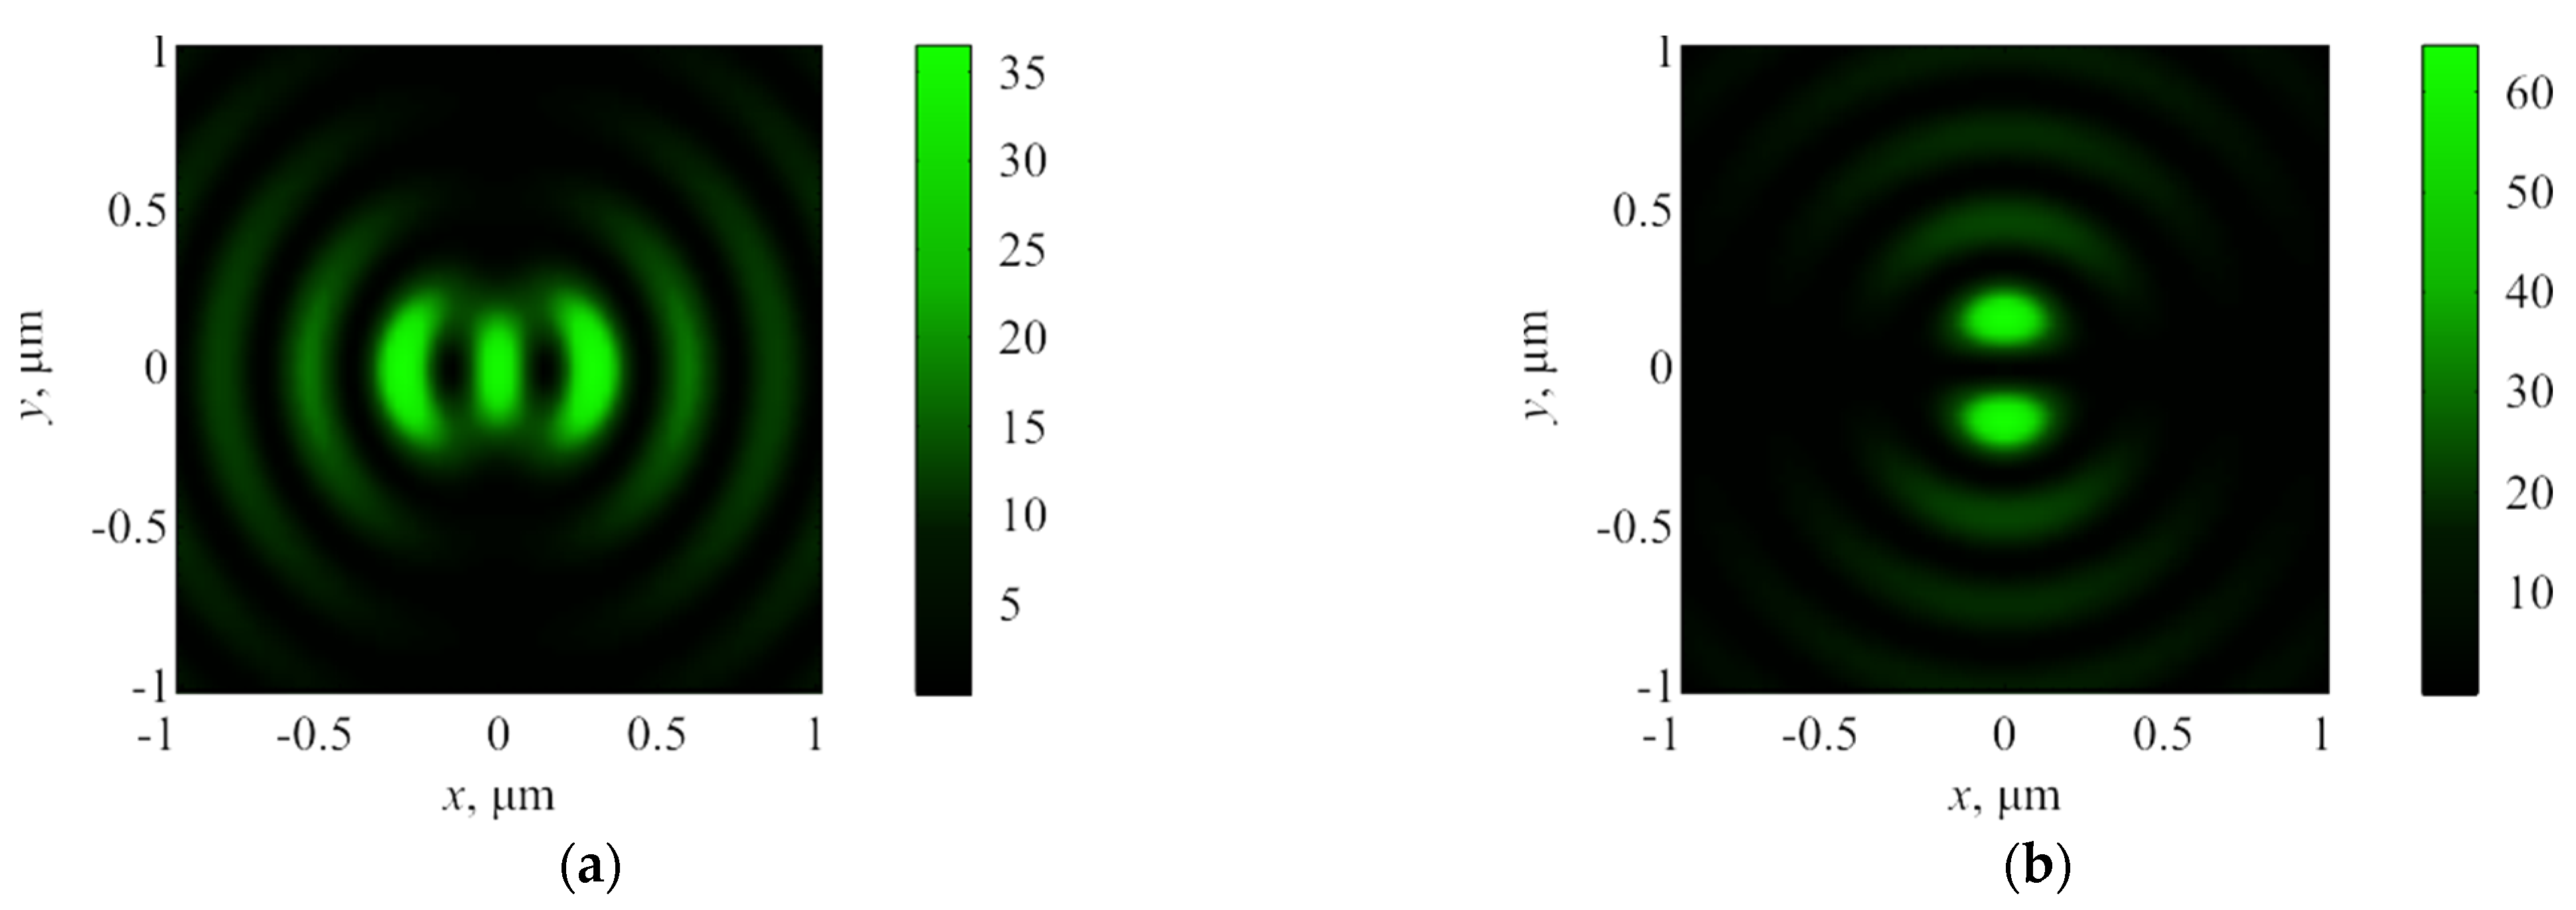
3.2. The Numerical Simulation by the Richards–Wolf Formulae
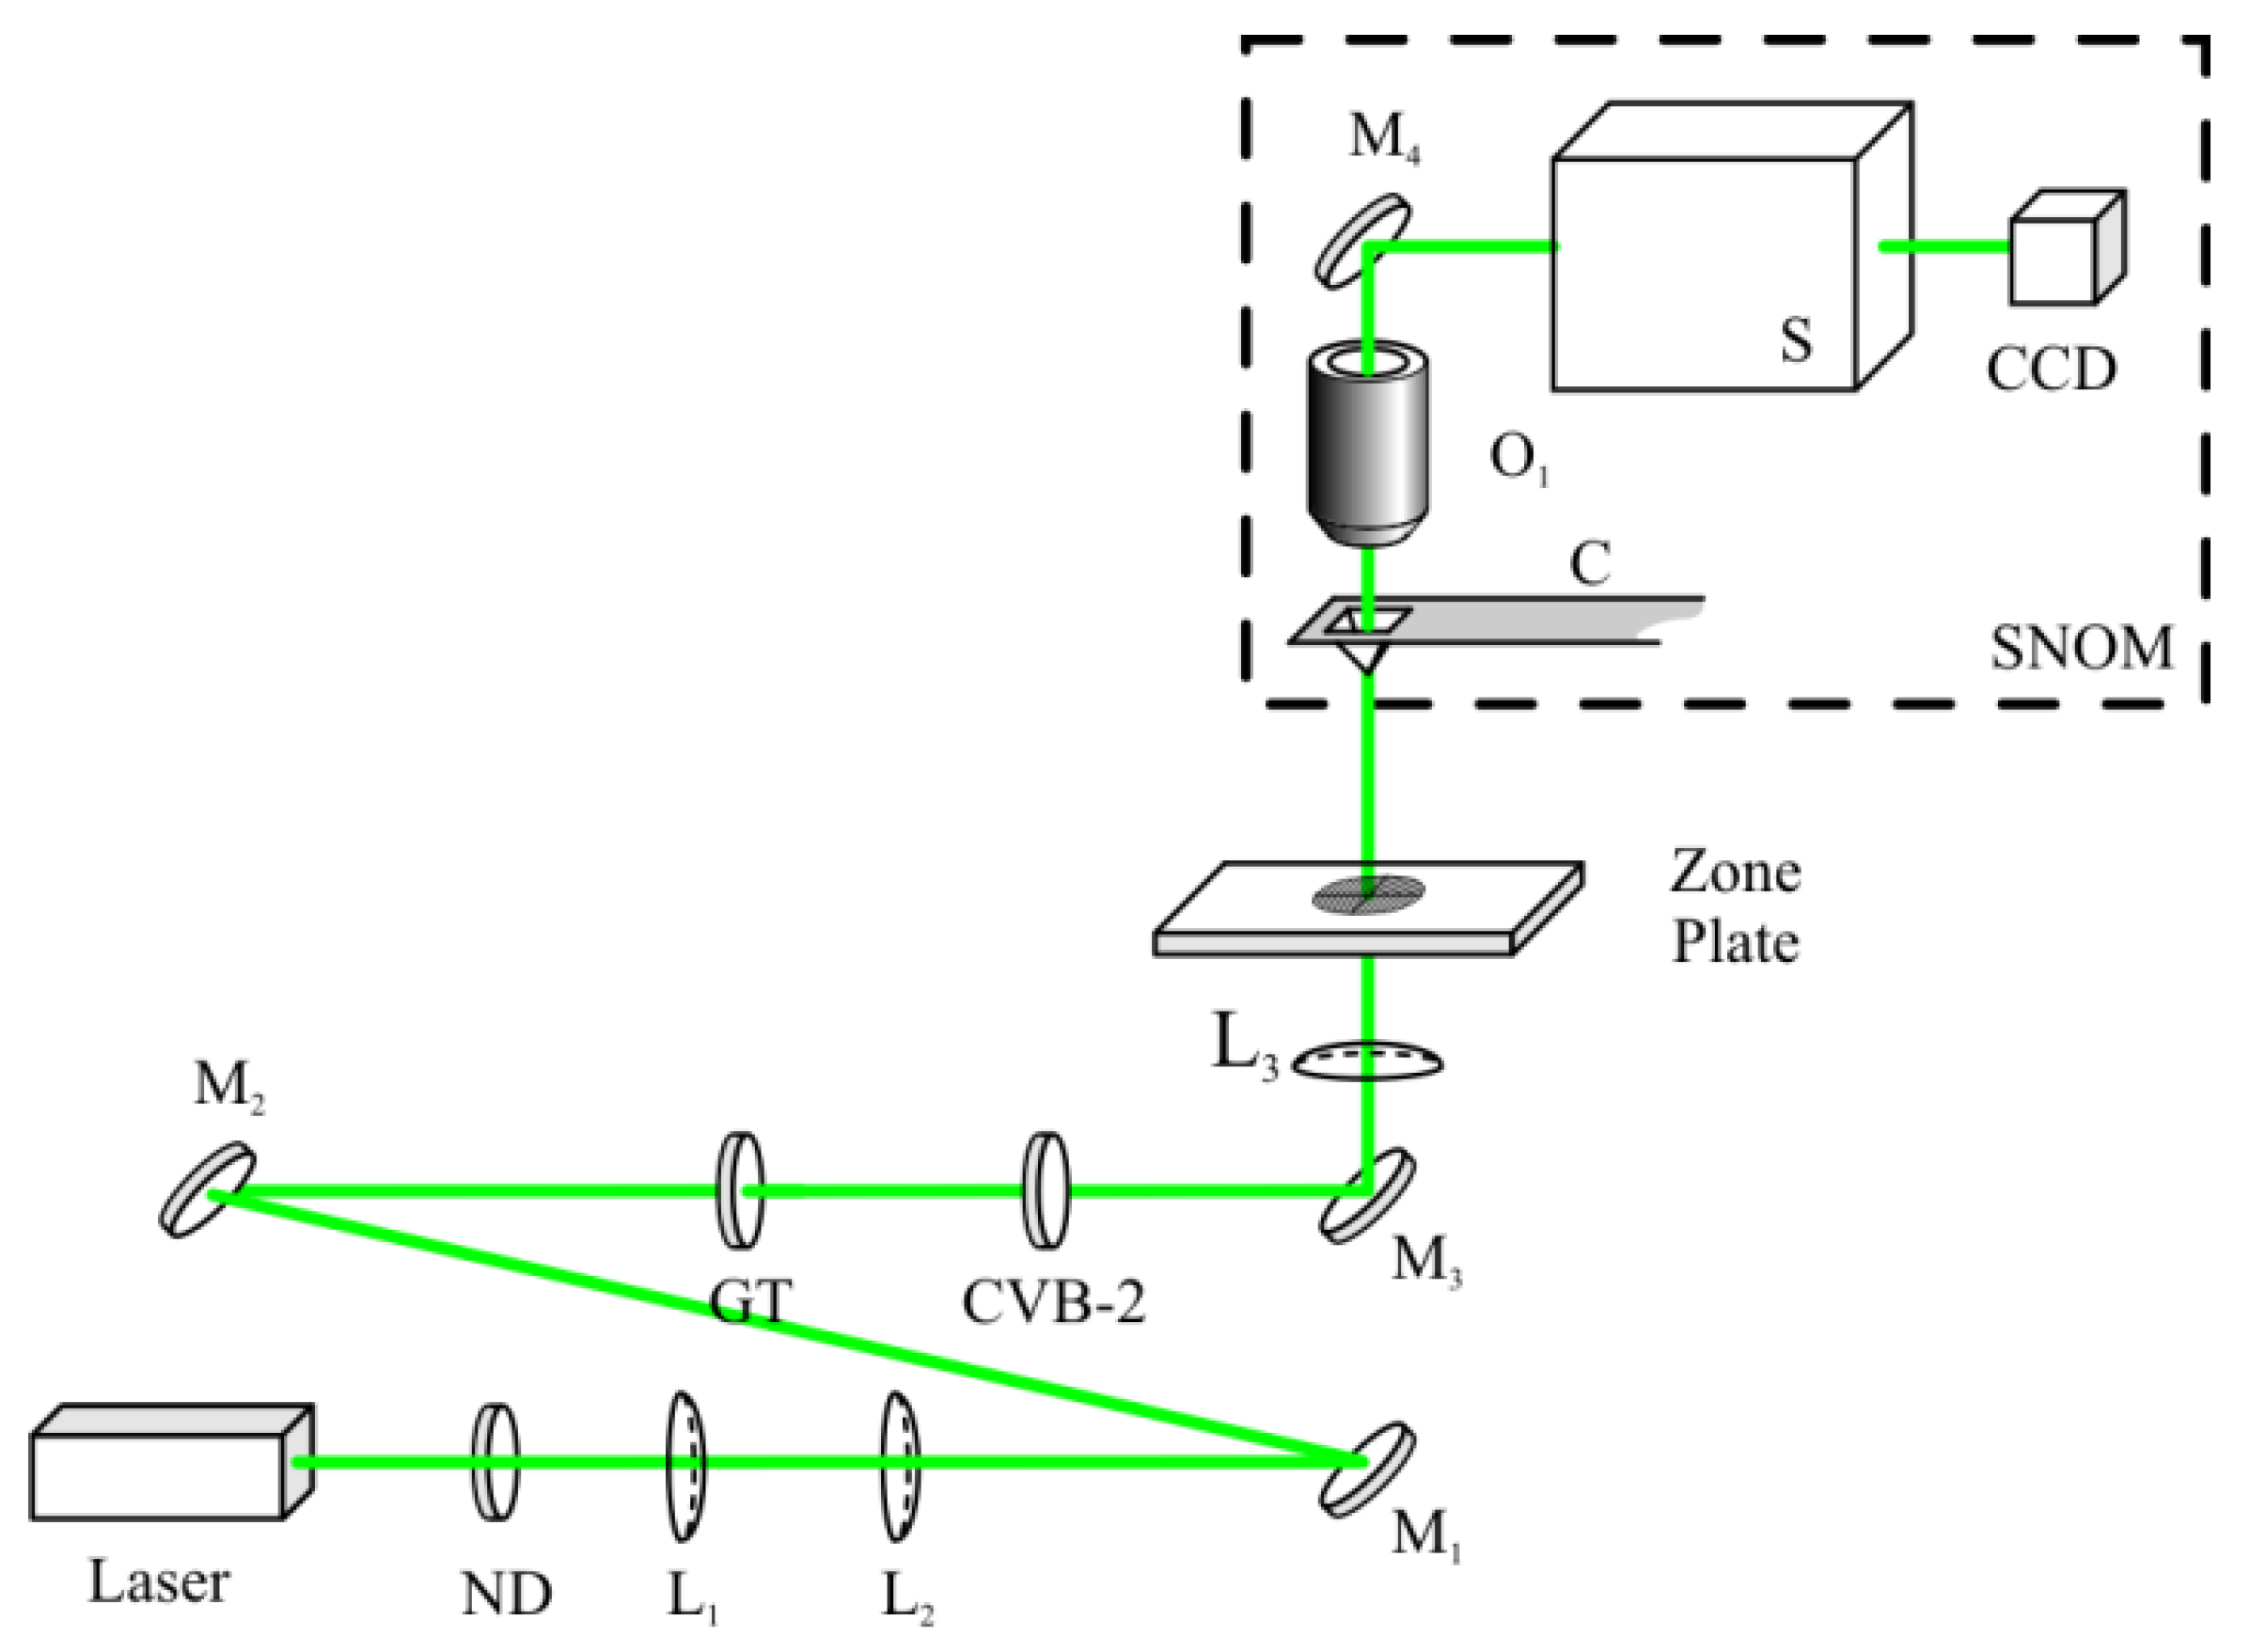
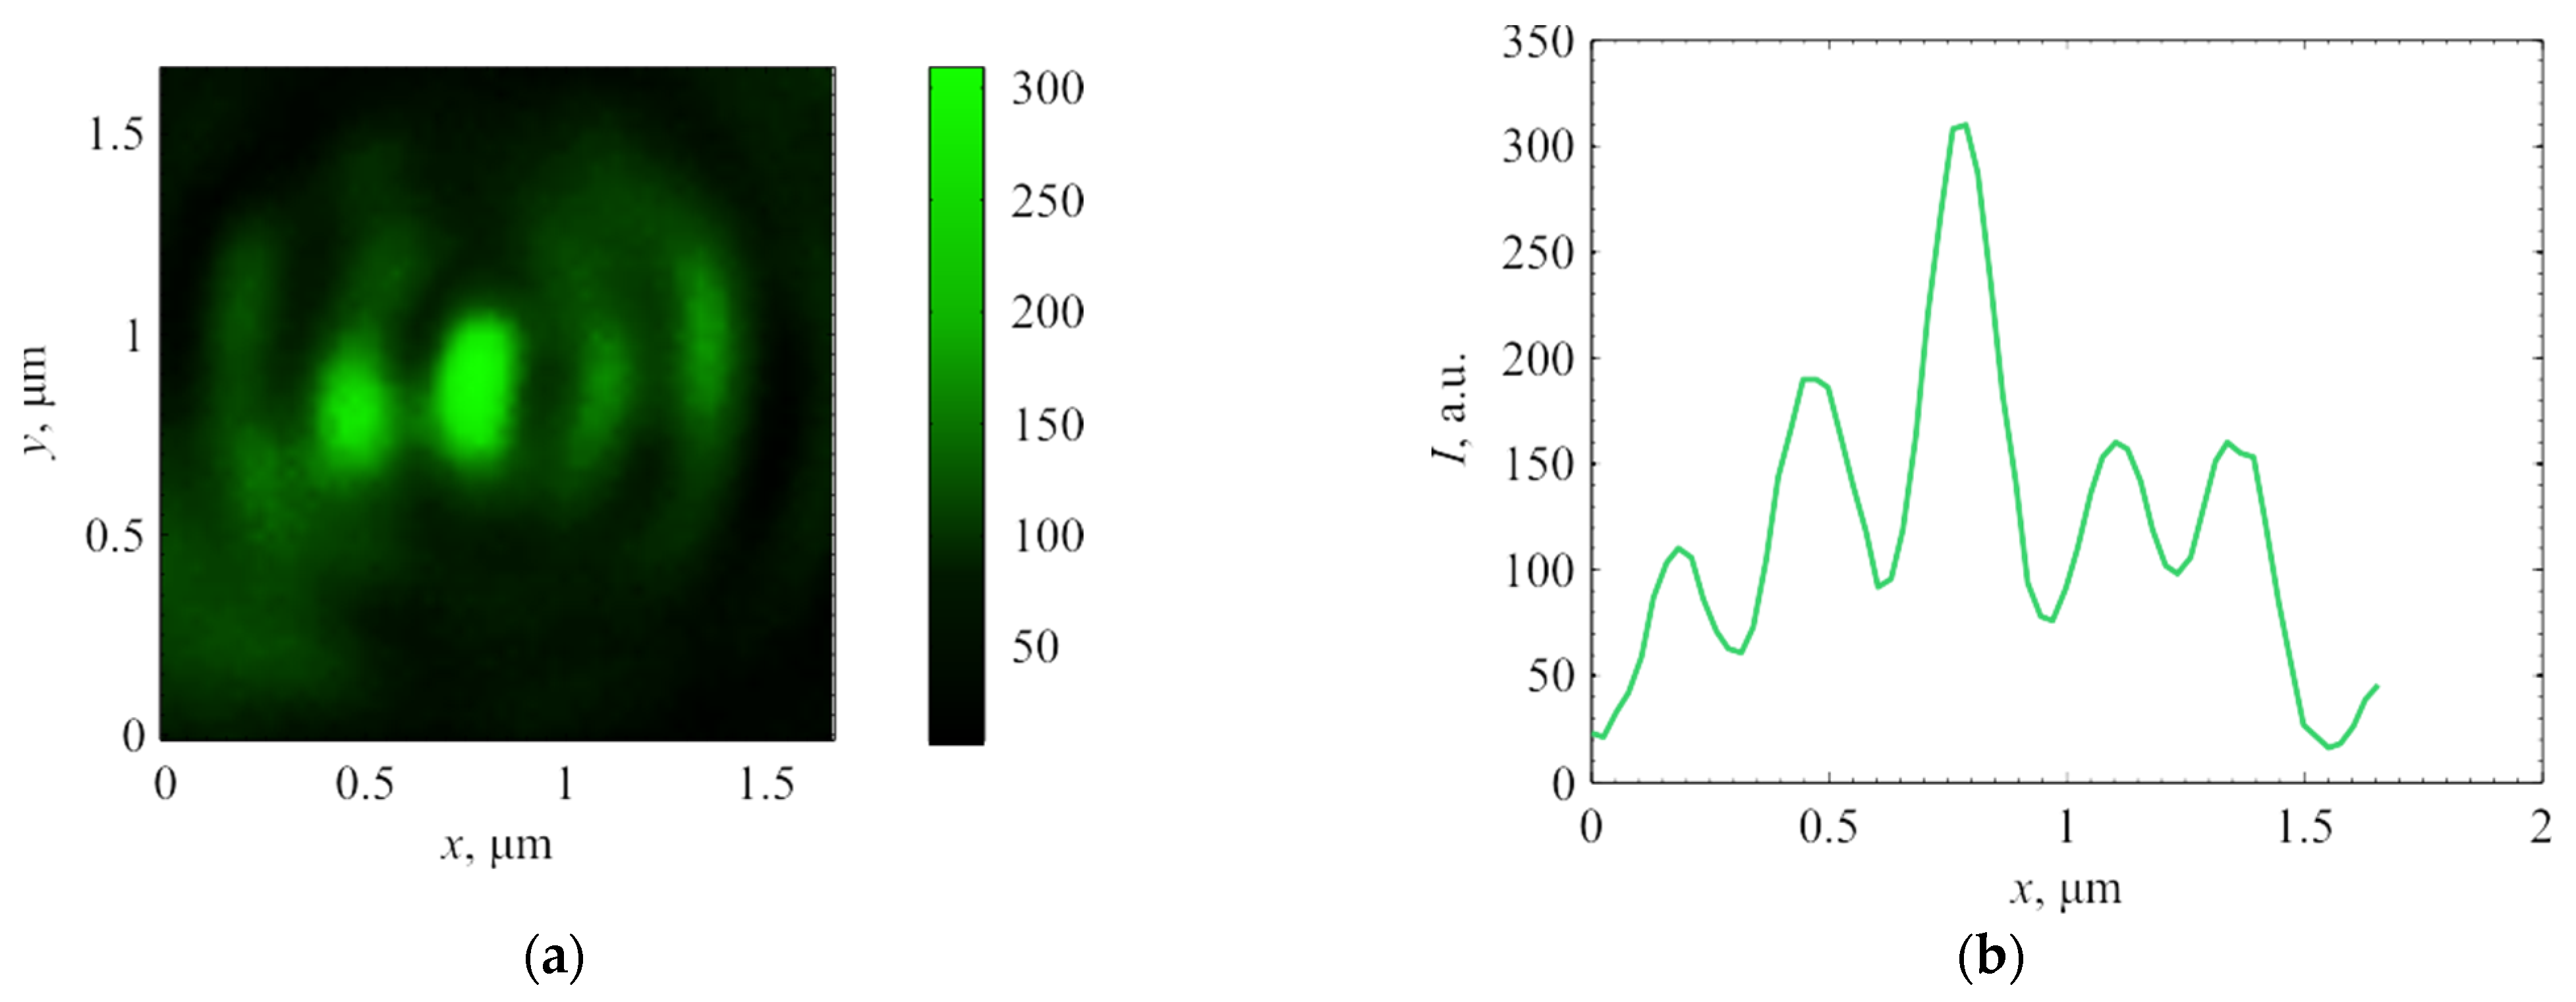
We modeled the process of the same CVB focus with a proposed lens using the Richards–Wolf formulae [49]:
U ( ρ , ψ , z ) = i f λ 0 α max 0 2 π B ( θ , φ ) T ( θ ) l ( θ ) P ( θ , φ ) × × exp { i k [ ρ sin θ cos ( φ ψ ) + z cos θ ] } sin θ d θ d φ ,
where U(ρ, ψ, z) is the magnetic or electric field in the focus, B(θ, φ) is the incident magnetic or electric field (θ and φ are the azimuthal and polar angles, respectively), T(θ) is the function of apodization (it can be written as T(θ) = cos1/2θ and T(θ) = cos−3/2θ for an aplanatic lens and a flat diffractive lens, respectively), k = 2π/λ is the wavenumber, λ is the incident wavelength, αmax is the maximal polar angle defined by the NA of the proposed lens (NA = sin αmax), and P(θ, φ) is the matrix of polarization for the magnetic and electric fields:
P ( θ , φ ) = [ 1 + cos 2 φ ( cos θ 1 ) sin φ cos φ ( cos θ 1 ) sin θ cos φ ] a ( θ , φ ) + [ sin φ cos φ ( cos θ 1 ) 1 + sin 2 φ ( cos θ 1 ) sin θ sin φ ] b ( θ , φ ) ,
where a(θ,φ) and b(θ,φ) are functions of polarization for the x- and y-components of the launch beam, respectively.
The Jones vectors for a beam with a cylindrical polarization of the mth order can be written as:
E ( θ , φ ) = [ a ( θ , φ ) b ( θ , φ ) ] = [ sin ( m φ ) cos ( m φ ) ]
in the case of the electric field and
H ( θ , φ ) = [ a ( θ , φ ) b ( θ , φ ) ] = [ cos ( m φ ) sin ( m φ ) ]
in the case of the magnetic field. The Umov–Poynting vector was calculated using Equation (3). In the calculation, it was assumed that the lens was illuminated by a second-order CVB in the form of the Laguerre–Gaussian mode (0,1), which had the following form in the coordinates of the exit pupil:
l ( θ ) = tg ( θ ) exp { β 2 tg 2 θ tg 2 θ m a x } ,
where the parameter β describes the attitude of the lens and the beam radii β = R/ω. The parameter β was equal to one, which corresponded to the experiment.
Equation (4) was valid for light focusing in free space, far from the separation of two media, but qualitatively, the results coincided with the calculation of the FDTD method. The distributions of the focused light are presented in Figure 4 and Figure 5: Figure 4 demonstrates the intensity distribution I = Ix + Iy + Iz and the Umov–Poynting vector longitudinal component Sz, and Figure 5 shows the distribution of the cross-section Ir = Ix + Iy and the longitudinal Iz intensity components.
In this case, qualitatively, the same intensity distributions were observed as in the FDTD modeling. However, in the distribution of the transverse intensity component, the central peak was larger (Figure 5a) than it was in the case of the plane wave launch (Figure 4a). This was caused by the use of the Laguerre–Gaussian mode (8), which was essentially the equivalent of an annular aperture. The central part of the lens did not participate in the focusing process under such illumination, and the effects of tight focusing were enhanced. Furthermore, the rotation of the original beam by 90 degrees led to the same rotation (Figure 4 and Figure 5), and the maxima of the transverse component (Figure 5a) were located along the vertical axis.

3.3. Experiment

Using a scanning near-field optical microscope, Ntegra Spectra, the focusing of a second-order CVB was studied. The circuit of the experiment is presented in Figure 6.
The SNOM cantilever had the form of a hollow pyramid made of a thin aluminum layer with an aperture at the top. The hole size was about 90 nm. The SEM image of the used cantilever is presented in Figure 7. The transverse scanning of the focus area was carried out with a precision of 35 nm.
SNOM measurements showed that the pattern of intensity in the focal plane had a peak character. An example of the intensity distribution at the focus (distance was 0.6 μm from the lens relief) and its cross-sections are plotted in Figure 8.
The focal spot dimensions in full width of half the maximum of intensity (Figure 8) were FWHMx = 0.39λ and FWHMy = 0.71λ. A comparison of Figure 3, Figure 5 and Figure 8 showed a qualitative agreement between the results obtained with SNOM (Figure 8) and the distribution of the cross-section component of the light field intensity Ir = Ix + Iy in the simulation (Figure 3a and Figure 5a). Although, in the numerical simulation, the side peaks along the y-axis turned out to be more pronounced than in the experiment.

4. Conclusions

In this research, we considered the focusing process of a second-order CVB with an amplitude lens which had a focal distance of 532 nm and a diameter of 15 μm, fabricated by means of chemical etching, electron lithography, and a lift-off process in a 50-nm-thick aluminum film. It was numerically proven that such a lens produced a region in the focal spot on the axis, where the Umov–Poynting vector was directed opposite to the light propagation direction (energy backflow region), and the transverse intensity component was nonzero on the optical axis and had the form of three peaks along the x-axis. The reverse energy flow region was studied using an Ntegra Spectra scanning near-field optical microscope (NT-MDT), applying a hollow pyramidal aperture cantilever. The peak intensity distribution at the focus was experimentally recorded (with the subwavelength sizes FWHMx = 0.39λ and FWHMy = 0.71λ). A comparison of the intensity distributions detected by the SNOM cantilever and the features of the light field distributions, calculated using the (FD)2TD method and the Richards–Wolf formulae, allowed us to deduce the sensitivity of the cantilever to the cross-section intensity component. Although, it was not sensitive to the full intensity or to the Umov–Poynting vector components in the areas of the reverse energy flow. Our results on the sensitivity of the cantilever to the cross-section intensity component were consistent with the research provided in [50].

Author Contributions

Conceptualization, S.S., E.K. and V.K.; methodology, E.K., S.S., S.F. and V.P.; software, S.S. and E.K.; validation, E.K., S.S. and V.K.; formal analysis, V.K., S.S. and E.K.; investigation, E.K. and S.S.; resources, A.S., S.S. and E.K.; data curation, S.S., E.K. and V.K.; writing—original draft preparation, E.K., S.S. and A.S.; writing—review and editing, S.S., E.K. and V.K.; visualization, A.S.; supervision, V.K.; project administration, S.S.; funding acquisition, S.S. All authors have read and agreed to the published version of the manuscript.

Funding

The work was funded by the Russian Science Foundation under grant #18-19-00595.

Institutional Review Board Statement

Not applicable.

Informed Consent Statement

Not applicable.

Data Availability Statement

Not applicable.

Acknowledgments

We acknowledge the support of the RF Ministry of Science and Higher Education within a government project of the FSRC, “Crystallography and Photonics” RAS.

Conflicts of Interest

The authors declare no conflict of interest. The funders had no role in the design of the study, in the collection, analyses, or interpretation of data, in the writing of the manuscript, or in the decision to publish the results.

References

  1. Abed, J.; Alexander, F.; Taha, I.; Rajput, N.; Aubry, C.; Jouiad, M. Investigation of Broadband Surface Plasmon Resonance of Dewetted Au Structures on TiO2 by Aperture-Probe SNOM and FDTD Simulations. Plasmonics 2019, 14, 205–218. [Google Scholar] [CrossRef]
  2. Bazylewski, P.; Ezugwu, S.; Fanchini, G. Review of Three-Dimensional Scanning Near-Field Optical Microscopy (3D-SNOM) and Its Applications in Nanoscale Light Management. Appl. Sci. 2017, 7, 973. [Google Scholar] [CrossRef] [Green Version]
  3. Heydarian, H.; Shahmansouri, A.; Yazdanfar, P.; Rashidian, B. Dual-color plasmonic probes for improvement of scanning near-field optical microscopy. J. Opt. Soc. Am. B 2018, 35, 627–635. [Google Scholar] [CrossRef]
  4. Minin, I.V.; Minin, O.V.; Glinskiy, I.A.; Khabibullin, R.A.; Malureanu, R.; Lavrinenko, A.V.; Yakubovsky, D.I.; Arsenin, A.V.; Volkov, V.S.; Ponomarev, D.S. Plasmonic nanojet: An experimental demonstration: Publisher’s note. Opt. Lett. 2020, 45, 3418. [Google Scholar] [CrossRef] [PubMed]
  5. Pohl, D.W. Scanning Near-field Optical Microscopy (SNOM). Adv. Opt. Electron. Microsc. 1991, 12, 243–312. [Google Scholar] [CrossRef]
  6. Kazantsev, D.V.; Kuznetsov, E.V.; Timofeev, S.V.; Shelaev, A.V.; Kazantseva, E.A. Apertureless near-field optical microscopy. Phys. Uspekhi 2017, 60, 259–275. [Google Scholar] [CrossRef]
  7. Huber, C.; Prior, Y.; Kautek, W. Laser-induced cantilever behaviour in apertureless scanning near-field optical microscopes. Meas. Sci. Technol. 2014, 25, 075604. [Google Scholar] [CrossRef]
  8. Sun, W.X.; Shen, Z.X.; Cheong, F.C.; Yu, G.Y.; Lim, K.Y.; Lin, J.Y. Preparation of cantilevered W tips for atomic force microscopy and apertureless near-field scanning optical microscopy. Rev. Sci. Instrum. 2002, 73, 2942. [Google Scholar] [CrossRef]
  9. Kassing, R.; Rangelow, I.; Oesterschulze, E.; Stuke, M. Sensors for scanning probe microscopy. Appl. Phys. A 2003, 76, 907–911. [Google Scholar] [CrossRef]
  10. Ingham, J.; Pilling, M.J.; Craig, T.; Siggel-King, M.R.F.; Smith, C.I.; Gardner, P.; Varro, A.; Pritchard, D.M.; Barrett, S.D.; Martin, D.S.; et al. An evaluation of the application of the aperture infrared SNOM technique to biomedical imaging. Biomed. Phys. Eng. Express 2018, 4, 025011. [Google Scholar] [CrossRef]
  11. Frolov, A.Y.; Van de Vondel, J.; Panov, V.I.; Van Dorpe, P.; Fedyanin, A.A.; Moshchalkov, V.V.; Verellen, N. Probing higher order optical modes in all-dielectric nanodisk, -square, and -triangle by aperture type scanning near-field optical microscopy. Nanophotonics 2022, 11, 543–557. [Google Scholar] [CrossRef]
  12. Vollkopf, A.; Rudow, O.; Leinhos, T.; Mihalcea, C.; Oesterschulze, E. Modified fabrication process for aperture probe cantilevers. J. Microsc. 1999, 194, 344–348. [Google Scholar] [CrossRef] [PubMed] [Green Version]
  13. Werner, S.; Rudow, O.; Mihalcea, C.; Oesterschulze, E. Cantilever probes with aperture tips for polarization-sensitive scanning near-field optical microscopy. Appl. Phys. A Mater. Sci. Process. 1998, 66, S367–S370. [Google Scholar] [CrossRef]
  14. Dvořák, P.; Édes, Z.; Kvapil, M.; Šamořil, T.; Ligmajer, F.; Hrtoň, M.; Kalousek, R.; Křápek, V.; Dub, P.; Spousta, J.; et al. Imaging of near-field interference patterns by aperture-type SNOM—influence of illumination wavelength and polarization state. Opt. Express 2017, 25, 16560–16573. [Google Scholar] [CrossRef] [PubMed]
  15. González Mora, C.A.; Hartelt, M.; Bayer, D.; Aeschlimann, M.; Ilin, E.A.; Oesterschulze, E. Microsphere-based cantilevers for polarization-resolved and femtosecond SNOM. Appl. Phys. B 2016, 122, 86. [Google Scholar] [CrossRef]
  16. Atie, E.M.; Xie, Z.; El Eter, A.; Salut, R.; Nedeljkovic, D.; Tannous, T.; Baida, F.I.; Grosjean, T. Remote optical sensing on the nanometer scale with a bowtie aperture nano-antenna on a fiber tip of scanning near-field optical microscopy. Appl. Phys. Lett. 2015, 106, 151104. [Google Scholar] [CrossRef]
  17. El Eter, A.; Hameed, N.M.; Baida, F.I.; Salut, R.; Filiatre, C.; Nedeljkovic, D.; Atie, E.; Bole, S.; Grosjean, T. Fiber-integrated optical nano-tweezer based on a bowtie-aperture nano-antenna at the apex of a SNOM tip. Opt. Express 2014, 22, 10072–10080. [Google Scholar] [CrossRef]
  18. Murphy-DuBay, N.; Wang, L.; Kinzel, E.C.; Uppuluri, S.M.V.; Xu, X. Nanopatterning using NSOM probes integrated with high transmission nanoscale bowtie aperture. Opt. Express 2008, 16, 2584–2589. [Google Scholar] [CrossRef] [Green Version]
  19. Biagioni, P.; Polli, D.; Labardi, M.; Pucci, A.; Ruggeri, G.; Cerullo, G.; Finazzi, M.; Duò, L. Unexpected polarization behavior at the aperture of hollow-pyramid near-field probes. Appl. Phys. Lett. 2005, 87, 223112. [Google Scholar] [CrossRef]
  20. Biagioni, P.; Coduri, M.; Polli, D.; Virgili, T.; Labardi, M.; Cerullo, G.; Finazzi, M.; Duò, L. Near-field vs. far-field polarization properties of hollow pyramid SNOM tips. Phys. Status Solidi 2005, 2, 4078–4082. [Google Scholar] [CrossRef]
  21. Shershulin, V.A.; Samoylenko, S.R.; Shenderova, O.A.; Konov, V.I.; Vlasov, I.I. Use of scanning near-field optical microscope with an aperture probe for detection of luminescent nanodiamonds. Laser Phys. 2017, 27, 025201. [Google Scholar] [CrossRef] [Green Version]
  22. Kotlyar, V.V.; Stafeev, S.S.; Liu, Y.; O’Faolain, L.; Kovalev, A.A. Analysis of the shape of a subwavelength focal spot for the linearly polarized light. Appl. Opt. 2013, 52, 330–339. [Google Scholar] [CrossRef] [PubMed]
  23. Mikhailova, T.V.; Vysokikh, Y.E.; Krasnoborodko, S.Y.; Kolomiytsev, A.S.; Fedotov, A.A. Light polarization and intensity behaviour in aperture cantilevers with carbon tip created by focused ion beam. IOP Conf. Ser. Mater. Sci. Eng. 2019, 699, 012030. [Google Scholar] [CrossRef]
  24. Vysokikh, Y.E.; Mikhailova, T.V.; Krasnoborodko, S.Y.; Kolomiytsev, A.S.; Ilin, O.I.; Shaposhnikov, A.N.; Berzhansky, V.N.; Bulatov, M.F.; Churikov, D.V.; Shevyakov, V.I. Carbon tip aperture cantilevers: Fabrication & features in near-field magneto-optical imaging. J. Magn. Magn. Mater. 2021, 529, 167837. [Google Scholar] [CrossRef]
  25. Achmari, P.; Siddiquee, A.M.; Si, G.; Lin, J.; Abbey, B.; Kou, S. Investigating the probe-tip influence on imaging using scanning near-field optical microscopy. OSA Contin. 2021, 4, 1143–1154. [Google Scholar] [CrossRef]
  26. Stafeev, S.S.; Kotlyar, V.V.; Nalimov, A.G.; Kozlova, E.S. The Non-Vortex Inverse Propagation of Energy in a Tightly Focused High-Order Cylindrical Vector Beam. IEEE Photonics J. 2019, 11, 4500810. [Google Scholar] [CrossRef]
  27. Kotlyar, V.V.; Stafeev, S.S.; Nalimov, A.G. Energy backflow in the focus of a light beam with phase or polarization singularity. Phys. Rev. A 2019, 99, 033840. [Google Scholar] [CrossRef]
  28. Huang, P.; Zhou, Z.; Ren, H. Fresnel zone plate fabricated using a polyvinyl chloride gel. Opt. Eng. 2018, 57, 117101. [Google Scholar] [CrossRef]
  29. Liu, Q.; Liu, T.; Yang, S.; Wang, T.; Wang, Y. Validation of vectorial theories for the focusing of high numerical aperture Fresnel zone plates. Opt. Commun. 2018, 429, 119–126. [Google Scholar] [CrossRef]
  30. Minerbi, E.; Keren-Zur, S.; Ellenbogen, T. Nonlinear Metasurface Fresnel Zone Plates for Terahertz Generation and Manipulation. Nano Lett. 2019, 19, 6072–6077. [Google Scholar] [CrossRef] [Green Version]
  31. Geints, Y.E.; Minin, O.V.; Panina, E.K.; Minin, I.V. Controlling near-field focusing of a mesoscale binary phase plate in an optical radiation field with circular polarization. Comput. Opt. 2021, 45, 512–519. [Google Scholar] [CrossRef]
  32. Yoon, G.; Jang, J.; Mun, J.; Nam, K.T.; Rho, J. Metasurface zone plate for light manipulation in vectorial regime. Commun. Phys. 2019, 2, 156. [Google Scholar] [CrossRef] [Green Version]
  33. Kotlyar, V.V.; Stafeev, S.S.; Nalimov, A.G.; Kotlyar, M.V.; O’Faolain, L.; Kozlova, E.S. Tight focusing of laser light using a chromium Fresnel zone plate. Opt. Express 2017, 25, 19662–19671. [Google Scholar] [CrossRef]
  34. Mote, R.G.; Minin, O.V.; Minin, I.V. Focusing behavior of 2-dimensional plasmonic conical zone plate. Opt. Quantum Electron. 2017, 49, 271. [Google Scholar] [CrossRef]
  35. Kozlova, E.S.; Kotlyar, V.V. Simulation of tight focusing of laser light by gold zone plate. In Proceedings of the 2018 20th International Conference on Transparent Optical Networks (ICTON), Bucharest, Romania, 1–5 July 2018; pp. 1–4. [Google Scholar] [CrossRef]
  36. Kim, J.; Kim, H.; Lee, G.-Y.; Kim, J.; Lee, B.; Jeong, Y. Numerical and Experimental Study on Multi-Focal Metallic Fresnel Zone Plates Designed by the Phase Selection Rule via Virtual Point Sources. Appl. Sci. 2018, 8, 449. [Google Scholar] [CrossRef] [Green Version]
  37. Yang, J.; Zhong, Y.; Zheng, C.; Ding, S.; Zang, H.; Liang, E.; Cao, L. Dual-type fractal spiral zone plate for generating sequence of square optical vortices. J. Opt. Soc. Am. A 2019, 36, 893. [Google Scholar] [CrossRef]
  38. Zang, H.; Ding, S.; Wei, L.; Wang, C.; Fan, Q.; Cao, L. Fractal spiral zone plate with high-order harmonics suppression. Appl. Opt. 2019, 58, 8680–8686. [Google Scholar] [CrossRef]
  39. Kozlova, E.S. Modeling of the optical vortex generation using a silver spiral zone plate. Comput. Opt. 2018, 42, 977–984. [Google Scholar] [CrossRef]
  40. Cheng, S.; Xia, T.; Liu, M.; Zheng, C.; Zang, H.; Tao, S. Composite Spiral Zone Plate. IEEE Photonics J. 2019, 11, 1–11. [Google Scholar] [CrossRef]
  41. Kozlova, E.S. Investigation of the influence of amplitude spiral zone plate parameters on produced energy backflow. Comput. Opt. 2019, 43, 1093–1097. [Google Scholar] [CrossRef]
  42. Kim, H.; Jeong, Y. Theoretical and numerical study of cylindrical-vector-mode radiation characteristics in periodic metallic annular slits and their applications. Curr. Opt. Photonics 2018, 2, 482–487. [Google Scholar]
  43. Luo, X.-G.; Pu, M.-B.; Li, X.; Ma, X.-L. Broadband spin Hall effect of light in single nanoapertures. Light Sci. Appl. 2017, 6, e16276. [Google Scholar] [CrossRef] [PubMed]
  44. Kotlyar, V.V.; Nalimov, A.G. Sharp focusing of vector optical vortices using a metalens. J. Opt. 2018, 20, 075101. [Google Scholar] [CrossRef]
  45. Zhang, Y.; Liu, H.; Cheng, H.; Tian, J.; Chen, S. Multidimensional manipulation of wave fields based on artificial microstructures. Opto-Electron. Adv. 2020, 3, 200002. [Google Scholar] [CrossRef]
  46. Luo, X.; Pu, M.; Zhang, F.; Xu, M.; Guo, Y.; Li, L.; Ma, X. Vector optical field manipulation via structural functional materials: Tutorial. J. Appl. Phys. 2022, 131, 181101. [Google Scholar] [CrossRef]
  47. Li, Y.; Zhang, Y.; Zhu, Y. Probability distribution of the orbital angular momentum mode of the ultrashort Laguerre-Gaussian pulsed beam propagation in oceanic turbulence. Results Phys. 2018, 11, 698–705. [Google Scholar] [CrossRef]
  48. Zukersteina, M.; Hrabovsky, J.; Sladek, J.; Mirza, I.; Levy, Y.; Bulgakova, N.M. Formation of tubular structures and microneedles on silicon surface by doughnut-shaped ultrashort laser pulses. Appl. Surf. Sci. 2022, 592, 153228. [Google Scholar] [CrossRef]
  49. Richards, B.; Wolf, E. Electromagnetic diffraction in optical systems. II. Structure of the image field in an aplanatic system. Proc. R. Soc. A 1959, 253, 358–379. [Google Scholar] [CrossRef]
  50. Cui, T.; Zhang, M.; Zhao, Y.; Yang, Y.; Bai, B.; Sun, H.-B. Near-field nonlinear imaging of an anapole mode beyond diffraction limit. Opt. Lett. 2021, 46, 2095–2098. [Google Scholar] [CrossRef]
Figure 1. The manufactured aluminum lens: SEM image (a); map of the lens surface obtained with an optical white light interferometer (b).
Photonics 09 00592 g001
Figure 2. The distribution of the total intensity (a) and the longitudinal component of the Umov–Poynting vector (b) in the focus obtained by the FDTD-method.
Photonics 09 00592 g002
Figure 3. The transverse Ir = Ix + Iy (a) and the longitudinal Iz (b) intensity components in the focus obtained by the FDTD-method.
Photonics 09 00592 g003
Figure 4. The total intensity I = Ix + Iy + Iz (a) and the Umov–Poynting vector longitudinal component Sz (b) in the focus obtained by the Richards–Wolf formulae.
Photonics 09 00592 g004
Figure 5. The transverse Ir = Ix + Iy (a) and the longitudinal Iz (b) intensity components in the focus obtained by the Richards–Wolf formulae.
Photonics 09 00592 g005
Figure 6. The experimental setup. Laser is the LCM-S-111-20-R (50 mW, 532 nm); ND is a neutral density filter; L1, L2, and L3 are lenses with a focal distance of f1 = 35, f2 = 100, and f3 = 10 mm, respectively; M1, M2, M3, and M4 are mirrors; GT is the Glan–Taylor prism; CVB-2 is a polarization converter (Thorlabs WPV10-532); C is a cantilever with a diameter of 100 nm (SNOM_C, NT-MDT); S is a spectrometer (Solar TII, Nanofinder 30); O1 is a 100× objective lens (100× Mitutoyo Plan Apo Infinity Corrected Long WD Objective); CCD is a CCD camera (Andor, DV401-BV).
Photonics 09 00592 g006
Figure 7. The SEM images of the cantilever: full view (a) and enlarged shot of its aperture (b).
Photonics 09 00592 g007
Figure 8. The intensity pattern (a) and its distribution along the x-axis (b) in the focus measured with SNOM.
Photonics 09 00592 g008
Publisher’s Note: MDPI stays neutral with regard to jurisdictional claims in published maps and institutional affiliations.

