Article

Enhanced Gamma-Ray Attenuation-Based Detection System Using an Artificial Neural Network

by
Ehsan Eftekhari-Zadeh
1,2,3,
Abdallah S. Bensalama
4,
Gholam Hossein Roshani
5,
Ahmed S. Salama
6,
Christian Spielmann
1,2,3 and
Abdullah M. Iliyasu
4,7,8,*
1
Institute of Optics and Quantum Electronics, Friedrich Schiller University Jena, Max-Wien-Platz 1, 07743 Jena, Germany
2
Abbe Center of Photonics, Friedrich Schiller University Jena, Albert Einstein Straße 6, 07745 Jena, Germany
3
Helmholtz Institute Jena, Fröbelstieg 3, 07743 Jena, Germany
4
Electrical Engineering Department, College of Engineering, Prince Sattam Bin Abdulaziz University, Al Kharj 11942, Saudi Arabia
5
Electrical Engineering Department, Kermanshah University of Technology, Kermanshah 6715685420, Iran
6
Electrical Engineering Department, Faculty of Engineering and Technology, Future University in Egypt, New Cairo 11835, Egypt
7
School of Computing, Tokyo Institute of Technology, Yokohama 226-8502, Japan
8
School of Computer Science and Technology, Changchun University of Science and Technology, Changchun 130022, China
*
Author to whom correspondence should be addressed.
Photonics 2022, 9(6), 382; https://doi.org/10.3390/photonics9060382
Submission received: 19 April 2022 / Revised: 18 May 2022 / Accepted: 23 May 2022 / Published: 26 May 2022
(This article belongs to the Special Issue The Interplay between Photonics and Machine Learning)

Abstract

:
Scale deposition is the accumulation of various materials in the walls of transmission lines and unwanted parts in the oil and gas production system. It is a leading moot point in all transmission lines, tanks, and petroleum equipment. Scale deposition leads to drastic detrimental problems, reduced permeability, pressure and production losses, and direct financial losses due to the failure of some equipment. The accumulation of oil and gas leads to clogged pores and obstruction of fluid flow. Considering the passage of a two-phase flow, our study determines the thickness of the scale, and the flow regime is detected with the help of two Multilayer Perceptron (MLP) networks. First, the diagnostic system consisting of a dual-energy source, a steel pipe, and a NaI detector was implemented, using the Monte Carlo N Particle Code (MCNP). Subsequently, the received signals were processed, and properties were extracted using the wavelet transform technique. These features were considered as inputs of an Artificial Neural Network (ANN) model used to determine the type of flow regimes and predict the scale thickness. By accurately classifying the flow regimes and determining the scale inside the pipe, our proposed method provides a platform that could enhance many areas of the oil industry.

1. Introduction

In the oil and gas industry, the process of extracting some solids is accompanied by the presence of water and sludge that leads to the formation of scales on the walls of pipes and equipment. This reduces the inner diameter of the pipe, prevents the passage of fluids, and requires periodic maintenance measures that are known to exacerbate operation costs. In addition to all this, depending on the thickness of the scale formed, the pipeline may be blocked, or at best, the flow may be reduced. Finally, the scale can corrode the pipeline and shorten its lifetime. The highlighted effects of scales on walls of pipes illustrate the need for scale control and management. Assessments need to be made for preventive and corrective measurements without stopping production operations. On the other hand, optimization of separation processes is not possible, except with sufficient knowledge of quantitative measurement of gas and oil components. The type of flow pattern affects the efficiency of the separation process in such a way that the percentage of each element indicates whether drilling should be continued. In previous efforts to improve this issue, Salgado et al. [1]. used three NaI detectors and a gamma cesium-137 radiation source to detect and determine the maximum thickness of the scale formed by BaSO4 inside pipes. Finally, with performed tests in various positions and with different thicknesses, they claimed that in more than 90% of cases, they could provide the correct answer with a relative error of ±10%. Also, a backpropagation five-layer perceptron network was used for the scale prediction. Similarly, a study published by Affonso et al. [2], measured the transmission of narrow gamma-ray radiation through the pipe. In parallel they developed data sets for training and testing artificial neural networks (ANNs) using models of circular flow regimes and Monte Carlo N Particle Code X-version (MCNPX) for classification. They concluded that the existing ANN was fully capable of detecting the regime [2]. In [3] Alamoudi et al. attempted to determine the thickness of the scale with a gamma attenuation method and a radial basis function neural network (RBFNN) in oil pipelines where there are two-phase flows with symmetric flow regimes. Their proposed detection system included a dual-energy gamma source and two sodium iodide detectors for recording photons. One of these detectors received scattered photons, while the other one transmitted photons. Using the collected data as input to the neural network, their approach recorded the thickness of the scale as output. In [4], Sattari et al. used a cesium-137 source and a sodium iodide detector to detect the flow regime in biphasic fluids. A simulation structure was performed using the MCNPX to provide the data set needed to extract the features that were subsequently used in the artificial neural network. They extricated seven properties of the time domain and used them as input to the Group Method of Data Handling (GMDH) neural network. In the study, an independent neural network was used to calculate the type of flow regime and to identify the kind of regime [4]. In their contribution, Kamari et al. [5] conducted a study on barium sulfate and the problems it poses in oil and gas production operations. Using a Coupled Simulated Annealing- least square support vector machine (CSA-LSSVM) model, they obtained a good prediction of scales. They also used a support vector machine (SVM) to compute solubility product data of barite in brines. Other studies have reported simulations of two-phase [6,7,8] and three-phase [9,10,11] flows at varying volume percentages and flow regimes. Others focused on ascertaining the volume percentage and flow regime using various neural networks, such as MLP [12,13], RBF [14,15], adaptive neuro-fuzzy inference system [16], Jaya algorithm [17], and GMDH neural network [18]. Although many of these studies have reported satisfactory results, the absence of efficient feature extraction strategies reduced the accuracy and increased computational volume. More recently, however, researchers have begun to use the feature extraction technique in their designed systems. For example, time-domain [19,20], frequency domain [21], and time-frequency domain [22,23] are some momentous feature derivation techniques used. In the study report by Roshani et al., the volume ratio of petroleum products was predicted with significant accuracy using a designed fluid control system [24]. The distinguishing point in the research was the fact that it did not use feature extraction methods, which have led to the presentation of differing work. Meanwhile, many studies have been performed on systems designed based on X-rays to determine the volume percentage of three-phase [25,26] and two-phase [27] flows. Characteristic extraction manner improves the final accuracy of predicting the type of flow regime and volume percentage. Figure 1 presents comparisons between a pipe with scale formed in it and a clean pipe.
In all the mentioned previous work, lack of characteristic extraction techniques reduced the accuracy and efficiency of the neural network. On the opposite side, in this work, accuracy is enhanced by pre-processing measured signals with wavelet transform. By using these pre-processed signals as the input of the neural network, high accuracy is obtained for the system.
The main contributions of this work are the following: using wavelet characteristics and examining the received signals by wavelet transform, designing neural networks using wavelet characteristics, determining the type of flow regime independent of volume percentages and scale thickness, and determining the width of the scale independently of the type of flow regime and volume percentages.

2. Proposed Method

2.1. Simulation Setup

The approach proposed in this study to achieve the goals of flow regime detection and scale thickness determination is illustrated in Figure 2. The approach is non-invasive and based on the gamma-ray attenuation technique. The setup consists of three main elements: 1. the wave generation and radiation section, 2. the test pipe section, and 3. the detection section. The detected signal is modeled through version X of the Monte Carlo N Particle Code (MCNPX) which manufactured by Los Alamos National Laboratory in United States.
All three elements were arranged in a line. The gamma rays were emitted from a dual wave source consisting of cesium-137, which radiated at 0.662 MeV, and barium-133, which radiated at 0.356 MeV. This gamma source was surrounded by a protective shielding, which also played the role of converging waves. The gamma rays traveled to the test pipe and, after passing through it, they were recorded by a detector located directly in front of it. The test pipe was assumed to be a steel pipe with an outer diameter of 21 cm and an inner diameter of 20 cm. Inside this pipe, scales of BaSO4 with different thicknesses were formed. For each of these different test pipes the transmitted signal was recorded by the detector. The detector was made of sodium iodide (NaI) and had an active medium of 25.4 mm by 25.4 mm. Simulations were performed for seven different thicknesses of scales, from 0 cm to 3 cm with steps of 0.5 cm, for a volume percentage of 10% to a volume percentage of 85%. with 15% variations for a homogeneous, annular, and stratified flow regime. A total of 126 simulations were performed. These three regimes are illustrated in Figure 3. Also, the recorded spectra for different scale thicknesses at 55% void fraction are shown in Figure 4. What was achieved in this study is supported by several experiments that have already been performed in our previously published articles [14]. The obtained detector responses were compared in experiment and simulation. Since the Tally output in the MCNP code is per source particle, both were normalized to units to compare experimental and simulation data. The value of 2.2% for the detector response was the maximum relative difference between the simulation data and the experimental data. As can be seen, a good agreement was obtained between the experimental data and the simulation results.

2.2. Discrete Wavelet Transform

The continuous wavelet transform (CWT) is a time-frequency transform, which is ideal for analyzing non-stationary signals. Previously employed transforms in solely time or frequency showed less accuracy and, thus, we used a time-frequency transform in order to obtain features with higher accuracy. In numerical, and functional analysis, DWT is a wavelet transform in which wavelets are sampled discretely. Just like other wavelet transforms, the time resolution is a pivotal superior over Fourier transform. It captures both frequency information, and temporal location information [29]. Since DWT is one of the most widely used methods for time-frequency filtering, multi-resolution analysis is possible by decomposing the discrete signal x (n) into low and high-frequency components using the DWT method. DWT makes it possible to divide the received signal into several sets. Each of these sets is a time series of coefficients that describe the temporal evolution of the signal in the corresponding frequency band. An iterative Mallat algorithm is required to determine the DWT. This method is based on a mother wavelet function and a corresponding scaling function to determine the up and down band filters [30,31]. The signal x (n) is decomposed into low-frequency components aj, k (approximately), and high dj, k (in detail) with multilevel filter banks:
a j , k = l h l 2 k a j 1 , m
d j , k = l g l 2 k a j 1 , m
where k is related to the translation at each level of the wavelet function, l is the number of levels and is an integer scale, j is a parameter that affects the DWT scaling, h (l) and g (l) are low-pass and high-pass quadrature filters, respectively, and m is used in the scaling function to translate the j scale. Wavelet transform includes several families of wavelet functions, such as Daubechies, Haar, etc. In this research, the “wavemenu” toolbox, available in MATLAB software, was used to apply wavelet transform on the received signals. In fact, different wavelets were investigated in this study, but most of them caused the resulting approximation signal not to be similar to the main signal. Using the Daubechies 5 (db5) wavelet, the approximation signal is very similar to the original signal. Thus, it was used here to analyze the signals received from the scintillator detector. Daubechies can be considered the most widely used discrete wavelet transform set. This formula is based on recurrence relations to produce discrete samples that are gradually smaller than an implicit mother wavelet function. Each resolution is twice the size of the previous one. The decomposition steps of one of the received signals into approximate and detailed parts are shown in Figure 5a. From the fourth stage onwards, no significant high-frequency information was obtained, so the wavelet transform continued until the fourth stage. The wavelet transform tree is shown in Figure 5b. In order to provide suitable inputs for neural network training, the feature of Standard Deviation (STD) was extracted from approximate signals of the fourth (a4) stage and the details of the first to fourth stages (d1, d2, d3, and d4) according to Equation (3).
S T D = 1 N 1 i = 1 N x i μ 2
μ = 1 N i = 1 N x i
where x i is the primary data and N is the amount of data.

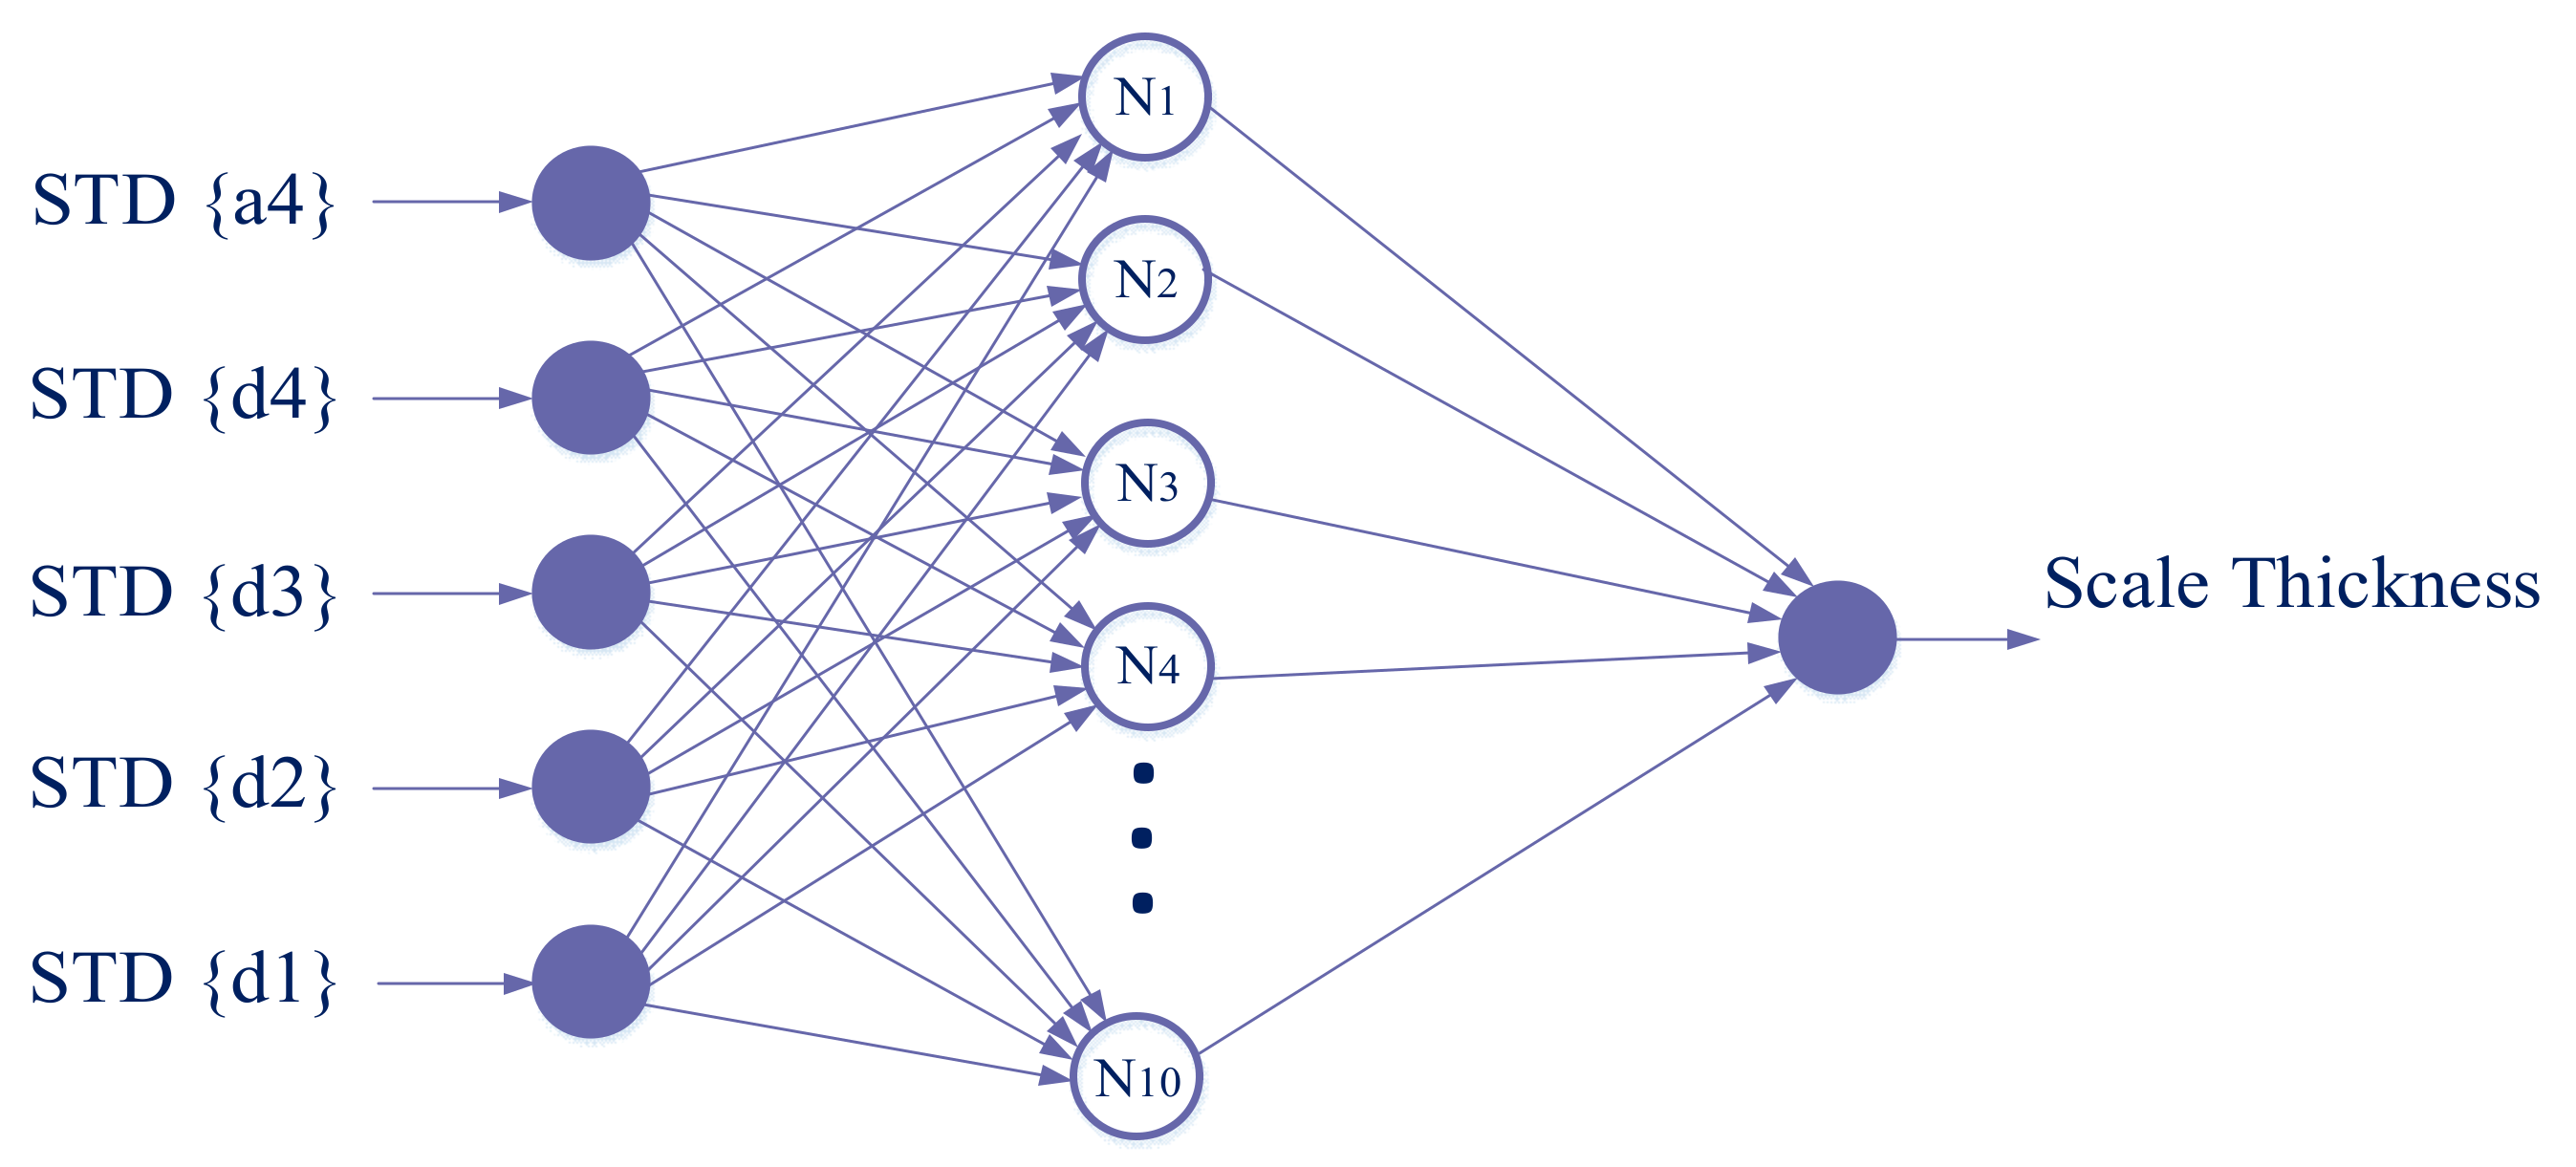
2.3. Artificial Neural Network

It is worth mentioning that in recent years, various mathematical approaches have been used in different research fields, such as electrical and computer engineering [32,33,34,35,36,37,38,39,40,41,42], mechanical engineering [43,44,45,46,47,48,49], civil and urban engineering [50,51,52,53], biomedical engineering [54], industrial engineering [55,56,57,58] and physics [59], but among them, ANN is the most well-known and powerful numerical tool for prediction and classification [60,61,62,63,64,65,66,67].A multilayer perceptron (MLP) is one of the most powerful and commonly used classes of feed-forward artificial neural network (ANN). A multilayer perceptron, in its simplest form, consists of three essential layers: 1. Input layer 2. Hidden layer 3. Output layer. Except for the input nodes, each node is a neuron that uses a nonlinear activation function. The following equation determines each perceptron’s output [68,69]:
y = f ( i = 1 u w i x i + w 0 )  
where, x is input, w is weight, f is the activation function, and y is output of each neuron in the hidden layer.
Keeping in mind that MLPs are fully interconnected, each node in any layer is connected to each node in the next layer with a certain weight. The page is divided into two parts if the perceptron has two inputs x1 and x2 and the equation of the dividing line is defined as follows:
w 1 x 1 + w 2 x 2 + w 0 = 0
In the n-dimensional space of the samples, the perceptron is considered a super plan. The perceptron only learns samples that are linearly separable so that it can completely divide the samples into two parts by a super-plane and apply the values −1 on one side and 1 on the other. Obtaining perceptron weights is the goal of training, so that perceptron produces the actual value of training specimens. The perceptron is trained according to the following algorithm:
A.
Weights take random values
B.
Perceptron is applied for each training sample. If the samples are misjudged, the perceptron weight values are corrected.
C.
Is all training evaluated correctly?
D.
Yes, the end of the algorithm.
E.
No, back to step B.
When the network is mono-neuronal, it loses the ability to perform nonlinear functions. MLPs can be a beneficial solution in this case because in many nonlinear mapping engineering problems, that can be done with high precision MLP networks, it can be the solution. As mentioned, MLP is a feed-forward network, the output of which is calculated directly from the input without any feedback. In the MLP network, the neuron model consists of a nonlinear activation function. Having nonlinearity, coherence, and derivation everywhere are features that an activation function should have. In this study, to find the best artificial neural network configuration, many different MLP neural network structures, including one, two, and three latent layer structures with different numbers of neurons in each layer and different activation functions, were implemented.

3. Result and Discussion

In this work, MATLAB software was used to implement the MLP neural network. In this software package, there are several toolboxes for training different neural networks. However, in the implementation of the neural network in this study, no pre-designed toolbox was used, and all steps of implementation of the neural network were programmed. However, the “newff” function in the software was used to train the network. In one of the stages of neural network implementation, the network training function is located in several “for” loops that evaluate the different number of layers and the different number of neurons in each layer, and different activation functions. Finally, it stores the best network, which has the least error of the network output with the desired output. The characteristics of the designed networks are shown in Table 1. After extracting the characteristics introduced in the previous section, two MLP neural networks were designed to determine the thickness of the scale and classify the flow regimes. The inputs of both networks were characteristic of STD extracted from the fourth stage of approximation signal and the details of the first to fourth stages. The data obtained from 126 simulations were divided into three categories. Then, 88 sets of data were assigned to training data, 19 data sets to validation data, and 19 data sets to testing data. The output of the first network predicted the thickness of the scale in the pipe, which included thicknesses of 0, 0.5, 1.5, 2, 2.5, and 3 cm. The structure of the predictor network is shown in Figure 6. This network has a hidden layer and ten neurons in the hidden layer. To show the performance of this network, error histograms and error diagrams were plotted, which can be seen in Figure 7 for training, validation, and testing datasets. The error diagram shows the amount of error between the desired output data and the network output, and the error histogram shows the error scatter. Two criteria of Mean Square Error (MSE) and Root Mean Square Error (RMSE) were used to show the error values of this network. These criteria were calculated according to Equations (7) and (8) and are tabulated in Table 2.
M S E = j = 1 N X j E x p X j P r e d 2 N
R M S E = j = 1 N X j E x p X j P r e d 2 N 0.5
The structure of the flow regimes classifier neural network is shown in Figure 8. The inputs of this network are the same as the previous network. The output of this network is the type of flow regime in which the numbers 1, 2, and 3 represent annular, homogeneous, and stratified regimes, respectively. In this network, if the network output is between 0.5 and 1.5, output 1 is considered, if it is between 1.5 and 2.5, the output is returned to 2, and if the output is between 2.5 and 3.5, the network output is considered a stratified regime. To show the performance of this network, a confusion matrix is used for training, validation, and testing datasets, which can be seen in Figure 9. As can be seen from this figure, the target classes, which include the type of flow regimes and the network output, are compared. All classes were correctly identified by the designed neural network.
In our current study, the wavelet transform technique was used to extract the signal features. Progress to the fourth stage of wavelet transform led to the extraction of very suitable characteristics as neural network inputs. As shown in Table 3, based on the comparison with other detection systems, it is quite clear that by extracting the appropriate characteristics, the accuracy of the system can be significantly increased. Researchers can examine the methodology used in this research for three-phase flows in future studies, and use deep neural networks to determine the parameters of multiphase flows. It should also be mentioned that using the radio-isotope source that we used in our work requires radiation protection measures. Interesting alternatives to hazardous radioactive sources are conventional x-ray tubes [18], and also modern laser-plasma based X-ray sources [70]. The latter can become very bright X-ray sources, if highly efficient laser-nanowire interaction is employed [71,72].

4. Conclusions

This study presents a non-invasive and innovative approach to investigate types of flow regimes and thickness of scale in oil and gas transmission pipelines. The proposed method used the gamma attenuation technique to pass photons through a test pipe and to detect the transmitted photons. After recording the data, the characteristics of the received signals were extracted using wavelet transform. These characteristics were considered as inputs to a neural network model. Flow regimes and prediction of scale thickness in the range RMSE ≤ 0.06 were detected in this study. A major advantage of the proposed method over previous studies is its use of a single detector, which is possible due to the advanced evaluation. In addition to increasing the system’s simplicity, the proposed method reduces costs required for final construction. This economic saving could enhance cost-saving techniques across the petrochemical industry.

Author Contributions

Conceptualization, E.E.-Z.; methodology, E.E.-Z. and A.M.I.; software, A.S.B. and G.H.R.; data curation, C.S. and A.S.S.; writing—original draft preparation, E.E.-Z. and A.M.I.; writing—review and editing, G.H.R., C.S. and A.M.I.; investigation, A.S.S. and C.S.; visualization, A.S.B. and G.H.R.; supervision, C.S., G.H.R. and A.M.I.; resource, A.S.S.; validation, E.E.-Z.; funding acquisition, E.E.-Z. and A.M.I. All authors have read and agreed to the published version of the manuscript.

Funding

The authors acknowledge support from the German Research Foundation and the Open Access Publication Fund of the Thueringer Universitaets-und Landesbibliothek Jena Projekt-Nr. 433052568; the BMBF-Projekt 05P21SJFA2 Verbundprojekt 05P2021 (ErUM-FSP T05); and the Deputyship for Research and Innovation of the Saudi Ministry of Education via its funding for the PSAU Advanced Computational Intelligence & Intelligent Systems Engineering (ACIISE) Research Group Project Number IF-PSAU-2021/01/18316.

Conflicts of Interest

The authors declare no conflict of interest.

References

  1. Salgado, C.M.; Salgado, W.L.; Dam, R.S.D.F.; Conti, C.C. Calculation of scales in oil pipeline using gamma-ray scattering and artificial intelligence. Measurement 2021, 179, 109455. [Google Scholar] [CrossRef]
  2. Affonso, R.R.; Dam, R.S.; Salgado, W.L.; Silva, A.X.D.; Salgado, C.M. Flow regime and volume fraction identification using nuclear techniques, artificial neural networks and computational fluid dynamics. Appl. Radiat. Isot. 2020, 159, 109103. [Google Scholar] [CrossRef] [PubMed]
  3. Alamoudi, M.; Sattari, M.; Balubaid, M.; Eftekhari-Zadeh, E.; Nazemi, E.; Taylan, O.; Kalmoun, E. Application of Gamma Attenuation Technique and Artificial Intelligence to Detect Scale Thickness in Pipelines in Which Two-Phase Flows with Different Flow Regimes and Void Fractions Exist. Symmetry 2021, 13, 1198. [Google Scholar] [CrossRef]
  4. Sattari, M.A.; Roshani, G.H.; Hanus, R. Improving the structure of two-phase flow meter using feature extraction and GMDH neural network. Radiat. Phys. Chem. 2020, 171, 108725. [Google Scholar] [CrossRef]
  5. Kamari, A.; Gharagheizi, F.; Bahadori, A.; Mohammadi, A.H. Rigorous modeling for prediction of barium sulfate (barite) deposition in oilfield brines. Fluid Phase Equilibria 2014, 366, 117–126. [Google Scholar] [CrossRef]
  6. Åbro, E.; Johansen, G.A. Improved void fraction determination by means of multibeam gamma-ray attenuation measurements. Flow Meas. Instrum. 1999, 10, 99–108. [Google Scholar] [CrossRef]
  7. Nazemi, E.; Feghhi, S.A.H.; Roshani, G.H.; Peyvandi, R.G.; Setayeshi, S. Precise Void Fraction Measurement in Two-phase Flows Independent of the Flow Regime Using Gamma-ray Attenuation. Nucl. Eng. Technol. 2016, 48, 64–71. [Google Scholar] [CrossRef] [Green Version]
  8. Mayet, A.M.; Salama, A.S.; Alizadeh, S.M.; Nesic, S.; Guerrero, J.W.G.; Eftekhari-Zadeh, E.; Nazemi, E.; Iliyasu, A.M. Applying Data Mining and Artificial Intelligence Techniques for High Precision Measuring of the Two-Phase Flow’s Characteristics Independent of the Pipe’s Scale Layer. Electronics 2022, 11, 459. [Google Scholar] [CrossRef]
  9. Chunguo, J.; Qiuguo, B. Flow regime identification of gas/liquid two-phase flow in vertical pipe using RBF neural networks. In Proceedings of the Chinese Control and Decision Conference, Guilin, China, 17–19 June 2009; pp. 5143–5147. [Google Scholar]
  10. Peyvandi, R.G.; Rad, S.Z.I. Application of artificial neural networks for the prediction of volume fraction using spectra of gamma rays backscattered by three-phase flows. Eur. Phys. J. Plus 2017, 132, 1–8. [Google Scholar]
  11. Taylan, O.; Abusurrah, M.; Amiri, S.; Nazemi, E.; Eftekhari-Zadeh, E.; Roshani, G.H. Proposing an Intelligent Dual-Energy Radiation-Based System for Metering Scale Layer Thickness in Oil Pipelines Containing an Annular Regime of Three-Phase Flow. Mathematics 2021, 9, 2391. [Google Scholar] [CrossRef]
  12. Roshani, G.; Nazemi, E.; Roshani, M. Identification of flow regime and estimation of volume fraction independent of liquid phase density in gas-liquid two-phase flow. Prog. Nucl. Energy 2017, 98, 29–37. [Google Scholar] [CrossRef]
  13. Roshani, G.H.; Nazemi, E.; Feghhi, S.A.; Setayeshi, S. Flow regime identification and void fraction prediction in two-phase flows based on gamma ray attenuation. Measurment 2015, 62, 25–32. [Google Scholar] [CrossRef]
  14. Nazemi, E.; Roshani, G.H.; Feghhi, S.A.H.; Setayeshi, S.; Zadeh, E.E.; Fatehi, A. Optimization of a method for identifying the flow regime and measuring void fraction in a broad beam gamma-ray attenuation technique. Int. J. Hydrogen Energy 2016, 41, 7438–7444. [Google Scholar] [CrossRef]
  15. Gholam, H.R.; Ehsan, N.; Farzin, S.; Mohammad, A.I.; Salar, M. Designing a simple radiometric system to predict void fraction percentage independent of flow pattern using radial basis function. Metrol. Meas. Syst. 2018, 25, 347–358. [Google Scholar]
  16. Roshani, G.H.; Karami, A.; Nazemi, E.; Shama, F. Volume fraction determination of the annular three-phase flow of gas-oil-water using adaptive neuro-fuzzy inference system. Comput. Appl. Math. 2018, 37, 4321–4341. [Google Scholar] [CrossRef]
  17. Roshani, G.; Karami, A.; Khazaei, A.; Olfateh, A.; Nazemi, E.; Omidi, M. Optimization of radioactive sources to achieve the highest precision in three-phase flow meters using Jaya algorithm. Appl. Radiat. Isot. 2018, 139, 256–265. [Google Scholar] [CrossRef] [PubMed]
  18. Roshani, G.H.; Ali, P.J.M.; Mohammed, S.; Hanus, R.; Abdulkareem, L.; Alanezi, A.A.; Nazemi, E.; Eftekhari-Zadeh, E.; Kalmoun, E.M. Feasibility Study of Using X-ray Tube and GMDH for Measuring Volume Fractions of Annular and Stratified Regimes in Three-Phase Flows. Symmetry 2021, 13, 613. [Google Scholar] [CrossRef]
  19. Hanus, R.; Zych, M.; Petryka, L.; Jaszczur, M.; Hanus, P. Signals features extraction in liquid-gas flow measurements using gamma densitometry. Part 1: Time domain. In Proceedings of the EFM15—Experimental Fluid Mechanics, Prague, Czech Republic, 17–20 November 2016; p. 02035. [Google Scholar]
  20. Sattari, M.A.; Roshani, G.H.; Hanus, R.; Nazemi, E. Applicability of time-domain feature extraction methods and artificial intelligence in two-phase flow meters based on gamma-ray absorption technique. Measurement 2021, 168, 108474. [Google Scholar] [CrossRef]
  21. Hanus, R.; Zych, M.; Petryka, L.; Jaszczur, M.; Hanus, P. Signals features extraction in liquid-gas flow measurements using gamma densitometry. Part 2: Frequency domain. In Proceedings of the EFM15—Experimental Fluid Mechanics, Prague, Czech Republic, 17–20 November 2016; p. 02036. [Google Scholar] [CrossRef] [Green Version]
  22. Hosseini, S.; Roshani, G.; Setayeshi, S. Precise gamma based two-phase flow meter using frequency feature extraction and only one detector. Flow Meas. Instrum. 2020, 72, 101693. [Google Scholar] [CrossRef]
  23. Balubaid, M.; Sattari, M.A.; Taylan, O.; Bakhsh, A.A.; Nazemi, E. Applications of Discrete Wavelet Transform for Feature Extraction to Increase the Accuracy of Monitoring Systems of Liquid Petroleum Products. Mathematics 2021, 9, 3215. [Google Scholar] [CrossRef]
  24. Roshani, G.H.; Ali, P.J.M.; Mohammed, S.; Hanus, R.; Abdulkareem, L.; Alanezi, A.A.; Sattari, M.A.; Amiri, S.; Nazemi, E.; Eftekhari-Zadeh, E.; et al. Simulation Study of Utilizing X-ray Tube in Monitoring Systems of Liquid Petroleum Products. Processes 2021, 9, 828. [Google Scholar] [CrossRef]
  25. Taylan, O.; Sattari, M.A.; Essoussi, I.E.; Nazemi, E. Frequency Domain Feature Extraction Investigation to Increase the Accuracy of an Intelligent Nondestructive System for Volume Fraction and Regime Determination of Gas-Water-Oil Three-Phase Flows. Mathematics 2021, 9, 2091. [Google Scholar] [CrossRef]
  26. Roshani, M.; Phan, G.; Roshani, G.H.; Hanus, R.; Nazemi, B.; Corniani, E.; Nazemi, E. Combination of X-ray tube and GMDH neural network as a nondestructive and potential technique for measuring characteristics of gas-oil–water three phase flows. Measurement 2021, 168, 108427. [Google Scholar] [CrossRef]
  27. Basahel, A.; Sattari, M.; Taylan, O.; Nazemi, E. Application of Feature Extraction and Artificial Intelligence Techniques for Increasing the Accuracy of X-ray Radiation Based Two Phase Flow Meter. Mathematics 2021, 9, 1227. [Google Scholar] [CrossRef]
  28. The Record. Available online: https://www.therecord.com/news/waterloo-region/2015/01/21/aging-water-system-in-kitchener-means-big-rate-hikes-or-more-water-main-breaks.html (accessed on 1 January 2022).
  29. Übeylı, E.D.; Güler, İ. Feature extraction from Doppler ultrasound signals for automated diagnostic systems. Comput. Biol. Med. 2005, 35, 735–764. [Google Scholar] [CrossRef]
  30. Daubechies, I. The wavelet transform, time-frequency localization and signal analysis. IEEE Trans. Inf. Theory 1990, 36, 961–1005. [Google Scholar] [CrossRef] [Green Version]
  31. Soltani, S. On the use of the wavelet decomposition for time series prediction. Neurocomputing 2002, 48, 267–277. [Google Scholar] [CrossRef]
  32. Jahanshahi, A.; Taram, M.K.; Eskandari, N. Blokus Duo game on FPGA. In Proceedings of the 17th CSI International Symposium on Computer Architecture & Digital Systems (CADS), Tehran, Iran, 30–31 October 2013; pp. 149–152. [Google Scholar]
  33. Lalbakhsh, A.; Mohamadpour, G.; Roshani, S.; Ami, M.; Roshani, S.; Sayem, A.S.M.; Alibakhshikenari, M.; Koziel, S. Design of a Compact Planar Transmission Line for Miniaturized Rat-Race Coupler with Harmonics Suppression. IEEE Access 2021, 9, 129207–129217. [Google Scholar] [CrossRef]
  34. Hookari, M.; Roshani, S.; Roshani, S. High-efficiency balanced power amplifier using miniaturized harmonics suppressed coupler. Int. J. RF Microw. Comput. Aided Eng. 2020, 30, e22252. [Google Scholar] [CrossRef]
  35. Roshani, S.; Roshani, S. A compact coupler design using meandered line compact microstrip resonant cell (MLCMRC) and bended lines. Wirel. Netw. 2021, 27, 677–684. [Google Scholar] [CrossRef]
  36. Lotfi, S.; Roshani, S.; Roshani, S.; Gilan, M.S. Wilkinson power divider with band-pass filtering response and harmonics suppression using open and short stubs. Frequenz 2020, 74, 169–176. [Google Scholar] [CrossRef]
  37. Jamshidi, M.; Siahkamari, H.; Roshani, S.; Roshani, S. A compact Gysel power divider design using U-shaped and T-shaped resonators with harmonics suppression. Electromagnetics 2019, 39, 491–504. [Google Scholar] [CrossRef]
  38. Roshani, S.; Roshani, S. Two-section impedance transformer design and modeling for power amplifier applications. Appl. Comput. Electromagn. Soc. J. 2017, 32, 1042–1047. [Google Scholar]
  39. Chapnevis, A.; Güvenç, I.; Bulut, E. Traffic Shifting based Resource Optimization in Aggregated IoT Communication. In Proceedings of the IEEE 45th Conference on Local Computer Networks (LCN), Sydney, NSW, Australia, 16–19 November 2020; pp. 233–243. [Google Scholar]
  40. Shiri, A. A Novel Implementation of CORDIC Algorithm Based on Dynamic Microrotation Generation. Mapta J. Electr. Comput. Eng. 2021, 3, 17–27. [Google Scholar]
  41. Sabzi, M.; Kamarei, M.; Razban, T.; Mahe, Y. New noise cancellation topology in common-gate LNAs. Microelectron. J. 2020, 100, 104800. [Google Scholar] [CrossRef]
  42. Sabzi, M.; Kamarei, M.; Haghighi, T.R.; Mahé, Y. Analysis and Design of X-Band LNA Using Parallel Technique. In Proceedings of the 28th Iranian Conference on Electrical Engineering (ICEE), Tabriz, Iran, 26–28 May 2020; pp. 1–5. [Google Scholar] [CrossRef]
  43. Sadri, S.; Tomar, N.; Yang, C.; Audi, S.H.; Cowley, A.W.; Dash, R.K. Mechanistic computational modeling of the kinetics and regulation of NADPH oxidase 2 assembly and activation facilitating superoxide production. Free Radic. Res. 2020, 54, 695–721. [Google Scholar] [CrossRef]
  44. Pejman, R.; Maghami, E.; Najafi, A.R. How to design a blockage-tolerant cooling network? Appl. Therm. Eng. 2020, 181, 115916. [Google Scholar] [CrossRef]
  45. Lotfi, F.; Semiari, O. Performance Analysis and Optimization of Uplink Cellular Networks with Flexible Frame Structure. In Proceedings of the IEEE 93rd Vehicular Technology Conference (VTC2021-Spring), Helsinki, Finland, 25–28 April 2021; pp. 1–5. [Google Scholar]
  46. Dizadji, M.R.; Yousefi-Koma, A.; Gharehnazifam, Z. 3-Axis Attitude Control of Satellite using Adaptive Direct Fuzzy Controller. In Proceedings of the 6th RSI International Conference on Robotics and Mechatronics (IcRoM), Tehran, Iran, 23–25 October 2018; pp. 1–5. [Google Scholar]
  47. Rouhi, S.; Xiros, N.; Aktosun, E.; Sultan, C.; VanZwieten, J.; Ioup, J.; Sadeqi, S. A Small-Scale Experimental Ocean Current Turbine Apparatus for Power Measurement. In Proceedings of the ASME International Mechanical Engineering Congress and Exposition, Virtual, 1–5 November 2021. [Google Scholar]
  48. Neya, N.M.; Saberi, S.; Rezaie, B. Design of an adaptive controller to capture maximum power from a variable speed wind turbine system without any prior knowledge of system parameters. Trans. Inst. Meas. Control 2021, 44, 609–619. [Google Scholar] [CrossRef]
  49. Rouhi, S.; Xiros, N.; Sadeqi, S.; Ioup, J.; Sultan, C.; VanZwieten, J. CFD Validation of the Thermodynamics Model of a Compressed Gaseous Hydrogen Storage Tank. In Proceedings of the 5–6th Thermal and Fluids Engineering Conference (TFEC), New Orleans, LA, USA, 26–28 May 2021. [Google Scholar]
  50. Aghajanian, A.; Thomas, C.; Behfarnia, K. Effect of Micro-Silica Addition into Electric Arc Furnace Steel Slag Eco-Efficient Concrete. Appl. Sci. 2021, 11, 4893. [Google Scholar] [CrossRef]
  51. Shirkhanloo, S.; Najafi, M.; Kaushal, V.; Rajabi, M. A Comparative Study on the Effect of Class C and Class F Fly Ashes on Geotechnical Properties of High-Plasticity Clay. CivilEng 2021, 2, 1009–1018. [Google Scholar] [CrossRef]
  52. Khodabandelu, A.; Park, J. Agent-based modeling and simulation in construction. Autom. Constr. 2021, 131, 103882. [Google Scholar] [CrossRef]
  53. Khodabandelu, A.; Choi, J.O.; Park, J.; Sanei, M. Developing a simulation model for lifting a modular house. In Proceedings of the Construction Research Congress 2020: Computer Applications, Tampa, AZ, USA, 8–10 March 2020; pp. 145–152. [Google Scholar]
  54. Maghami, E.; Pejman, R.; Najafi, A.R. Fracture micromechanics of human dentin: A microscale numerical model. J. Mech. Behav. Biomed. Mater. 2020, 114, 104171. [Google Scholar] [CrossRef]
  55. Ashrafi, R.; Azarbayjani, M.; Cox, R.; Futrell, B.; Glass, J.; Zarrabi, A.; Amirazar, A. Assessing the Performance of UFAD System in an Office Building Located in Various Climate Zones. In Proceedings of the Symposium on Simulation for Architecture and Urban Design, Atlanta, GA, USA, 7–9 April 2019. [Google Scholar]
  56. Mohaghegh, M.; Valipour, A.S. Triggering Economic Growth:Trade Liberalization as the Prominent Factor in Less-developed Countries. Bus. Econ. Res. 2021, 11, 252–265. [Google Scholar] [CrossRef]
  57. Su, L.; Shi, W.; Chen, X.; Meng, L.; Yuan, L.; Chen, X.; Huang, G. Simultaneously and quantitatively analyze the heavy metals in Sargassum fusiforme by laser-induced breakdown spectroscopy. Food Chem. 2020, 338, 127797. [Google Scholar] [CrossRef] [PubMed]
  58. Mohaghegh, M.; Valipour, A. Income-dependent impacts of financial development and human capital on economic growth. A non-stationary panel analysis. Theor. Appl. Econ. 2020, 27, 263–274. [Google Scholar]
  59. Azad, F.A.; Rad, S.A.; Yazdi, M.R.H.; Masouleh, M.T.; Kalhor, A. Dynamics analysis, offline–online tuning and identification of base inertia parameters for the 3-DOF Delta parallel robot under insufficient excitations. Meccanica 2022, 57, 1–34. [Google Scholar] [CrossRef]
  60. Daihong, J.; Sai, Z.; Lei, D.; Yueming, D. Multi-scale generative adversarial network for image super-resolution. Soft Comput. 2022, 26, 3631–3641. [Google Scholar] [CrossRef]
  61. Chen, Z.; Tang, J.; Zhang, X.Y.; So, D.K.C.; Jin, S.; Wong, K.-K. Hybrid Evolutionary-Based Sparse Channel Estimation for IRS-Assisted mmWave MIMO Systems. IEEE Trans. Wirel. Commun. 2021, 21, 1586–1601. [Google Scholar] [CrossRef]
  62. Meng, Q.; Ma, Q.; Zhou, G. Adaptive Output Feedback Control for Stochastic Uncertain Nonlinear Time-delay Systems. IEEE Trans. Circuits Syst. II Express Briefs 2022, 106, 1. [Google Scholar] [CrossRef]
  63. Jiang, Y.; Li, X. Broadband cancellation method in an adaptive co-site interference cancellation system. Int. J. Electron. 2021, 109, 854–874. [Google Scholar] [CrossRef]
  64. Cai, L.; Xiong, L.; Cao, J.; Zhang, H.; Alsaadi, F.E. State quantized sampled-data control design for complex-valued memristive neural networks. J. Frankl. Inst. 2022, in press. [Google Scholar] [CrossRef]
  65. Wang, K.; Wang, H.; Li, S. Renewable quantile regression for streaming datasets. Knowl. Based Syst. 2021, 235, 107675. [Google Scholar] [CrossRef]
  66. Li, Y.; Du, L.; Wei, D. Multiscale CNN Based on Component Analysis for SAR ATR. IEEE Trans. Geosci. Remote Sens. 2021, 60, 1–12. [Google Scholar] [CrossRef]
  67. Zhang, J.; Zhu, C.; Zheng, L.; Xu, K. ROSEFusion: Random optimization for online dense reconstruction under fast camera motion. ACM Trans. Graph. 2021, 40, 1–17. [Google Scholar] [CrossRef]
  68. Taylor, J.G. Neural Networks and Their Applications; John Wiley & Sons Ltd.: Brighton, UK, 1996. [Google Scholar]
  69. Gallant, A.R.; White, H. On learning the derivatives of an unknown mapping with multilayer feedforward networks. Neural Netw. 1992, 5, 129–138. [Google Scholar] [CrossRef] [Green Version]
  70. Lawrence, T.H.; Seely, J.F. Laser-produced X-ray sources. Radiat. Phys. Chem. 2010, 79, 132–138. [Google Scholar]
  71. Eftekhari-Zadeh, E.; Blümcke, M.S.; Samsonova, Z.; Loetzsch, R.; Uschmann, I.; Zapf, M.; Ronning, C.; Rosmej, O.N.; Kartashov, D.; Spielmann, C. Laser energy absorption and x-ray generation in nanowire arrays irradiated by relativistically intense ultra-high contrast femtosecond laser pulses. Phys. Plasmas 2022, 29, 013301. [Google Scholar] [CrossRef]
  72. Hollinger, R.; Bargsten, C.; Shlyaptsev, V.N.; Kaymak, V.; Pukhov, A.; Capeluto, M.G.; Wang, S.; Rockwood, A.; Wang, Y.; Townsend, A.; et al. Efficient picosecond x-ray pulse generation from plasmas in the radiation dominated regime. Optica 2017, 4, 1344–1349. [Google Scholar] [CrossRef]
  73. Roshani, M.; Ali, P.J.M.; Roshani, G.H.; Nazemi, B.; Corniani, E.; Phan, N.-H.; Tran, H.-N.; Nazemi, E. X-ray tube with artificial neural network model as a promising alternative for radioisotope source in radiation based two phase flowmeters. Appl. Radiat. Isot. 2020, 164, 109255. [Google Scholar] [CrossRef]
  74. Roshani, M.; Sattari, M.A.; Ali, P.J.M.; Roshani, G.H.; Nazemi, B.; Corniani, E.; Nazemi, E. Application of GMDH neural network technique to improve measuring precision of a simplified photon attenuation based two-phase flowmeter. Flow Meas. Instrum. 2020, 75, 101804. [Google Scholar] [CrossRef]
Figure 1. Example of pipe with scale formed in it (left) and a clean pipe (right) [28].
Photonics 09 00382 g001
Figure 2. Detection system showing 1—source shield, 2—dual energy source, 3—radiated gamma-ray, 4—gaseous phase, 5—scale formed, 6—liquid phase, 7—steel pipe, 8—NaI detector.
Photonics 09 00382 g002
Figure 3. Illustration of simulated flow regimes.
Photonics 09 00382 g003
Figure 4. Simulation of the detected gamma ray signal behind the test tube for different flow regimes with scale thicknesses ranging from 0 to 3 cm and a void fraction of 55%.
Photonics 09 00382 g004
Figure 5. (a) Wavelet transform is applied to divide the measured signal into approximated and detailed parts. (b) Scheme of the wavelet transform tree. “S” denotes signal, shown by red solid curve “a” approximation is shown by a blue solid curve, and “d” detail is shown for four stages by different green solid curves. As seen, from the fourth stage onwards, no significant high-frequency information was obtained.
Photonics 09 00382 g005
Figure 6. Illustration of Predictor MLP neural network structure used to predict scale thickness.
Photonics 09 00382 g006
Figure 7. Error histograms and error diagram for (a) training, (b) validation, and (c) testing datasets. Error diagrams in bottom show number of data used in the network in x-axes and error value in y-axes and error histograms in top show error value in x-axes and number of error incidents in y-axes.
Photonics 09 00382 g007
Figure 8. Illustration of Classifier MLP neural network structure to classify types of flow regimes.
Photonics 09 00382 g008
Figure 9. Confusion matrix for (a) training, (b) validation, and (c) testing datasets.
Photonics 09 00382 g009
Table 1. The characteristics of the designed networks.
ANNMLPMLP
outputScale thicknessFlow regime
Number of input neurons 55
Number of hidden layers11
Number of neurons in the hidden layer1015
Number of output neurons11
Number of epochs680780
Hidden layer activation functionTansigTansig
Table 2. Computed errors for the predictor network.
Data SetRMSEMSE
Training dataset0.0520.0027
Validation dataset0.050.0025
Testing dataset0.060.0036
Table 3. A comparison of the accuracy of the proposed detection system and previous studies.
RefExtracted FeaturesType of Neural NetworkMSERMSE
TrainingTestingTrainingTesting
[3]Lack of feature extractionRBF0.0490.370.220.19
[4]Time-domainGMDH1.241.201.111.09
[10]Lack of feature extractionMLP2.562.561.61.6
[20]Time-domainMLP0.210.0360.460.6
[22]Frequency-domainMLP0.170.670.420.82
[73]Lack of feature extractionMLP17.059.854.133.14
[74]Lack of feature extractionGMDH7.344.922.712.21
[current study]Wavelet featureMLP0.00270.00360.0520.06
Publisher’s Note: MDPI stays neutral with regard to jurisdictional claims in published maps and institutional affiliations.

