Article

Numerical Study on a Bound State in the Continuum Assisted Plasmonic Refractive Index Sensor

1
School of Information Science and Technology, Shanghai Tech University, Shanghai 201210, China
2
Shanghai Institute of Microsystem and Information Technology, Chinese Academy of Sciences, Shanghai 200050, China
3
University of Chinese Academy of Sciences, Beijing 100049, China
4
Shanghai Engineering Research Center of Energy Efficient and Custom AI IC, Shanghai 201210, China
*
Author to whom correspondence should be addressed.
Photonics 2022, 9(4), 224; https://doi.org/10.3390/photonics9040224
Submission received: 28 January 2022 / Revised: 28 February 2022 / Accepted: 2 March 2022 / Published: 28 March 2022
(This article belongs to the Special Issue Photonics for Emerging Applications in Communication and Sensing)

Abstract

:
Plasmonic sensors have attracted intensive attention due to their high sensitivity. However, due to intrinsic metallic loss, plasmonic sensors usually have a large full width at half maximum (FWHM) that limits the wavelength resolution. In this paper, we numerically investigate and propose a dielectric grating-assisted plasmonic device, leveraging the bound states in the continuum (BIC) effect to suppress the FWHM of the resonance. We initiate quasi-SP-BIC modes at 1559 nm and 1905 nm wavelengths by slightly tilting the incident angle at 2° to break the symmetry, featuring a narrow linewidth of 1.8 nm and 0.18 nm at these two wavelengths, respectively. Refractive index sensing has also been investigated, showing high sensitivity of 938 nm/RIU and figure of merit (FOM) of 521/RIU at 1559 nm and even higher sensitivity of 1264 nm/RIU and FOM of 7022/RIU at 1905 nm.

1. Introduction

Over the past two decades, there has been extensive research on plasmonic devices due to the capability to break the optical diffraction limit and confine light in sizes that are much smaller than the diffraction limit, thus enhancing the electric field [1,2]. Because of the surface wave nature, this type of device is usually very sensitive to surrounding refractive index changes [3,4,5,6,7,8], making them potential candidates for sensing application. A recent review paper summarized the state of the art in this area [9]. However, the intrinsic loss from the materials limits the linewidth of the device resonance and hinders further development. For example, interacting between impinging light and lossy materials will generate a thermal issue that modifies the surrounding medium and changes the sensitivity. One possible way to address this problem is to use BICs to mitigate the issue [10]. A figure-of-merit (FOM), defined as S/FWHM (S denotes the sensitivity, and FWHM denotes the full width at half maximum), is often adopted to characterize a sensor performance. An ideal sensor would possess a larger FOM, namely high sensitivity and a small FWHM. Therefore, an approach to reduce the FWHM of plasmonic sensors while maintaining their sensitivity is highly desired.
BIC, which is referred to as embedded eigenvalues or embedded trapped modes, was first proposed by von Neumann and Wigner in 1929 [11]. It is a localized state of an open structure with access to radiation channels, yet it remains highly confined with, in theory, an infinite lifetime and Q-factor. Therefore, it is considered an important approach for designing high-Q optical resonators [12,13,14,15] and has been applied to lasers [16,17,18,19] and sensors [20,21,22]. Recently, Azzam et al. [23] proposed a hybrid plasmonic-photonic structure that possesses two types of BICs, namely symmetry-protected BICs (SP-BICs) and Friedrich–Wintgen BICs (FW-BICs), of which the former is caused by the symmetry incompatibility between the local modes and the continuum spectrum and the latter is induced by the destructive interference of two scattering channels.
In this paper, we numerically study a BIC-assisted plasmonic sensor that leverages the BIC effect to suppress the linewidth of the resonance. A quasi-SP-BIC mode at 1559 nm can be initiated by slightly tilting the incident angle to break the symmetry, featuring a narrow FWHM of 1.8 nm. The device possesses high sensitivity (~938 nm/RIU) (RIU denotes refractive index unit) and high FOM (~521/RIU) characteristics in refractive index sensing. By tuning the operating wavelength to 1905 nm, our device exhibits a higher sensitivity of ~1264 nm/RIU, a narrower FWHM of 0.18 nm, and a better FOM of ~7022/RIU. The devices also feature a 0.1 nm/(g/L) sensitivity for glucose solution detection at 1559 nm and a 0.14 nm/(g/L) sensitivity at 1905 nm.

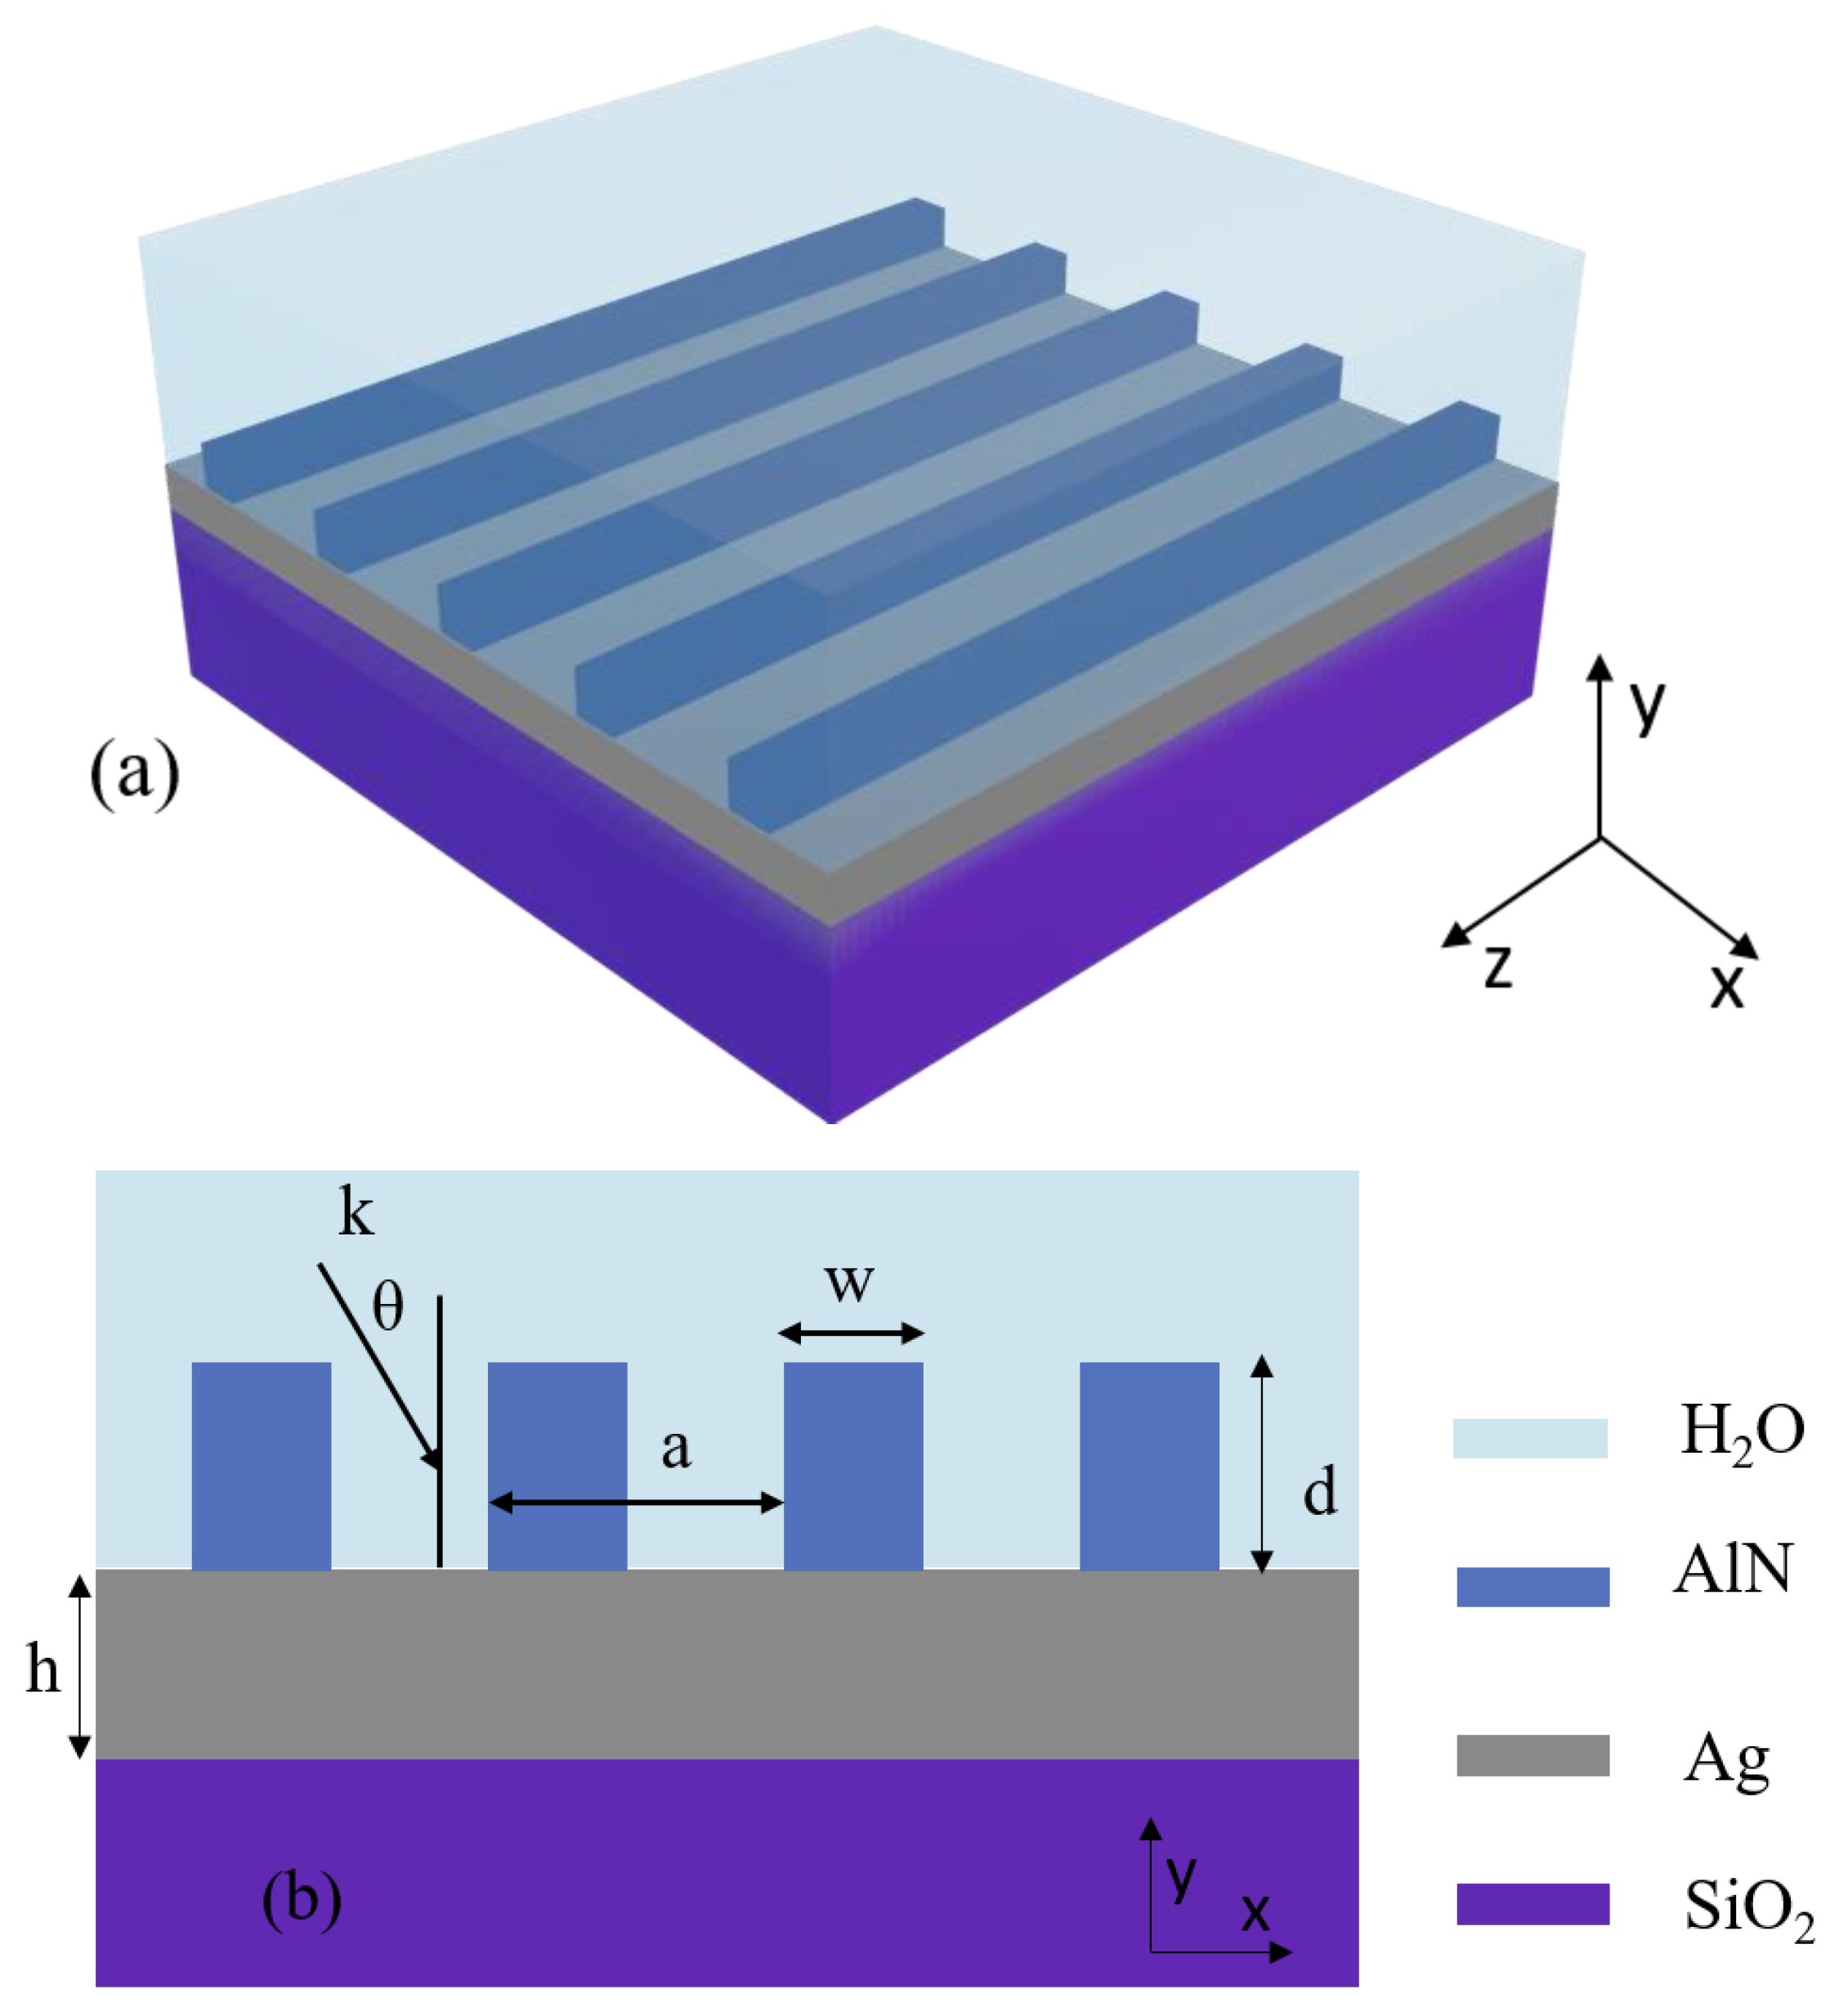
2. Design of a BIC-Assisted Plasmonic Sensor

The schematic of the proposed device is shown in Figure 1a. It consists of a one-dimensional aluminum nitride (AlN) grating on a metal–glass substrate. The momentum matching condition between the excited resonance mode and the incident light is [24]:
k s p = 2 π λ n s s i n θ + m 2 π a = 2 π λ ε m n s 2 ε m + n s 2
where ksp is the momentum of the surface plasmon, λ is the free-space wavelength, n s is the refractive index of the surrounding medium, εm is the dielectric constant of the metal layer, θ is the angle of incidence, a is the grating pitch, and m is the grating diffraction order.
In our device, we choose silicon dioxide as the substrate and silver as the metal layer for its low-loss property in the near-infrared range among all the metals [25]. We pick AlN as the grating material for its transparency in the near-infrared, which can effectively reduce the device loss and lead to a narrower resonance peak. For our simulation, we fix the refractive index of silicon dioxide at 1.45 for its negligible variations. The refractive indices of silver and AlN are from Refs [26,27], respectively. We set water as the surrounding medium for sensor design and fix its refractive index at 1.33. Figure 1b shows the cross-section of the device. The AlN grating with the width, w = 320 nm, is periodically arranged in the x-direction with a period, a = 1070 nm. The thicknesses of the grating, d, and silver film, h, are 440 nm and 100 nm, respectively. The value of the geometric parameter shown in Figure 1b is listed in Table 1.
We employ the finite difference time domain (FDTD) method to calculate the reflection of the proposed device. Due to the invariance in the z-direction of our device, for convenience, 2D-FDTD is chosen. We simulate the device using a non-uniform grid with a minimum grid size of 1 nm. The perfectly matched boundary condition and periodic Bloch boundary condition are selected for the y-direction and the x-direction, respectively. We use TM polarized light as the incident light to excite the plasmonic mode at the metal-dielectric interface.
The calculated reflected spectra for the wavelength range of 1350–1650 nm under different incident angles are plotted in Figure 2a. Two counter-propagating plasmonic modes, SP [+1] and SP [−1], form standing waves, resulting in the formation of symmetric and anti-symmetric modes with different energy bands as shown in the insets of Figure 2b. The bandgap between the two energy bands covers the wavelength region of 1475–1540 nm, and the width indicates the strength of the interaction between the two modes. It is worth noting that, in the upper band, there is a discontinuous region, circled by the red dash line, at the wavelength ~1559 nm when the light is normally incident, which does not exist in the lower band. To better illustrate this phenomenon, we plot the reflected spectral when the incident angles are 0° and 2° in Figure 2b. Compared with the normal incidence, a clear Fano resonance, marked by a red dashed square, is observed around 1559 nm when the device is illuminated with a 2° incident angle, indicating an SP-BIC exists in the device. The corresponding magnetic field distribution is shown in the inset of Figure 2b, where the magnetic field is antisymmetric to the central line. Since the incident plane wave is symmetric when the wavevector is normal to the plane. Additionally, the reflected wave and transmitted wave are supposed to be plane waves with no diffraction order other than the 0th order due to the small lattice constant. The different types of symmetry prevent coupling between the SP-BIC mode and the output wave, granting the strong localization of this mode. Since the incident wave cannot couple to the other modes at this wavelength, most of the energy is reflected, resulting in the high reflective coefficient, which explains the discontinuity of the upper band in Figure 2a. To excite a quasi-SP-BIC mode, we can slightly tilt the incident angle to break the symmetry and provide a certain amount of mode overlap with the quasi-SP-BIC mode.
Compared with the anti-symmetric mode in the upper band, the lower band features symmetric mode distribution, as shown in the blue dashed square in Figure 2b. Due to the same symmetry between the incident light and the mode, even normal incidence can excite the resonance, which results in the continuity of the lower band in Figure 2a.
In Figure 2b, we also observe the different linewidths of the two modes. As seen from the insets, compared with the symmetric mode, the anti-symmetric mode is better confined in the device, which results in a reduced radiation loss. Therefore, the anti-symmetric mode (FWHM = 1.8 nm) has a narrower resonance peak than the symmetric one (FWHM = 5.7 nm). Although exciting the SP-BIC is hard, we can leverage the quasi-SP-BIC mode to suppress the resonance linewidth and significantly improve the device sensing performance.
We also study the property of the quasi-SP-BIC mode by gradually tilting the incident angle to deviate from zero-degree, as shown in Figure 2c. As the incident angle gradually increases, the resonance contrast ratio (CR), which refers to the reflection difference between the off-resonance and the on-resonance, becomes larger, indicating more energy couples into the quasi-SP-BIC mode due to increasing mode overlap. However, this process is associated with increased radiation loss due to the deviation from the SP-BIC condition, which, in turn, widens the FWHM. Therefore, we make a trade-off between the FWHM and the resonance CR by calculating the value of CR/FWHM, as shown in the inset of Figure 2c, and choose 2° as the final incident angle for its biggest value of CR/FWHM.

3. Results

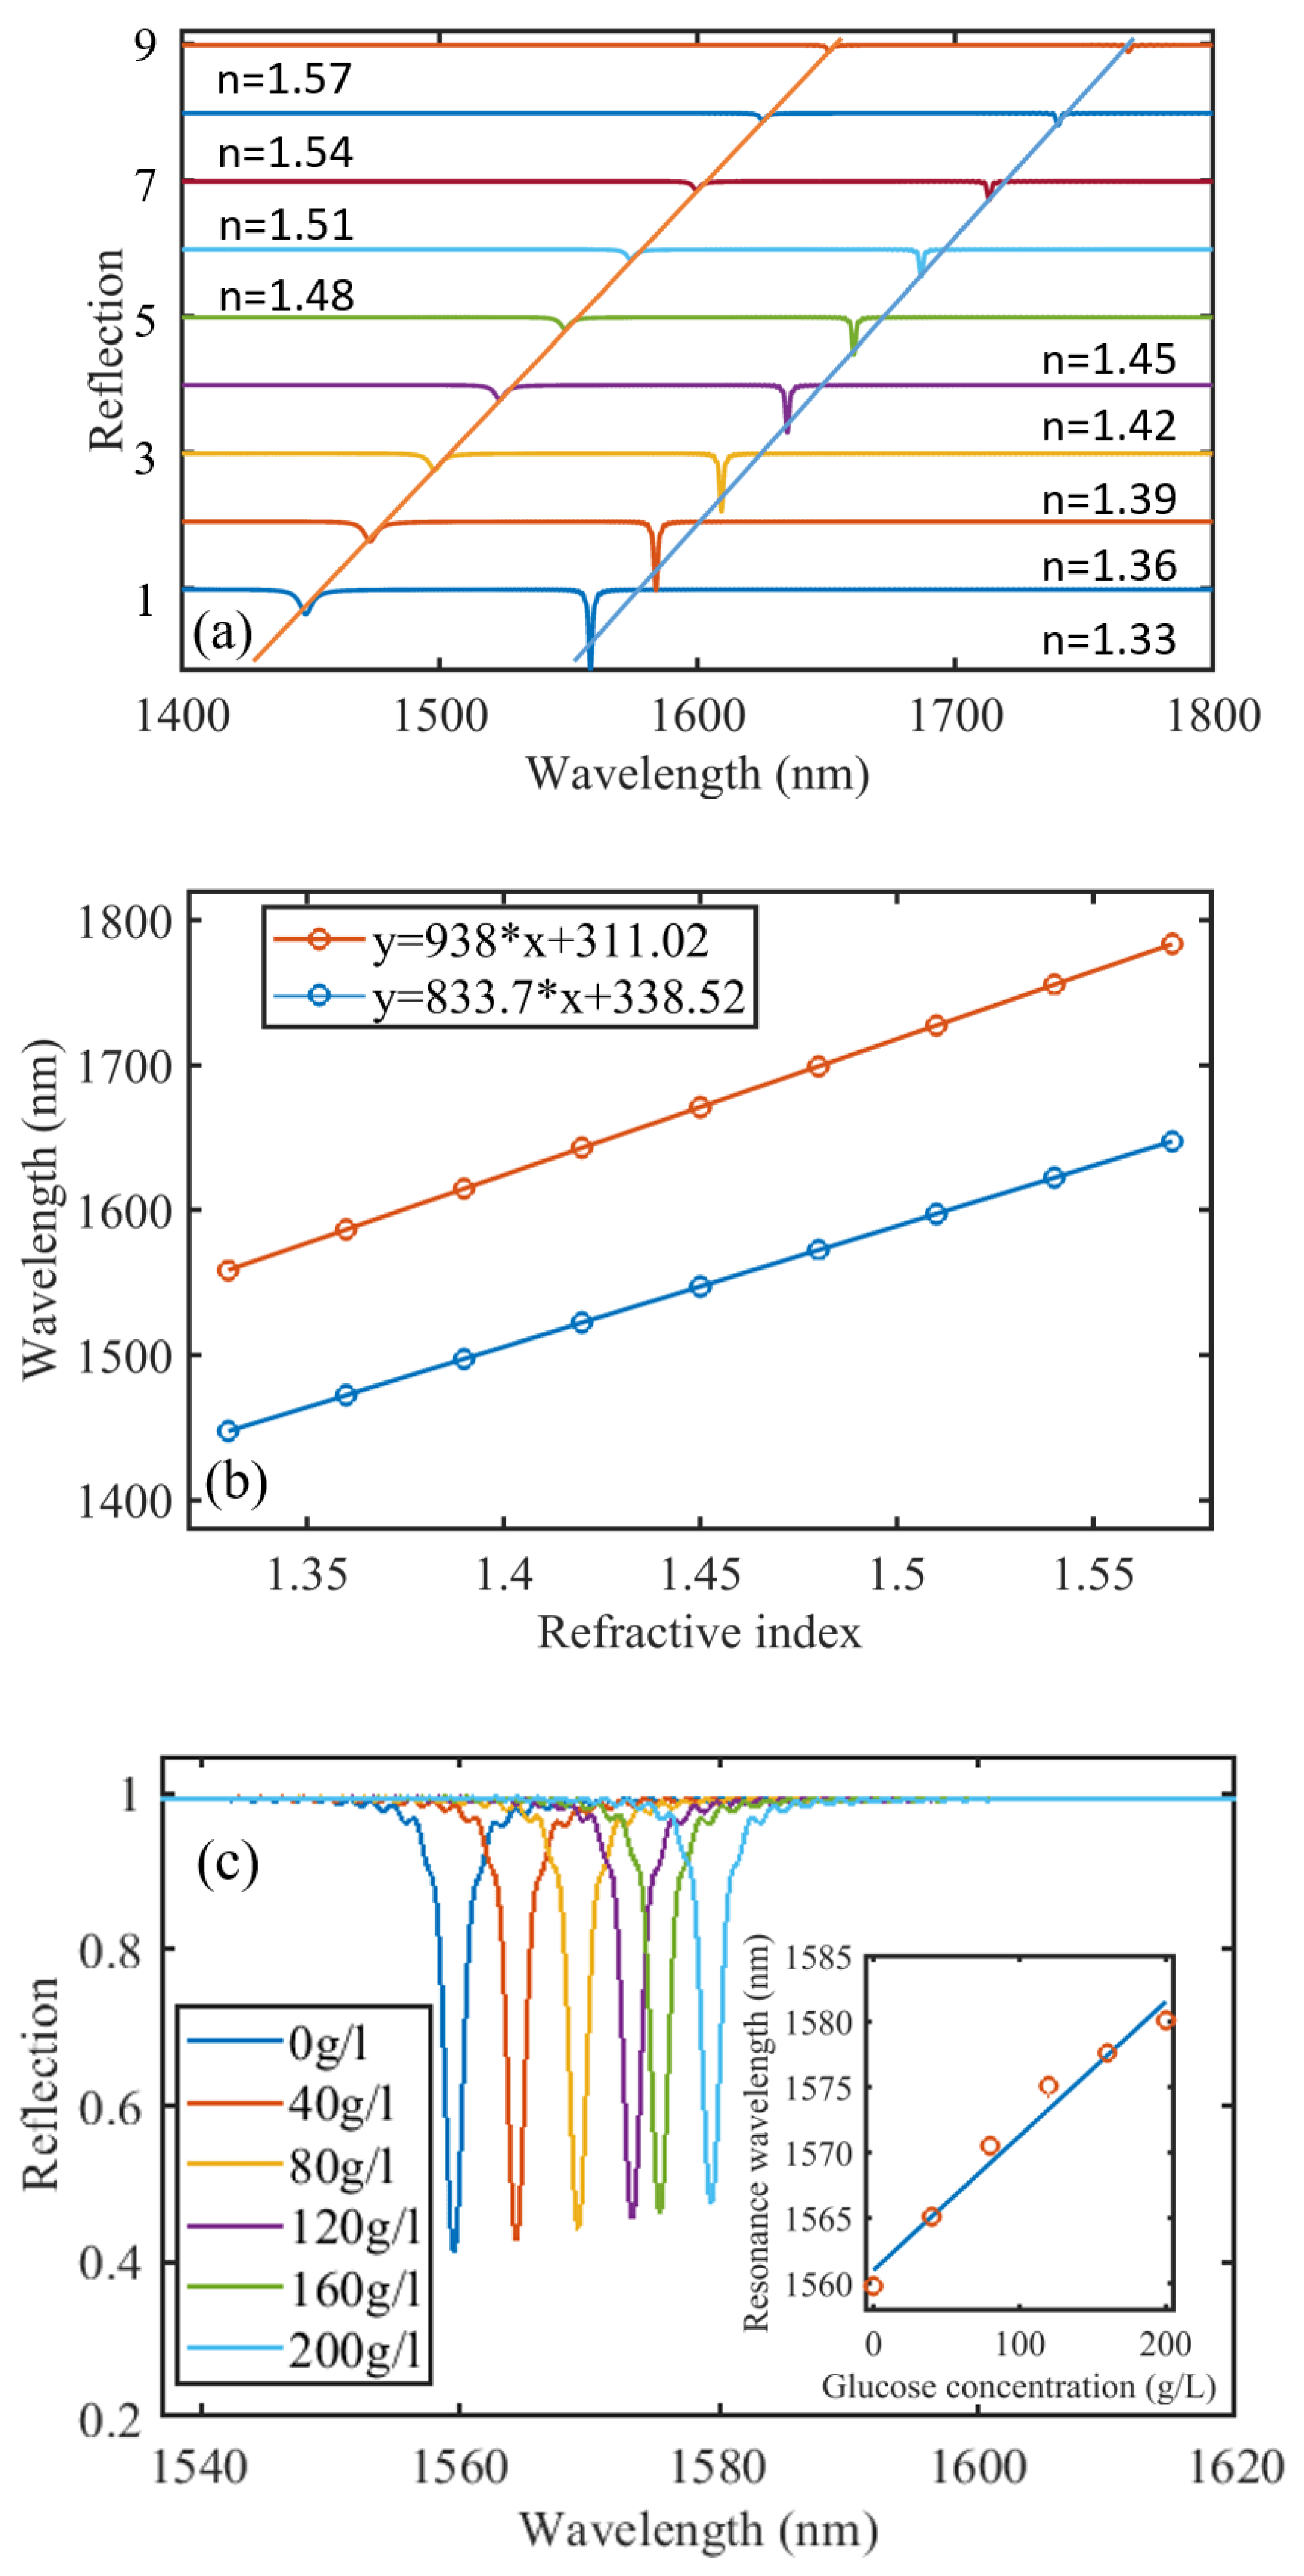
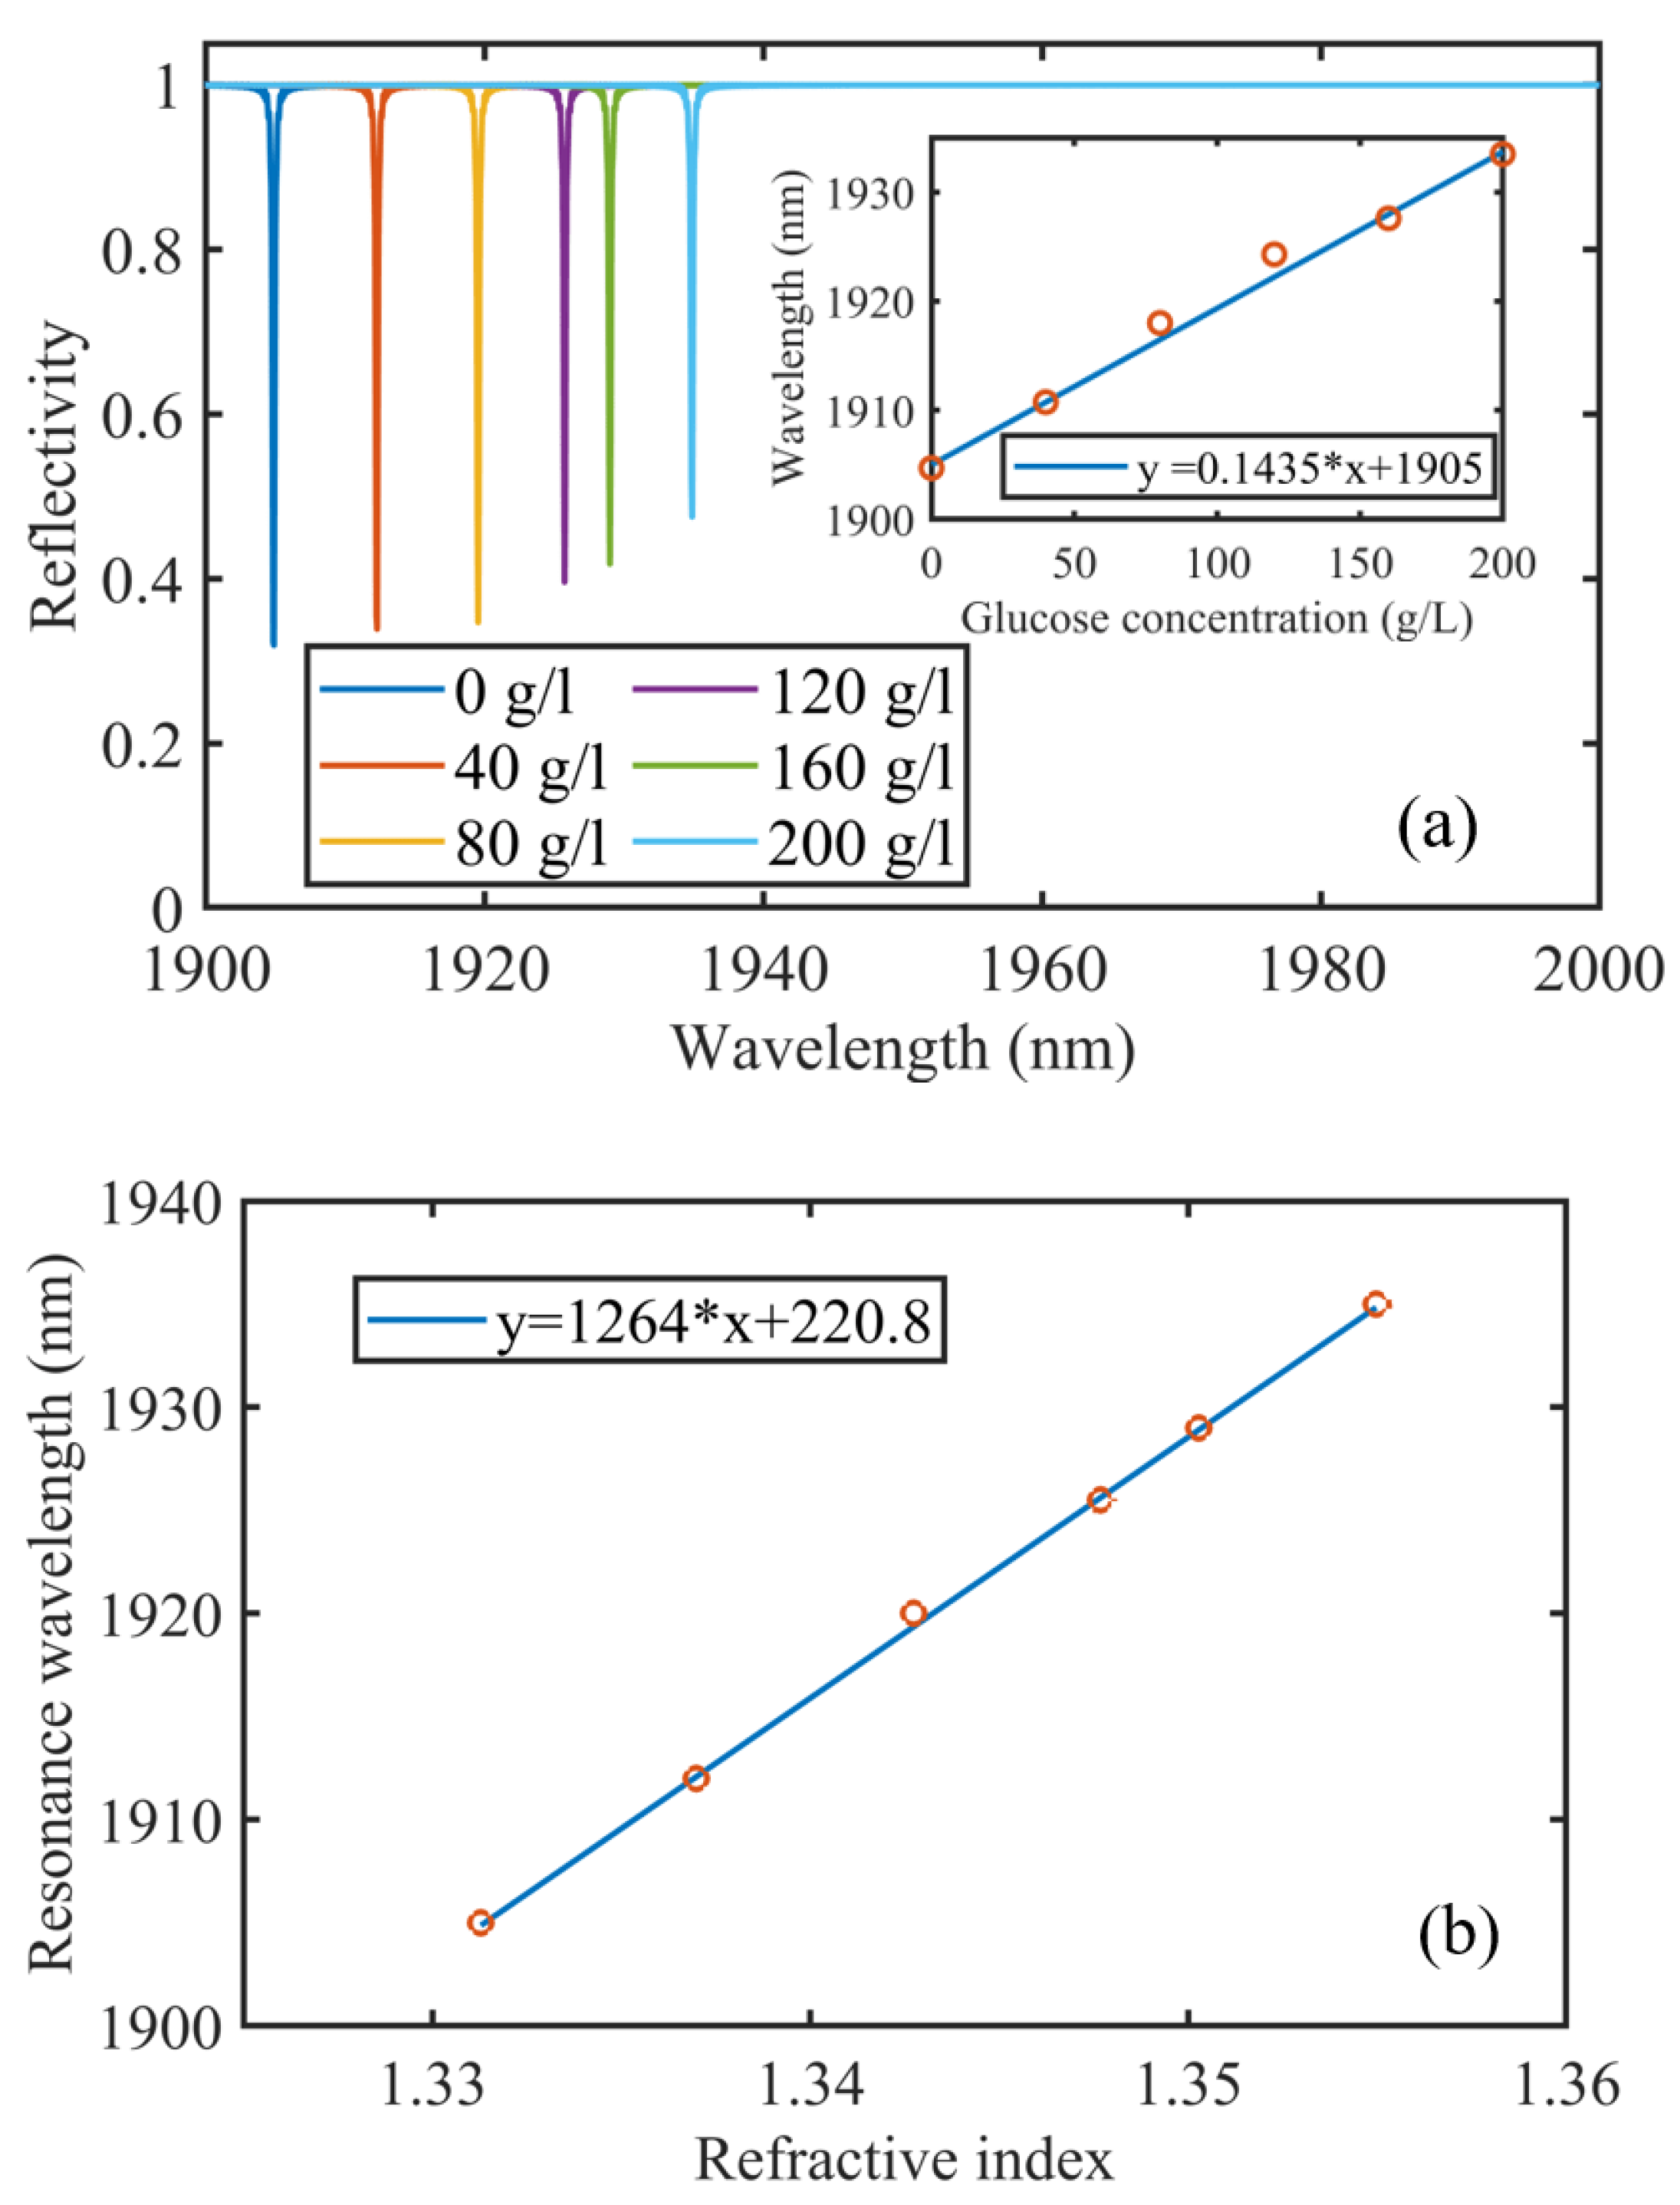
3.1. Sensitivity Characterization and Refractive Index Sensing

To evaluate the device sensing performance, we simulate the response of the device under different environmental mediums with a refractive index range from 1.33 to 1.57. During the calculation, we fixed the grating period, height, and width to 1070 nm, 440 nm, and 320 nm, respectively, and the silver thickness to 100 nm. Here, we set the incident angle to 2° to slightly break its symmetry and enter the quasi-SP-BIC mode. Figure 3a shows multiple reflected spectra when the surrounding refractive index gradually increases. The quasi-SP-BIC mode red-shifts from 1559 nm to 1784 nm while the other resonance peak red-shifts from 1447 nm to 1647 nm. Linear fittings in Figure 3b indicate a linear resonance shift for both the two modes, of which the former has a sensitivity of ~938 nm/RIU and the latter’s sensitivity is 833 nm/RIU. Considering the sharpness of the resonance, we obtain the FOM of the quasi-SP-BIC mode about 521/RIU, which is also the FOM of our device. In the following part, we will focus our discussion on the quasi-SP-BIC mode for its higher FOM.
Figure 3c presents the simulated resonance shift corresponding to different glucose concentrations in water with the incident angle at 2°. The refractive index of the glucose solution is taken from Ref. [28]. The resonance red-shifts linearly as the glucose concentration increases, showing 0.1 nm/(g/L).

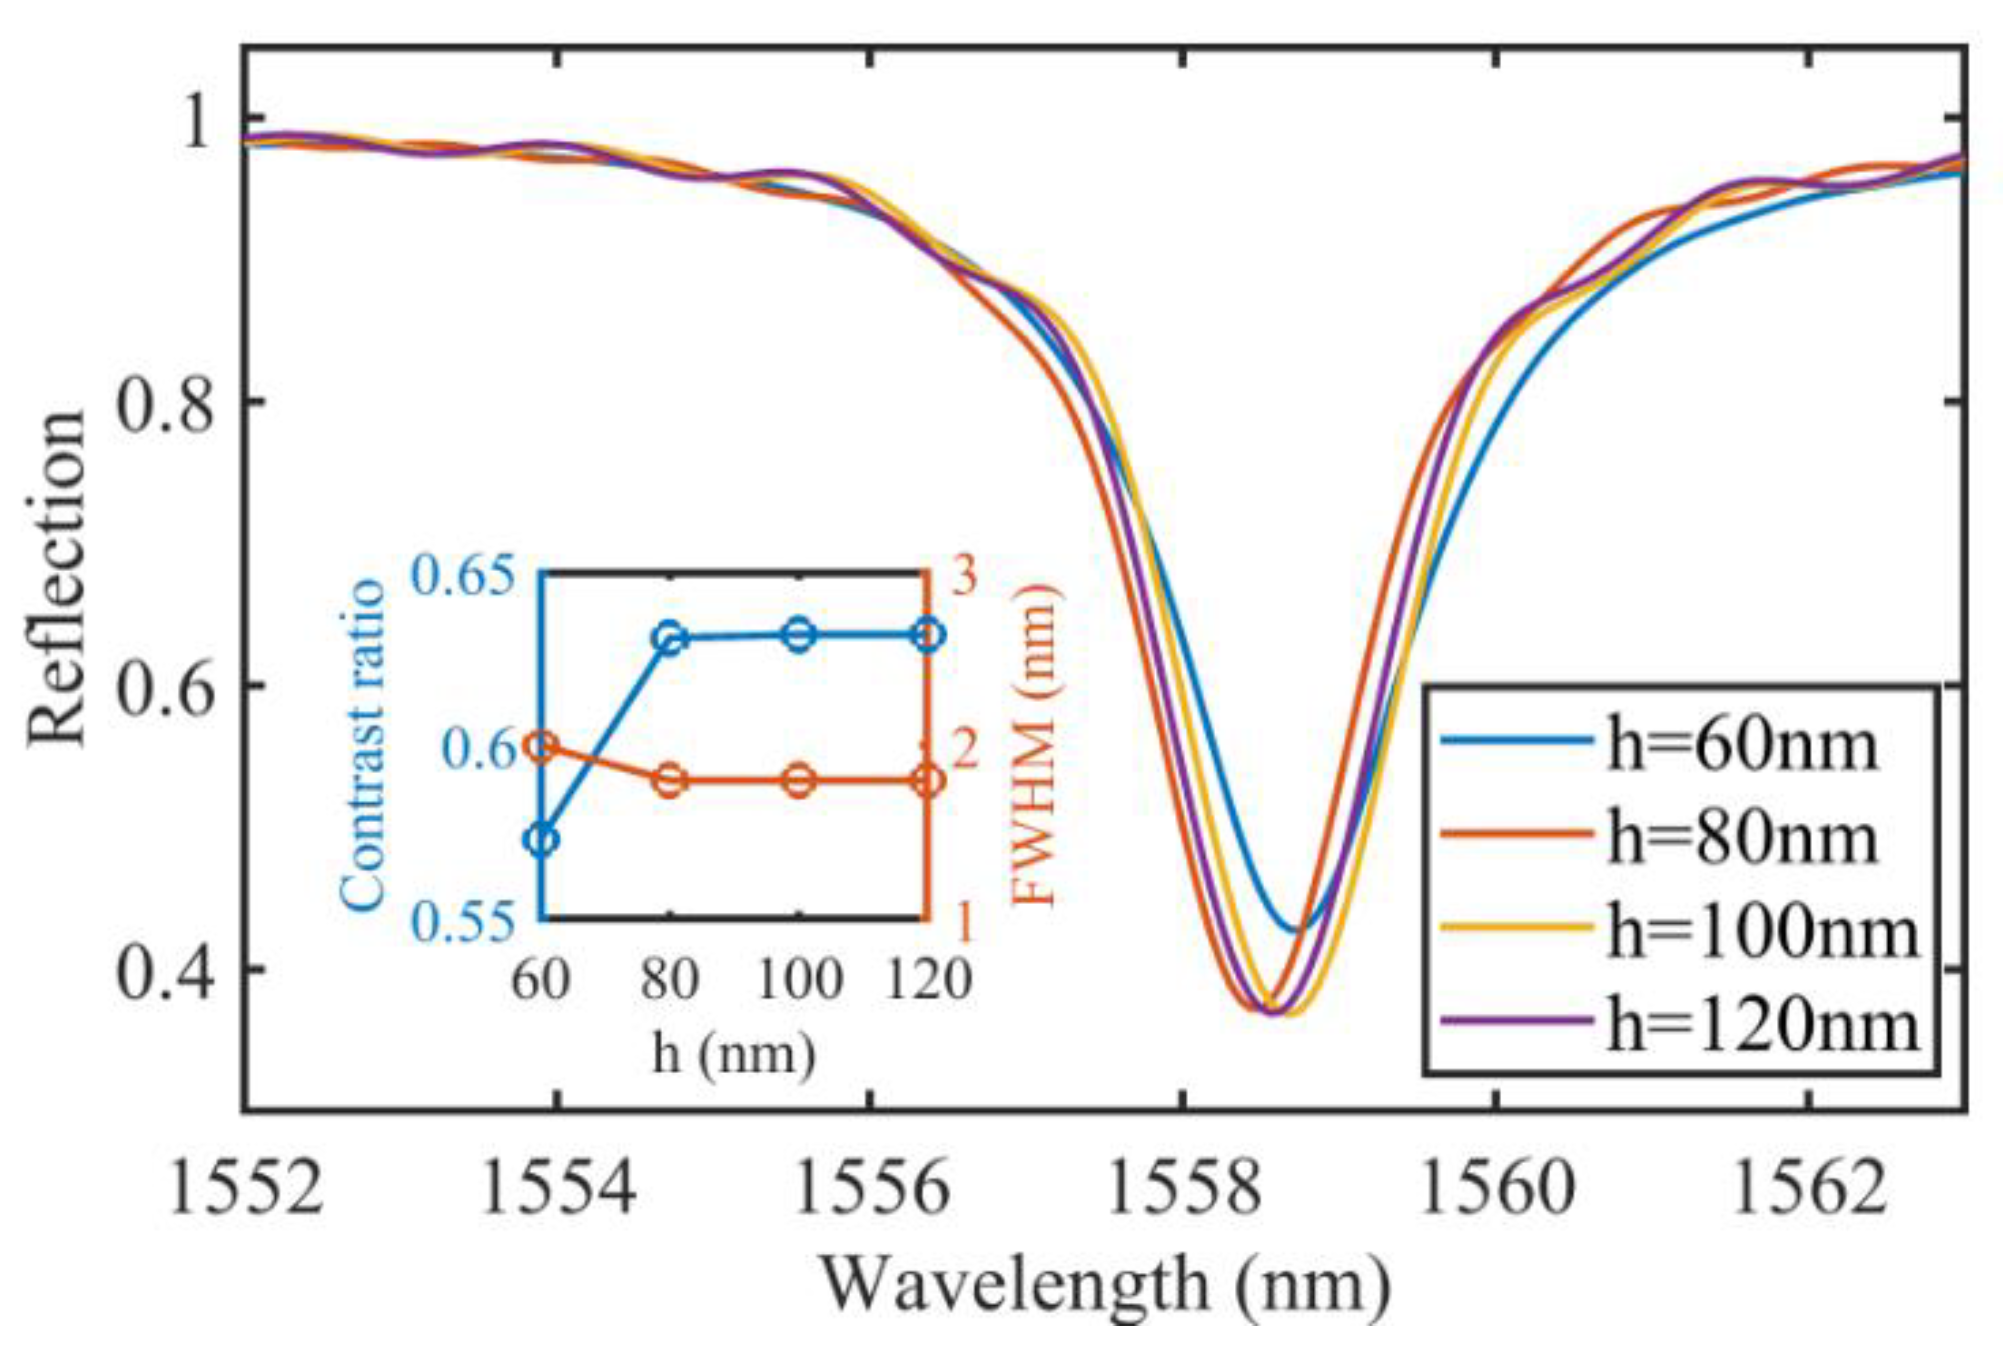
3.2. Performance Change with the Thickness of the Silver Layer

In our device, we choose silver to generate the plasmonic mode. Its thickness plays an important role in the device’s performance. It has been proved that when the metal layer is thinner, parts of the energy are radiated into the substrate, resulting in a larger radiation loss, which gradually stabilizes when the thickness of the metal layer approaches the skin depth of the metal [29]. We calculate the reflected spectra of the quasi-SP-BIC under different silver layer thicknesses in Figure 4. During the calculation, all other parameters are fixed (a = 1070 nm, w = 320 nm, d = 440 nm, n s = 1.33, θ = 2°). The thickness of the silver layer could slightly affect the position and the linewidth of the resonance. When the thickness changes from 60 nm to 120 nm with a step of 20 nm, the resonance wavelengths are 1558.64 nm, 1558.42 nm, 1558.56 nm, and 1558.47 nm, and the corresponding FWHM, shown in the inset of Figure 4, are 2 nm, 1.8 nm, 1.8 nm, and 1.8 nm. When the silver layer is thicker than 80 nm, the FWHM becomes stable, indicating no further substrate leakage occurs. In addition, the resonance CR stabilizes when the thickness is greater than 80 nm. Considering the FWHM and the resonance CR, a silver film with a thickness larger than 80 nm is preferred. We thus pick 100 nm as our silver thickness to provide a sufficient buffer for device implementation.

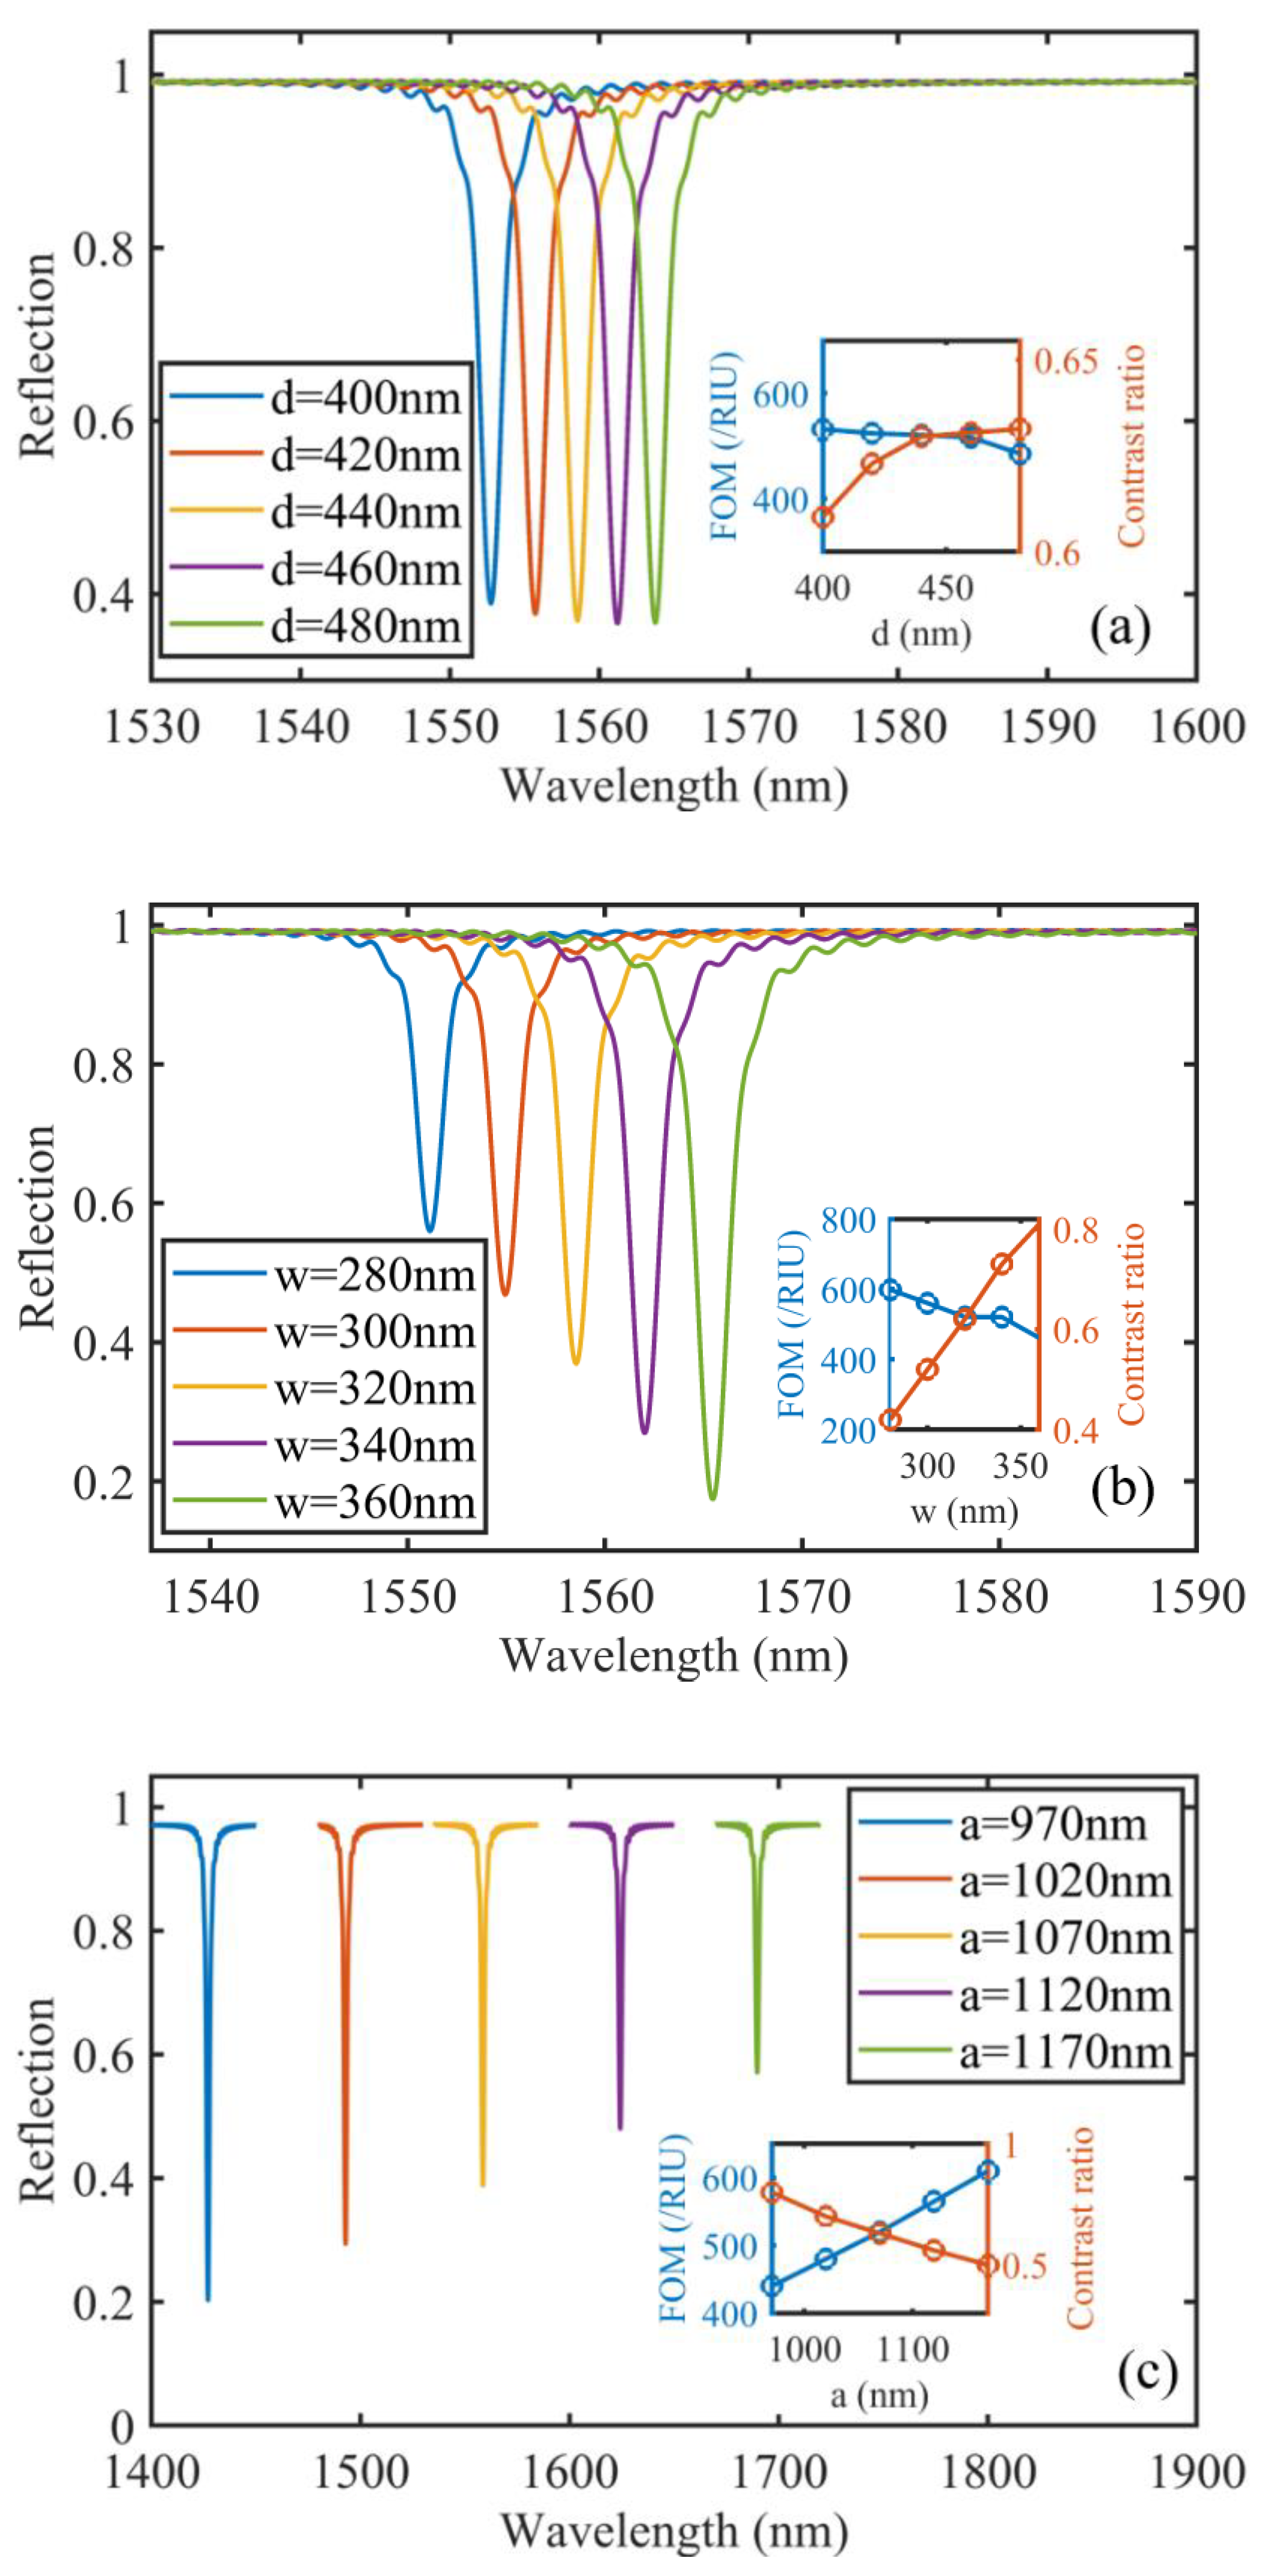
3.3. Performance Change with the Grating Variables

The AlN grating is also crucial for our device. There are multiple parameters in a grating, e.g., the grating height, width, and period, that would affect the device’s performance. In this section, we provide a detailed analysis of these parameters on the performance of the sensor. Note that in this section, the silver thickness is fixed at 100 nm.
First, we calculate the reflected spectra for different grating heights with fixed grating width (w = 320 nm), period (a = 1070 nm), and incident angle (θ = 2°). Figure 5a shows that when the grating height gradually thickens from 400 nm to 480 nm, the resonance moves to the longer wavelength without significant distortion of its shape. The corresponding FWHM of the resonant peak is around 1.8 nm during the parameter scanning. We also do refractive index sensitivity characterization, showing the sensitivity is within the range of 920 nm/RIU to 960 nm/RIU. Therefore, a thinner grating possesses a higher sensitivity and thus a higher FOM, as shown in the inset of Figure 5a. However, from Figure 5a, we observe a slight decrease in the resonance CR for the grating height is smaller than 440 nm. Considering the overall performance, we pick 440 nm as our grating height to provide a higher FOM without sacrificing the CR of the resonance. This also provides a reference for our future design.
Next, we plot the reflected spectra for different grating widths with fixed grating height (d = 440 nm), period (a = 1070 nm), and incident angle ( θ = 2°) in Figure 5b. We find a red-shifted and slightly broadened resonant peak as we widen the grating width, i.e., increasing the duty cycle. The FWHM increases from 1.6 nm for the 280 nm wide grating to 2 nm for the 360 nm wide one, while the sensing sensitivity monotonically drops from 958 nm/RIU for the 280 nm wide grating to 923 nm/RIU for the 360 nm wide grating. The corresponding FOM also monotonically drops from 598/RIU to 461/RIU, as shown in the inset of Figure 5b, indicating a better sensing performance for the grating with a lower duty cycle. However, the inset of Figure 5b also shows an increasing resonance CR for wider grating teeth. Therefore, by taking a trade-off, we pick 320 nm as the grating width.
We also simulated the reflected spectra for different grating periods (from 970 nm to 1170 nm with a 50 nm step) and kept all other parameters fixed (w = 320 nm, d = 440 nm, and θ = 2°). As shown in Figure 5c, when the period increases, the corresponding FWHM slightly drops from 1.9 nm to 1.7 nm, and the sensitivity increases from 826 nm/RIU to 1060 nm/RIU, providing a monotonically increasing FOM from 434/RIU to 623/RIU. In the meantime, we also notice a decreasing resonance CR as we increase the period. Therefore, we trade-off these factors and select the period a = 1070 nm for our design.

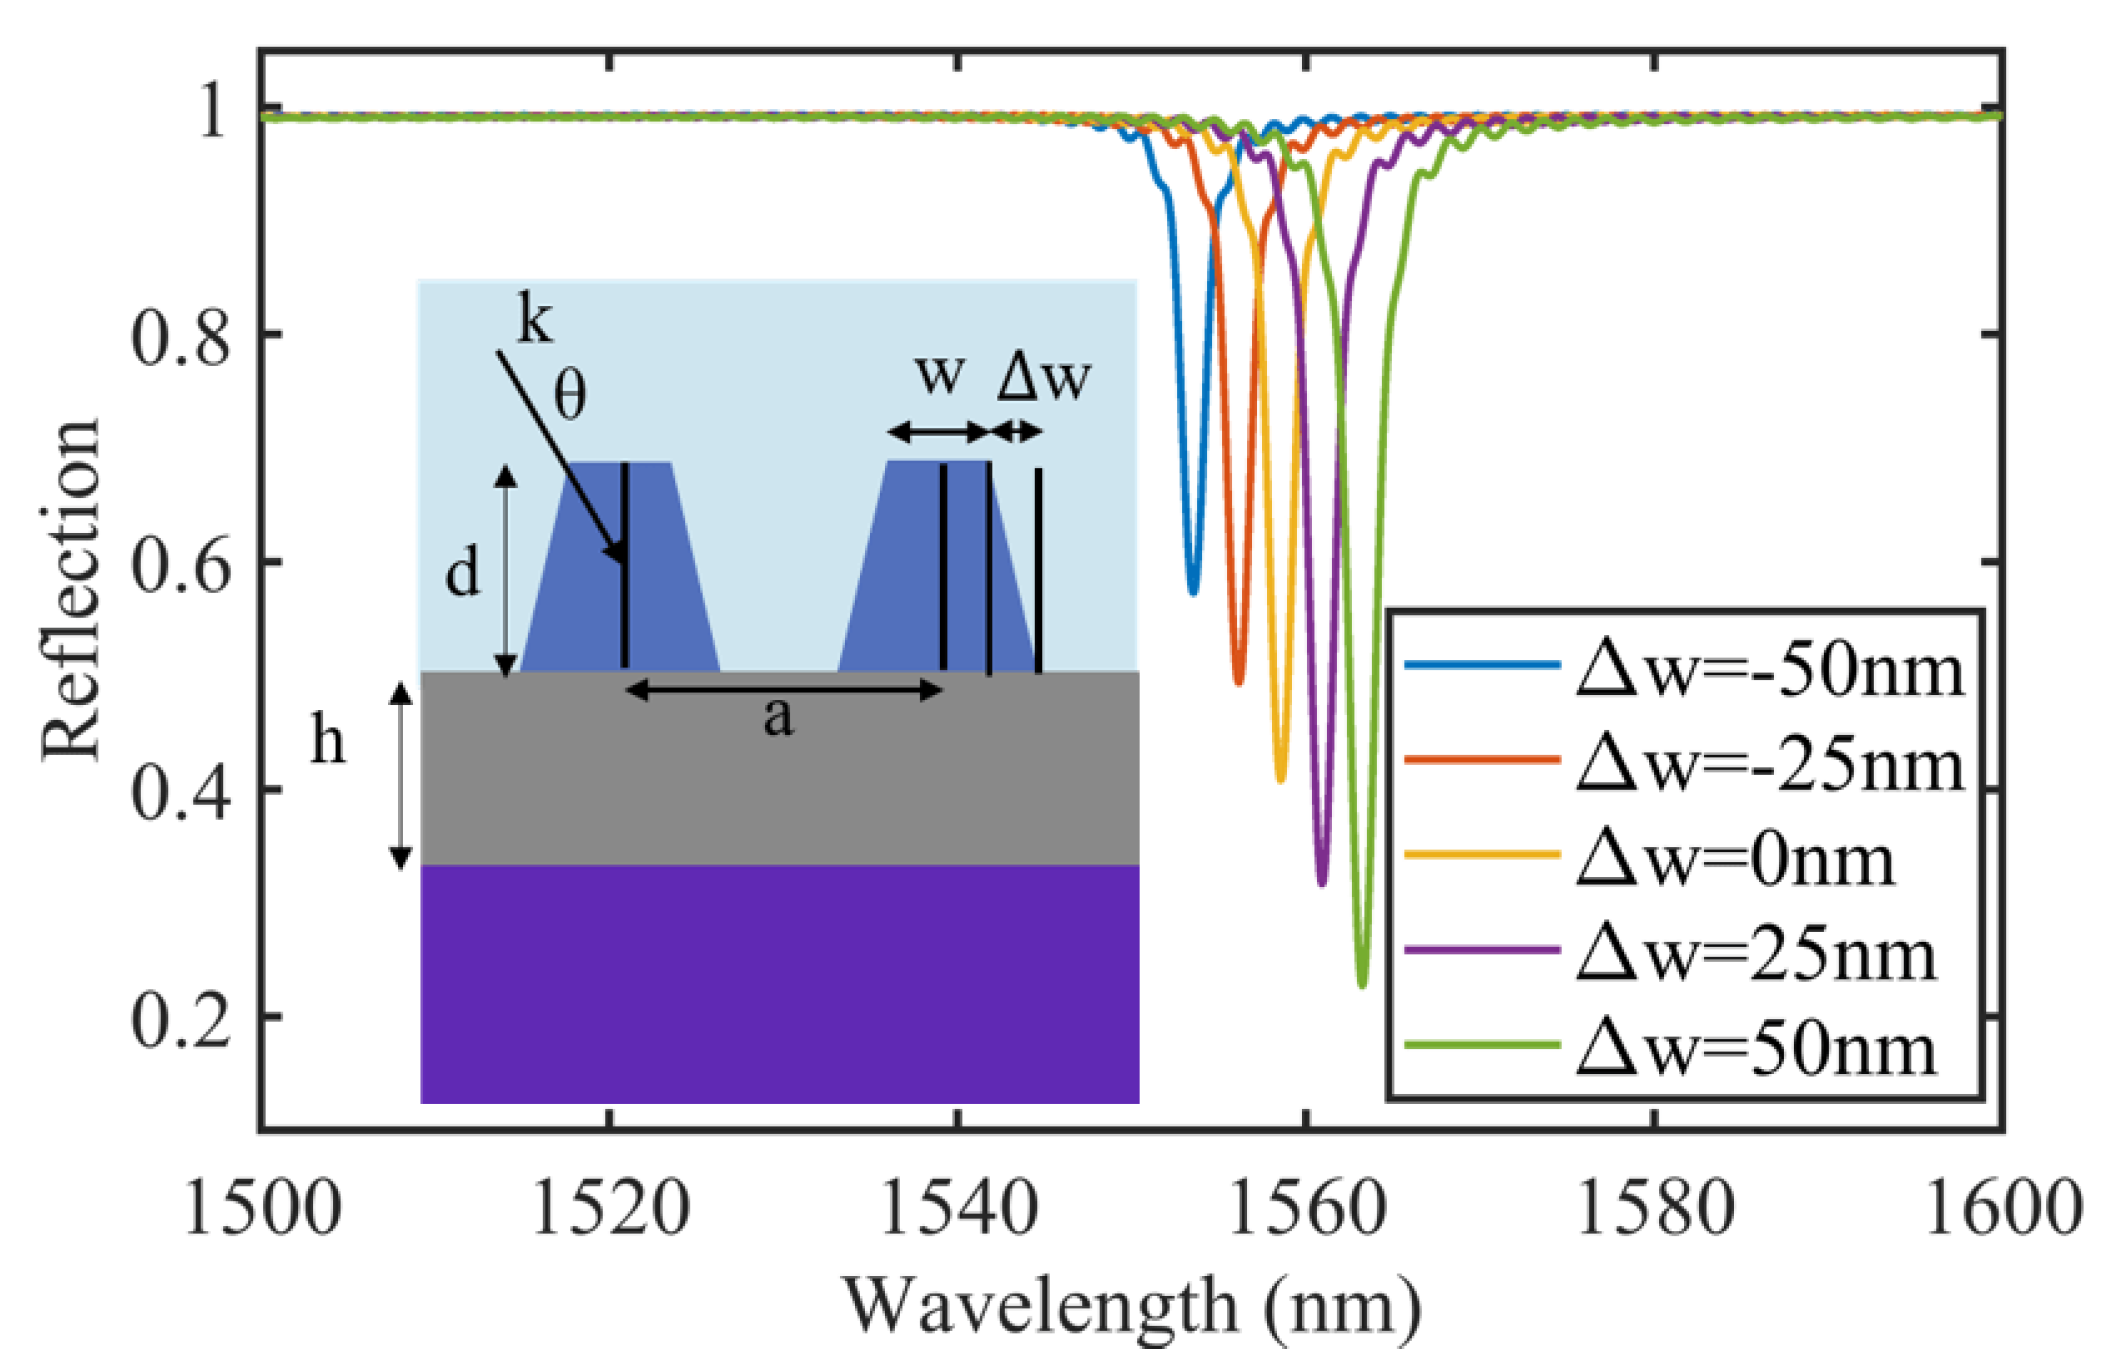
3.4. Performance Change with the Grating Shape Deviation

We also study the device tolerance by considering the fabrication-induced sidewall angle deviations. In reality, it is common to have a trapezoid cross-section similar to the inset of Figure 6. In this section, we fix all the parameters same as in Section 2, namely a = 1070 nm, d = 440 nm, w = 320 nm, h = 100 nm, θ = 2°, and n s = 1.33, and scan the ∆w from −50 nm to 50 nm with a step of 25 nm. We plot the reflected spectra for different values of ∆w in Figure 6. As ∆w increases from −50 nm to 50 nm, similar to widening the grating width, the resonance shifts to the longer wavelength, and the CR gradually increases. The corresponding sensitivity decreases from 945 nm/RIU to 924 nm/RIU. During the whole process, the FWHM does not vary too much. It is fair to say that the device shows a sufficient tolerance for certain fabrication-induced geometric errors.

4. Discussion

According to Equation (1), the resonance wavelength is proportional to the grating period. Further increasing the period may move the operating wavelength towards a longer wavelength. On the other hand, if we define the complex refractive index of silver as n m = n + i k , for a plasmonic device, the quality factor is [30]:
Q s p = k 3 2 n
A larger quality factor indicates a lower loss of a device. Take 1559 nm and 1905 nm as an example. Even though moving from 1559 nm to about 1905 nm increases the imaginary part of the complex refractive index, k , from 11.439 to 13.862, it also raises the real part, n, from 0.1453 to 0.23119. Therefore, the Q s p indeed increases from about 5150 to about 5760, implying a lower device loss when working at a longer wavelength. In the meantime, a resonance working at a longer wavelength shifts more than the one at a shorter wavelength.
We thus increase the period to shift the resonance peak of the quasi-SP-BIC from 1559 nm to a longer wavelength. Then, we optimize the device parameters as a = 1350 nm, w = 400 nm, d = 240 nm, and h = 100 nm. With incident angle θ = 2°, we apply glucose solution with different concentrations to the device, showing 1264 nm/RIU, corresponding to 0.14 nm/(g/L) for glucose solution, and 0.18 nm FWHM in Figure 7. The sensitivity is more than 30% higher than its counterpart at 1559 nm, while the FWHM is one order narrower than the 1559 nm one, leading to a much higher FOM of ~7022/RIU. We compare the performance of our devices with other recently reported plasmonic sensors in Table 2.
Table 2. Performance comparison.
Ref.Sensitivity (nm/RIU)FWHM (nm)FOM (/RIU)
Sharma et al. [31]461.5314.831.18
Lu et al. [32] 497.830.904551
Chau et al. [33] 12004526.67
Sun et al. [34]526.07.273.10
Li et al. [35]404.2958.0450.30
Sreekanth et al. [36]
He et al. [37]
30,000
815
50.8
360.6
590
2.26
This paper @1559 nm9381.8521
This paper @1905 nm12640.187022

5. Conclusions

In summary, we propose a grating-assisted plasmonic refractive index sensor. Combining the quasi-SP-BIC effect and the surface wave nature, our device features a small FWHM and high sensitivity, resulting in FOM of 521/RIU at 1559 nm and 7022/RIU at 1905 nm. We also do glucose solution sensing, showing a 0.1 nm/(g/L) sensitivity at 1559 nm and a 0.14 nm/(g/L) sensitivity at 1905 nm. The performance of the proposed scheme is significantly better than the other grating-based plasmonic sensors reported earlier. Our approach provides a feasible way for designing a high-performance sensor with narrow FWHM and high sensitivity.

Author Contributions

Conceptualization, S.T. and P.Z.; methodology, S.T.; software, S.T. and C.C.; validation, S.T.; formal analysis, S.T.; investigation, S.T.; resources, S.T. and Y.Z.; data curation, S.T.; writing—original draft preparation, S.T.; writing—review and editing, Y.Z.; visualization, S.T.; supervision, Y.Z.; project administration, Y.Z.; funding acquisition, Y.Z. All authors have read and agreed to the published version of the manuscript.

Funding

The research was sponsored by the National Natural Science Foundation of China (NSFC) (61705099) and the Natural Science Foundation of Shanghai (21ZR1443100).

Institutional Review Board Statement

Not applicable.

Informed Consent Statement

Not applicable.

Data Availability Statement

Not applicable.

Conflicts of Interest

The funders had no role in the design of the study; in the collection, analyses, or interpretation of data; in the writing of the manuscript; or in the decision to publish the results.

References

  1. Reather, H. Surface Plasmons on Smooth and Rough Surfaces and on Gratings. Springer Tracts Mod. Phys. 1988, 111, 345–398. [Google Scholar]
  2. Pandey, A.K.; Sharma, A.K.; Basu, R. Fluoride glass-based surface plasmon resonance sensor in infrared region: Performance evaluation. J. Phys. D Appl. Phys. 2017, 50, 185103. [Google Scholar] [CrossRef]
  3. Sharma, S.; Kumari, R.; Varshney, S.K.; Lahiri, B. Optical biosensing with electromagnetic nanostructures. Rev. Phys. 2020, 5, 100044. [Google Scholar] [CrossRef]
  4. Suido, Y.; Yamamoto, Y.; Thomas, G.; Ajiki, Y.; Kan, T. Extension of the measurable wavelength range for a near-infrared spectrometer using a plasmonic Au grating on a si substrate. Micromachines 2019, 10, 403. [Google Scholar] [CrossRef] [Green Version]
  5. Chen, W.; Kan, T.; Ajiki, Y.; Matsumoto, K.; Shimoyama, I. NIR spectrometer using a Schottky photodetector enhanced by grating-based SPR. Opt. Express 2016, 24, 25797–25804. [Google Scholar] [CrossRef]
  6. Dhawan, A.; Gerhold, M.D.; Muth, J.F. Plasmonic structures based on subwavelength apertures for chemical and biological sensing applications. IEEE Sens. J. 2008, 8, 942–950. [Google Scholar] [CrossRef]
  7. Fore, S.; Yuen, Y.; Hesselink, L.; Huser, T. Pulsed-interleaved excitation FRET measurements on single duplex DNA molecules inside C-shaped nanoapertures. Nano Lett. 2007, 7, 1749–1756. [Google Scholar] [CrossRef]
  8. Zaman, M.A.; Padhy, P.; Hesselink, L. Solenoidal optical forces from a plasmonic Archimedean spiral. Phys. Rev. A 2019, 100, 013857. [Google Scholar] [CrossRef]
  9. Palermo, G.; Sreekanth, K.V.; Maccaferri, N.; Lio, G.E.; Nicoletta, G.; De Angelis, F.; Hinczewski, M.; Strangi, G. Hyperbolic dispersion metasurfaces for molecular biosensing. Nanophotonics 2021, 10, 295–314. [Google Scholar] [CrossRef]
  10. Ferraro, A.; Lio, G.E.; Hmina, A.; Palermo, G.; Djouda, J.M.; Maurer, T.; Caputo, R. Tailoring of plasmonic functionalized metastructures to enhance local heating release. Nanophotonics 2021, 10, 3907–3916. [Google Scholar] [CrossRef]
  11. Von Neumann, J.; Wigner, E. On some peculiar discrete eigenvalues. Phys. Z. 1929, 30, 465–467. [Google Scholar]
  12. Plotnik, Y.; Peleg, O.; Dreisow, F.; Heinrich, M.; Nolte, S.; Szameit, A.; Segev, M. Experimental observation of optical bound states in the continuum. Phys. Rev. Lett. 2011, 107, 183901. [Google Scholar] [CrossRef] [PubMed] [Green Version]
  13. Fan, K.; Shadrivov, I.V.; Padilla, W.J. Dynamic bound states in the continuum. Optica 2019, 6, 169–173. [Google Scholar] [CrossRef]
  14. Hsu, C.W.; Zhen, B.; Stone, A.D.; Joannopoulos, J.D.; Soljačić, M. Bound states in the continuum. Nat. Rev. Mater. 2016, 1, 1–13. [Google Scholar] [CrossRef] [Green Version]
  15. Molina, M.I.; Miroshnichenko, A.E.; Kivshar, Y.S. Surface bound states in the continuum. Phys. Rev. Lett. 2012, 108, 070401. [Google Scholar] [CrossRef] [Green Version]
  16. Song, Y.; Jiang, N.; Liu, L.; Hu, X.; Zi, J. Cherenkov radiation from photonic bound states in the continuum: Towards compact free-electron lasers. Phys. Rev. Appl. 2018, 10, 064026. [Google Scholar] [CrossRef]
  17. Kodigala, A.; Lepetit, T.; Gu, Q.; Bahari, B.; Fainman, Y.; Kanté, B. Lasing action from photonic bound states in continuum. Nature 2017, 541, 196–199. [Google Scholar] [CrossRef]
  18. Zhang, H.; Wang, T.; Tian, J.; Sun, J.; Li, S.; De Leon, I.; Zaccaria, R.P.; Peng, L.; Gao, F.; Lin, X. Quasi-BIC laser enabled by high-contrast grating resonator for gas detection. Nanophotonics 2021, 11, 297–304. [Google Scholar] [CrossRef]
  19. Hwang, M.-S.; Lee, H.-C.; Kim, K.-H.; Jeong, K.-Y.; Kwon, S.-H.; Koshelev, K.; Kivshar, Y.; Park, H.-G. Ultralow-threshold laser using super-bound states in the continuum. Nat. Commun. 2021, 12, 4135. [Google Scholar] [CrossRef]
  20. Romano, S.; Lamberti, A.; Masullo, M.; Penzo, E.; Cabrini, S.; Rendina, I.; Mocella, V. Optical biosensors based on photonic crystals supporting bound states in the continuum. Materials 2018, 11, 526. [Google Scholar] [CrossRef] [Green Version]
  21. Romano, S.; Zito, G.; Torino, S.; Calafiore, G.; Penzo, E.; Coppola, G.; Cabrini, S.; Rendina, I.; Mocella, V. Label-free sensing of ultralow-weight molecules with all-dielectric metasurfaces supporting bound states in the continuum. Photonics Res. 2018, 6, 726–733. [Google Scholar] [CrossRef]
  22. Li, Z.; Xiang, Y.; Xu, S.; Dai, X. Ultrasensitive terahertz sensing in all-dielectric asymmetric metasurfaces based on quasi-BIC. JOSA B 2022, 39, 286–291. [Google Scholar] [CrossRef]
  23. Azzam, S.I.; Shalaev, V.M.; Boltasseva, A.; Kildishev, A.V. Formation of bound states in the continuum in hybrid plasmonic-photonic systems. Phys. Rev. Lett. 2018, 121, 253901. [Google Scholar] [CrossRef] [PubMed] [Green Version]
  24. Cao, J.; Sun, Y.; Kong, Y.; Qian, W. The sensitivity of grating-based SPR sensors with wavelength interrogation. Sensors 2019, 19, 405. [Google Scholar] [CrossRef] [PubMed] [Green Version]
  25. West, P.R.; Ishii, S.; Naik, G.V.; Emani, N.K.; Shalaev, V.M.; Boltasseva, A. Searching for better plasmonic materials. Laser Photonics Rev. 2010, 4, 795–808. [Google Scholar] [CrossRef] [Green Version]
  26. Johnson, P.B.; Christy, R.-W. Optical constants of the noble metals. Phys. Rev. B 1972, 6, 4370. [Google Scholar] [CrossRef]
  27. Pastrňák, J.; Roskovcová, L. Refraction index measurements on AlN single crystals. Phys. Status Solidi B 1966, 14, K5–K8. [Google Scholar] [CrossRef]
  28. Yeh, Y.-L. Real-time measurement of glucose concentration and average refractive index using a laser interferometer. Opt. Lasers Eng. 2008, 46, 666–670. [Google Scholar] [CrossRef]
  29. Iqbal, T.; Khalil, S.; Ijaz, M.; Riaz, K.N.; Khan, M.I.; Shakil, M.; Nabi, A.G.; Javaid, M.; Abrar, M.; Afsheen, S. Optimization of 1D plasmonic grating of nanostructured devices for the investigation of plasmonic bandgap. Plasmonics 2019, 14, 775–783. [Google Scholar] [CrossRef]
  30. Blaber, M.G.; Arnold, M.D.; Ford, M.J. A review of the optical properties of alloys and intermetallics for plasmonics. J. Phys. Condens. Matter 2010, 22, 143201. [Google Scholar] [CrossRef]
  31. Sharma, A.K.; Pandey, A.K. Metal oxide grating based plasmonic refractive index sensor with Si layer in optical communication band. IEEE Sens. J. 2019, 20, 1275–1282. [Google Scholar] [CrossRef]
  32. Lu, X.; Zheng, G.; Zhou, P. High performance refractive index sensor with stacked two-layer resonant waveguide gratings. Results Phys. 2019, 12, 759–765. [Google Scholar] [CrossRef]
  33. Chou Chau, Y.-F.; Chou Chao, C.-T.; Huang, H.J.; Kooh, M.R.R.; Kumara, N.; Lim, C.M.; Chiang, H.-P. Perfect dual-band absorber based on plasmonic effect with the cross-hair/nanorod combination. Nanomaterials 2020, 10, 493. [Google Scholar] [CrossRef] [PubMed] [Green Version]
  34. Sun, P.; Zhou, C.; Jia, W.; Wang, J.; Xiang, C.; Xie, Y.; Zhao, D. Narrowband absorber based on magnetic dipole resonances in two-dimensional metal–dielectric grating for sensing. Opt. Commun. 2020, 459, 124946. [Google Scholar] [CrossRef]
  35. Li, Y.; Liu, Y.; Liu, Z.; Tang, Q.; Shi, L.; Chen, Q.; Du, G.; Wu, B.; Liu, G.; Li, L. Grating-assisted ultra-narrow multispectral plasmonic resonances for sensing application. Appl. Phys. Express 2019, 12, 072002. [Google Scholar] [CrossRef]
  36. Sreekanth, K.V.; Alapan, Y.; ElKabbash, M.; Ilker, E.; Hinczewski, M.; Gurkan, U.A.; De Luca, A.; Strangi, G. Extreme sensitivity biosensing platform based on hyperbolic metamaterials. Nat. Mater. 2016, 15, 621–627. [Google Scholar] [CrossRef] [Green Version]
  37. He, W.; Feng, Y.; Hu, Z.-D.; Balmakou, A.; Khakhomov, S.; Deng, Q.; Wang, J. Sensors with multifold nanorod metasurfaces array based on hyperbolic metamaterials. IEEE Sens. J. 2019, 20, 1801–1806. [Google Scholar] [CrossRef]
Figure 1. (a) Schematic of the proposed device, consisting of one-dimensional aluminum nitride (AlN) grating on Ag-SiO2 substrate. (b) Cross-section of the device. Here, the width and height of the grating are w = 320 nm and d = 440 nm, respectively, the period is a = 1070 nm, and the thickness of the silver film is h = 100 nm.
Photonics 09 00224 g001
Figure 2. (a) The reflected spectra for different incident angles. A discontinuity is observed at the center of the red circle, indicating the existence of an SP-BIC. (b) The reflection spectrum when the incident angles are 0° and 2°, respectively. The insets show the magnetic field distribution for the corresponding resonances circled by the red and blue lines in Figure 2a. (c) The reflection spectral for different incident angles. The inset shows the value of the CR/FWHM for different incident angles.
Photonics 09 00224 g002
Figure 3. (a) The reflected spectra for different surrounding mediums. (b) The resonance wavelengths shift as a function of the surrounding index variation. The linear fittings show 833 nm/RIU and 938 nm/RIU for Mode1 and Mode2, respectively. (c) The reflected spectra for different concentrations of the glucose solution. The inset shows the resonance wavelength shifts with the glucose solution concentration variation.
Photonics 09 00224 g003
Figure 4. The reflected spectra for different thicknesses of the silver layer. The inset shows the resonance CR and the FWHM change with the silver layer thickness.
Photonics 09 00224 g004
Figure 5. The reflected spectra for the grating with (a) different heights, (b) different widths, and (c) different grating periods. Insets show the corresponding FOM and the resonance CR versus the grating (a) height, (b) width, and (c) period.
Photonics 09 00224 g005
Figure 6. The reflected spectra for different ∆w. The inset shows the cross-section of the device.
Photonics 09 00224 g006
Figure 7. (a) The reflected spectra for different concentrations of the glucose solution. The inset shows resonance wavelength shifts with the glucose solution concentration variation. (b) The resonance wavelengths shift with the glucose solution concentration change-induced surrounding index variation. The linear fitting shows 1264 nm/RIU.
Photonics 09 00224 g007
Table 1. Value of the Geometric Parameter Shown in Figure 1b.
w (nm)d (nm)a (nm)h (nm)Incident Angle
(deg)
32044010701002
Publisher’s Note: MDPI stays neutral with regard to jurisdictional claims in published maps and institutional affiliations.

