Changes in Optical Properties of Model Cholangiocarcinoma after Plasmon-Resonant Photothermal Treatment

 ,
,  , , and
Abstract
:1. Introduction
2. Materials and Methods
3. Results
4. Discussion
5. Conclusions
Author Contributions
Funding
Institutional Review Board Statement
Informed Consent Statement
Data Availability Statement
Conflicts of Interest
References
- World Health Organization. Available online: https://www.who.int/health-topics/cancer (accessed on 20 January 2022).
- Bucharskaya, A.B.; Maslyakova, G.N.; Afanasyeva, G.A.; Terentyuk, G.S.; Navolokin, N.A.; Zlobina, O.V.; Chumakov, D.S.; Bashkatov, A.N.; Genina, E.A.; Khlebtsov, N.G.; et al. The morpho-functional assessment of plasmonic photothermal therapy effects on transplanted liver tumor. J. Innov. Opt. Health Sci. 2015, 8, 1541004. [Google Scholar] [CrossRef]
- Abadeer, N.S.; Murphy, C.J. Recent progress in cancer thermal therapy using gold nanoparticles. J. Phys. Chem. 2016, 120, 4691–4716. [Google Scholar] [CrossRef]
- Zhang, Y.; Zhan, X.; Xiong, J.; Peng, S.; Huang, W.; Joshi, R.; Cai, Y.; Liu, Y.; Li, R.; Yuan, K.; et al. Temperature-Dependent cell death patterns induced by functionalized gold nanoparticle photothermal therapy in melanoma cells. Sci. Rep. 2018, 8, 8720. [Google Scholar] [CrossRef] [PubMed] [Green Version]
- Dykman, L.A.; Khlebtsov, N.G. Gold Nanoparticles in Biomedical Applications; Taylor & Francis Group, LLC: New York, NY, USA, 2018; 352p. [Google Scholar] [CrossRef]
- Pattani, V.P.; Tunnell, J.W. Nanoparticle-mediated photothermal therapy: A comparative study of heating for different particle types. Lasers Surg. Med. 2012, 44, 675–684. [Google Scholar] [CrossRef] [PubMed] [Green Version]
- Ungureanu, C.; Kroes, R.; Petersen, W.; Groothuis, T.A.; Ungureanu, F.; Janssen, H.; van Leeuwen, F.W.; Kooyman, R.P.; Manohar, S.; van Leeuwen, T.G. Light interactions with gold nanorods and cells: Implications for photothermal nanotherapeutics. Nano Lett. 2011, 11, 1887–1894. [Google Scholar] [CrossRef] [PubMed]
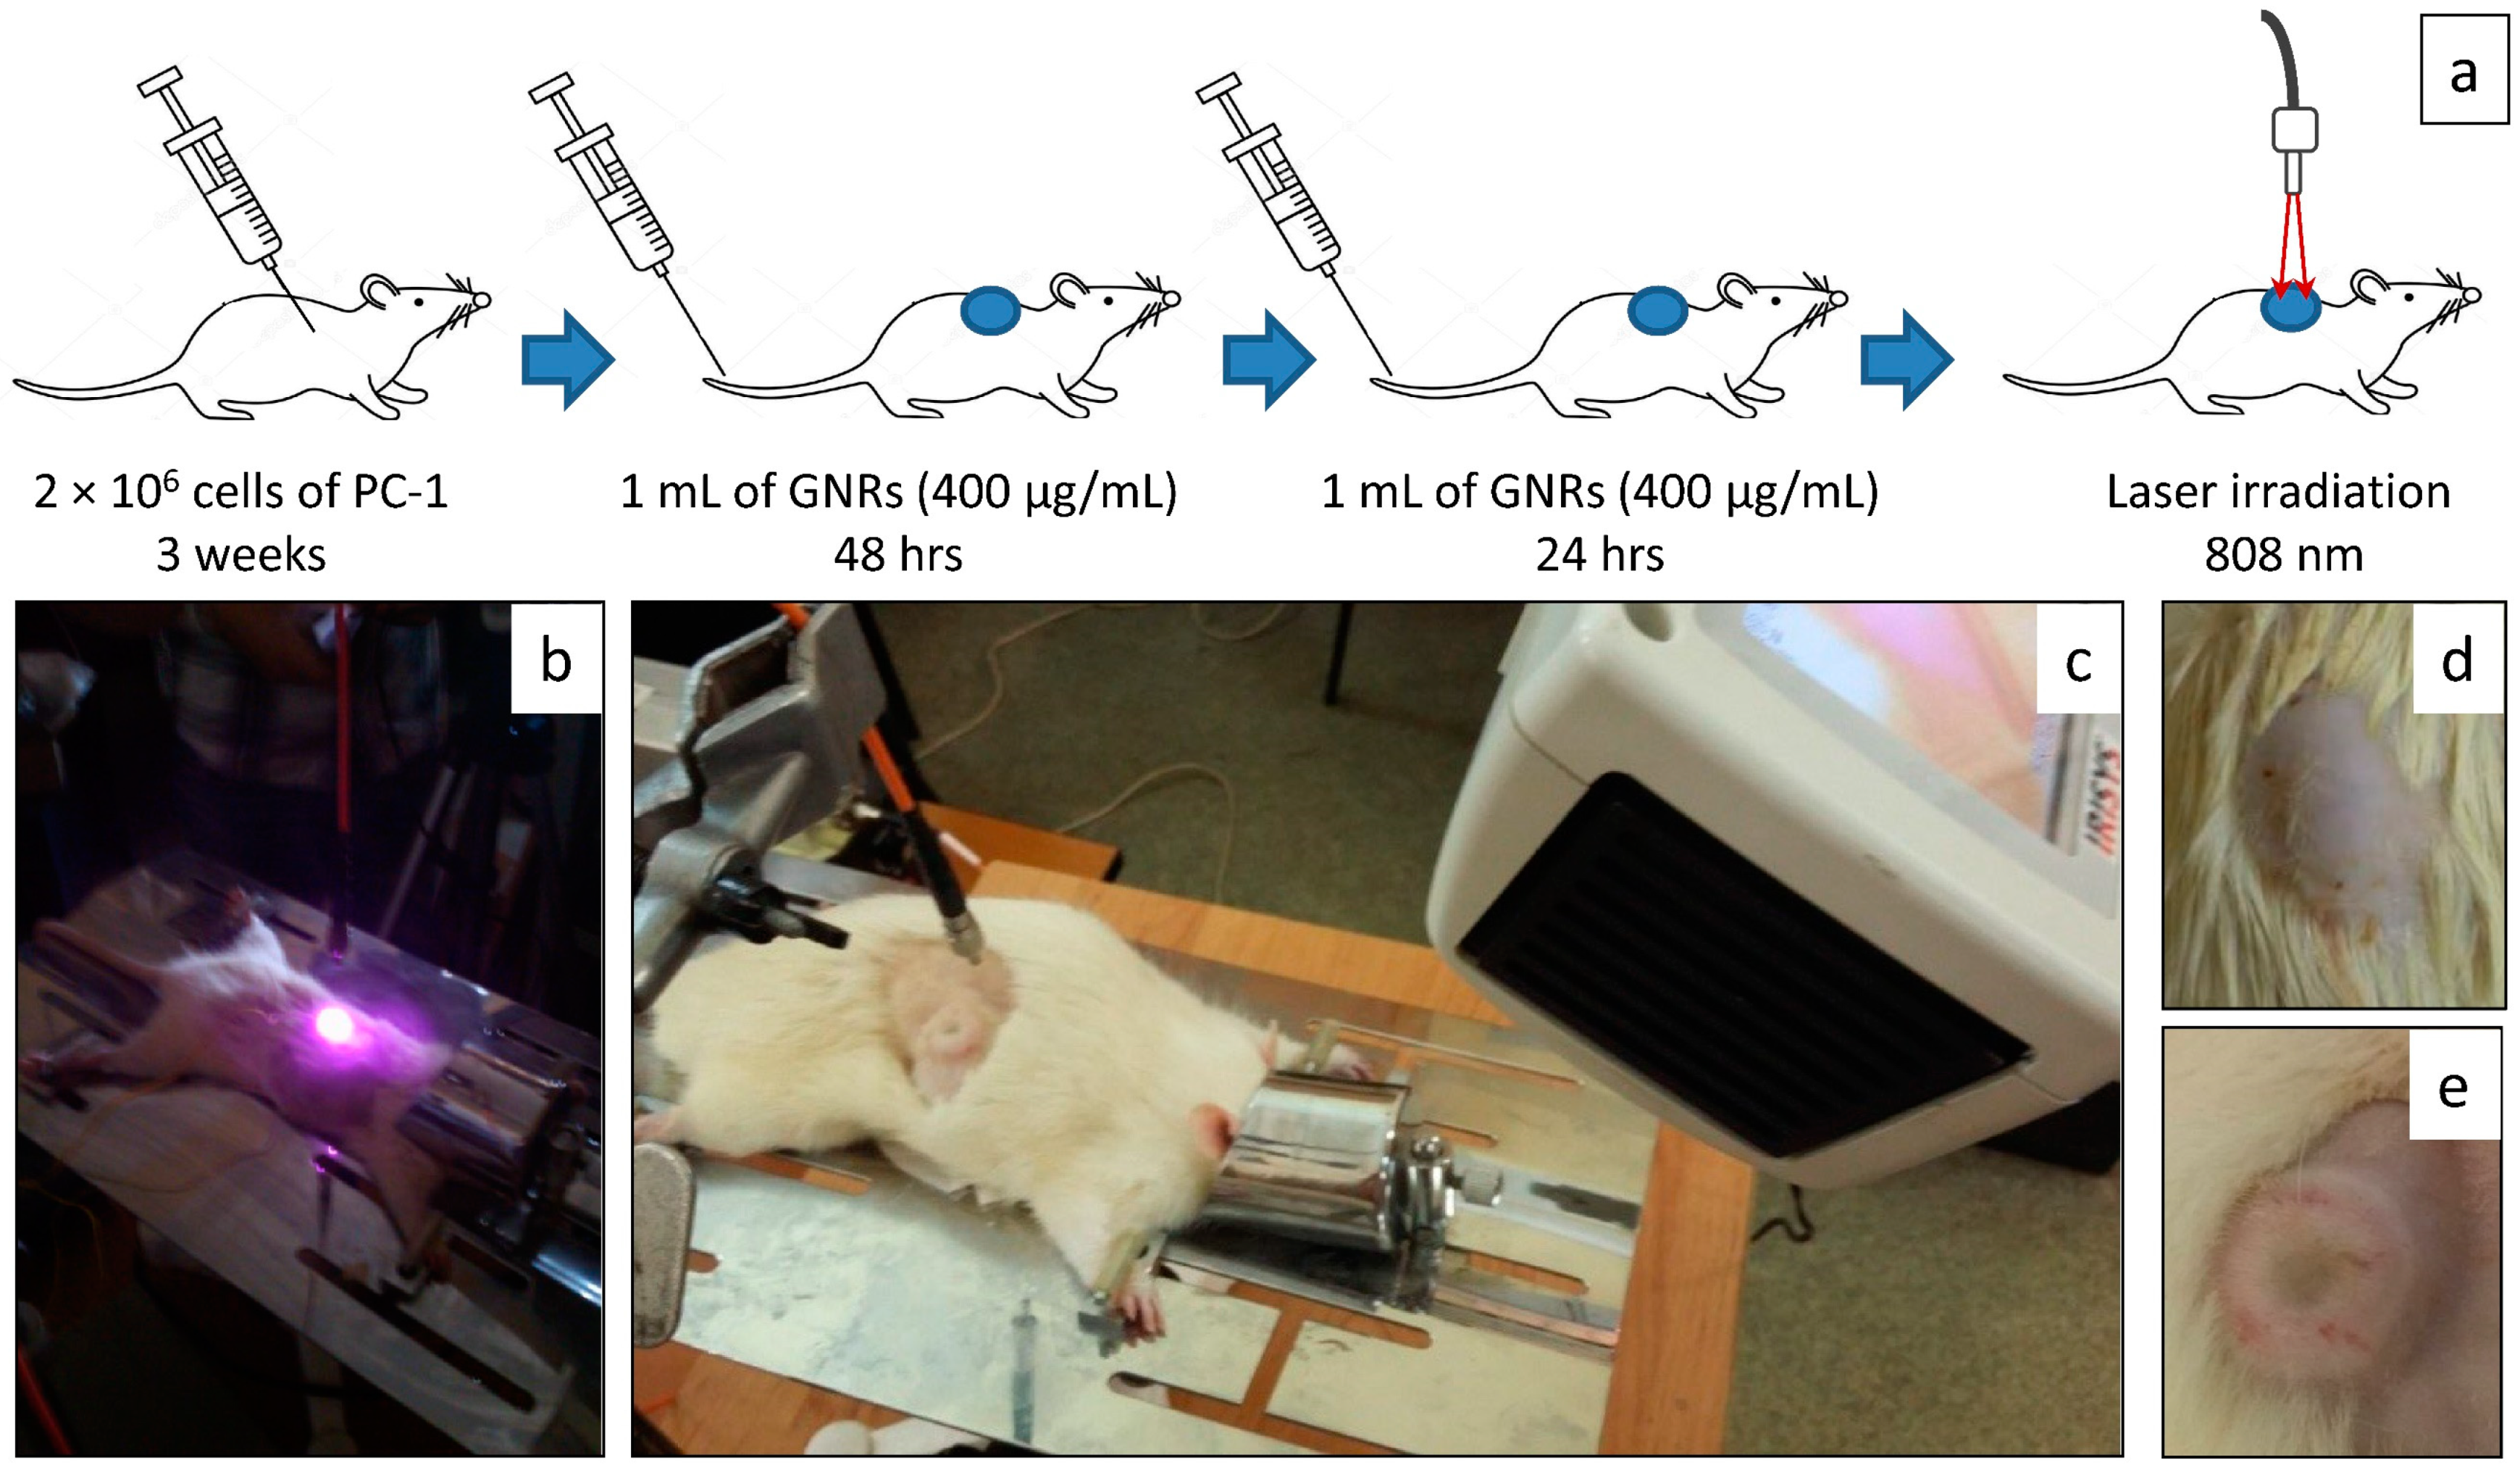
- Bucharskaya, A.B.; Maslyakova, G.N.; Dikht, N.I.; Navolokin, N.A.; Terentyuk, G.S.; Bashkatov, A.N.; Genina, E.A.; Khlebtsov, B.N.; Khlebtsov, N.G.; Tuchin, V.V. Plasmonic photothermal therapy of transplanted tumors in rats at multiple intravenous injection of gold nanorod. BioNanoScience 2017, 7, 216–221. [Google Scholar] [CrossRef]
- Khlebtsov, B.N.; Khanadeev, V.A.; Burov, A.M.; Le Ru, E.C.; Khlebtsov, N.G. Reexamination of Surface-Enhanced Raman Scattering from Gold Nanorods as a Function of Aspect Ratio and Shape. J. Phys. Chem. C 2020, 124, 10647–10658. [Google Scholar] [CrossRef]
- Puvanakrishnan, P.; Park, J.; Chatterjee, D.; Krishnan, S.; Tunnell, J.W. In vivo tumor targeting of gold nanoparticles: Effect of particle type and dosing strategy. Int. J. Nanomed. 2012, 7, 1251–1258. [Google Scholar] [CrossRef] [PubMed] [Green Version]
- Wang, J.; Bai, R.; Yang, R.; Liu, J.; Tang, J.; Liu, Y.; Li, J.; Chai, Z.; Chen, C. Size- and surface chemistry dependent pharmacokinetics and tumor accumulation of engineered gold nanoparticles after intravenous administration. Metallomics 2015, 7, 516–524. [Google Scholar] [CrossRef] [PubMed]
- Bucharskaya, A.B.; Maslyakova, G.N.; Chekhonatskaya, M.L.; Terentyuk, G.S.; Navolokin, N.A.; Khlebtsov, B.N.; Khlebtsov, N.G.; Bashkatov, A.N.; Genina, E.A.; Tuchin, V.V. Plasmonic photothermal therapy: Approaches to advanced strategy. Lasers Surg. Med. 2018, 50, 1025–1033. [Google Scholar] [CrossRef]
- Missios, S.; Schroeder, J.; Barnett, G.; Mohammadi, A.M. Prognostic factors of overall survival after laser interstitial thermal therapy in patients with glioblastoma. Photonics Lasers Med. 2014, 3, 143–150. [Google Scholar] [CrossRef]
- Johansson, A.; Faber, F.; Kniebühler, G.; Stepp, H.; Sroka, R.; Egensperger, R.; Beyer, W.; Kreth, F.W. Protoporphyrin IX fluorescence and photobleaching during interstitial photodynamic therapy of malignant gliomas for early treatment prognosis. Lasers Surg. Med. 2013, 45, 225–234. [Google Scholar] [CrossRef] [PubMed]
- Bashkatov, A.N.; Zakharov, V.P.; Bucharskaya, A.B.; Borisova, E.G.; Khristoforova, Y.A.; Genina, E.A.; Tuchin, V.V. Malignant Tissue Optical Properties. In Multimodal Optical Diagnostics of Cancer; Tuchin, V.V., Popp, J., Zakharov, V., Eds.; Springer Nature: Cham, Switzerland, 2020; pp. 3–106. [Google Scholar] [CrossRef]
- Yanina, I.Y.; Tanikawa, Y.; Tuchina, D.K.; Dyachenko, P.A.; Iga, Y.; Takimoto, S.; Genina, E.A.; Bashkatov, A.N.; Terentuk, G.S.; Navolokin, N.A.; et al. Optical Clearing of Adipose Tissue. In Handbook of Tissue Optical Clearing: New Prospects in Optical Imaging; Tuchin, V.V., Zhu, D., Genina, E.A., Eds.; CRC Press, Taylor & Francis Group: Boca Raton, FL, USA, 2020; pp. 383–392, accepted. [Google Scholar] [CrossRef]
- Yu, T.; Qi, Y.; Zhu, J.; Xu, J.; Gong, H.; Luo, Q.; Zhu, D. Elevated-Temperature-Induced acceleration of PACT clearing process of mouse brain tissue. Sci. Rep. 2017, 7, 38848. [Google Scholar] [CrossRef] [PubMed] [Green Version]
- Iorizzo, T.W.; Jermain, P.R.; Salomatina, E.; Muzikansky, A.; Yaroslavsky, A.N. Temperature induced changes in the optical properties of skin in vivo. Sci. Rep. 2021, 11, 754. [Google Scholar] [CrossRef] [PubMed]
- Skinner, M.G.; Everts, S.; Reid, A.D.; Vitkin, I.A.; Lilge, L.; Sherar, M.D. Changes in optical properties of ex vivo rat prostate due to heating. Phys. Med. Biol. 2000, 45, 1375–1386. [Google Scholar] [CrossRef] [PubMed]
- Nagarajan, V.K.; Gogineni, V.R.; White, S.B.; Yu, B. Real time evaluation of tissue optical properties during thermal ablation of ex vivo liver tissues. Int. J. Hyperther. 2019, 35, 176–182. [Google Scholar] [CrossRef] [PubMed] [Green Version]
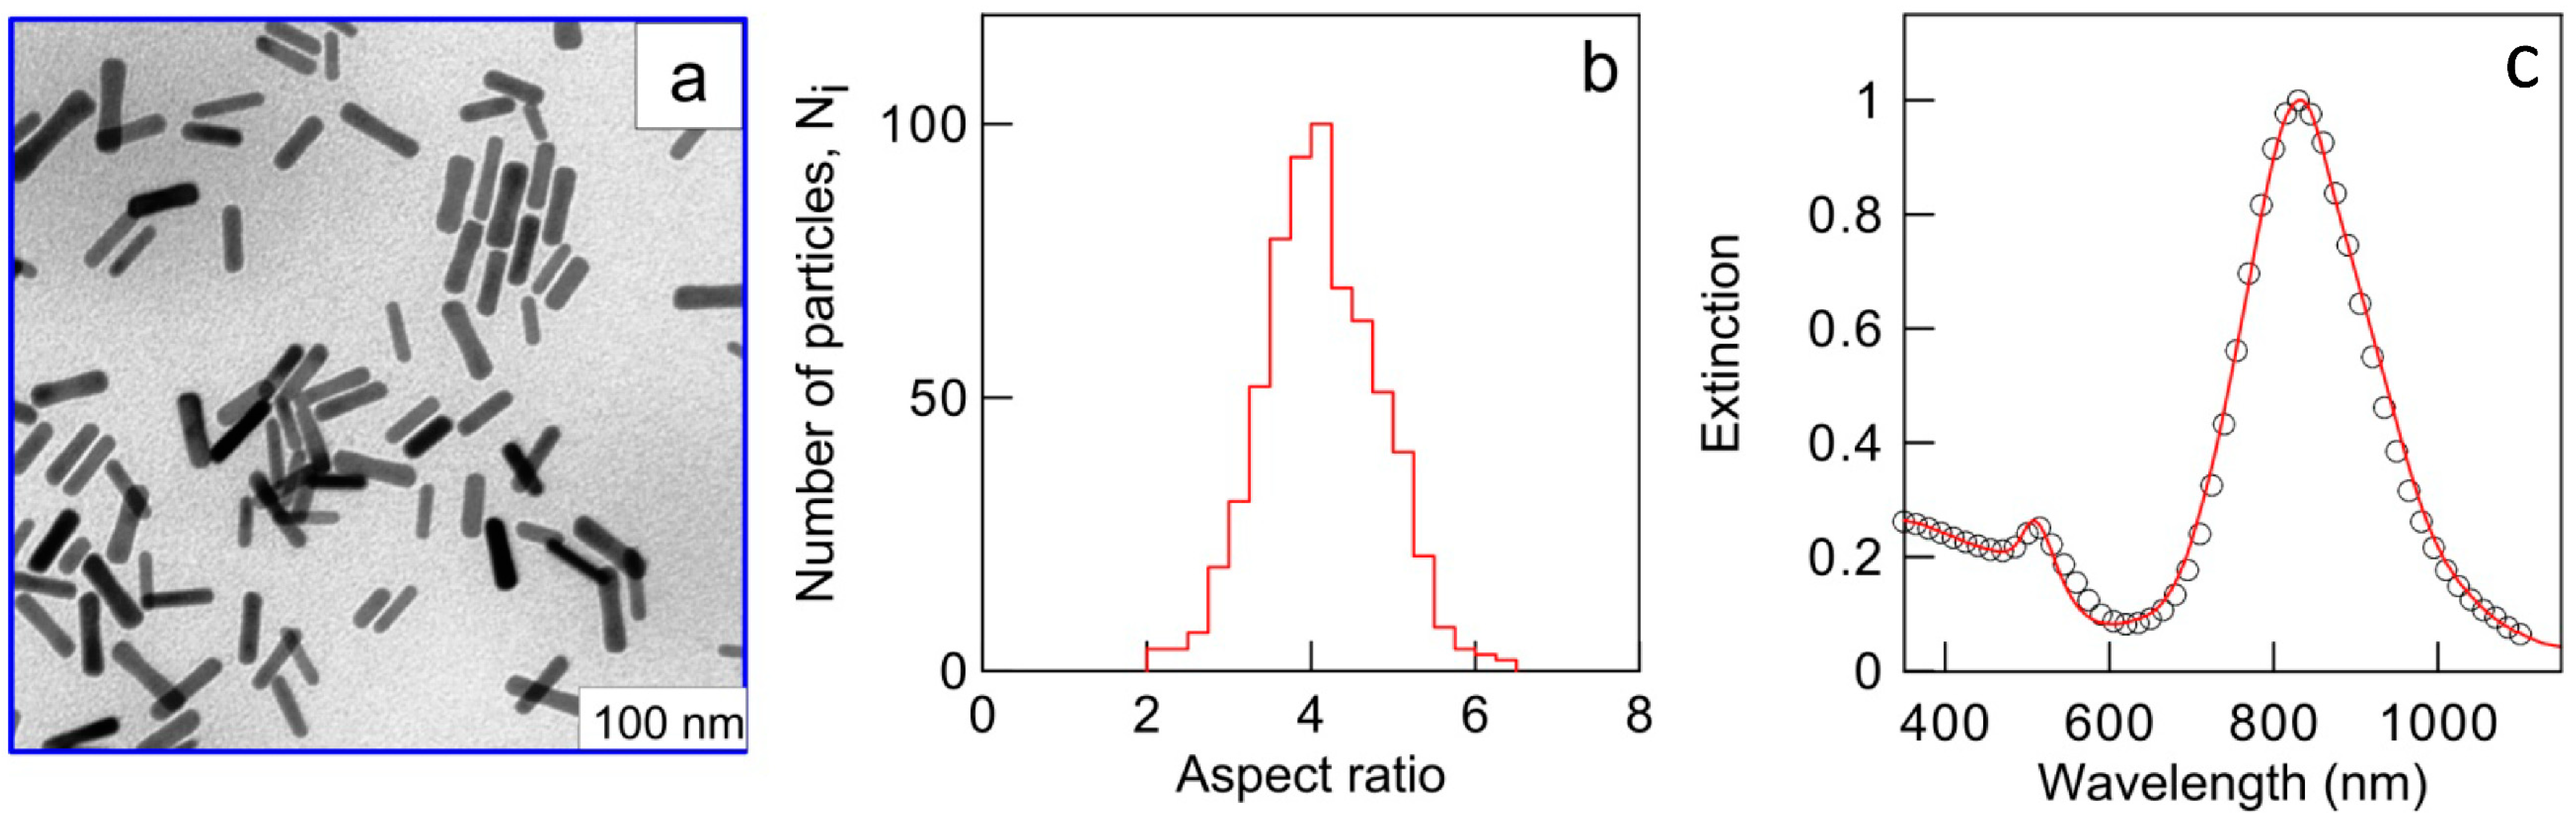
- Alekseeva, A.V.; Bogatyrev, V.A.; Khlebtsov, B.N.; Melnikov, A.G.; Dykman, L.A.; Khlebtsov, N.G. Gold nanorods: Synthesis and optical properties. Colloid J. 2006, 68, 661–678. [Google Scholar] [CrossRef]
- Khlebtsov, B.; Khanadeev, V.; Pylaev, T.; Khlebtsov, N. A new T-matrix solvable model for nanorods: TEM-based ensemble simulations supported by experiments. J. Phys. Chem. C 2011, 115, 6317–6323. [Google Scholar] [CrossRef]
- Khlebtsov, B.N.; Tuchina, E.S.; Khanadeev, V.A.; Panfilova, E.V.; Petrov, P.O.; Tuchin, V.V.; Khlebtsov, N.G. Enhanced photoinactivation of Staphylococcus aureus with nanocomposites containing plasmon particles and hematoporphyrin. J. Biophoton. 2013, 6, 338–351. [Google Scholar] [CrossRef]
- International Guiding Principles for Biomedical Research Involving Animals, CIOMS&ICLAS. 2012. Available online: http://www.cioms.ch/index.php/12-newsash/227-cioms-and-iclas-release-the-new-international-guiding-principles-for-biomedical-researchinvolvinganimals (accessed on 20 January 2022).
- Bucharskaya, A.B.; Maslyakova, G.N.; Dikht, N.I.; Navolokin, N.A.; Terentyuk, G.S.; Bashkatov, A.N.; Genina, E.A.; Tuchin, V.V.; Khlebtsov, B.N.; Khlebtsov, N.G. Cancer cell damage pathways at laser induced plasmon-resonant photothermal therapeutics of transplanted liver tumor. BioNanoScience 2016, 6, 256–260. [Google Scholar] [CrossRef]
- Bashkatov, A.N.; Genina, E.A.; Kochubey, V.I.; Rubtsov, V.S.; Kolesnikova, E.A.; Tuchin, V.V. Optical properties of human colon tissues in the 350–2500 nm spectral range. Quant. Electron. 2014, 44, 779–784. [Google Scholar] [CrossRef] [Green Version]
- Bucharskaya, A.B.; Maslyakova, G.N.; Navolokin, N.A.; Terentyuk, G.S.; Khlebtsov, B.N.; Khlebtsov, N.G.; Bashkatov, A.N.; Genina, E.A.; Tuchin, V.V. The assessment of effectiveness of plasmonic resonance photothermal therapy in tumor-bearing rats after multiple intravenous administration of gold nanorods. Proc. SPIE 2017, 10336, 103360Q. [Google Scholar] [CrossRef]
- Bohren, C.F.; Huffman, D.R. Absorption and Scattering of Light by Small Particles; John Willey & Sons Inc.: New York, NY, USA, 1983; p. 530. [Google Scholar] [CrossRef] [Green Version]
- Friebel, M.; Helfmann, J.; Netz, U.; Meinke, M. Influence of oxygen saturation on the optical scattering properties of human red blood cells in the spectral range 250 to 2000 nm. J. Biomed. 2009, 14, 034001. [Google Scholar] [CrossRef] [PubMed]
- Bucharskaya, A.B.; Khlebtsov, N.G.; Khlebtsov, B.N.; Maslyakova, G.N.; Navolokin, N.A.; Genin, V.D.; Genina, E.A.; Tuchin, V.V. Photothermal and photodynamic therapy of tumors with plasmonic nanoparticles: Challenges and prospects. Materials 2022, 15, 1606. [Google Scholar] [CrossRef] [PubMed]
- Avetisyan, Y.A.; Yakunin, A.N.; Tuchin, V.V. On the problem of local tissue hyperthermia control: Multiscale modelling of pulsed laser radiation action on a medium with embedded nanoparticles. Quant. Electron. 2010, 40, 1081–1088. [Google Scholar] [CrossRef]
- Maksimova, I.L.; Akchurin, G.G.; Terentyuk, G.S.; Khlebtsov, B.N.; Akchurin, G.G.; Ermolaev, I.A.; Skaptsov, A.A.; Revzina, E.M.; Tuchin, V.V.; Khlebtsov, N.G. Laser photothermolysis of biological tissues by using plasmon-resonance particles. Quant. Electron. 2008, 38, 536–542. [Google Scholar] [CrossRef]
- Sokolovskaya, O.I.; Sergeeva, E.A.; Golovan, L.A.; Kashkarov, P.K.; Khilov, A.V.; Kurakina, D.A.; Orlinskaya, N.Y.; Zabotnov, S.V.; Kirillin, M.Y. Numerical simulation of enhancement of superficial tumor laser hyperthermia with silicon nanoparticles. Photonics 2021, 8, 580. [Google Scholar] [CrossRef]
- Sokolovskaya, O.I.; Zabotnov, S.V.; Golovan, L.A.; Kashkarov, P.K.; Kurakina, D.A.; Sergeeva, E.A.; Kirillin, M.Y. Prospects for using silicon nanoparticles fabricated by laser ablation in hyperthermia of tumours. Quant. Electron. 2021, 51, 64–72. [Google Scholar] [CrossRef]
- Ivanov, A.P. Correction of the temperature of biological objects in thermographic methods. J. Appl. Spectrosc. 2019, 86, 136–145. [Google Scholar] [CrossRef]
- Welch, A.J.; Wissler, E.H.; Priebe, L.A. Significance of blood flow in calculations of temperature in laser irradiated tissue. IEEE. Trans. Biomed. Eng. 1980, 27, 164–166. [Google Scholar] [CrossRef]
- Jia, H.; Chen, B.; Li, D. Dynamic optical absorption characteristics of blood after slow and fast heating. Lasers Med. Sci. 2017, 32, 513–525. [Google Scholar] [CrossRef] [PubMed]
- Randeberg, L.L.; Daae Hagen, A.J.; Svaasand, L.O. Optical properties of human blood as a function of temperature. Proc. SPIE 2002, 4609, 20–29. [Google Scholar] [CrossRef]
- Prahl, S.A. Optical Absorption of Hemoglobin. 1999. Available online: http://www.omlc.ogi.edu/spectra/ (accessed on 10 February 2022).
- Weber, R.E.; Campbell, K.L. Temperature dependence of haemoglobin–oxygen affinity in heterothermic vertebrates: Mechanisms and biological significance. Acta Physiol. 2011, 202, 549–562. [Google Scholar] [CrossRef] [PubMed]
- Langford, V.S.; McKinley, A.J.; Quickenden, T.I. Temperature dependence of the visible-near-infrared absorption spectrum of liquid water. J. Phys. Chem. A 2001, 105, 8916–8921. [Google Scholar] [CrossRef]
- Nanospectra. Introducing the First Ultra-Focal Nanoshell Technology. 2022. Available online: https://nanospectra.com/technology/ (accessed on 10 February 2022).
- Stern, J.M.; Kibanov Solomonov, V.V.; Sazykina, E.; Schwartz, J.A.; Gad, S.C.; Goodrich, G.P. Initial Evaluation of the safety of nanoshell-directed photothermal therapy in the treatment of prostate disease. Int. J. Toxicol. 2016, 35, 38–46. [Google Scholar] [CrossRef]
- Rastinehad, A.R.; Anastos, H.; Wajswol, E.; Winoker, J.S.; Sfakianos, J.P.; Doppalapudi, S.K.; Carrick, M.R.; Knauer, C.J.; Taouli, B.; Lewis, S.C.; et al. Gold nanoshell-localized photothermal ablation of prostate tumors in a clinical pilot device study. Proc. Natl. Acad. Sci. USA 2019, 116, 18590–18596. [Google Scholar] [CrossRef] [PubMed] [Green Version]


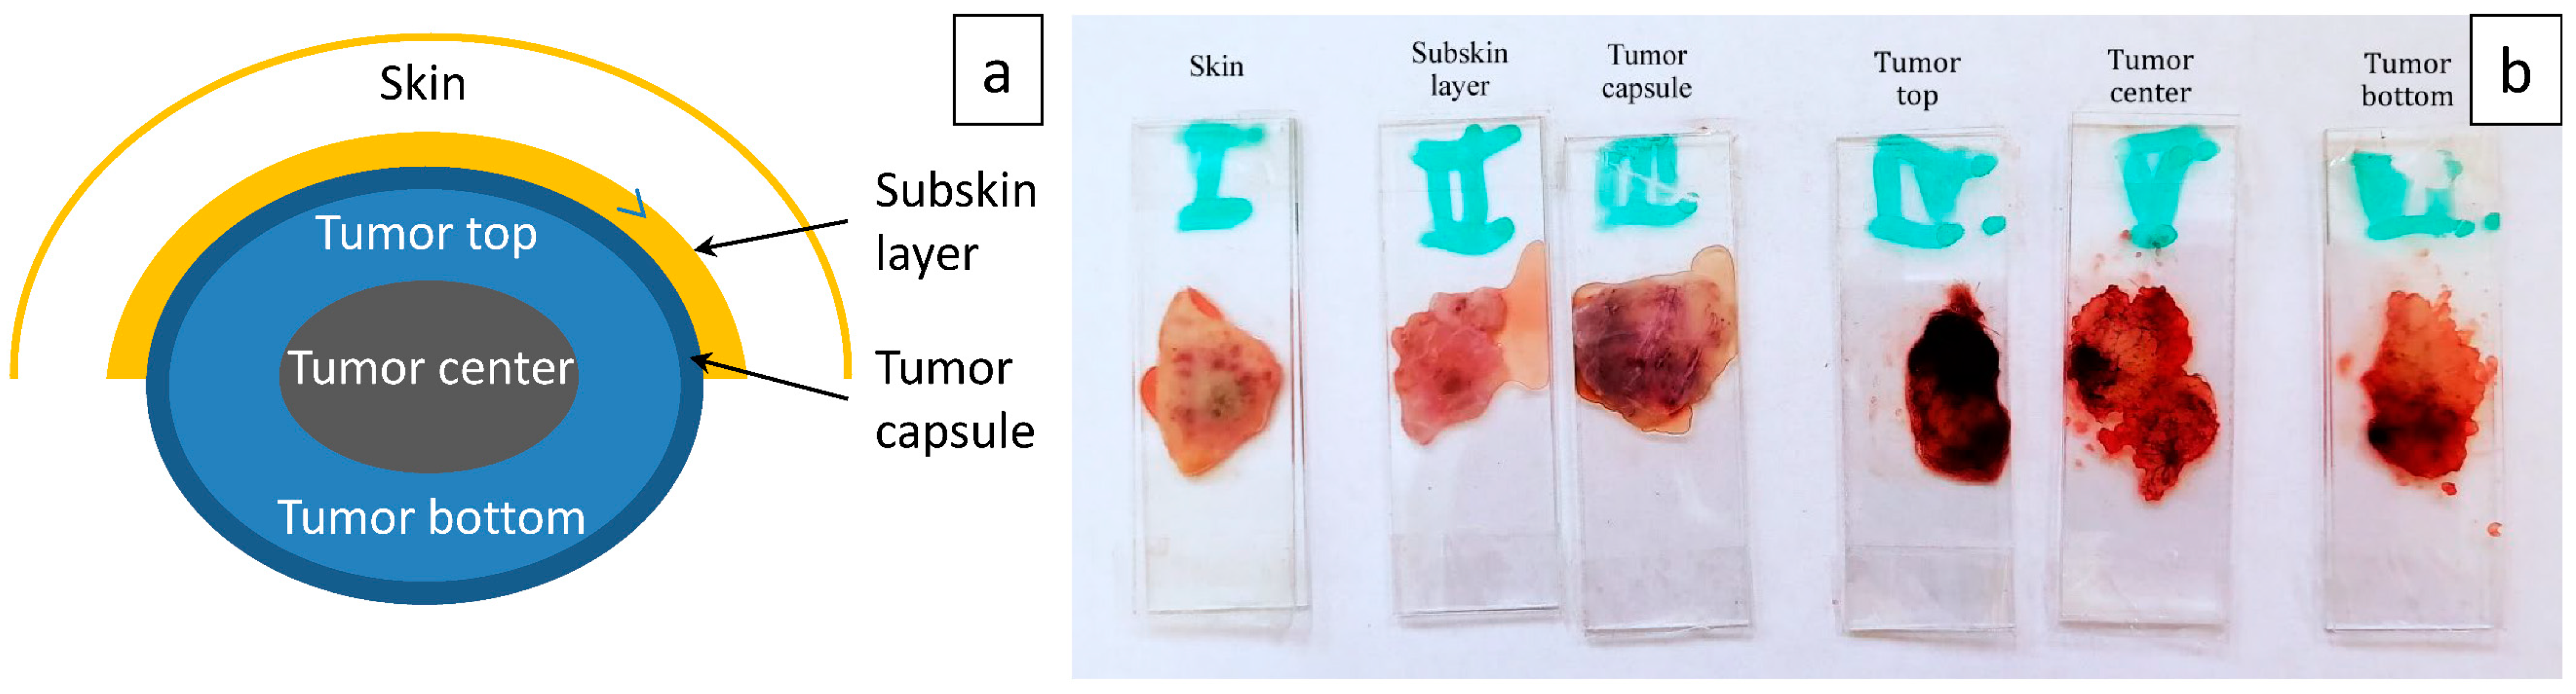
| Groups | Skin | Subskin | Capsule | Top | Center | Bottom |
|---|---|---|---|---|---|---|
| Control | 1.46 ± 0.39 | 0.89 ± 0.67 | 0.15 ± 0.06 | 1.04 ± 0.09 | 0.52 ± 0.32 | 0.86 ± 0.68 |
| Experimental | 1.37 ± 0.29 | 0.52 ± 0.23 | 0.30 ± 0.01 | 0.72 ± 0.08 | 1.15 ± 0.46 | 1.37 ± 0.25 |
Publisher’s Note: MDPI stays neutral with regard to jurisdictional claims in published maps and institutional affiliations. |
© 2022 by the authors. Licensee MDPI, Basel, Switzerland. This article is an open access article distributed under the terms and conditions of the Creative Commons Attribution (CC BY) license (https://creativecommons.org/licenses/by/4.0/).
Share and Cite
Genin, V.D.; Bucharskaya, A.B.; Terentyuk, G.S.; Khlebtsov, N.G.; Navolokin, N.A.; Tuchin, V.V.; Genina, E.A. Changes in Optical Properties of Model Cholangiocarcinoma after Plasmon-Resonant Photothermal Treatment. Photonics 2022, 9, 199. https://doi.org/10.3390/photonics9030199
Genin VD, Bucharskaya AB, Terentyuk GS, Khlebtsov NG, Navolokin NA, Tuchin VV, Genina EA. Changes in Optical Properties of Model Cholangiocarcinoma after Plasmon-Resonant Photothermal Treatment. Photonics. 2022; 9(3):199. https://doi.org/10.3390/photonics9030199
Chicago/Turabian StyleGenin, Vadim D., Alla B. Bucharskaya, Georgy S. Terentyuk, Nikolai G. Khlebtsov, Nikita A. Navolokin, Valery V. Tuchin, and Elina A. Genina. 2022. "Changes in Optical Properties of Model Cholangiocarcinoma after Plasmon-Resonant Photothermal Treatment" Photonics 9, no. 3: 199. https://doi.org/10.3390/photonics9030199