Article

Unveiling the Role of the Beam Shape in Photothermal Beam Deflection Measurements: A 1D and 2D Complex Geometrical Optics Model Approach

by
Mohanachandran Nair Sindhu Swapna
1,
Dorota Korte
1,* and
Sankaranarayana Iyer Sankararaman
2,*
1
Laboratory for Environmental and Life Science, University of Nova Gorica, Vipavska 13, SI-5000 Nova Gorica, Slovenia
2
Department of Optoelectronics, University of Kerala, Trivandrum, Kerala 695581, India
*
Authors to whom correspondence should be addressed.
Photonics 2022, 9(12), 991; https://doi.org/10.3390/photonics9120991
Submission received: 30 November 2022 / Revised: 13 December 2022 / Accepted: 14 December 2022 / Published: 16 December 2022
(This article belongs to the Special Issue Adaptive Optics and Its Applications)

Abstract

:
The preponderance of laser beam shapes cannot be ruled out during the implementation of an optical experiment nor during the formulation of its theoretical background. The present work elucidates the role of Gaussian and top-hat beam shapes in generating and analysing the photothermal beam deflection (PBD) signals. The complex geometrical optics models encompassing the perturbations in the phase and amplitude of the probe beam with one-dimensional (1D) and two-dimensional (2D) approaches is employed to curve fit the PBD signal and are compared. From the fitted curve, the thermal diffusivity and conductivity of the sample are calculated with the 1D and 2D models. A uniform intensity distribution over the sample, like a top-hat beam, is achieved using an optical lens system and verified using a beam profiler. When the phase and amplitude of the PBD signal are fitted at different positions of the lens, i.e., in focussed and defocussed conditions, it is observed that difference in the measured thermal characteristics is about 30% for the Gaussian pump beam profile, whereas it is only <4% for top-hat beam. Even though the fitting accuracy and sum of residues estimated for the 2D model are better than 1D, the ease of computation with the 1D model employing top-hat excitation suggests the application of the top-hat profile in photothermal experiments.

1. Introduction

The wavefront of the laser beam plays a significant role not only in optical imaging systems but also in laser-assisted measuring systems [1,2,3,4]. This necessitates correction or manipulation of the wavefront to get better results, which is the main focus of the study under the branch of optics called adaptive optics (AO) [1,5,6]. Today, AO technology finds many applications in imaging systems, astronomical telescopes, microscopes, communication systems, ophthalmology, atmospheric science and sensors [7,8,9]. AO technology’s essence lies in assessing the distortion of wavefronts and developing optical elements to compensate for or correct them. Hence, an AO system consists of a sensor, controller and corrector for the wavefront [5]. Deformable mirrors, scan lenses, spatial light modulators and liquid crystal arrays are the popularly used AO elements [4].
Optical imaging and measuring systems theories are developed considering the beam wavefront. This necessitates a proper understanding of the wavefront for analysing the results obtained [10]. Variations/aberrations in wavefront can be a boon or curse, based on the problem under investigation. The literature shows that a beam with a Gaussian profile TEM00 mode can provide continuous illumination over a surface, though with varying intensity with a maximum at the centre [11,12]. For other modes and a combination of modes, the irradiance profile is non-uniform over a surface. Besides the role of beam profile in the transmission characteristics in the nonlocal nonlinear optical systems, the effect of top-hat beams in photothermal and laser-induced breakdown spectroscopy is well reported in the literature [13,14,15]. The lack of mode purity in laser systems adversely affects the signals generated by them in laser-matter interaction. The signals generated in nondestructive evaluation techniques like photothermal beam deflection (PBD), photoacoustics, photopyroelectrics, thermal lens and photothermal radiometry greatly depend on the shape of the laser beam wavefront [16,17,18,19,20,21]. When a gaussian beam generates a gaussian refractive index gradient in the medium, distorted wavefronts not only distort the signal but also lower the signal strength. The present work attempts to elucidate the effect of beam shape on the precise thermal diffusivity measurement using the PBD technique.
The PBD, also known as the mirage technique, introduced by Boccara et al. in 1980 [22], is still an emerging field of research finding a wide range of applications in the analysis of thermal and optical properties of solids, thin films, composites and complex materials [23,24,25,26]. The technique is based on the interaction of the laser beam with the sample and provides good sensitivity, and both temporal and spectral resolution. Upon irradiating the sample using an intensity-modulated laser beam, the photons get absorbed and generate heat due to the nonradiative de-excitation. The heat energy gets transferred to the coupling medium at the frequency of modulation, which in turn generates a refractive index profile with a maximum variation at the centre. The refractive index gradient generated in the sample follows a Gaussian distribution, which is probed by another low-power laser skimming the sample’s surface. The deflection of the probe beam follows the refractive index of the coupling medium detected using a position-sensitive quadrant detector. The phase and amplitude of the deflected probe beam carry vital information that can be employed to get the details of the material [27,28,29]. These parameters can also be used to assess the sample’s surface properties and depth profiling. As the detected signal depends only on photothermal generation, this indirect, noncontact measurement offers a high signal-to-noise ratio. The lesser sample requirement, nondestructive nature and high sensitivity make it suitable for applications in geology, pharmaceutics, semiconductors, materials science, and biomedical and corrosion science [25,26,30,31].
The conventional PBD technique uses an excitation laser of Gaussian profile, where the irradiance is maximum at the centre. Most theories of photothermal spectroscopy demand the use of uniform illumination of the sample for better accurate results. In such cases, the use of a flat-top/top-hat beam is of greater significance as it has a more constant beam profile across the laser’s cross-section providing uniform illumination over the region of analysis [16,19,32]. Even though different theoretical models exist based on Fresnel diffraction theory considering the top-hat beam profile in PBD [16,20,33], a model completely defining all the variations in phase and amplitude of the deflection is essential for the proper analysis. In this work, an attempt has been carried out to reveal the accuracy in the thermal diffusivity and conductivity determination of an aluminium (Al) sample using the PBD technique for the case of forming the pump beam distribution from Gaussian to top-hat shape. An effort has also been made to explain the variation in the accuracy through a new theoretical model based on complex geometric equations, considering all the correction factors to phase and amplitude that the other existing models do not consider.

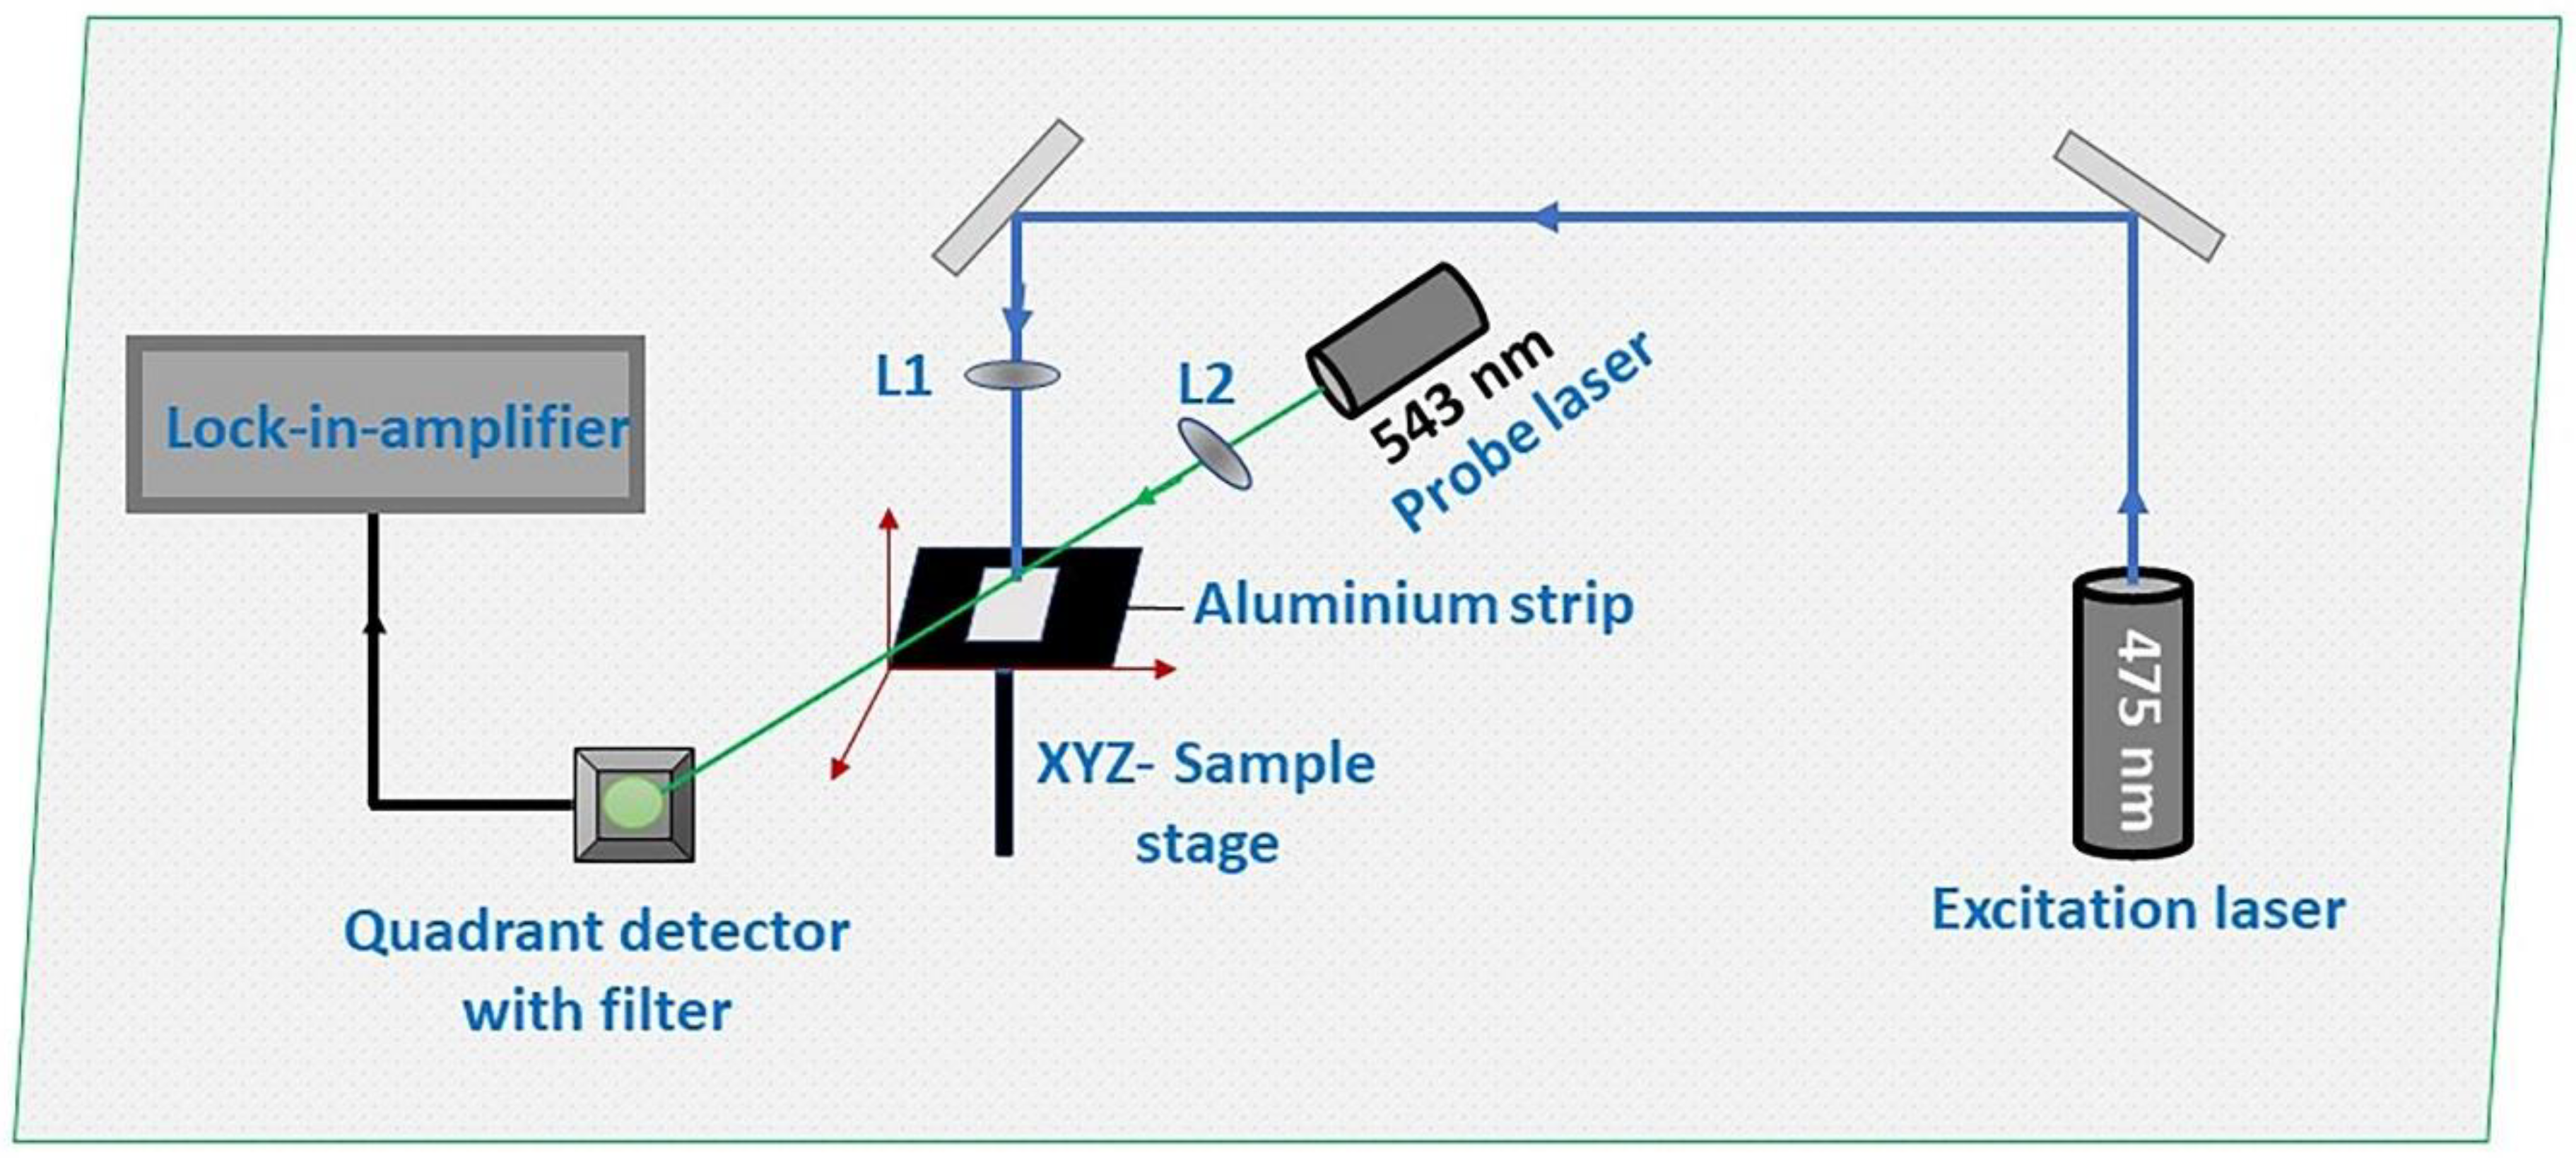
2. Experimental Section

In order to assess the influence of beam shaping in analysing the thermal properties employing PBD, the home-built setup shown in Figure 1 is used. An excitation laser of wavelength 475 nm and power 120 mW (Oxxius S A, Lannion, France, Model LBX-445-500-CSB-PPA) is used as the pump beam (PuB) and a low power (2 mW) He-Ne laser of wavelength 543.5 nm (Melles Griot, Carlsbad, CA, USA, Model 25-LGR-393–230) is used as the probe beam (PrB). An aluminium strip of 1 cm × 1 cm is used as the testing sample. The reported thermal diffusivity and thermal conductivity values of aluminium are in the range 91 × 10−4–97 × 10−4 cm2s−1 and 225–237 Wm−1K−1, respectively [34,35,36]. The pump beam is modulated using an electromechanical chopper (Scitec Instruments, Wiltshir, United Kingdom, Control unit model 300C, chopping head model 300CD, chopping disks model 300H), focussed using a lens (Bi-Convex, AR Coated: 350–700 nm, Edmund Optics, Barrington, NJ, USA) having focal length 5 cm (L1) and allowed to fall perpendicularly on the sample surface. The aluminium strip is placed on a sample holder fixed to an XYZ translation stage such that the experimental configuration can be optimised easily. According to the principle of PBD, the optical absorption due to the illumination of the sample by the laser results in temperature oscillations (TOs) in and around the sample. The probe beam is focussed using a lens (Bi-Convex, AR Coated: 350–700 nm, Edmund Optics, Barrington, NJ, USA) of 10 cm focal length (L2) and configured in such a way that it grazes through the sample surface at the same position where the pump beam falls but in a transverse direction. Hence, the interaction of the probe beam with the photo-induced temperature oscillations gives rise to deflections that are probed by a visible quadrant cell photoreceiver (Newport 0901 with photodetector head of New Focus, Model 2901) attached to a 532 nm interference filter (Edmund Optics, Barrington, NJ, USA). The output from the quadrant detector is then fed to a lock-in-amplifier (Stanford Research System, Sunnyvale, CA, USA, SR830 DSP), with the signal from the electromechanical chopper as the reference. The beam deflection studies are carried out with the Gaussian and the modified top-hat wavefronts. The pump beam profile at various positions is recorded using an Ophir NanoScan 2 s Pyro/9/5 head with Nanoscan V2 software. The PTBD studies are done when the wavefront is Gaussian and top-hat. The intensity distribution across the sample is nearly uniform at the positions of the focussing lens L1 before and after the focus. At focus, when we have a Gaussian wavefront, below the focal point we get a top-hat-shaped wavefront interacting with the sample. The thermal diffusivity (D) and conductivity (k) of the sample, the Al strip, is determined at the focal point and at positions above and below the focal point.

3. Theory

Formulating an opportune theoretical description is very important in analysing all experimental data. In the PBD method, in order to examine the thermal parameters of the sample under consideration, there exist different conventional theoretical models like ray-deflection theory put forward by Aamodt and Murphy [37,38] or wave theory by Glazov and Muratikov [39,40] to explain the thermal wave propagation in and around the sample. In the ray-deflection model, the probe beam is assumed to be a bundle of infinitely thin rays deflecting differently in different directions and the average of the photo deflection signal is taken. However, in wave theory, the beam deflection signal is analysed by solving the wave equation for the thermal wave propagating in the fluid. Here, the probe beam’s phase variations in the electric field after passing through the thermal lens region are only considered. Since both methods find limitations in satisfying many of the experimental analyses [28,41], especially while using higher modulation frequencies of the temperature field and wider Gaussian beam profile, a more advanced model called complex ray theory was put forward by D. Korte Kobylinska et al. [42,43]. The added advantage of this model lies in the fact that it considers the phase and amplitude changes of the thermal oscillations of the probe beam along with its refraction during the passage of the probe beam into and out of the region of thermal waves. This makes the model complete taking into account all the possible perturbations in the signal.
The different methods for finding the thermal properties, like thermal diffusivity and thermal conductivity, of material using the PBD method are the surface scan method, slope method and frequency scan method [24]. In the present study, the PBD experiment is carried out in the frequency scan method, and the complex geometrical ray theory is used as the theoretical model. In the frequency scan method, the variation in the phase and amplitude of the beam deflection signal with the modulation frequency is recorded and used to estimate the thermal parameters. The phase and amplitude data collected are curve fitted theoretically using the least-square method. The theory of light–matter interaction starts by solving the basic heat diffusion equation, Equation (1).
υ ( y , z , t ) 1 D T i υ ( y , z , t ) t = q k T i
Here, υ denotes the temperature field, D T i denotes the thermal diffusivity of the material and k T i indicates the corresponding thermal conductivity. In Equation (1) q, the thermal energy, is assumed to be nil, considering that the absorption due to the excitation laser happens only at the sample surface and hence there are no other internal sources of heat generation. Solving Equation (1) by suitable boundary conditions, we get the real part of the solution as given in Equation (2) [24].
υ f ( y , z , t ) = ψ f R 2 ( y , z ) + ψ f I 2 ( y , z )     cos ( ω t + atan ψ f I ( y , z ) ψ f R ( y , z ) )
Here, ω denotes the excitation beam’s angular modulation frequency, and ψf R(y,z) and ψf I(y,z) denote the real and imaginary parts of the temperature distribution in the fluid above the sample. According to the complex ray theory, the probe beam interacting with the temperature oscillations is said to be like a bundle of rays in complex space. Its coordinates in an optically homogenous space are expressed in terms of ray coordinates in the input plane of the setup (η and ξ), running coordinates along the trajectory of the ray (τ), index of refraction ( n 0 ), complex Rayleigh’s length (ZRC) and Rayleigh length (ZR), as given in Equation (3).
x ( τ ) = n 0 τ   1 + ξ 2 + η 2 z R C 2   y ( τ ) = η ( 1 + i   n 0 τ z R C )   z ( τ ) = ξ ( 1 + i   n 0 τ z R C )
As a result of the TOs, refractive index variation occurs in that heated region, and hence the trajectory of the probe beam gets deflected. This necessitates a correction in the x 1 and y 1 coordinates as given in Equations (4) and (5), respectively [24].
x 1 ( ξ , η ,   τ ) = n 0 2 s T 0 τ ( τ τ ) υ f x d τ
y 1 ( ξ , η ,   τ ) = n 0 2 s T 0 τ ( τ τ ) υ f y d τ
Here, s T is the thermal sensitivity given by Equation (6).
s T = 1 n 0 d n d T
After applying all the corrections to the phase and amplitude of the probe beam deflection (discussed in Ref. [24]), normal (SPDn) and tangential (SPDt) components of the photothermal deflection signal for the 2D model are detected using a quadrant photoreceiver given by Equations (7) and (8). In the 2D model, the sample illumination is non-uniform, having a Gaussian profile.
S P D n = K d ( 0 + 0 )   d z D h + d y D I ( x D , y D , z D )
S P D t = K d h + d x D ( 0 +   0 )   d y D I ( x D , y D , z D )
In Equations (7) and (8), K d , h and I ( x D , y D , z D ) denote the detector’s constant, the probe beam’s height over the surface of the sample and the probe beam intensity, respectively [24].
At the same time, if the excitation beam’s diameter is made larger than the probe beam by defocussing the excitation beam, the thermal oscillations will have a one-dimensional nature [44]. In such a case, the laser radiance is said to have a top-hat profile, giving more uniform illumination over the sample surface, resulting in uniform deflection throughout the surface. The photothermal deflection signal after the phase and amplitude corrections is given in Equation (9) [24].
S P D n = 2 K d ( 0 + h 0 ) d z + d x [   R e ( a 1 d ) I m ( ψ 1 d + ψ 1 f ) ] I 0 g = S P D n d + S P D n f = A t cos ( Ω t + φ t )
Here, I 0 g is the undisturbed probe beam’s intensity, and S P D n d and S P D n f denote the deflected signal and its phase. When ψ 1 d and ψ 1 f indicate the corrections to the phase of the probe beam, a1d indicates the amplitude correction term. The additional changes in the phase and amplitude of the photothermal beam deflection signal are assigned as A t and φ t , respectively [24]. Using the recorded values of variations in the phase and amplitude with respect to frequency and by the multiparameter fitting of curves using Equations (8) and (9), the values of the thermal parameter, thermal diffusivity and conductivity are obtained for the 1D (top-hat) and 2D (Gaussian) models. The fitting accuracy of the determined parameters ( S D s , S k s ) is also verified by finding the square root of the covariance matrix [45].
S P = [ S D T S k T ] = c o v ( P ) ;
where P is the fitted parameter matrix given by,
P = [ D T k T ] ;
and
c o v ( P ) = σ r ( J f T J f ) 1
σ r is the variance on residuals expressed by Equation (13).
σ r = 1 N k i = 1 N [ y i   f ( P ) ] 2
where N is the number of points in the dataset.
J f denotes the Jacobian matrix.
J f = [ f ( P ) D T f ( P ) k T ]
where P is the fitted parameter’s matrix.

4. Results and Discussion

The optimisation of the theoretical model together with the proper choice of the laser beam profile has a profound role in determining the accuracy of PBD measurements and thermal properties determination. The merits and demerits of using the 1D and 2D model received by the use of complex geometrical optics, Equations (8) and (9), for determining the thermal properties of the tested Al sample for top-hat and Gaussian distribution of PuB, and their influence on the accuracy of the determined parameters are found. For that purpose, the PuB is focussed–defocussed using a lens having a focal length of 5 cm. Its profile is recorded using the beam profiler and displayed in Figure 2. It can be seen that, at the focus, the beam profile is Gaussian, with a maximum intensity at the centre. It is pertinent to note that beam shaping is usually done with the aid of spatial light modulators or some diffractive elements [4]. Here we have used a simple strategy of defocussing the lens to produce a top-hat beam profile. Hence, the lens is positioned above and below the focal point at different positions. Thus, the lens is placed at distances 4.7 cm, 4.8 cm, 4.9 cm, 5.1 cm, 5.2 cm and 5.3 cm from the top surface of the sample, where the pump beam falls. The radius of PrB in the area of its interaction with TOs is 27 μm, whereas radii of PuB for different positions of the forming lens are presented in Table 1. Furthermore, the 2D and 3D beam profile of the PuB laser at a position above (5.3 cm) and below (4.7 cm) the focal point is shown in Figure 3. The flat-top nature of the laser beam is evident from the beam profile images.
To determine the sample’s thermal properties (D and k), the variation in amplitude and phase of the PBD signal is recorded with respect to the modulation frequency (3–200 Hz) of induced TOs above the sample surface. The measurements are performed for the cases of PuB focussed and defocussed. To extract the desired information from the experimental data, the multiparameter fitting of theoretical curves to the measured signal is performed by the use of both 1D and 2D models (Equations (8) and (9)). The collected PBD signal and the fitted theoretical curves of the amplitude and phase for the case of PuB focussed (at 5 cm) and maximum defocussed (at 5.3 cm and 4.7 cm) are displayed in Figure 4 and Figure 5, respectively.
In all the cases, it is observed that the phase and amplitude of the PBD signal are found to decrease with the modulation frequency due to the decrease in the thermal diffusion length of induced temperature oscillations, which distorts PrB, and hence produce the PBD signal. The shorter the thermal diffusion length is, the weaker PrB is disturbed, which results in the decrease of the measured signal. By the fitting procedure, the thermal diffusivity and thermal conductivity of the tested aluminium sample are found for all the positions of PuB forming lens. The analysis is performed for two cases: application of 1D and 2D theoretical models in the multiparameter fitting of the theoretical dependencies to the experimental data (Table 2).
It was found that the values of both thermal diffusivity and conductivity do not show a significant difference at the 0.05 significance level (p-value > 0.05) in the case of using the 2D model for all positions of the PuB forming lens, as well as when using the 1D model in combination with top-hat distribution of PuB (PuB defocussed for 4.8 cm; 4.7 cm; 5.2 cm; 5.3 cm forming lens position). Such differences occur between results obtained for the 1D and 2D models in the case of Gaussian distribution of PuB (PuB tightly focussed for 4.9 cm; 5.0 cm; 5.1 cm forming lens position) for which p-value < 0.05. This may indicate the limitation of the application of the 1D theoretical model in the fitting procedure with respect to the PuB/PrB ratio. It can be concluded that PrB must be more than six times thinner than PuB in the area of TOs to be appropriately used in the fitting procedure. To support this statement, the relative differences between the values of thermal properties obtained for 1D and 2D models are calculated according to the formula [46]:
σ i = 1 R i = 1 R ( h 2 D h 1 D ) 2 h 2 D 2
where R is the number fitting repetition, and h1D and h2D are the values of the thermal diffusivity or thermal conductivity obtained by means of 1D and 2D models. The results are presented in Table 3. The analysis of the results reveals that the values of thermal properties determined employing the 1D model and 2D model differ by over 30% for the Gaussian distribution of PuB and from 2% to 4% for the top-hat PuB shape.
Furthermore, the determined uncertainty is two times lower for the application of the 2D model (relative standard deviation (RSD) around 2–4%) compared to the 1D model (RSD around 5–8%) (Table 4) for all lens positions. Thus, it is necessary to examine the distribution of residuals (fitting deviation) (Figure 6). A good model fit should yield residuals equally distributed around zero with no systematic trends [45]. In the case of using the 2D model in the fitting procedure, the distribution of fitting deviations is defined by a mean value of around 0.002 (f = 4.7 cm); 0.001 (f = 5.0 cm) and 0.003 (f = 5.3 cm), whereas for the case of using the 1D model by a mean value of around 0.033 (f = 4.7 cm); −0.014 (f = 5.0 cm) and 0.005 (f = 5.3 cm) (Figure 6). This suggests the better accuracy of the fitting in the case of the 2D model.
Furthermore, the sum of residues for both amplitude and phase is much lower in the 2D model (Table 4), which confirms the above findings and determines the applicability of the PBD method for specific geometry of the experimental conditions.

5. Conclusions

The present study elucidates the role of beam shape in generating photothermal signals analysed through beam deflection. The analysis of the photothermal signals is carried out with top-hat and gaussian beam profiles, also considering the 1D and 2D complex geometrical optics models, to determine the thermal properties—thermal diffusivity and thermal conductivity—of solid samples by photothermal beam deflection measurements. The significant difference between a Gaussian beam and a top-hat beam lies in the intensity distribution across a surface. In the present work, the top-hat condition is achieved using a lens system with the sample outside the focal plane. The beam shapes at various positions of the sample from the lens are recorded using a beam profiler, showing a gaussian profile at the focus and top-hat profile when defocussed. The fitting of the experimentally observed amplitude and phase variations when the sample is at and outside the focal plane reveals that, for the Gaussian distribution of the PuB, the thermal properties determined by the 1D model and 2D model differ by over 30%, whereas the difference is less than 4% when the beam shape of the PuB is top-hat. The comparative study suggests that the computation can be made simple with a 1D model with a PuB of the top-hat beam shape, pointing to the significance of beam shape in photothermal techniques.

Author Contributions

All authors contributed equally. All authors have read and agreed to the published version of the manuscript.

Funding

One of the authors M S Swapna is grateful to Slovenian Research Agency, for funding the project (J7-2602).

Institutional Review Board Statement

Not applicable.

Informed Consent Statement

Not applicable.

Conflicts of Interest

The authors declare no conflict of interest.

References

  1. Fourmaux, S.; Payeur, S.; Alexandrov, A.; Serbanescu, C.; Martin, F.; Ozaki, T.; Kudryashov, A.; Kieffer, J.C. Laser Beam Wavefront Correction for Ultra High Intensities with the 200 TW Laser System at the Advanced Laser Light Source. Opt. Express 2008, 16, 11987. [Google Scholar] [CrossRef] [PubMed]
  2. Samelsohn, G.; Mazar, R. Adaptive Wavefront Tilt Correction for Imaging and Laser Beam Formation in a Turbulent Atmosphere. In Proceedings of the 1995 International Geoscience and Remote Sensing Symposium, IGARSS ’95. Quantitative Remote Sensing for Science and Applications, Firenze, Italy, 10–14 July 1995; Volume 3, pp. 1941–1943. [Google Scholar]
  3. Huot, N.; Jonathan, J.-M.C.; Roosen, G. Dynamic Wavefront Correction of Nd:YAG Lasers by Self-Pumped Phase Conjugation in Photorefractive BaTiO/Sub 3/:Rh. Proc. IEEE 1999, 87, 2059–2073. [Google Scholar] [CrossRef]
  4. Salter, P.S.; Booth, M.J. Adaptive Optics in Laser Processing. Light Sci. Appl. 2019, 8, 110. [Google Scholar] [CrossRef] [PubMed] [Green Version]
  5. Guo, Y.; Zhong, L.; Min, L.; Wang, J.; Wu, Y.; Chen, K.; Wei, K.; Rao, C. Adaptive Optics Based on Machine Learning: A Review. Opto-Electron. Adv. 2022, 5, 200082. [Google Scholar] [CrossRef]
  6. Rukosuev, A.L.; Kudryashov, A.V.; Lylova, A.N.; Samarkin, V.V.; Sheldakova, Y.V. Adaptive Optics System for Real-Time Wavefront Correction. Atmos. Ocean. Opt. 2015, 28, 381–386. [Google Scholar] [CrossRef]
  7. Ribak, E. Atmospheric Turbulence, Speckle, and Adaptive Optics. Ann. N. Y. Acad. Sci. 1997, 808, 193–204. [Google Scholar] [CrossRef]
  8. Qin, Z.; She, Z.; Chen, C.; Wu, W.; Lau, J.K.Y.; Ip, N.Y.; Qu, J.Y. Deep Tissue Multi-Photon Imaging Using Adaptive Optics with Direct Focus Sensing and Shaping. Nat. Biotechnol. 2022, 40, 1663–1671. [Google Scholar] [CrossRef]
  9. Hampson, K.M.; Turcotte, R.; Miller, D.T.; Kurokawa, K.; Males, J.R.; Ji, N.; Booth, M.J. Adaptive Optics for High-Resolution Imaging. Nat. Rev. Methods Prim. 2021, 1, 68. [Google Scholar] [CrossRef]
  10. Shealy, D.L. Historical Perspective of Laser Beam Shaping. In Proceedings of the Laser Beam Shaping III, Seattle, WA, USA, 28 October 2002; Volume 4770, pp. 28–47. [Google Scholar]
  11. Paschotta, R. Field Guide to Lasers; SPIE press: Bellingham, WA, USA, 2008; Volume 12, p. 9610. ISBN 081946. [Google Scholar]
  12. Mielec, N.; Altorio, M.; Sapam, R.; Horville, D.; Holleville, D.; Sidorenkov, L.A.; Landragin, A.; Geiger, R. Atom Interferometry with Top-Hat Laser Beams. Appl. Phys. Lett. 2018, 113, 161108. [Google Scholar] [CrossRef]
  13. Hou, Z.; Afgan, M.S.; Sheta, S.; Liu, J.; Wang, Z. Plasma Modulation Using Beam Shaping to Improve Signal Quality for Laser Induced Breakdown Spectroscopy. J. Anal. At. Spectrom. 2020, 35, 1671–1677. [Google Scholar] [CrossRef]
  14. Shen, S.; Yang, Z.-J.; Pang, Z.-G.; Ge, Y.-R. The Complex-Valued Astigmatic Cosine-Gaussian Soliton Solution of the Nonlocal Nonlinear Schrödinger Equation and Its Transmission Characteristics. Appl. Math. Lett. 2022, 125, 107755. [Google Scholar] [CrossRef]
  15. Shen, S.; Yang, Z.; Li, X.; Zhang, S. Periodic Propagation of Complex-Valued Hyperbolic-Cosine-Gaussian Solitons and Breathers with Complicated Light Field Structure in Strongly Nonlocal Nonlinear Media. Commun. Nonlinear Sci. Numer. Simul. 2021, 103, 106005. [Google Scholar] [CrossRef]
  16. Li, B.; Blaschke, H.; Ristau, D. Pulsed Photothermal Deflection with a Top-Hat Beam Excitation. J. Appl. Phys. 2006, 100, 053509. [Google Scholar] [CrossRef]
  17. Astrath, F.B.; Astrath, N.G.; Shen, J.; Zhou, J.; Malacarne, L.C.; Pedreira, P.R.B.; Baesso, M.L. Time-Resolved Thermal Mirror Technique with Top-Hat Cw Laser Excitation. Opt. Express 2008, 16, 12214. [Google Scholar] [CrossRef] [PubMed]
  18. Astrath, N.G.C.; Astrath, F.B.G.; Shen, J.; Zhou, J.; Gu, C.E.; Malacarne, L.C.; Pedreira, P.R.B.; Bento, A.C.; Baesso, M.L. Top-Hat Cw Laser Induced Thermal Mirror: A Complete Model for Material Characterization. Appl. Phys. B 2009, 94, 473–481. [Google Scholar] [CrossRef] [Green Version]
  19. Liu, M.; Li, B.; Hao, H. Comparison of Signals under Top-Hat and Gaussian Beam Excitations in Surface Thermal Lens Technique. In Proceedings of the Optical Design and Testing III, Beijing, China, 28 November 2007; p. 68342D. [Google Scholar]
  20. Li, B.; Xiong, S.; Zhang, Y. Fresnel Diffraction Model for Mode-Mismatched Thermal Lens with Top-Hat Beam Excitation. Appl. Phys. B 2005, 80, 527–534. [Google Scholar] [CrossRef]
  21. Pawlak, M.; Kruck, T.; Spitzer, N.; Dziczek, D.; Ludwig, A.; Wieck, A.D. Experimental Validation of Formula for Calculation Thermal Diffusivity in Superlattices Performed Using a Combination of Two Frequency-Domain Methods: Photothermal Infrared Radiometry and Thermoreflectance. Appl. Sci. 2021, 11, 6125. [Google Scholar] [CrossRef]
  22. Boccara, A.C.; Jackson, W.; Amer, N.M.; Fournier, D. Sensitive Photothermal Deflection Technique for Measuring Absorption in Optically Thin Media. Opt. Lett. 1980, 5, 377. [Google Scholar] [CrossRef]
  23. Yun, S.I.; Seo, H.J. Photothermal Beam Deflection Technique for the Study of Solids? Chin. J. Phys. 1992, 30, 753–767. [Google Scholar]
  24. Cabrera, H.; Korte, D.; Budasheva, H.; Asbaghi, B.A.N.; Bellucci, S. Through-Plane and in-Plane Thermal Diffusivity Determination of Graphene Nanoplatelets by Photothermal Beam Deflection Spectrometry. Materials 2021, 14, 7273. [Google Scholar] [CrossRef]
  25. Vodišek, N.; Šuligoj, A.; Korte, D.; Štangar, U.L. Transparent Photocatalytic Thin Films on Flexible Polymer Substrates. Materials 2018, 11, 1945. [Google Scholar] [CrossRef] [PubMed]
  26. Soumya, S.; Arun Kumar, R.; Raj, V.; Swapna, M.S.; Sankararaman, S. Thermal Diffusivity of Molybdenum Oxide Nanowire Film: A Photothermal Beam Deflection Study. Opt. Laser Technol. 2021, 139, 106993. [Google Scholar] [CrossRef]
  27. Sell, J. Photothermal Investigations of Solids and Fluids, 1st ed.; Elsevier: Amsterdam, The Netherlands, 2012; ISBN 0323154220. [Google Scholar]
  28. Korte, D.; Franko, M. Photothermal Deflection Experiments: Comparison of Existing Theoretical Models and Their Applications to Characterization of TiO2-Based Thin Films. Int. J. Thermophys. 2014, 35, 2352–2362. [Google Scholar] [CrossRef]
  29. Soumya, S.; Raj, V.; Swapna, M.S.; Sankararaman, S. Thermal Diffusivity Downscaling of Molybdenum Oxide Thin Film through Annealing Temperature-Induced Nano-Lamelle Formation: A Photothermal Beam Deflection Study. Eur. Phys. J. Plus 2021, 136, 187. [Google Scholar] [CrossRef]
  30. Budasheva, H.; Kravos, A.; Korte, D.; Bratkič, A.; Gao, Y.; Franko, M. Determination of Dissolved Iron Redox Species in Freshwater Sediment Using DGT Technique Coupled to BDS. Acta Chim. Slov. 2019, 66, 239–246. [Google Scholar] [CrossRef]
  31. Proskurnin, M.A.; Korte, D.; Rogova, O.B.; Volkov, D.S.; Franko, M. Photothermal Beam Deflection Spectroscopy for the Determination of Thermal Diffusivity of Soils and Soil Aggregates. Int. J. Thermophys. 2018, 39, 81. [Google Scholar] [CrossRef]
  32. Li, B.; Welsch, E. Probe-Beam Diffraction in a Pulsed Top-Hat Beam Thermal Lens with a Mode-Mismatched Configuration. Appl. Opt. 1999, 38, 5241. [Google Scholar] [CrossRef] [PubMed]
  33. Li, B.; Chen, X.; Gong, Y. Analysis of Surface Thermal Lens Signal in Optical Coatings with Top-Hat Beam Excitation. J. Appl. Phys. 2008, 103, 033518. [Google Scholar] [CrossRef]
  34. Touloukian, Y.S.; Powell, R.W.; Ho, C.Y.; Klemens, P.G. Thermophysical Properties of Matter-the TPRC Data Series. In Thermal Conductivity-Metallic Elements and Alloys (Reannouncement); Data Book; Purdue University, Thermophysical and Electronic Properties Information Center: Lafayette, IN, USA, 1970; Volume 1. [Google Scholar]
  35. Omini, M.; Sparavigna, A.; Strigazzi, A. Dilatometric Determination of Thermal Diffusivity in Low Conducting Materials. Meas. Sci. Technol. 1990, 1, 166–171. [Google Scholar] [CrossRef]
  36. Instruments, T.T. Materials Thermal Properties Database. Available online: https://thermtest.com/thermal-resources/materials-database (accessed on 25 November 2022).
  37. Aamodt, L.C.; Murphy, J.C. Photothermal Measurements Using a Localized Excitation Source. J. Appl. Phys. 1981, 52, 4903–4914. [Google Scholar] [CrossRef]
  38. Aamodt, L.C.; Murphy, J.C. Thermal Effects in Photothermal Spectroscopy and Photothermal Imaging. J. Appl. Phys. 1983, 54, 581–591. [Google Scholar] [CrossRef]
  39. Glazov, A.L.; Muratikov, K.L. Calculation of the Photodeflection Signal in the Framework of Wave Optics. Technol. Phys. 1993, 38, 344–347. [Google Scholar]
  40. Glazov, A.L.; Muratikov, K.L. Photodeflection and Interferometric Thermal Wave Microscopy of Solids. Int. J. Optoelectron. 1989, 4, 589–597. [Google Scholar]
  41. Kobylinska, D.K.; Bukowski, R.J.; Burak, B.; Bodzenta, J.; Kochowski, S. The Complex Ray Theory of Photodeflection Signal Formation: Comparison with the Ray Theory and the Experimental Results. J. Appl. Phys. 2006, 100, 063501. [Google Scholar] [CrossRef]
  42. Bukowski, R.J.; Korte, D. Perturbation Calculus for Eikonal Application to Analysis of the Deflectional Signal in Photothermal Measurements. Opt. Appl. 2002, 32, 817–828. [Google Scholar]
  43. Kobylińska, D.K.; Bukowski, R.J.; Bodzenta, J.; Kochowski, S. Thermal Parameters of Solids Determination by the Photodeflection Method—Theories and Experiment Comparison. Opt. Appl. 2008, 38, 445–458. [Google Scholar]
  44. Kobylińska, D.K.; Bukowski, R.J.; Burak, B.; Bodzenta, J.; Kochowski, S. Photodeflection Signal Formation in Photothermal Measurements: Comparison of the Complex Ray Theory, the Ray Theory, the Wave Theory, and Experimental Results. Appl. Opt. 2007, 46, 5216–5227. [Google Scholar] [CrossRef]
  45. Lobemeier, M.L. Linearization Plots: Time for Progress in Regression. HMS Beagle 2000, 3, 73. Available online: https://nanopdf.com/download/linearization-plots_pdf (accessed on 25 November 2022).
  46. Strak, K.; Piasecka, M.; Maciejewska, B. Comparison of the 1D and 2D Calculation Models Used for Determination of the Heat Transfer Coefficient during Flow Boiling Heat Transfer in a Minichannel. E3S Web Conf. 2019, 128, 01017. [Google Scholar] [CrossRef]
Figure 1. The PBD experimental setup.
Photonics 09 00991 g001
Figure 2. (a) 2D profile and (b) 3D profile of the excitation laser, when the lens is placed at the focal point.
Photonics 09 00991 g002
Figure 3. (i) 2D profile and (ii) 3D profile of the excitation laser when the lens is placed at (a) f = 5.3 cm and (b) f = 4.7 cm.
Photonics 09 00991 g003
Figure 4. Variations in the (a) amplitude and (b) phase of the PBD signal with respect to the modulation frequency of PuB, for the case of PuB focussed, along with the fitting curves using 1D and 2D models.
Photonics 09 00991 g004
Figure 5. Variations in the (i) amplitude and (ii) phase of the PBD signal with respect to the modulation frequency of PuB, for the case of maximum PuB defocussed, (a) at f = 5.3 cm and (b) at f = 4.7 cm, along with the fitting curves using 1D and 2D models.
Photonics 09 00991 g005
Figure 6. Distribution of residuals for (i) amplitude and (ii) phase using 1D and 2D models in the fitting procedure for the case of maximum PuB focussed f = 5.0 cm, and defocussed at f = 5.3 cm and at f = 4.7 cm.
Photonics 09 00991 g006
Table 1. Values of PuB radii for different position of forming lens and ratio of PuB/PrB radii.
Lens Position, cmPuB Radius, μmPuB/PrB Ratio
4.72599.6
4.81736.4
4.9863.2
5.0361.4
5.1863.2
5.21736.4
5.32599.6
Table 2. Values of determined thermal diffusivity DT and conductivity kT of the Al sample for different positions of PuB forming lens and application of 1D and 2D theoretical model.
1D Theoretical Model2D Theoretical Model
Lens Position
(cm)
DT
(×10−2 cm2 s−1)
kT
(W m−1 K−1)
DT
(×10−2 cm2 s−1)
kT
(W m−1 K−1)
4.794 ± 5243 ± 1292 ± 3238 ± 7
4.889 ± 7228 ± 1593 ± 3239 ± 8
4.9112 ± 9278 ± 2297 ± 4249 ± 8
5.0125 ± 9312 ± 2595 ± 4241 ± 7
5.1108 ± 8271 ± 2192 ± 3237 ± 6
5.287 ± 7226 ± 1692 ± 2234 ± 6
5.395 ± 5244 ± 1293 ± 3240 ± 5
Table 3. Values of PuB radii for different positions of forming lens and ratio of PuB/PrB radii.
Lens Position, cmσDT, %σkT, %
4.722
4.854
4.91816
5.03230
5.11617
5.244
5.322
Table 4. Values of RSD and sum of residues for thermal diffusivity DT and conductivity kT determination in case of the 1D theoretical model and 2D theoretical model.
1D Theoretical Model
Lens Position, (cm)RSDDT
(%)
RSDkT
(%)
Sum of Amplitude Residues (V)Sum of Phase Residues (Degree)
4.75.34.90.585193
4.87.96.60.783234
4.98.17.91.277289
5.07.28.01.992304
5.17.47.81.432295
5.28.07.10.806262
5.35.65.40.531241
2D Theoretical Model
Lens Position, (cm)RSDDT
(%)
RSDkT
(%)
Sum of Amplitude Residues (V)Sum of Phase Residues (Degree)
4.73.32.90.443158
4.83.23.30.285112
4.94.13.20.322118
5.04.22.90.413151
5.13.32.60.387124
5.22.22.60.436153
5.33.22.10.279103
Publisher’s Note: MDPI stays neutral with regard to jurisdictional claims in published maps and institutional affiliations.

