1. Introduction
The relationship between myopia and accommodation is multifactorial, and it has been described that increased accommodative effort required during near work has been suggested as a causal factor in the development of myopia [
1]. It has been widely documented how anterior pole structures change with myopia [
2], and the literature also presents different changes in the posterior pole; for example, during accommodation when the lens thickens, the choroid thinness changes significantly [
3]. In this case, the posterior pole seems to play an important role in accommodative performance and myopia progression. Currently, the anatomic complexities of each of these structures have not yet been elucidated, although changes in the posterior segment, and specifically in the choroid during accommodation, could promote myopic shift in some eyes. During accommodation, posterior pole elongation occurs together with a decrease in choroidal equatorial circumference, and a small but significant thinning of the choroid has been observed at high accommodation demand, which is greatest in the temporal and inferotemporal parafoveal choroid and increases with increasing eccentricity from the fovea [
4,
5]. These transient posterior pole modifications, after relatively short-duration accommodation tasks, are present, but they should be evaluated in depth to determine the ability and time period of recovery to the basal status, not only on the choroid, but also at the retinal level. Indeed, it has been described that retinal neurons are more widely spaced among individuals with myopia than among those with emmetropia [
6,
7], so this fact could explain the expansion of the posterior pole and the thinner retina found in myopic subjects using optical coherence tomography (OCT) [
8,
9,
10]. These studies have reported that peripheral retinal thickness decreases with increasing severity of myopia. Many studies have reported that the retina in the parafoveal regions and peripheral retina becomes thinner as the severity of myopia increases [
9,
11]. The precise visualization of its individual layers with OCT [
12] correlates with histopathologic studies that showed that both inner plexiform and nuclear layers and outer plexiform layer contribute the most to retinal thinning, suggesting that photoreceptors, bipolar/horizontal cells, amacrine cells, and ganglion cells all contribute to retinal thinning due to a decrease in area density [
13].
Globally, accommodation is a change in eye power to a more myopic situation. During this process, optical behavior has been widely described; in particular, higher-order aberration (HOA) affects the visual quality of the eye to provide cues to regulate accommodation. In particular, it has been described how differences in magnitude and sign can be found between emmetropic and myopic eyes [
1], although the unaccommodated eyes recover their previous status immediately. This redundant work performed by the eye continuously means daily repetitive variations in its structure, and the more accommodation is needed, the more myopic the eye momentarily becomes.
Additionally, there is growing evidence from both human and animal studies of refractive error presenting that ambient light exposure is an important environmental factor involved in the regulation of eye growth. Documented seasonal variations in eye growth and refractive error progression in childhood support a potential role for ambient light exposure in the control of human eye growth. Different rates of growth, depending on the season, have been described, with slower rates in summer months and faster rates in winter months [
14,
15,
16,
17]. More specifically, greater average daily light exposure results in less axial growth of the eye in childhood, and a low but statistically significant relationship between them has been described [
18].
A key knowledge gap is whether the thickness of different areas of the retina is more strongly associated with its shape under different lighting conditions after five minutes of near work reading tasks. This short-term accommodative demand produces a momentary myopization of the eye that is avoided after finishing the work. In young adults with a normal accommodative system, visual recovery is instantaneous, but structural changes could be temporally modified, specifically at central and temporal retinal areas, because they are more involved in these visual requirements than the nasal zone. This study focused on identifying structural retinal behavior based on fixed accommodative demand and controlled light levels reaching the corneal plane. To our knowledge, this is a novel study that has not been performed previously, considering the changes that occur in optical aberrations and in the thickness and eccentricity of the central and peripheral retina.
2. Materials and Methods
2.1. Sample Description
This prospective study, including 48 eyes from 24 healthy subjects from 18 to 33 years, was approved by the Comité de Ética de la Investigación de la Comunidad de Aragón (CEICA), with reference PI21-074, and the conduct of the study adhered to the tenets of the Declaration of Helsinki. After an explanation of the nature and possible consequences of the study, written informed consent was obtained from all participants before examination. Written assent was also obtained from all of them on the day of examination.
All subjects were included, except those who met the exclusion criteria to participate in the study, which were having binocular problems, best corrected visual acuity (BCVA) lower than 0.8 (20/25 on the Snellen chart) in one of the two eyes, refractive error greater than −4.50 D of myopia, +2.50 D of hyperopia and 1.50 D of astigmatism, or suffering from some ophthalmic or systemic pathology that affected vision or having used electronic devices one hour before the measurements. They had to have axial lengths (AL) between 22–24 mm to participate in the study.
2.2. Devices Used, Layout and Lighting
An Ebook, e-ink reader (ink pad 3, Pocket book International SA, China) model PB740, with a screen of 1404 × 1872 pixels, and an 8th generation iPad (Apple Inc, Cupertino, CA, USA) Model A2270, with a screen of 2160 × 1620 pixels, were used for reading tasks. In both devices, a white background and black letters of visual acuity 0.8, calibrated for the 50 cm at which the reading was made (+2.00 D accommodative demand), were used. The controlled maximum luminance of the Ebook was 79.60 cd/m2, and that of the iPad was 484.01 cd/m2, while the minimum luminance of the Ebook was 0.14 cd/m2, and that of the iPad was 1.56 cd/m2. Both reading devices were placed inside a controlled lighting cabinet to ensure optimal, repetitive, and correct lighting reaching the corneal plane of each participant in this study. To measure the conditions of maximum and minimum illumination that occur in the reading plane and in the corneal plane in each case, a luminancimeter (Konica-Minolta, LS-160) and a calibrated (NIST traceability) spectroradiometer model (STN-BLK-C-SR, StellarNet, Inc., Tampa, FL, USA) were used. They were used for analyzing the spectral power distribution in irradiance mode (µW/cm2) from 380 nm to 780 nm and connected to a computer.
Inside the cabinet, a luminaire with cool white LEDs (6670 K correlated color temperature) was used to achieve proper lighting levels, so 945.65 lx and 4.38 lx reached the reading surfaces at maximum and minimum lighting conditions, respectively; meanwhile, with these previous conditions, 216.82 lx and 1.32 lx were measured at the position where subjects would have their corneal plane during the reading tasks. In addition to the light provided by the cabinet according to maximum lighting conditions and turning on the electronic devices, reaching the corneal plane 264.15 lx was measured with the Ebook and 260.10 lx with the iPad. On the other hand, when the conditions of the cabinet were minimum illumination, as well as minimum luminance of the devices, 1.63 lx for the Ebook and 1.62 lx for the iPad were obtained at the same corneal plane, maintaining equivalent spectral irradiance data for every wavelength from 380 nm to 780 nm.
An IRX3 Shack-Hartmann device (Imagine Eyes, Orsay, France) was used to perform the aberrometric measurements under scotopic lighting conditions. This equipment has a near-infrared source (780 nm), which is imaged on the retina, and arrays of microlenses with associated sensors detect directional information of the wavefront of light generated from it. After blinking, measurements were taken focusing on the Purkinje images obtained by aligning the instrument axis with the eye’s pupil (axial conjugation between the instrument lenslet array and the eye’s pupillary plane). The manufacturer’s software automatically calculates the aberrometric data fitting the measured wavefront of a 4 mm fixed pupil diameter immediately after ending each five-minute reading task described previously. The real wavefront was analyzed with respect to the ideal to obtain the error of each measured eye in terms of total root mean square (RMS Total), low-order RMS (RMS LOA), and high-order (RMS HOA).
The AL was measured with the optical biometry IOLMaster®500 from Carl Zeiss Meditec (Carl Zeiss Meditec, Oberkochen, Germany) as the mean of 5 measurements and expressed in mm.
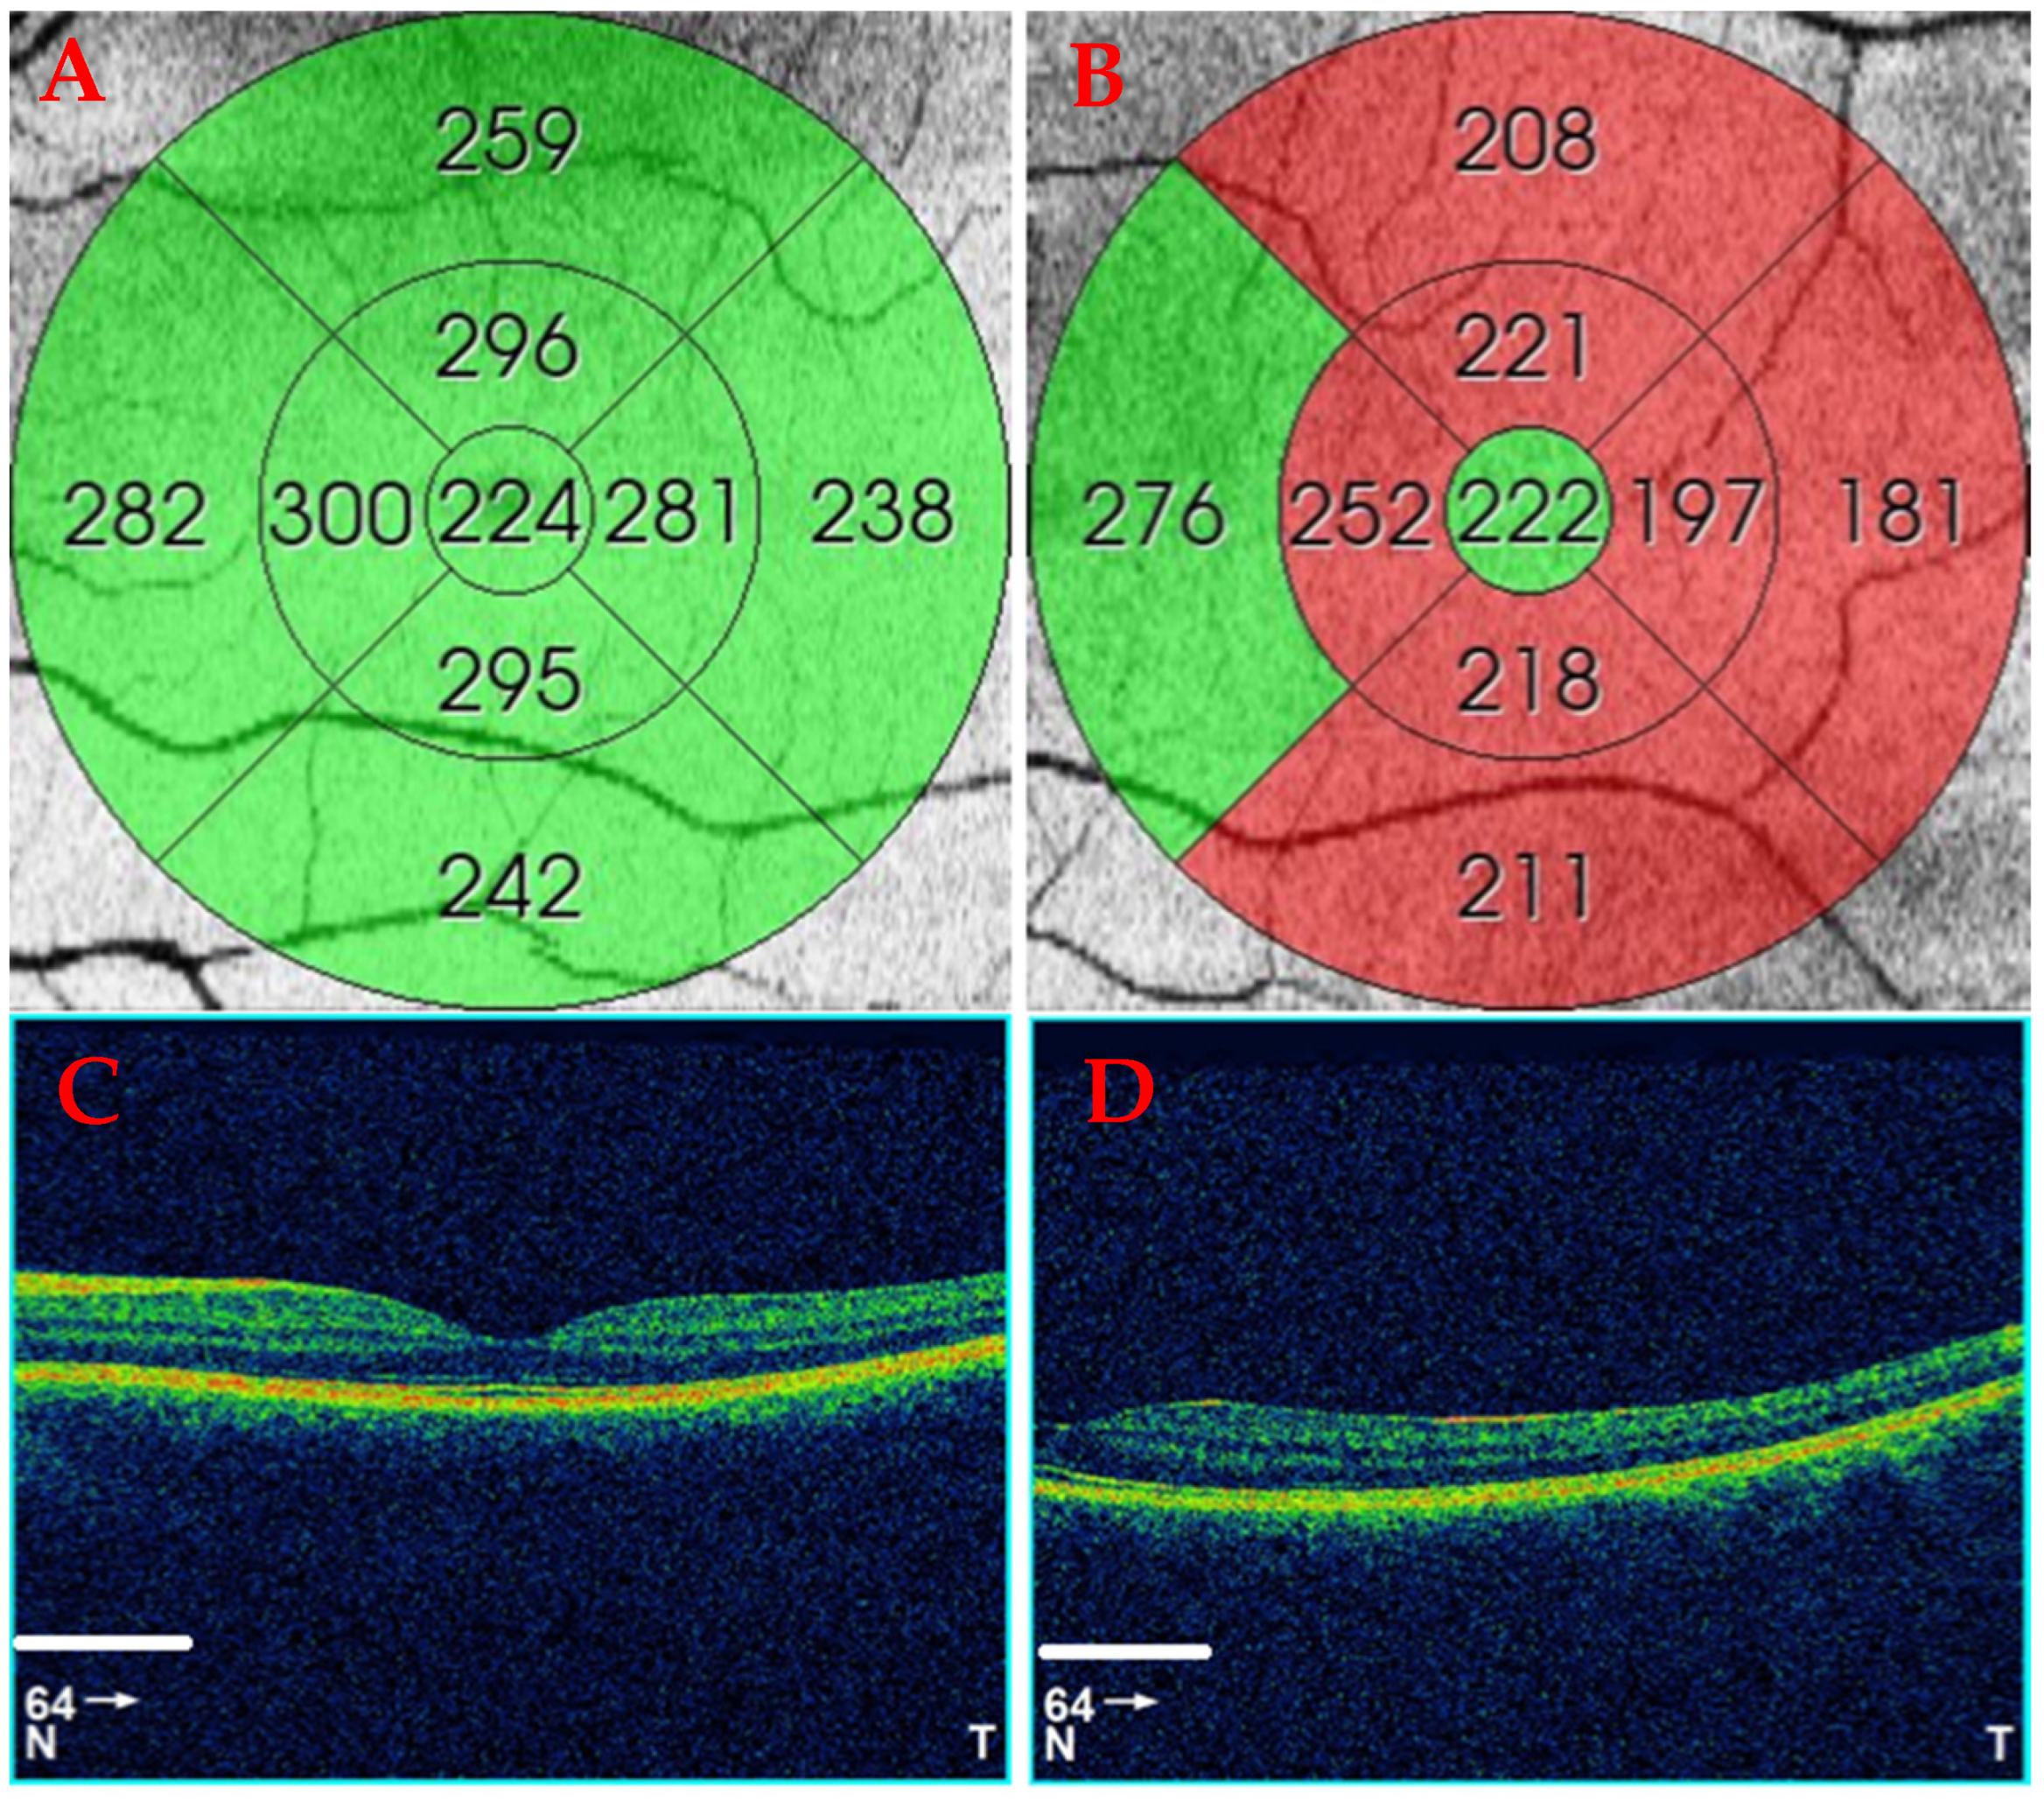
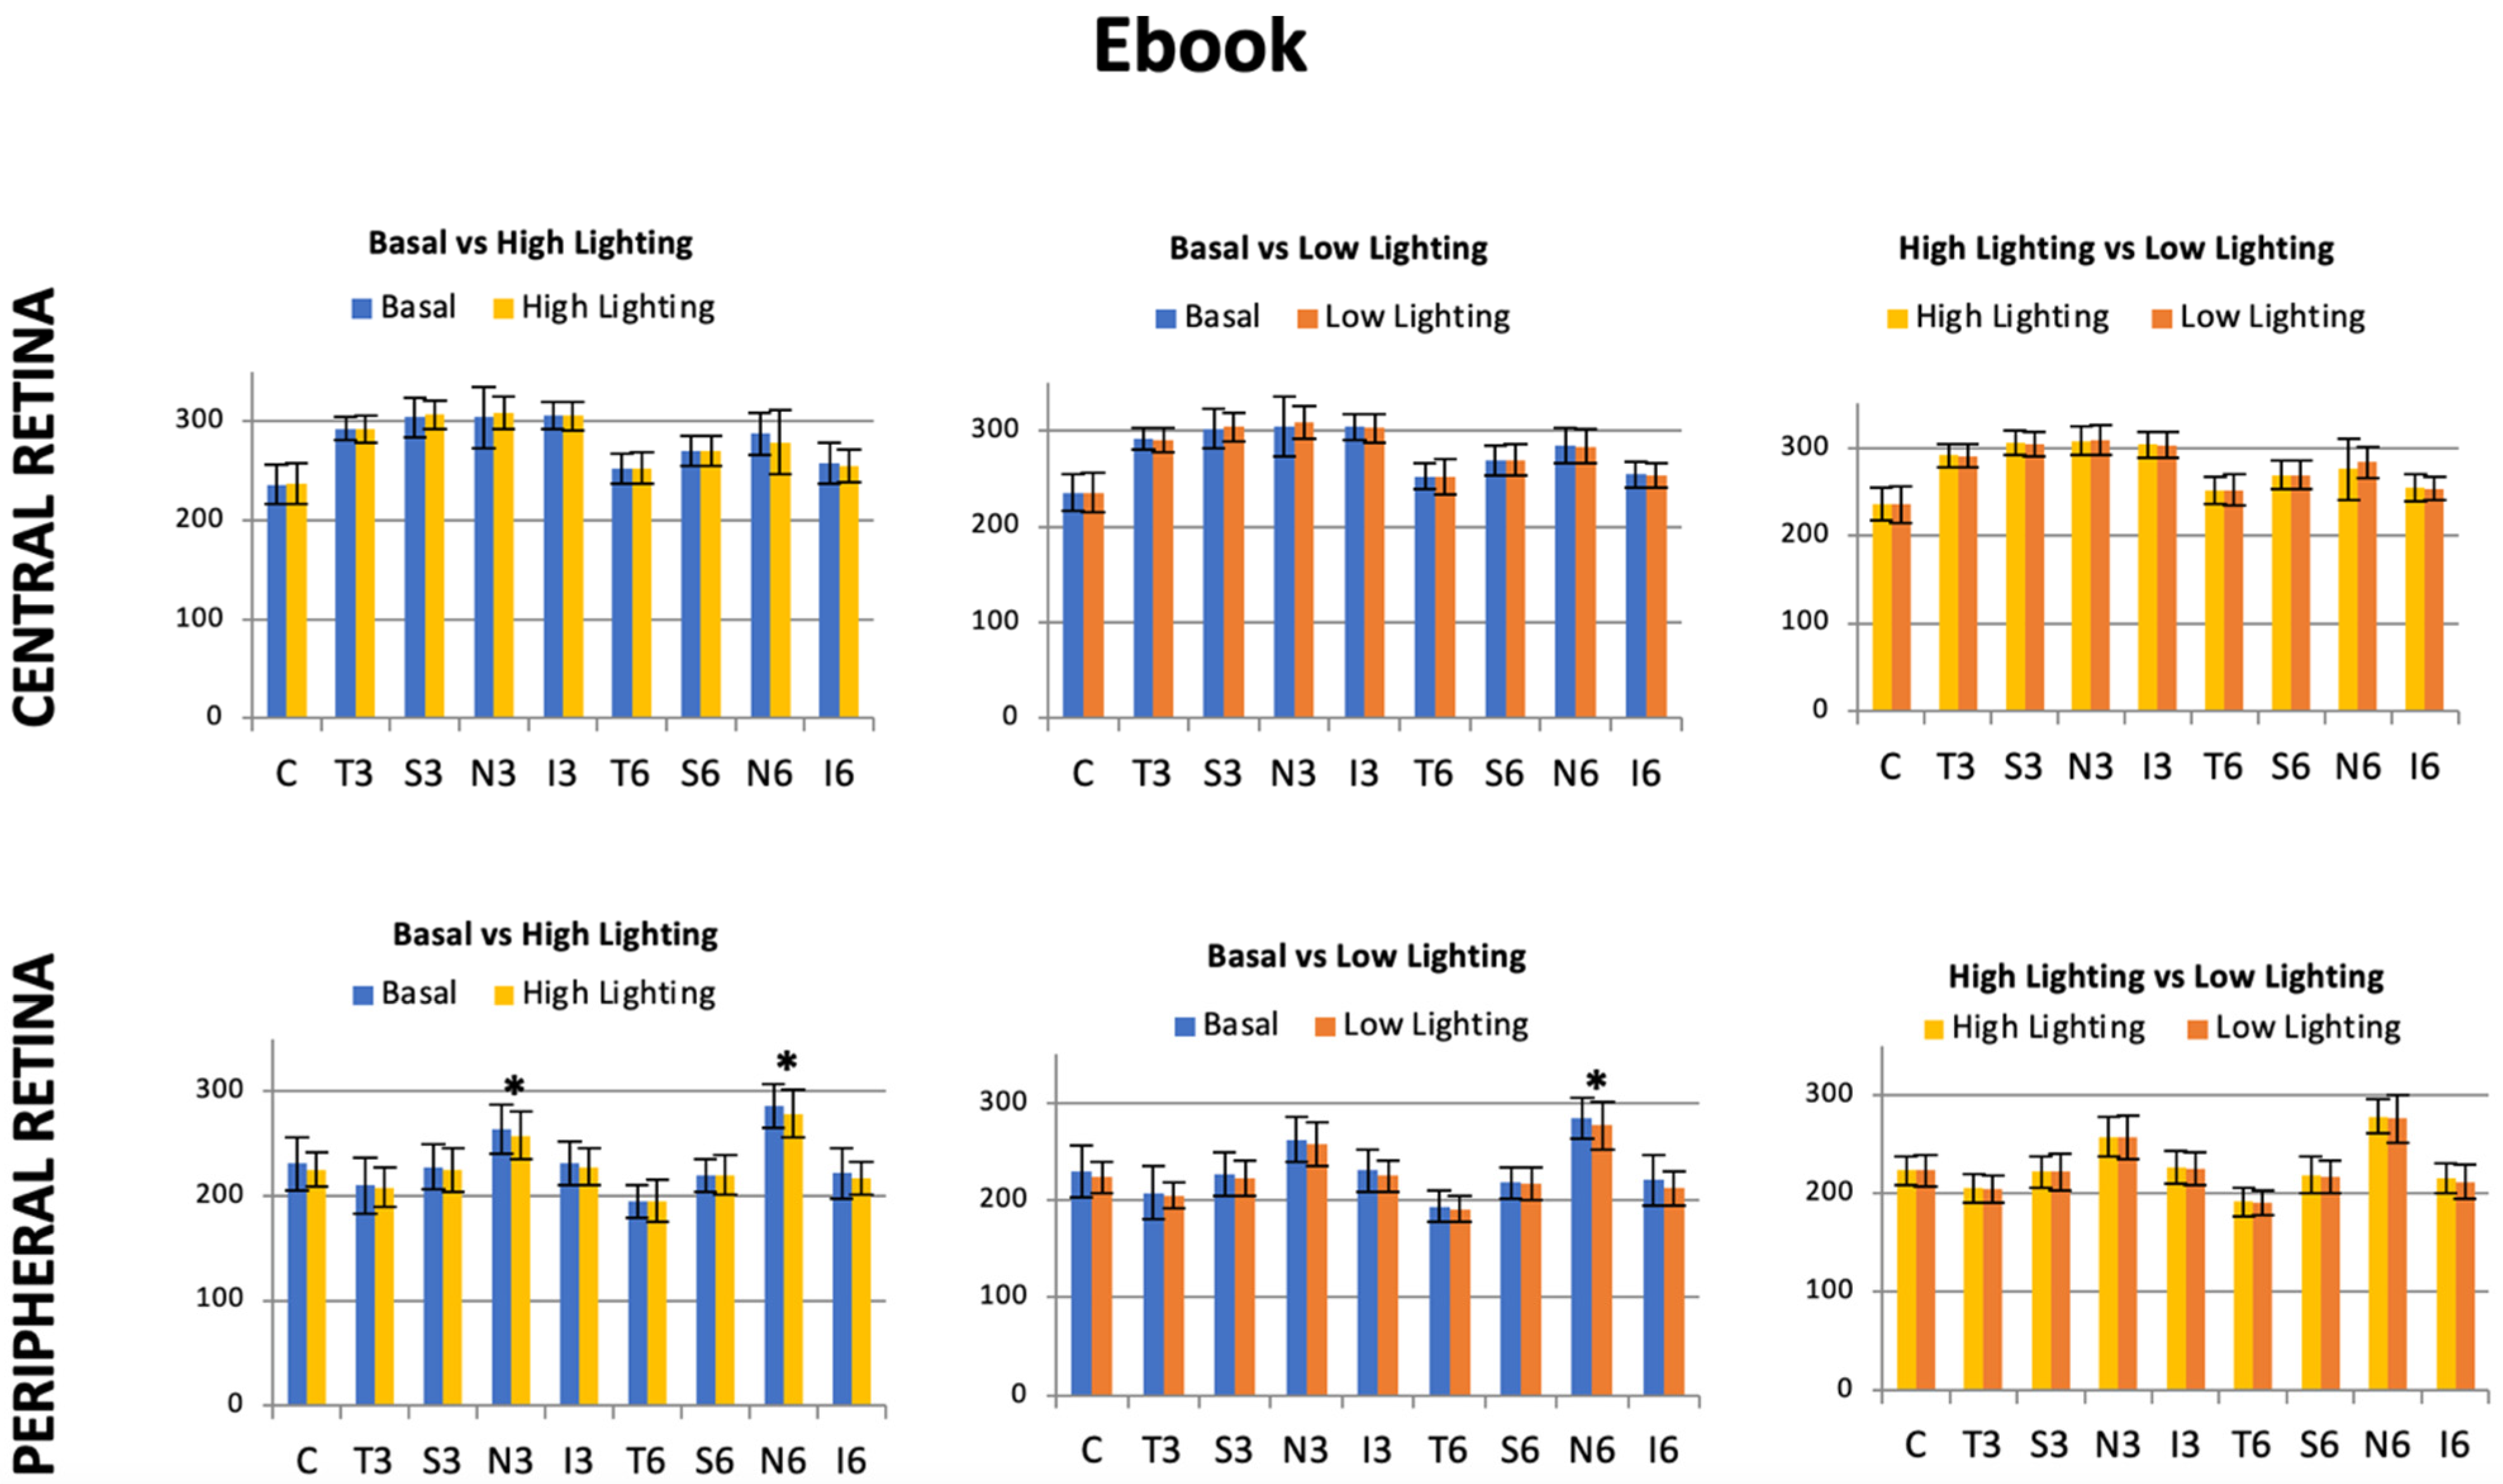
Each individual eye was imaged twice using a 3D OCT-1000 (Topcon Corporation, Tokyo, Japan). First, the subject was asked to look into the internal central fixation target to image the central retina, and then the internal fixation was moved horizontally 15° right for the right eye (RE) and 15° left for the left eye (LE) to image the temporal peripheral retina (
Figure 1). In both cases, the macular cube protocol was performed. It provides a circular macular map analysis, divided into nine sectorial thickness measurements in three concentric circles with diameters of 1, 3 (inner), and 6 (outer) mm, forming the 9 Early Treatment Diabetic Retinopathy Study (ETDRS) area grid. The central or subfoveal area (1 mm, C), the 3 mm parafoveal ring with four areas, temporal inner (T3), superior inner (S3), nasal inner (N3), inferior inner (I3), four other areas belonging to the 6 mm perifoveal ring, temporal outer (T6), superior outer (S6), nasal outer (N6), and inferior outer (I6), were used to study the total retinal thickness (
Figure 1). Once the macular maps were automatically segmented to obtain total retinal thickness from the internal limiting membrane (ILM) to Bruch’s membrane (BM), the thicknesses were shown in every ETDRS area. The quality of the scans was checked, and poor-quality scans were rejected.
2.3. Experimental Protocol
The participants were asked not to use any type of electronic device one hour before taking the readings and not to perform close-up tasks so that it would not interfere with the baseline aberrometry and OCT measurements. The OCT images and aberrometry were always performed by the same observer between 4:00 p.m. and 7:00 p.m.
Aberrometry and central and peripheral OCT measurements were performed in scotopic conditions upon arrival of the participant and before starting any reading that would serve as baseline measurements. The participant stood with their chin and forehead resting on the chin rest 50 cm from the reading device (iPad or Ebook), with the text calibrated for a visual acuity of 0.8.
The subjects would take four readings of 5 min, each according to the four randomized assumptions to avoid bias in the measurements due to adaptation to light conditions: high ambient illuminance level (945.65 lx) with maximum iPad luminance (484.01 cd/m2); high level of ambient illuminance (945.65 lx) with maximum luminance of the Ebook (79.60 cd/m2); low ambient illuminance level (4.38 lx) with iPad minimum luminance (1.56 cd/m2); and low level of ambient illuminance (4.38 lx) with minimum luminance of the Ebook (0.14 cd/m2).
After each reading, an aberrometer measurement and both OCT images, one for the central retina and the other for the temporal peripheral retina, were taken again. There was a 15-min break between readings in which the subject was also unable to use electronic devices or perform close-up tasks.
2.4. OCT Image Segmentation Algorithm
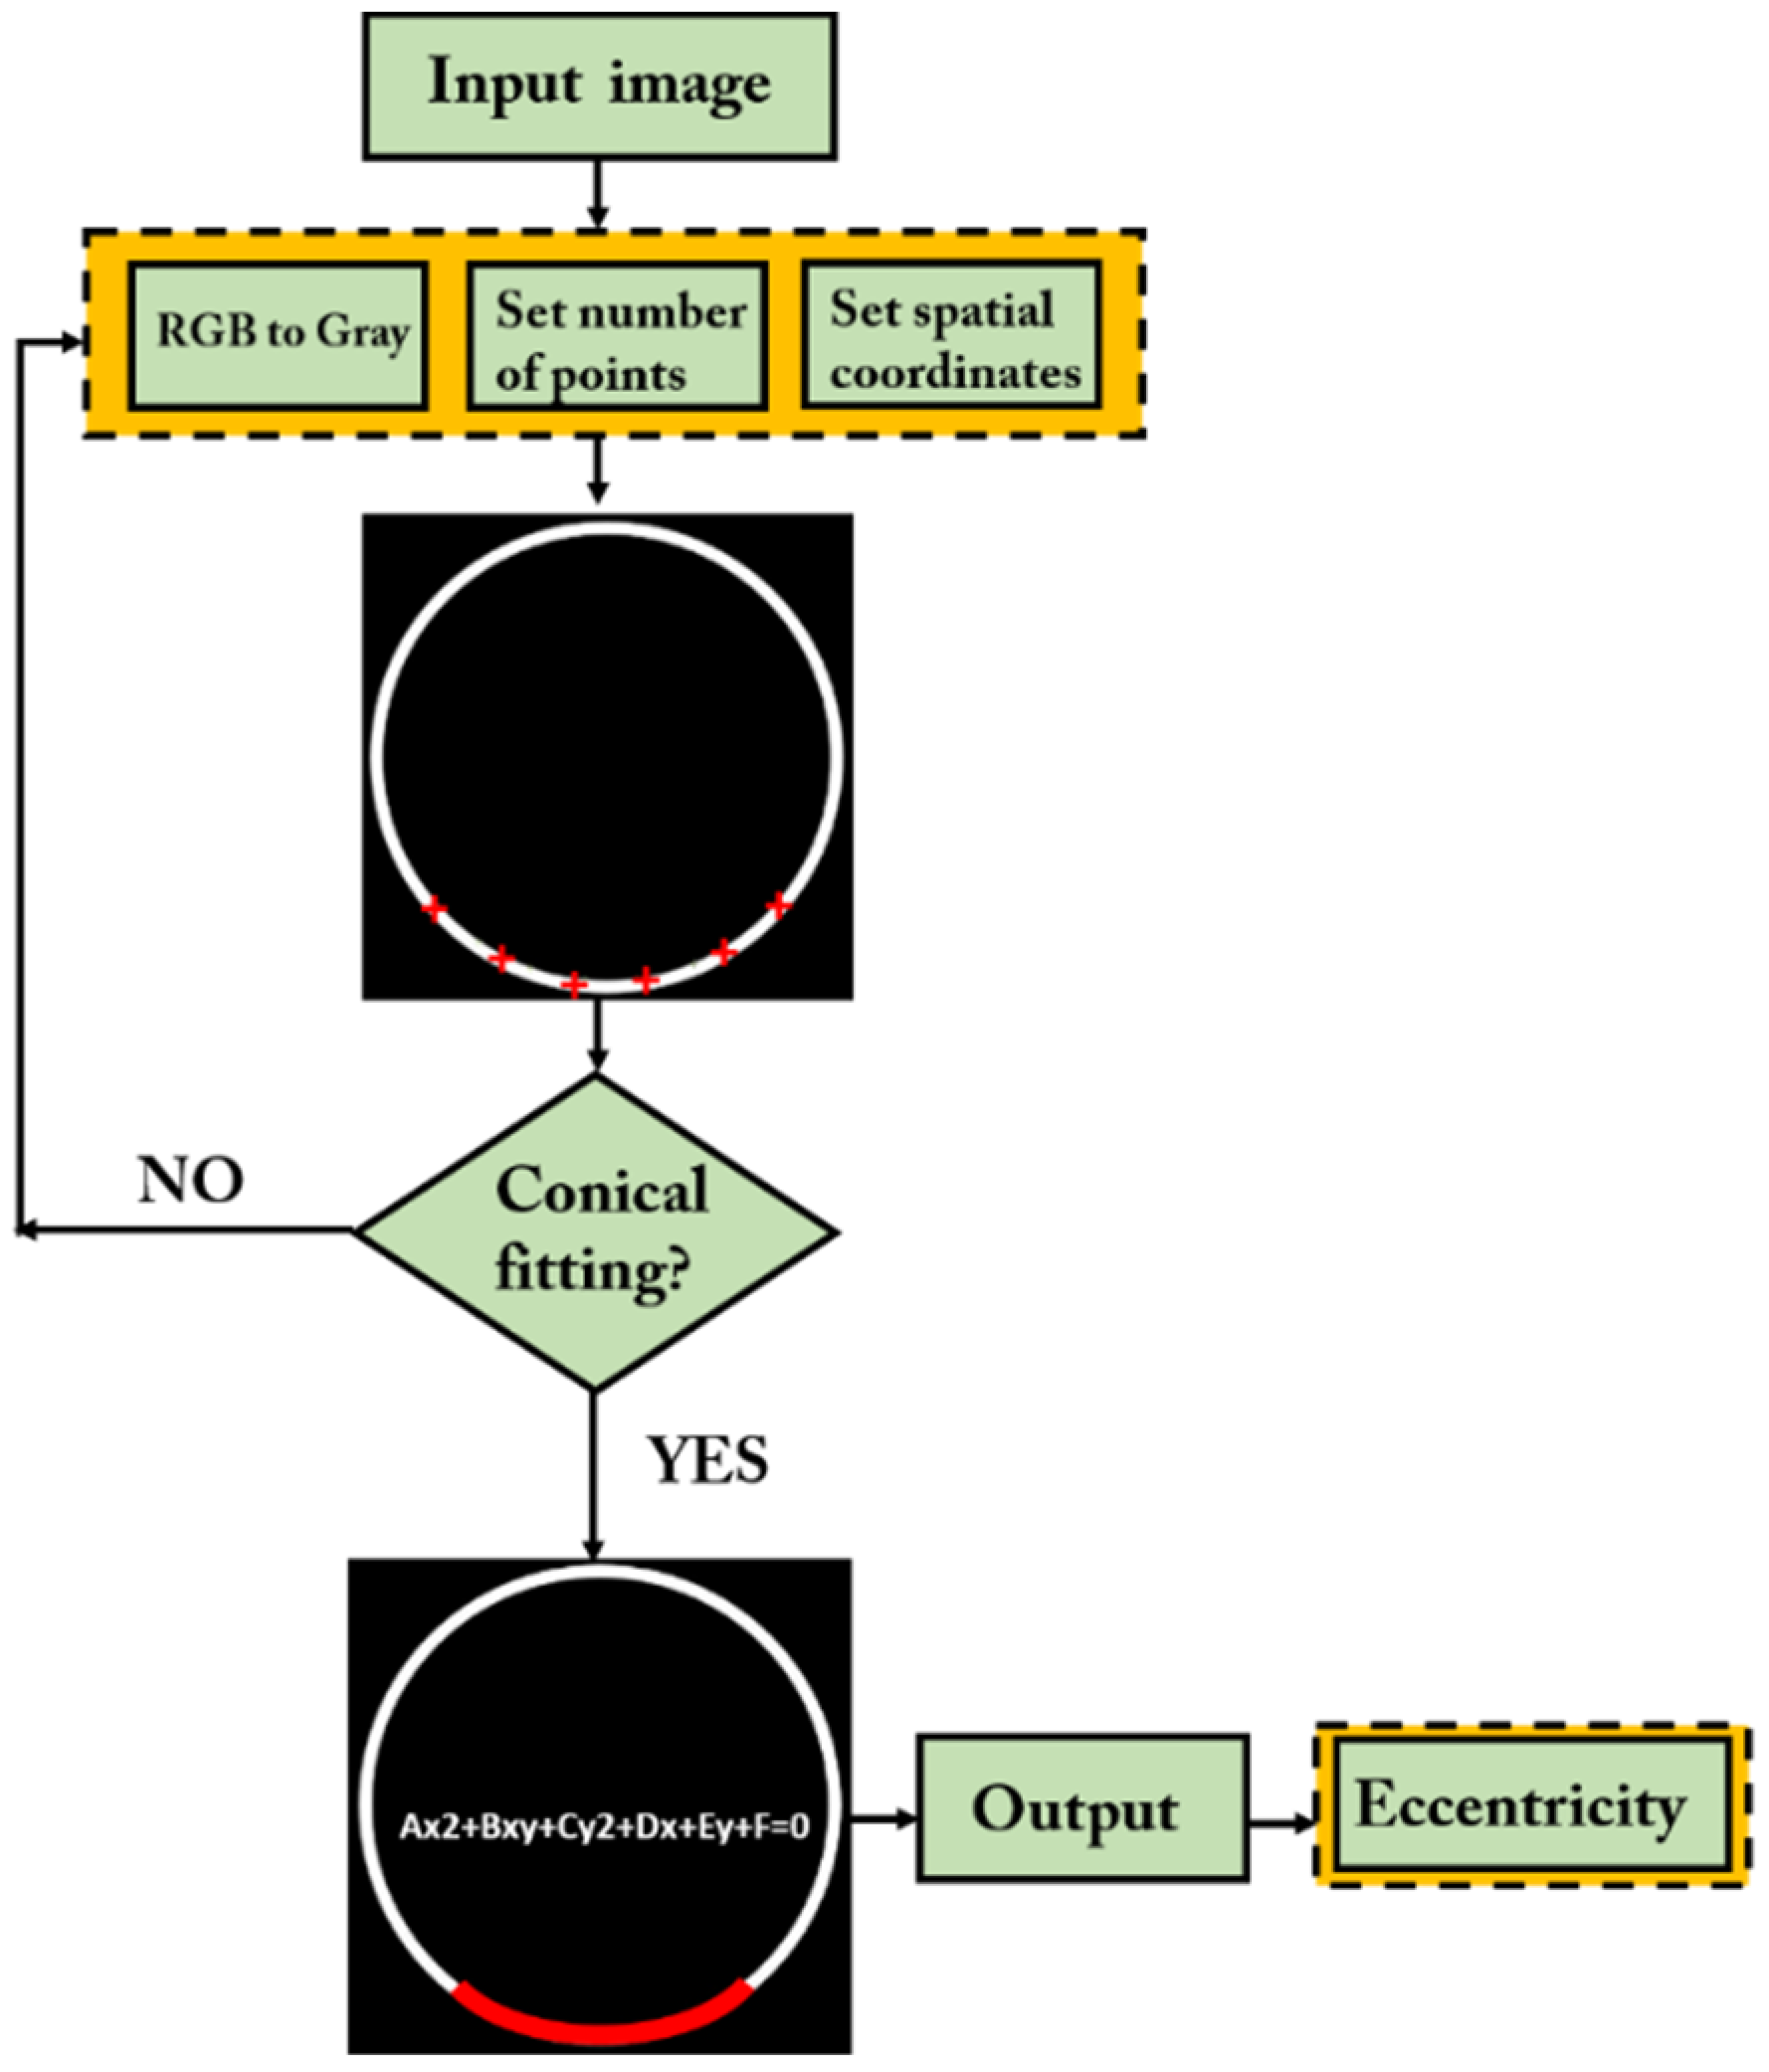
A custom-written algorithm in MATLAB (R2020a, Mathworks, MA, USA) was applied to obtain retinal segmentation at the retinal pigment epithelium (RPE) layer and then obtain a conical fitting to compute the eccentricity values of the retinal shape in both central and peripheral locations as described in the previous subsection.
Figure 2 shows a flux schematic diagram of the proposed algorithm proposed in this work. First, the program reads the input raw OCT image and converts it from RGB color to an 8-bit image (RGB to gray). Next, the program uses the Canny filter for automatic edge detection of the RPE.
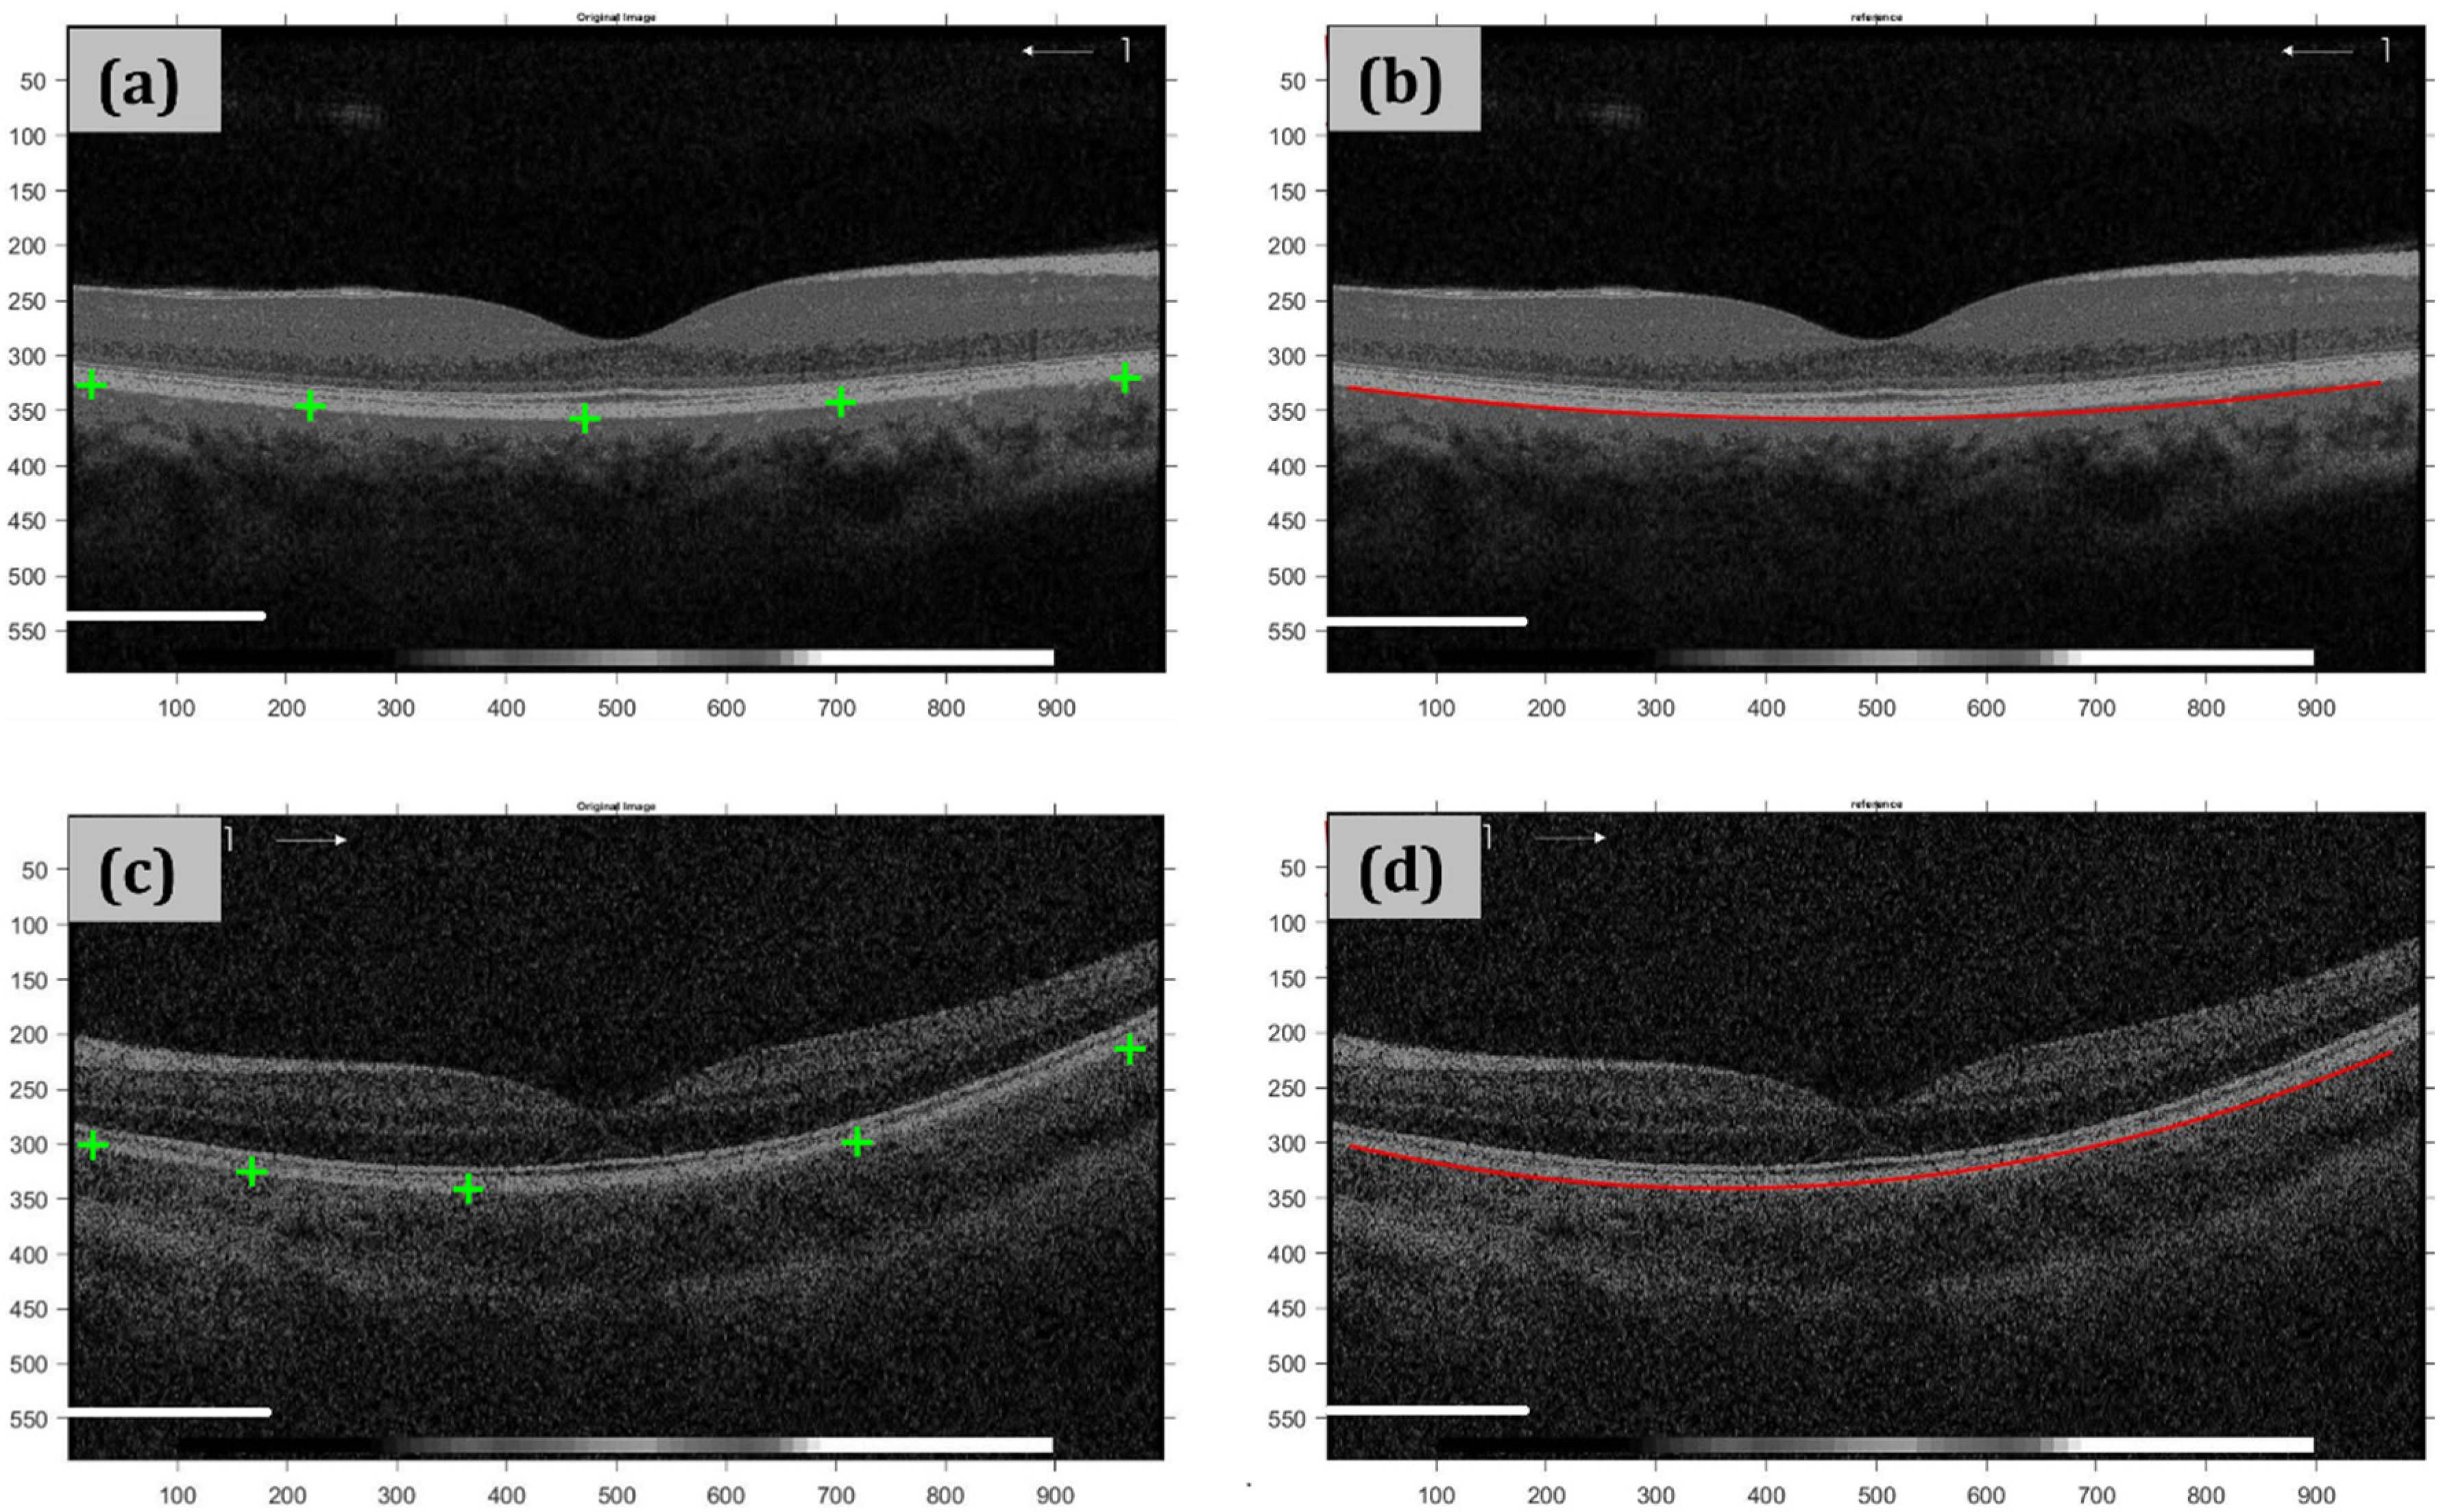
Figure 3 shows an example of RPE segmentation in two different OCT images.
Once the length of the RPE through the entire image is known, the user selects the minimum number of points over the epithelium edge from which the spatial coordinates will be calculated. Once the coordinates are obtained, the program computes a conical fitting. If a conical equation can be obtained, the eccentricity is computed from its coefficients. Otherwise, the program asks the user to set a different number of points to obtain a new set of spatial coordinates.
2.5. Statistical Analysis
The measurements of the variables to be studied were recorded in an Excel database (Microsoft Office Excel 2011, Microsoft Corporation). Statistical analysis was performed using the Statistical Package for the Social Sciences (SPSS 20, SPSS Inc., IBM Corporation, Somers, NY, USA). Normal distribution of the values was studied with the Kolmogorov-Smirnov test. To compare retinal thicknesses and aberrometries under the different lighting conditions, the paired sample t-test and the Wilcoxon signed-rank test were used, respectively, since the retinal thicknesses have a normal distribution and the aberrometries did not. All retinal shape analysis was performed with MATLAB (R2020a, Mathworks, MA, USA). A p value < 0.05 was considered statistically significant.
4. Discussion
The current study investigated the influence of lighting on retinal shape and thickness in young adults after five minutes of accommodative stimuli. Before and after reading tasks with different lighting conditions, in vivo on-axis and off-axis retinal imaging was performed using OCT. Additionally, custom-made software was used for distortion correction of the central 9 mm arrangement of the foveal centered OCT scan to evaluate changes in retinal thickness and curvature, taking the RPE as a reference. On-axis aberrometry was performed before and after these reading tasks to ensure that eyes recovered their visual reference state and, therefore, structural changes were analyzed without visual dependence. The performed statistical analysis could be of greater correlation between the two eyes of an individual compared with the correlation between two individuals, since both eyes were under the same ambient light conditions, found results remain valid and consistent [
19,
20].
Although there are large differences in the findings from diverse studies, it remains an open question about how lighting can influence the shape of the retina and, consequently, diseases such as the progression of myopia related to near tasks and low lighting levels [
21]. There is evidence that choroidal thickness is highly dependent on ametropia, with reduced choroidal thickness in less hypermetropic eyes [
1]; during accommodation, the eyes momently become more myopic, so the findings in this study can offer a new viewpoint to understand this question. First, electronic devices in general are considered to be a potential cause of myopia progression due to the maintained accommodative demand produced by their use [
22]. The absence of aberrometric differences between the baseline and the posterior reading with both e-ink and iPad suggests that, concerning the accommodative stimuli, both are indeed very similar after short-term near visual tasks. This implies that the ability of the lens to focus on the retina is highly influenced, at least, by the age of the subjects and their visual quality. In our study, all the subjects were under 33 years old and had both good accommodative quality and quantity. Meanwhile, we found, in each subject, different aberrometric profiles as baseline, and reading tasks changed them to be recovered as soon as the near tasks were concluded, irrespective of the device used or the light level. These results are supported by the 6 mm ETDRS central grid, in which the retinal thickness analysis had a similar behavior to the aberrometric results previously described.
As shown by this study, the peripheral retina seems to have a different behavior after finishing near tasks; its shape is modified by the reading requirements, and its recovery is not complete or is slower than that of the central retina. In particular, the more curved the retina, the thinner it is in a cross-section of 6 mm to 9 mm from the fovea to the temporal side, signifying a peripheral hyperopic defocus. In this study, both temporal curvature and thickness suffered combined modification, suggesting a delay in the recovery of the structural characteristics.
Regarding the spectral power distribution of the lighting, both luminance and spatial frequency content of the stimuli and axial blur on retina have all been demonstrated to be myopigenic cues when they are temporally maintained [
23]. Meanwhile, our results show an instantaneous off-axis modification that, in this case with our custom-made software, has been evaluated on a unique section of the central retina. To avoid limitations in the study and to have a wider area, the ETDRS analysis performed with OCT showed important structural changes in both thickness and volume that cannot be omitted or attributed to the accommodation because both electronic devices are located at the same distance to the observer, producing the same +2.00 D accommodative stimuli.
During reading tasks, accommodation occurs, and anatomical changes are present to focus near stimuli on the retina. It has been previously reported that, in addition to dimensional changes in the anterior segment, during maximum accommodation in young adults, the retinal thickness was reduced, although in a 4 mm × 4 mm macular area centered at the fovea. In this sense, no significant quadrant-dependent difference in retinal volume change was found, which indicates that neither retinal stretching nor distortion was quadrant-dependent during accommodation [
24]. Although this occurs, retinal modifications are supposed to be instantaneously correlated with accommodation and disaccommodation, and found in the central retina, but our results show peripheral modifications that could be a consequence of light because all stimuli demand the same accommodation, in this case +2.00 D.
Choroid plays a potential role in eye growth regulation. Changes in choroidal thickness accompany eye growth, being more marked in highly myopic eyes, leading to choroidal thinning [
1]. In fact, a small but significant choroidal thinning was observed at the 6 D accommodation demand, which was greatest in the temporal and inferotemporal parafoveal choroid and increased with increasing eccentricity from the fovea. The regional variation in parafoveal thinning corresponds to the distribution of nonvascular smooth muscle within the uvea, which may implicate these cells as the potential mechanism by which the choroid thins during accommodation [
4].
Another study by Breher et al. [
25] evidenced changes in choroidal thickness, horizontal retinal radius of curvature, and the horizontal-vertical growth ratio, showing significant correlations with axial length and/or refractive error. Thus, retinal shape and choroidal thickness, but not foveal pit morphology, are altered by myopia-induced eye growth. Something similar was observed in the present study, with thinner peripheral retinas and changes in eccentricity after reading with both devices and different lighting conditions, due to the influence of accommodation rather than myopia.
Hoseini-Yazdi et al. [
26] suggested that environmental light regulates ocular growth through mechanisms that may be mediated by melanopsin retinal ganglion cells (mRGCs). In their study, they aimed to examine the choroidal thickness changes following brief stimulation of melanopsin-expressing mRGC axons at the optic disc with blue light in a group of healthy emmetropic and myopic subjects. Sustained refractive error-dependent thickening of the choroid was observed, with brief optic disc stimulation with blue light. This choroidal response may be related to a short wavelength sensitive mRGC signaling pathway, given the lack of a choroidal response with red light stimulation.
On the other hand, the study by Li et al. [
27] provides a quantitative reference for the impacts of the expansion in retinal contour on ocular aberrations. This is useful for the wide-angle eye modeling procedure, indicating that finer modeling of the retinal contour is required to achieve a more accurate prediction of peripheral defocus at the last step of the eye modeling procedure. In addition, this study offers new perspectives to investigate the optical mechanism of myopia progression, and the unique role of astigmatism in retinal growth has been discovered. This suggests that further longitudinal studies should be performed to follow peripheral aberrations and peripheral eye longitudes across the two-dimensional visual field in significant astigmatism. This represents a potential approach to uncovering optical features that can directly manipulate myopia progression or its activation with accommodation after long periods of reading.
Regarding retinal shape, a few studies have reported changes in the refractive power of the eye as a function of the light level conditions [
28,
29,
30]. In that sense, night myopia is the modification (increase) in ocular refraction in low light conditions [
31]. Prior to our work, retinal shape was described as a function of conical equations using magnetic resonance imaging. A study reported by Verkicharla et al. [
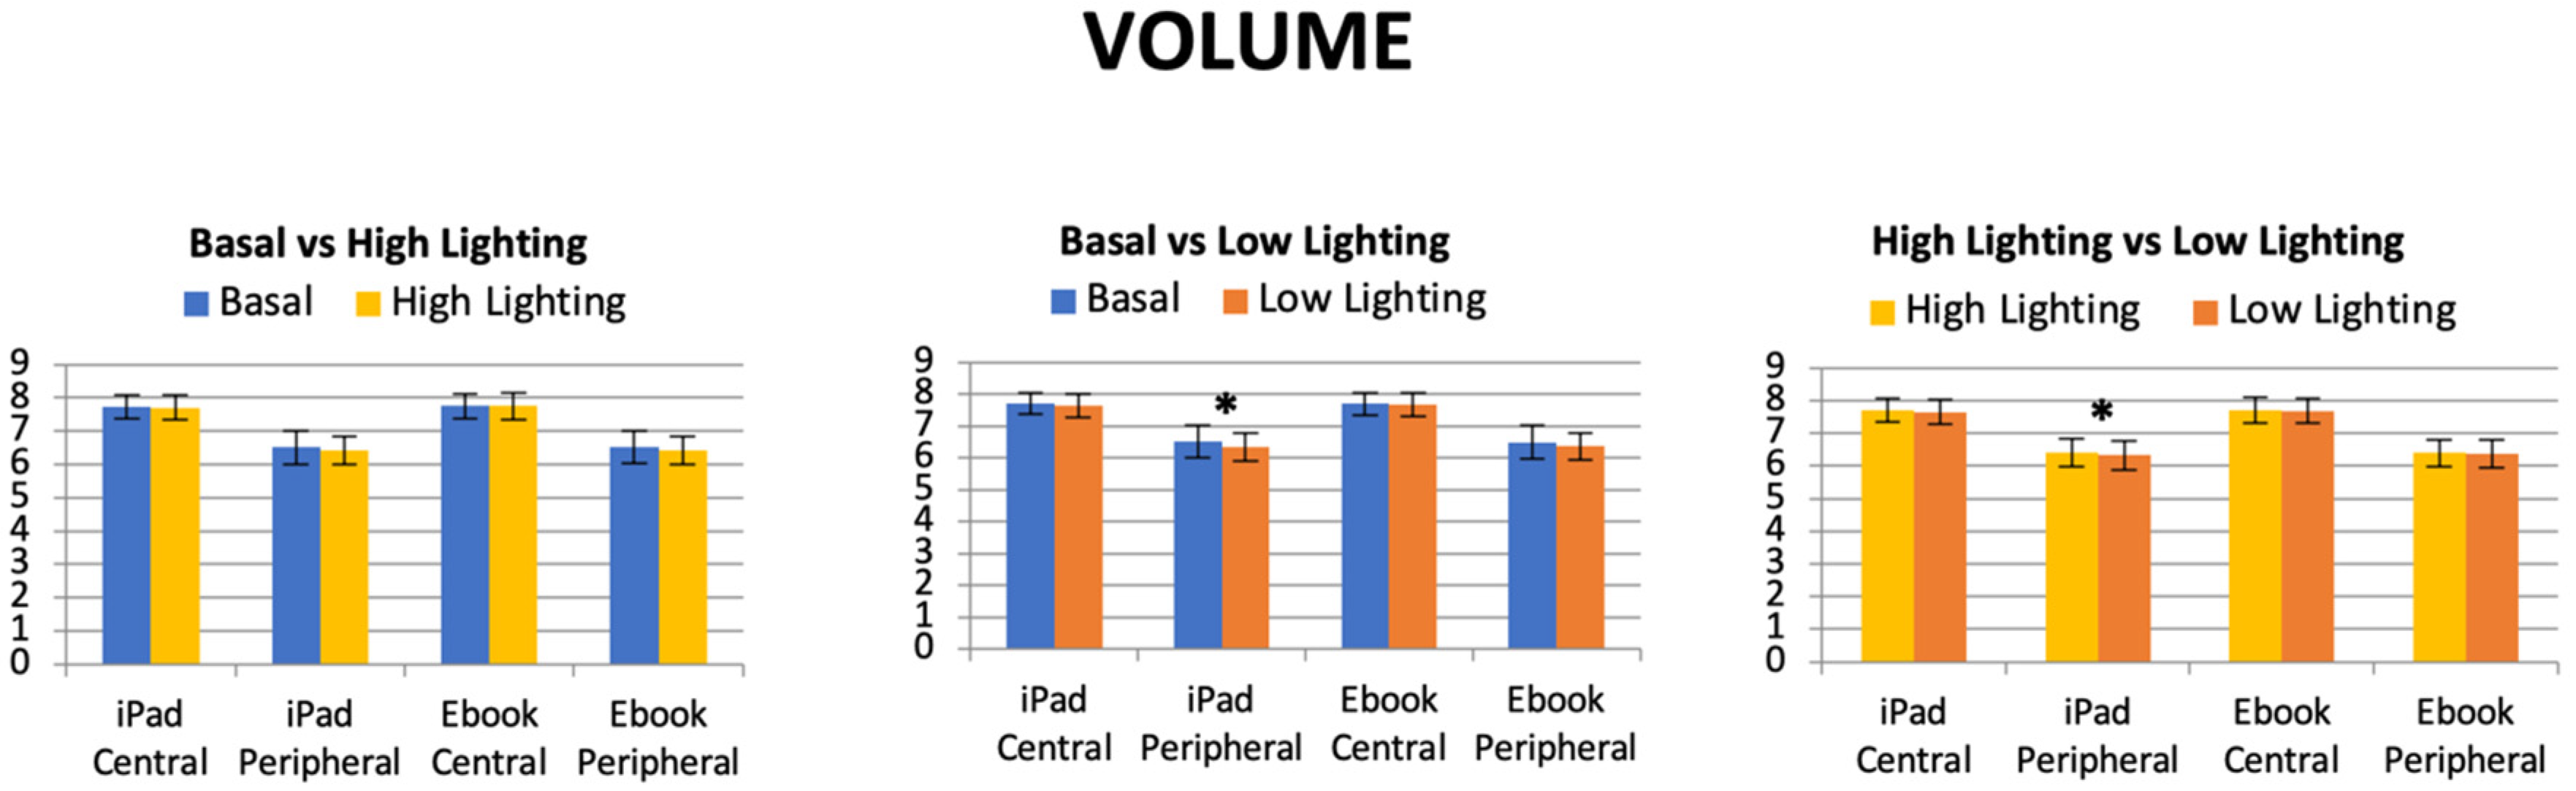
32] concluded that, in myopia, the retinal shape tends to steepen at the posterior pole and flatten far from the pole. Then, if light conditions can induce the so-called night myopia phenomenon and retinal shape is sensitive to ocular refraction, it is consistent to ask if retinal morphological changes can occur while reading under variable light conditions. Since the luminance of the screens were somewhat different, especially at maximum lighting conditions, it was found that the higher the iPad light, the higher the retinal peripheral volume (6.40 ± 0.41 mm
3 high lighting volume vs. 6.32 ± 0.44 mm
3 low lighting volume;
p = 0.023), as was described in the results section and
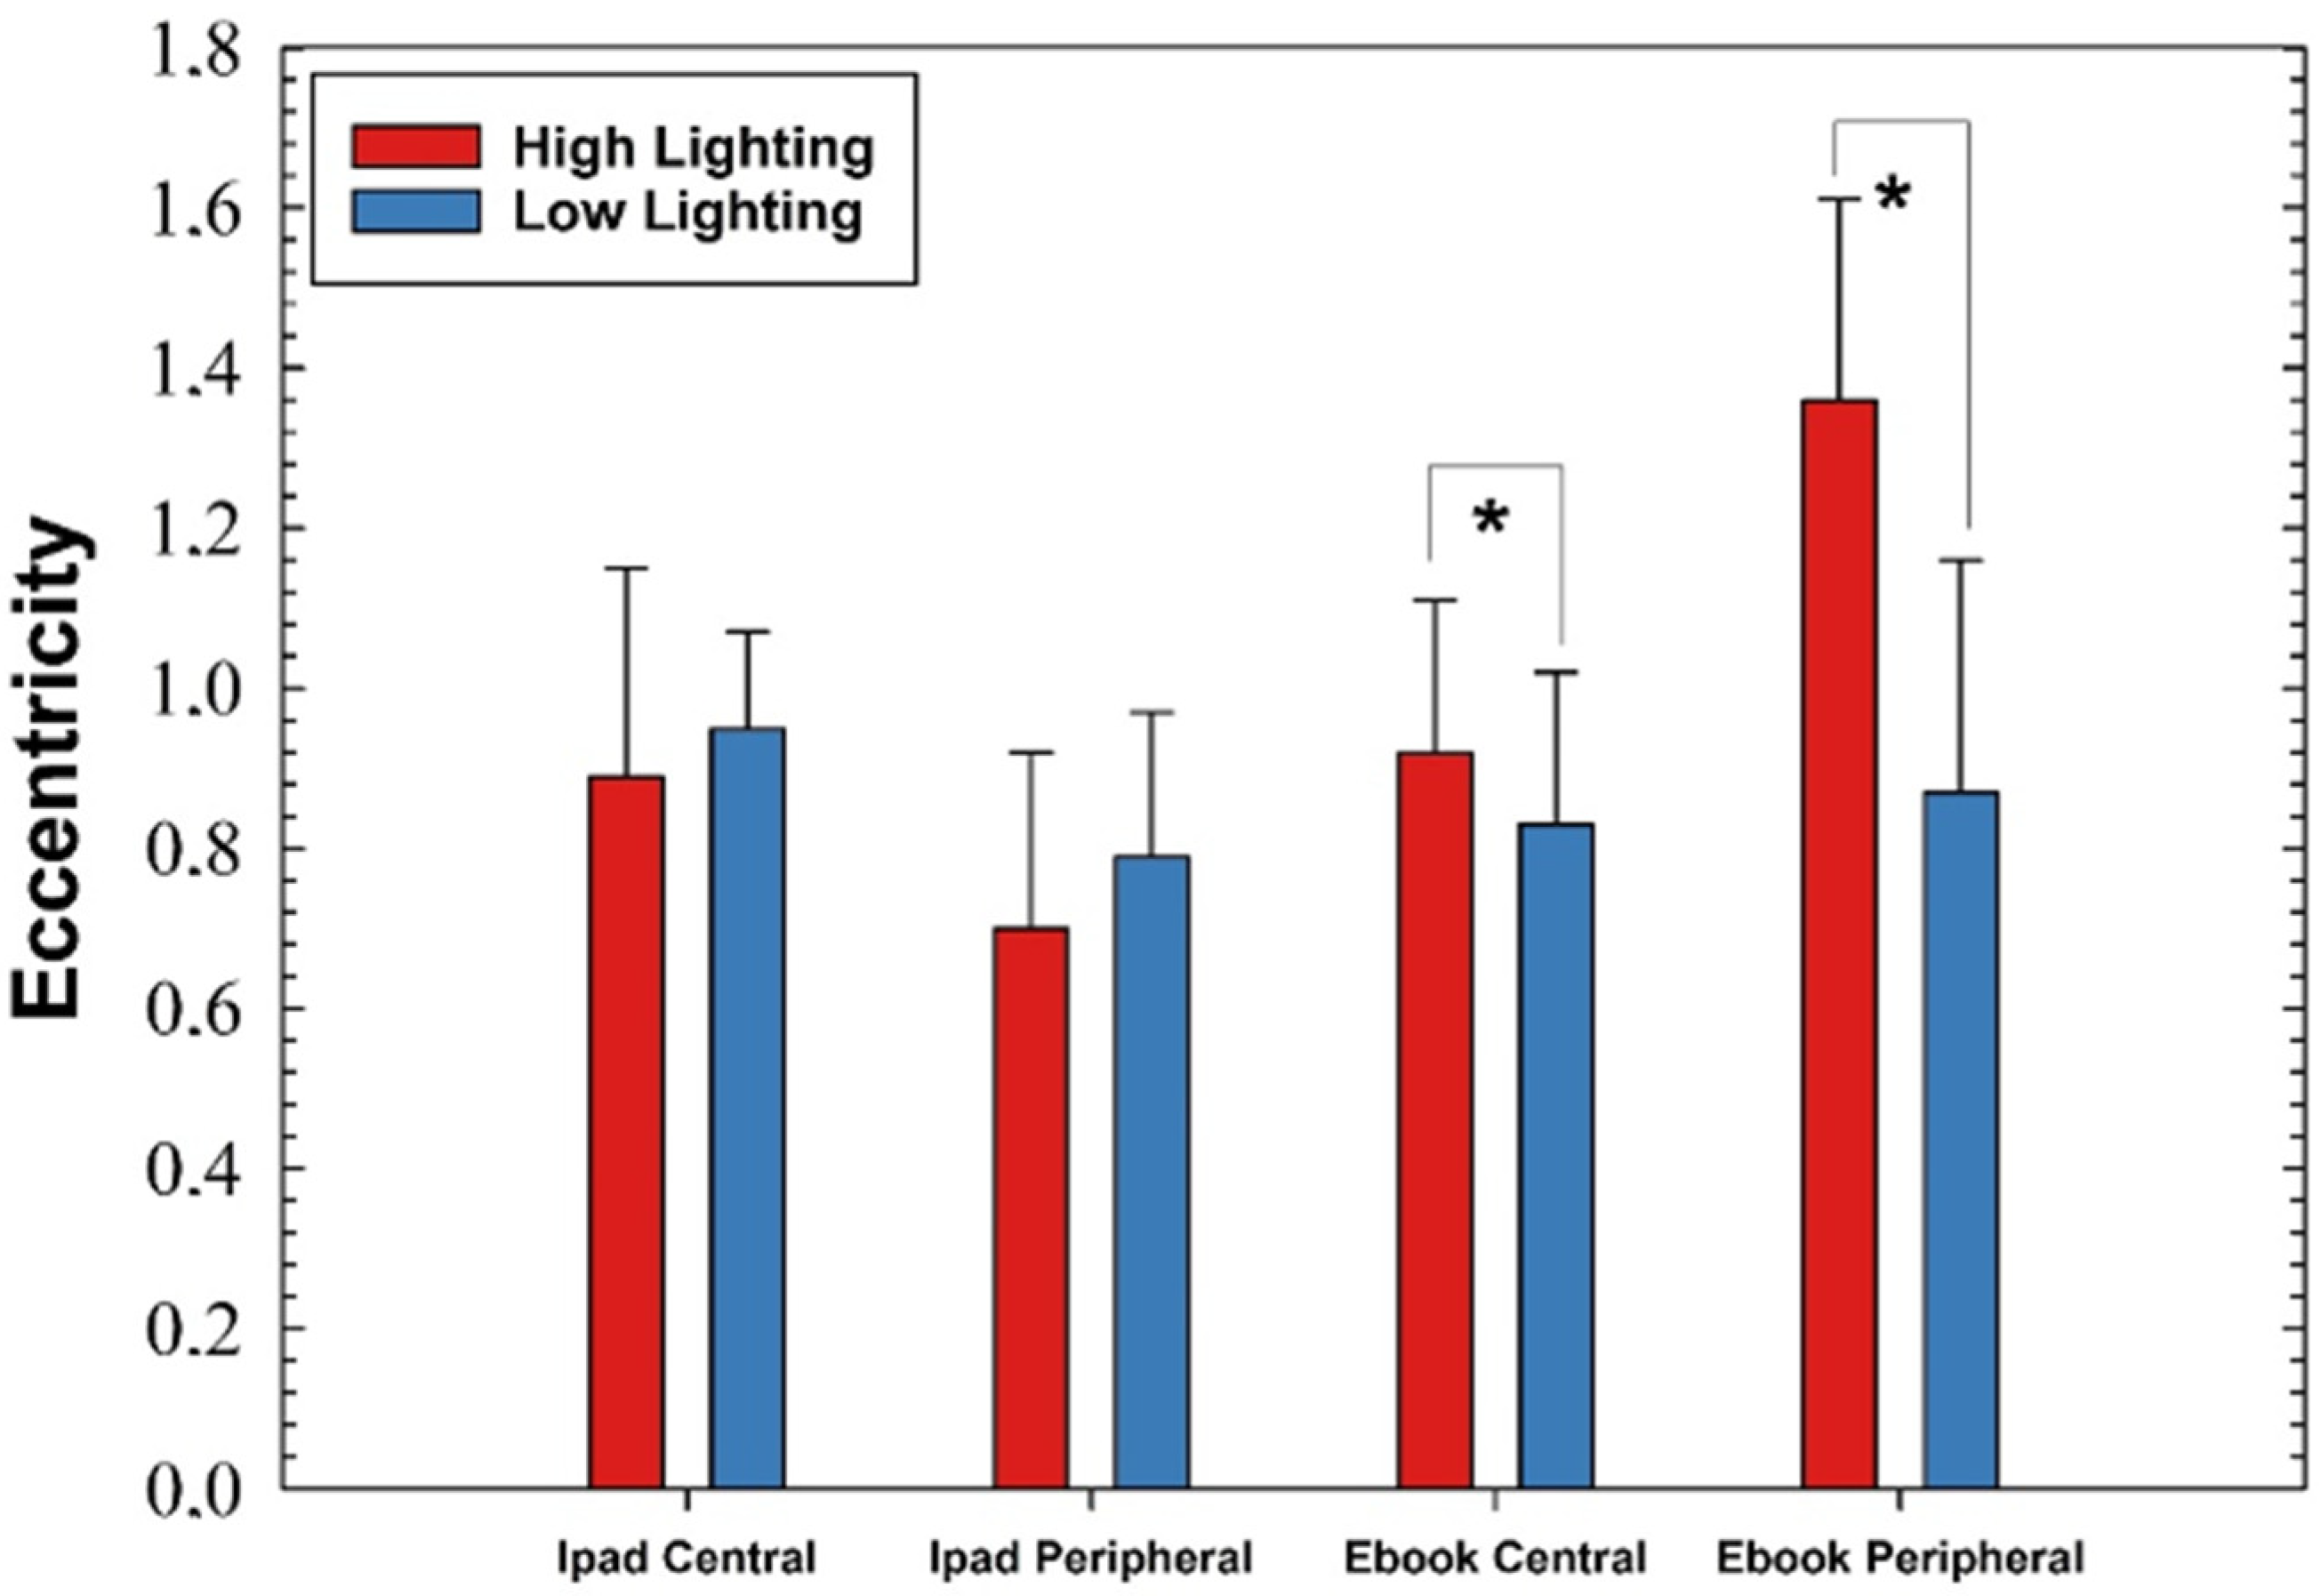
Figure 6, and no differences were found when reading with an Ebook, which was evaluated. Our developed retinal segmentation algorithm that was applied to OCT images acquired for the different reading and light level conditions described in Methods revealed lower eccentricity values at the peripheral locations than the central retina (i.e., tendency to a more parabolic shape at the periphery). At the central retina, the computed eccentricity values were significantly lower in high-level conditions while reading with the iPad with regard to the basal values. At the periphery, both with iPad and Ebook devices showed significant changes in retinal shape in both high- and low-light conditions (see
Figure 8).
Finally, when comparing the relative changes in eccentricity while reading a single electronic device as a function of the lighting level, significant changes were found for the Ebook device only (
Figure 8). In both the central and peripheral retina, the eccentricity values were significantly lower under low light conditions. In addition, the retina significantly tended to change from a parabolic into a hyperbolic shape from the center to the retina.

 ,
, 


