Article

An Effective Method for Gas-Leak Area Detection and Gas Identification with Mid-Infrared Image

1
College of Engineering, Southern University of Science and Technology, 1088 Xueyuan Avenue, Shenzhen 518055, China
2
Shenzhen Institute of Advanced Technology, Chinese Academy of Sciences, Shenzhen 518055, China
3
The School of Resources and Environment, University of Electronic Science and Technology of China, Chengdu 611731, China
*
Author to whom correspondence should be addressed.
These authors contributed equally to this work.
Photonics 2022, 9(12), 992; https://doi.org/10.3390/photonics9120992
Submission received: 27 October 2022 / Revised: 24 November 2022 / Accepted: 9 December 2022 / Published: 16 December 2022
(This article belongs to the Special Issue Mid-Infrared Integrated Photonics)

Abstract

:
Mid-infrared imaging systems are widely applied in gas-leak detection. However, infrared images generally suffer from low contrast and poor quality. In this paper, an image-enhancement method based on Gaussian filtering and adaptive histogram segmentation is proposed to effectively improve the quality of infrared images. It can effectively improve the quality of infrared images, which contributes to the subsequent gas-image feature extraction. The traditional background modeling algorithm is analyzed, and the ViBe (visual background extractor) algorithm is studied in depth. Based on the advantages and disadvantages of the ViBe algorithm and the characteristics of gas-leak images, a gas-leak region detection method based on the improved ViBe algorithm is proposed. The test results show that it can quickly establish a background model, segment the gas-leak region with motion characteristics, and render the gas-leak region in color based on grayscale mapping to achieve the automatic detection and enhanced display of gas leaks.

1. Introduction

With the rapid development of industry, a variety of toxic gases are widely used [1]. Their storage and transportation are critical and very important. Once the gases leak, it may cause an explosion and other accidents. Efficient gas-leak detection technology helps to detect and deal with gas leaks immediately. Infrared spectral-imaging detection technology is one of the important means of gas-leak detection [2]. Compared with traditional point gas sensors, infrared spectral-imaging detection technology has the advantages of long detection distance, large coverage and wide detection range, and gas can be directly imaged.
Gas sensors are often used in gas-leak detection. They can be divided into the semiconductor type, electrochemical type, and infrared absorption type, etc., according to the working principle. Gas sensors have the advantages of short detection time, high sensitivity and no field sampling [3]. Most conventional gas sensors can only detect the target gas at a single point. Therefore, they cannot realize real-time dynamic monitoring on a large scale and cannot effectively reflect the distribution of leaking gas in space [4].
Infrared imaging can be divided into two categories: active imaging and passive imaging. Active-imaging technology requires an external light source, with good sensitivity, but poor safety and detection are limited by the external light source. Compared with active infrared technology, passive infrared imaging has the advantages of no background reflection, no laser source, and a long detection distance [5]. Passive-imaging technology uses the natural background radiation of the environment to detect the gas. Gas-leak scenes are often accompanied by temperature and pressure drops. There are temperature differences between the leaking gas and the background. This meets the conditions for passive gas detection [6].
Infrared spectral-imaging technology is non-contact imaging. It can not only obtain spectral information of gas but also image the distribution in space [7]. The spectral information can be used to identify the type of gas [8]. In addition, passive infrared detection equipment can detect a variety of gases, due to the different infrared absorption characteristics of different gases. Therefore, the study of gas leaks based on passive infrared imaging is of great significance.
Once these gases leak, there is a change in temperature and pressure. Therefore, there is a temperature difference between the leaked gas and the background. This meets the conditions for passive gas detection. In recent years, cooled infrared focal-level detectors have also been widely used in passive gas detection, but they are expensive and have a limited response band. With the development of uncooled infrared focal-plane detector technology, the detection sensitivity of uncooled detectors has been rapidly improved and the cost has been decreasing [9]. However, the infrared images from uncooled infrared focal-plane detectors suffer from low contrast and poor quality. Therefore, effective methods for infrared image processing are needed.
A gas leak can be detected using dynamic-target detection methods. However, there are large differences between different gas targets in different scenarios. Although deep learning is quite effective at target detection, it also has some limitations. The accuracy of deep learning is highly correlated with the number and diversity of samples. In addition, it is not suitable for real-time processing. Therefore, the improvement in classical motion-target detection methods based on gas-leak characteristics is also a research trend in the field of gas-leak detection.
In 2008, the French company Bertin Technologies developed the Second-Sight stereoscopic remote camera monitor, which can monitor the emissions of toxic industrial gases or chemical gases in real time [10]. The working band of the system is 8000–14,000 nm, and it can identify up to 50 kinds of gases, and can detect gas leakage within the range of 2 m–5 km. Second-Sight-series products use the site background as an infrared source and use image-processing algorithms to highlight the target gas cloud.
In 2020, Telops used a resolving multispectral imaging system with a high-speed rotating broadband pass filter wheel for imaging monitoring of volcanic gases rich in carbon dioxide, sulfur dioxide and hydrogen sulfide [11]. The technique can be based on pixel-to-pixel dynamic-flow analysis to estimate gas velocity. The system calculates the actual size of pixels in the area, and calculates the carbon dioxide in the designated area of the image according to path-length concentration results. It can show the gas-velocity histogram in this region. This method can better estimate the gas-flow velocity and gas concentration, but the working band is limited and cannot effectively cover most of the toxic and harmful gases.
In 2021, Quan Lu et al. proposed a SF 6 gas-leak online detection method [12] based on a Gaussian mixture model. This research is based on the imaging results of the FLIR GF306 cooled infrared imager. Under the experimental conditions of indoor 0.06 mL/min and a distance of 5 m, it can overcome the high noise and complex background interference of infrared imaging, and can effectively detect and locate a SF 6 leak area. However, the uncooled detector of the imager used in this study has a small working band coverage and can detect few gases.
For these problems, we analyze the noise characteristics of gas infrared imaging and propose an infrared gas image-enhancement algorithm, with the gas part being more enhanced. Meanwhile, an improved gas-region extraction algorithm is proposed to make it more suitable for gas-leak detection in different scenes. The algorithm proposed in this paper can effectively segment gas clouds, and effectively enhance F1 values with high detection accuracy.

2. Materials and Methods

2.1. Experimental Configuration

Medium-wave or long-wave cooled infrared detectors have been used in the detection and identification of certain gas leaks at home and abroad with the improvement in infrared detector technology. However, the cooled infrared detectors have the disadvantage of high cost. They can only work in the mid-wave infrared band or the long-wave infrared band. Some are even limited to a narrow single infrared band. It is difficult to effectively cover common gas-leak detection. These disadvantages limit their popularization and application.
In order to expand the types of detected gases, a broadband uncooled infrared focal-plane detectors was used in our system, covering the mid-wave and long-wave bands. Filters and scanning structures were developed to realize single-spectral and multi-spectral channels. The processed image and gas-leakage results are displayed on the terminal. In addition, the system was tested.
The overall block diagram of this system is shown in Figure 1. The infrared imaging module includes a broadband infrared optical lens, a long-wave filter wheel and an broadband uncooled infrared focal plane detector. The rotation time of the long-pass filter wheel is controlled and fed back to the image-processing module. The infrared video stream obtained by the system is used for image enhancement, target detection, region selection and image segmentation. The area and type of the gas leak are displayed on the display.
In order to simulate different scenarios of gas leakage, different experimental conditions are considered in this paper. Different experimental conditions include sulfur hexafluoride and carbon tetrafluoride, and different environmental conditions include indoor and outdoor. Infrared videos were acquired using an uncooled infrared detector.
This broadband uncooled infrared focal-plane detector was designed for the temperature range of −20 °C and 50 °C and its thermal sensitivity is 15 mK at 30 °C. When the characteristic absorption peaks are covered by the wavelength range of the filter, the image is displayed in the infrared video. The video resolution is 640 ∗ 480 pixels and the speed is 50 frames per second. The device is shown in the Figure 2. Figure 2a shows the device which was used for tests. Figure 2b is the blueprint. In addition, the filters in our device were purchased from Spectrogon. The types are shown in Table 1.
We propose and developed an infrared multispectral imaging system for gas-leak area detection and identification. The related imaging principles and gas-leak detection algorithms are introduced. Gas-leak monitoring and identification experiments were carried out for the two gases in four different scenarios. There are two indoor scenes and one outdoor scene. Combined with the algorithm recognition results and objective indicators, the algorithm proposed in this paper can effectively segment the gas cloud at different times in different scenarios, and effectively improve the F1 value under the condition of high detection accuracy. Finally, experiments were carried out with sulfur hexafluoride and carbon tetrafluoride gas, and the experimental results verified that our methods have the ability to detect various gas leaks.

2.2. Research Method

2.2.1. Infrared Image-Enhancement Algorithm

This paper proposes an enhancement method for local mapping. The method includes three steps. First, the image is filtered by Gaussian filtering to obtain the base layer of the image, and the base layer is subtracted from the input image to calculate the detail layer. Then, adaptive histogram segmentation and dynamic compression are performed, respectively, on the base layer and the detail layer. Finally, the two layers of images are fused at different scales and exported as an 8-bit grayscale image. A Gaussian filter is used to smooth the output image. In this paper, the Gaussian-filtering algorithm is used to divide the infrared image into the base-layer image and the detail-layer image, and the process is as follows.
I b a s e = I o r i g i n a l G
I d e t a i l = I o r i g i n a l I b a s e
Among them, I b a s e is the base layer image, I o r i g i n a l is the original infrared image, ⊗ is the convolution operation, G is the Gaussian kernel, and I d e t a i l is the detail-layer image. There is different information contained in the base image and the detail image and they need to be processed differently. The basic information in the base-layer image has high contrast and obvious grayscale changes. The detailed information in the detail-layer image mainly has low contrast. There are often traces of gas leakage in the detail layer.
There are few pixels with extreme gray values in detail-layer images. They are often recognized as noise. The image quality would be improved by removing these noises. A large amount of detail weak noise is separated into the detail layers after the image layering operation. To remove noise, the detail layer must be filtered a second time.
For a given image I, the probability distribution (probability distribution function, PDF) of each gray level can be expressed as the formula (3)
P I k = n k n , k = 0 , 1 , , L 1
where P I k represents the PDF value of grayscale k, n k is the number of occurrences of grayscale k, and L is the total number of pixels in the image: for 8-bit images, L is 256.
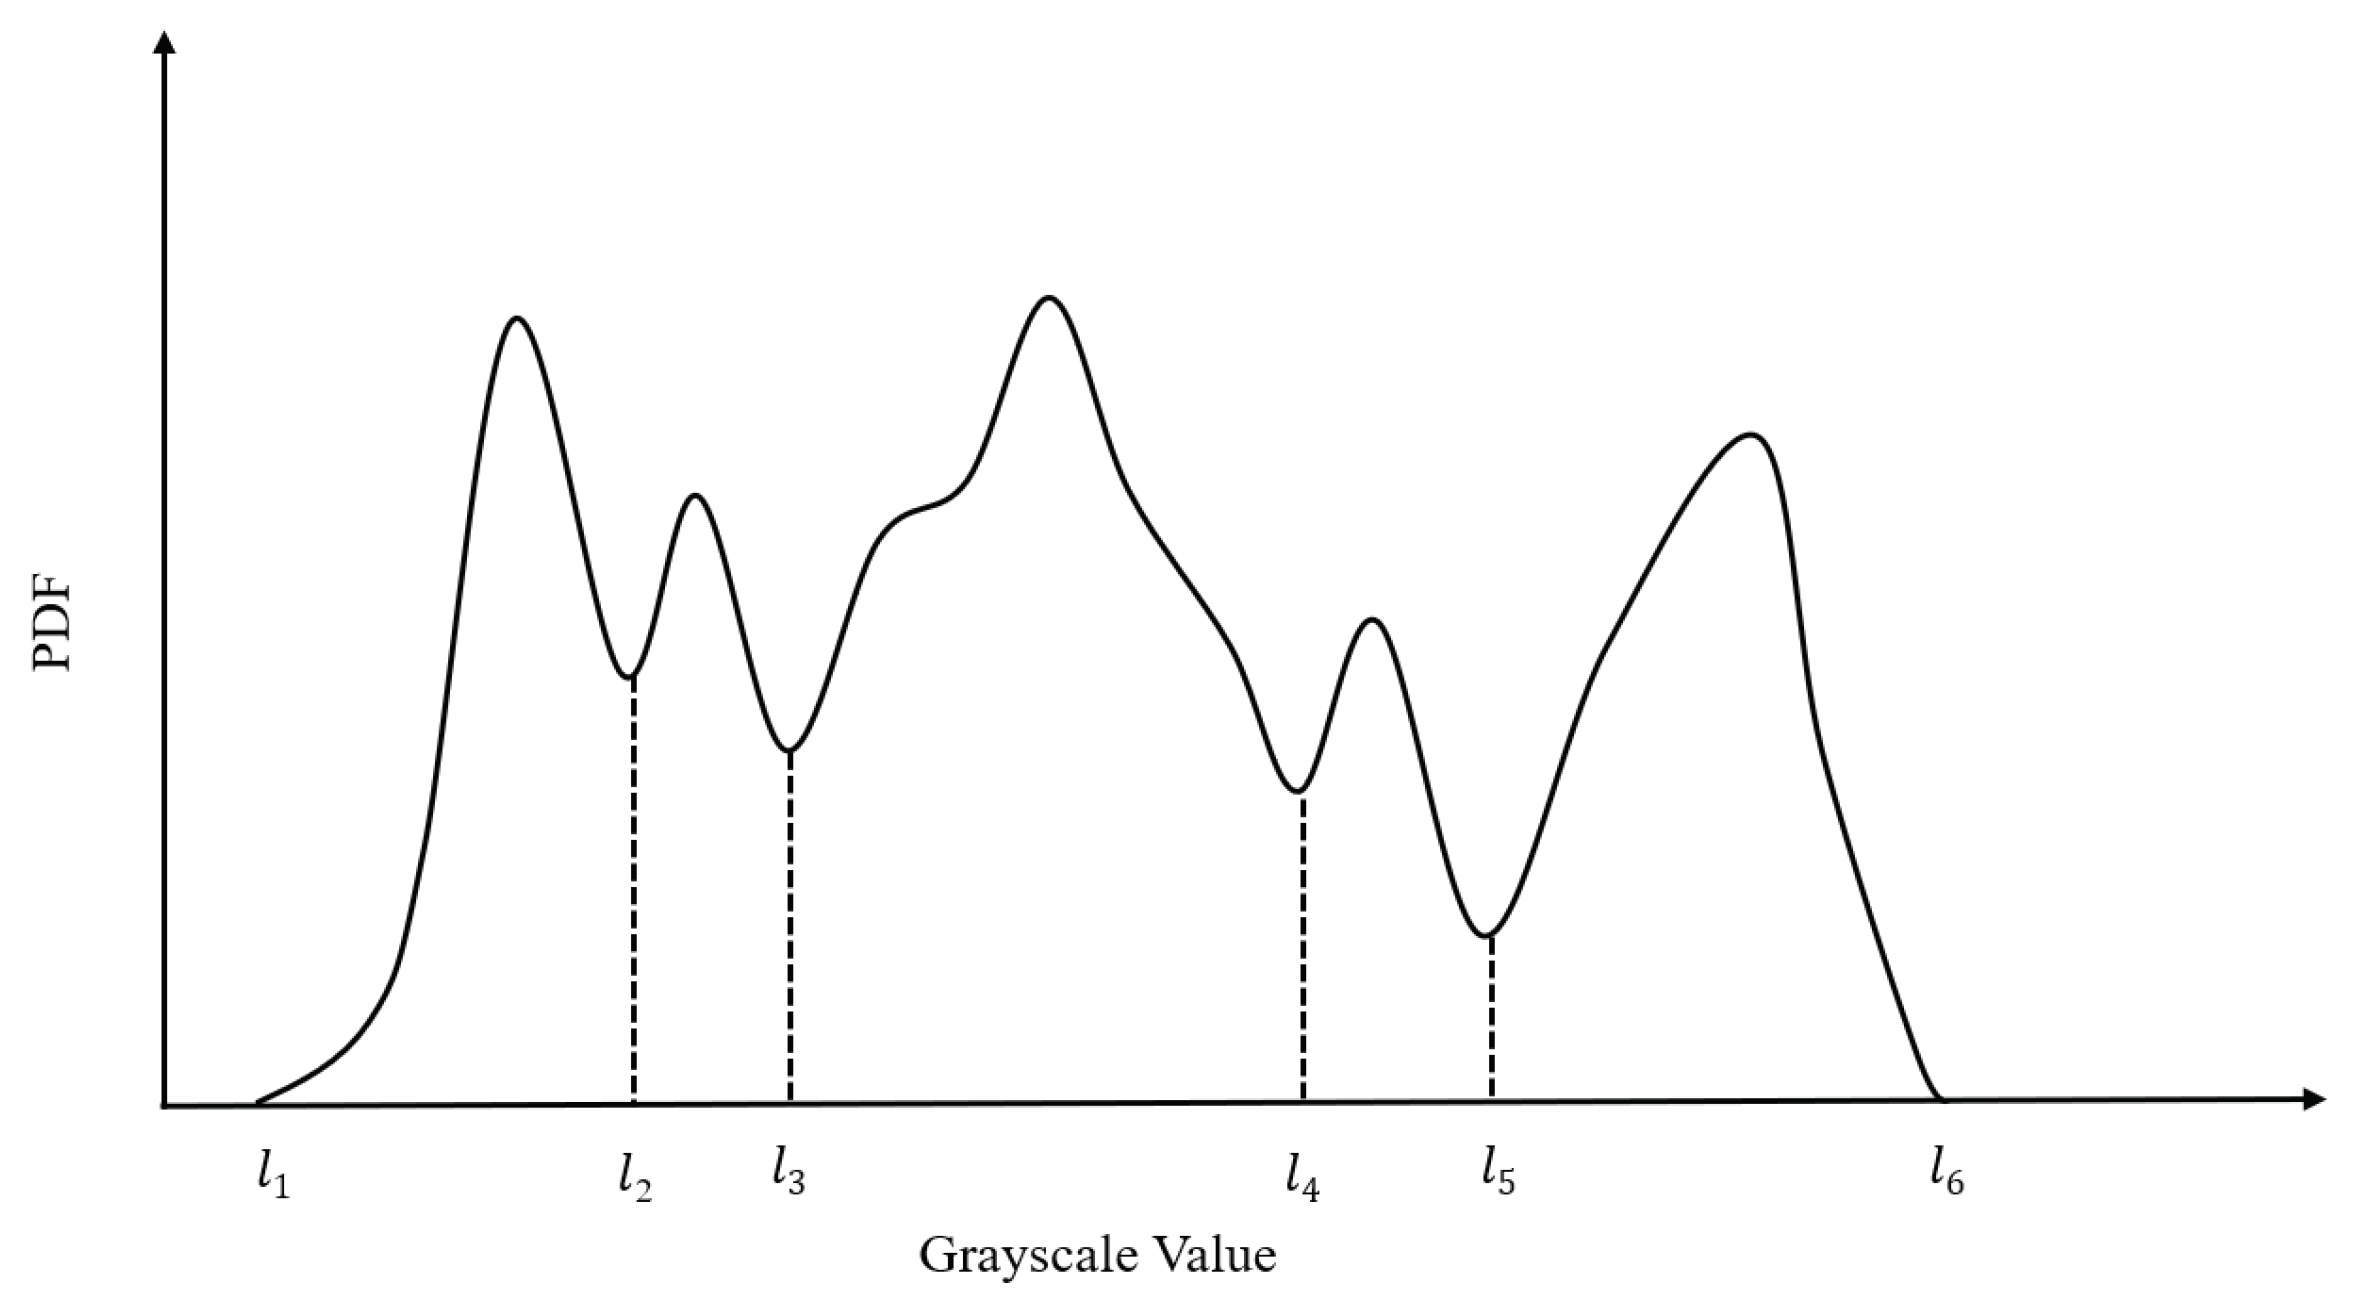
The local minimum of the histogram gray distribution are determined by a sliding window of size 1 × W . The grayscale set is l 1 , l 2 , , l N . The N is the number of local minima. The first and last non-zero histogram components are also contained in the set. Finally, the grayscale histogram is divided into N 1 intervals, which can be expressed as l 1 , l 2 , l 2 , l 3 , , l N 1 , l N , as shown in Figure 3.
The gray level in each interval is regarded as one or a group of objects, and the gray redistribution strategy of each interval is carried out. It is unreasonable to redistribute grayscales based only on the PDF values of a single grayscale. The overall grayscale distribution of the interval would be considered to determine the foreground or background. Based on the above characteristics, AHV is used as the criterion, which represents the average histogram value of a certain grayscale interval, such as Equation (4):
Θ i = n × C D F i l i + 1 l i + 1 , i = 1 , 2 , . . . , N 1
C D F i = l i l i + 1 P I k , i = 1 , 2 , . . . , N 1
In the formula, Θ i is the AHV value of the i interval, C D F i is the sub-histogram interval [ l i l i + 1 ] of the cumulative density function (CDF), and the set Θ = Θ 1 , Θ 1 , , Θ N 1 . For a large flat area, its corresponding grayscale is usually concentrated in a small grayscale range, and the AHV should also be large. The larger the flat area, the larger the AHV. For those objects that contain a lot of detail, it is obvious that their AHV will be small because the detail part has a large grayscale range and a small pixel-PDF value.
The Otsu method [13] was used to calculate the appropriate background recognition threshold T H . Assuming that T H divides the set Θ into two classes, Θ A and Θ B , then T H is defined as (6):
σ T H = C A · E Θ A μ 2 + C B · l e f t ( E Θ B ) μ 2
In the formula, C A and C B represent the proportions of the two categories Θ A and Θ B in the population, E Θ a and E Θ b are the average of these two categories, and μ is the average of Θ . When σ T H takes the maximum value, T H is the optimal threshold. After the threshold is confirmed, the grayscale interval is remapped. First, only sub-histograms with AHV values below the threshold are enhanced, other sub-histograms maintain their proportions across the dynamic range. Second, replacing the PDF of a single gray level with the accumulation of sub-histograms is a key factor in gray level redistribution.
The remapping rule of the sub-histogram interval of the background part is as follows (7)
D i = l i + 1 l i · L 1 T , i f Θ i > T H
where T is the number of non-zero sub-histogram components. Since the foreground part needs to be enhanced, the sub-histogram interval mapping rule of the foreground part is as follows (8)
D i = L 1 j : Θ j > T H Θ j · C D F i f o r a l l j : Θ j T H C D F j , i f Θ i T H
After assigning the dynamic range of each sub-histogram, each gray level can be mapped to the specified dynamic range. The HE method is used for the non-background sub-histogram, and the linear stretch is used for the background sub-histogram. The algorithm adaptively divides the histogram into several sub-histograms, and then enhances each sub-histogram according to its AHV, and the generated image is not affected by amplified background noise.
The base image is dynamically compressed to reduce the gray scale. The base image is compressed by a gamma curve to keep its gray level within a reasonable range. The processed background layer and detail layer are fused at different fusion ratios, such as formula (9).
I o u t = α I d p + β I b p
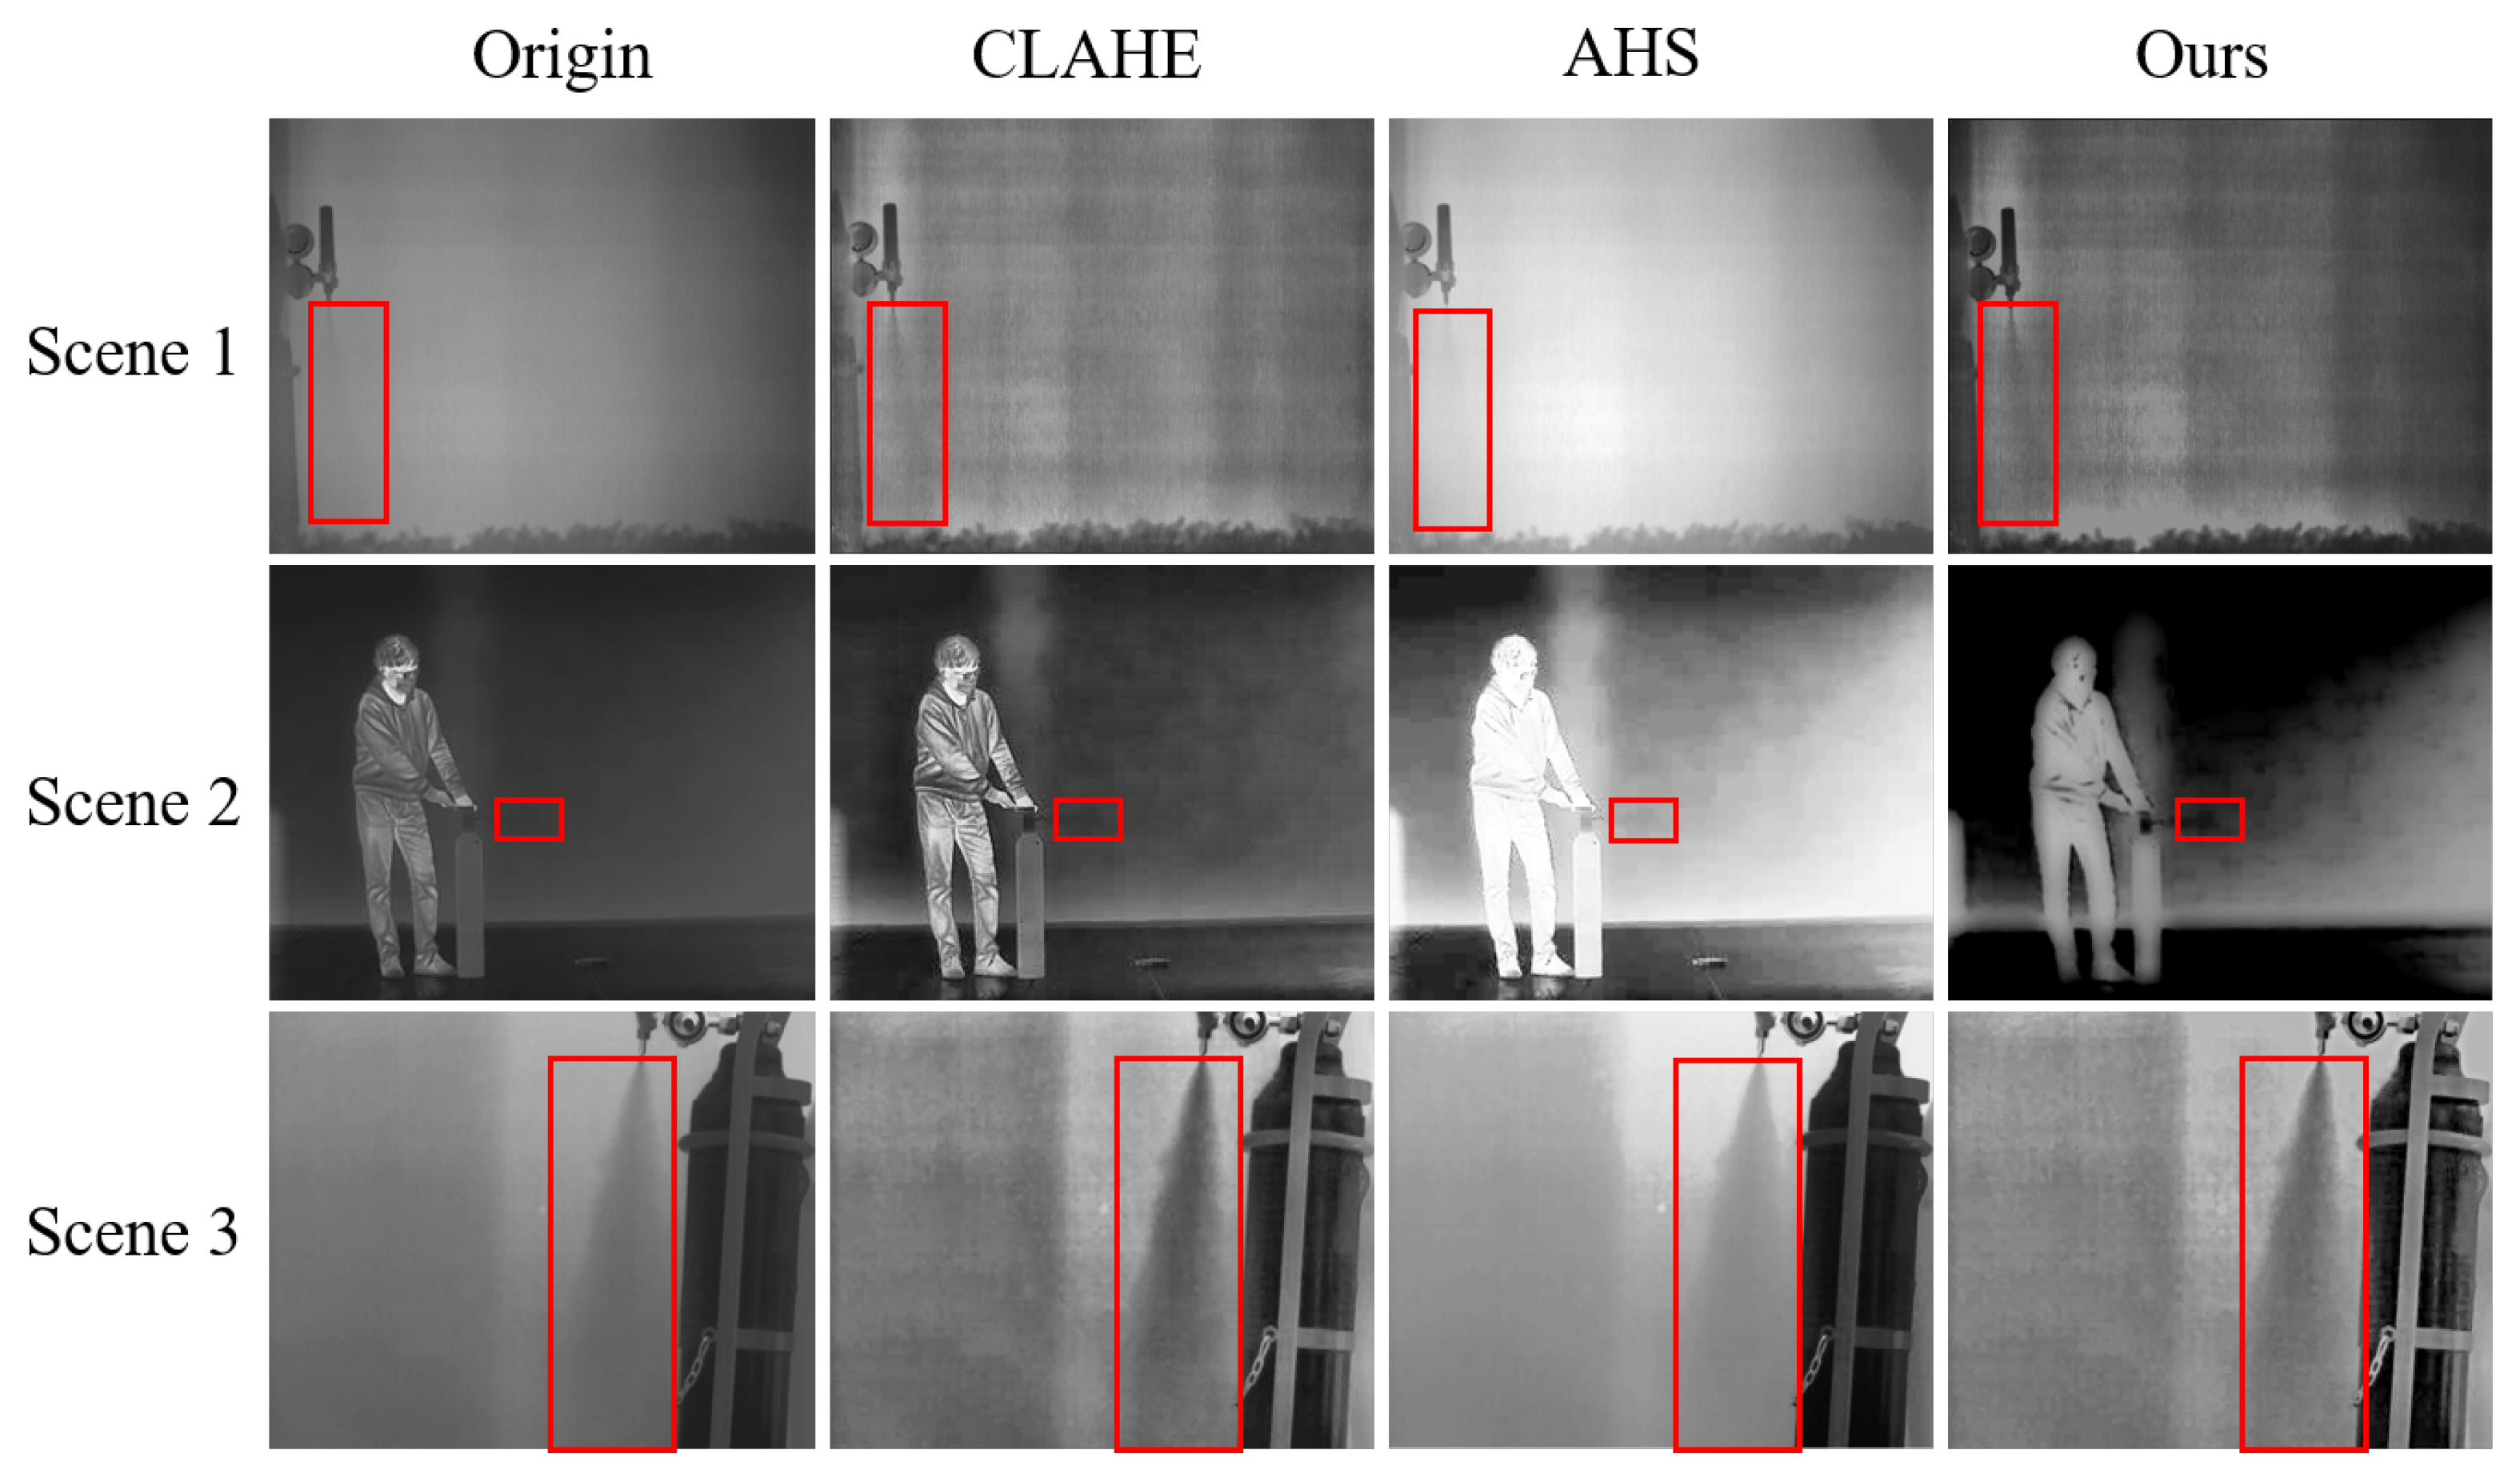
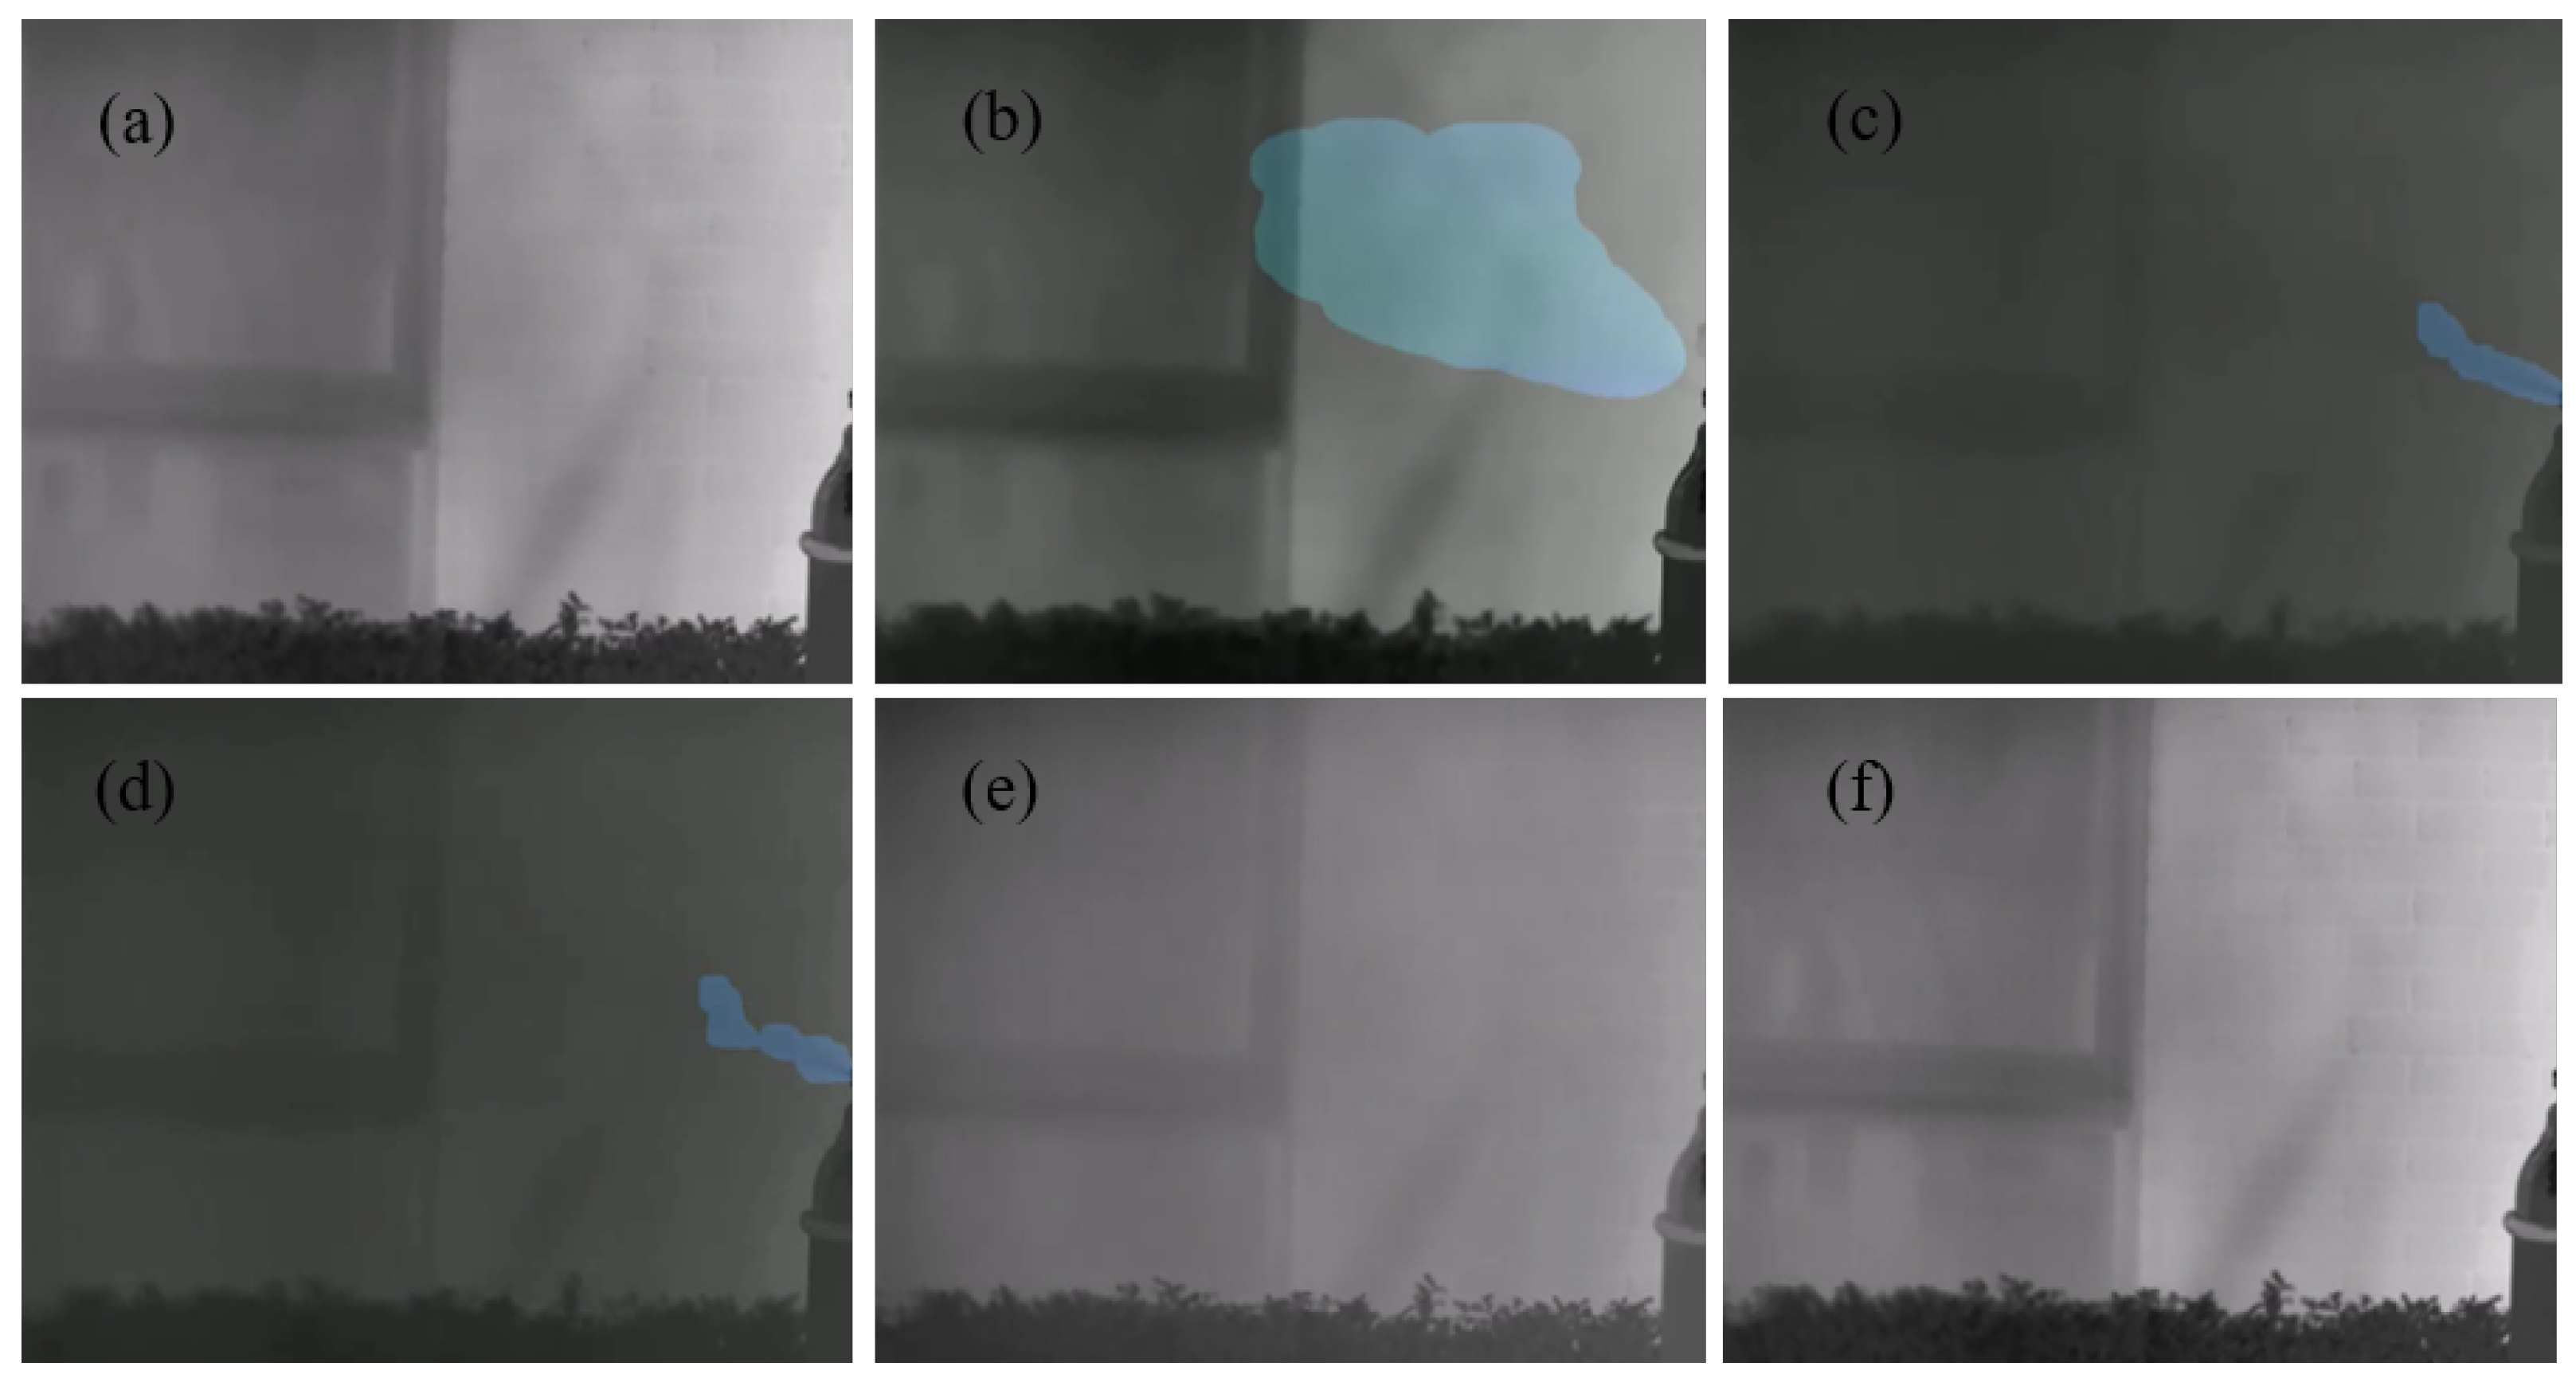
The algorithm can effectively enhance the gas part and significantly improve the overall contrast of the image, which is convenient for the human eye to observe the gas leakage event and the subsequent processing of the image. In the quantitative evaluation, the average gradient AG, image information entropy IE and enhancement degree EME introduced above are selected to evaluate the image-enhancement performance of this algorithm. Generally speaking, the larger the three indicators, the better. It can be seen from Table 2 that the average gradient of the algorithm in this paper after the enhancement of the three scenes is close to the CLAHE algorithm, but significantly higher than the AHS (adaptive histogram segmentation) algorithm; the information entropy of the picture is improved compared with the CLAHE algorithm; the enhancement degree EME is significantly higher than the AHS algorithm.Comparison of infrared image-enhancement algorithm results are showed in Figure 4.

2.2.2. Gas-Leak Area-Detection Algorithm

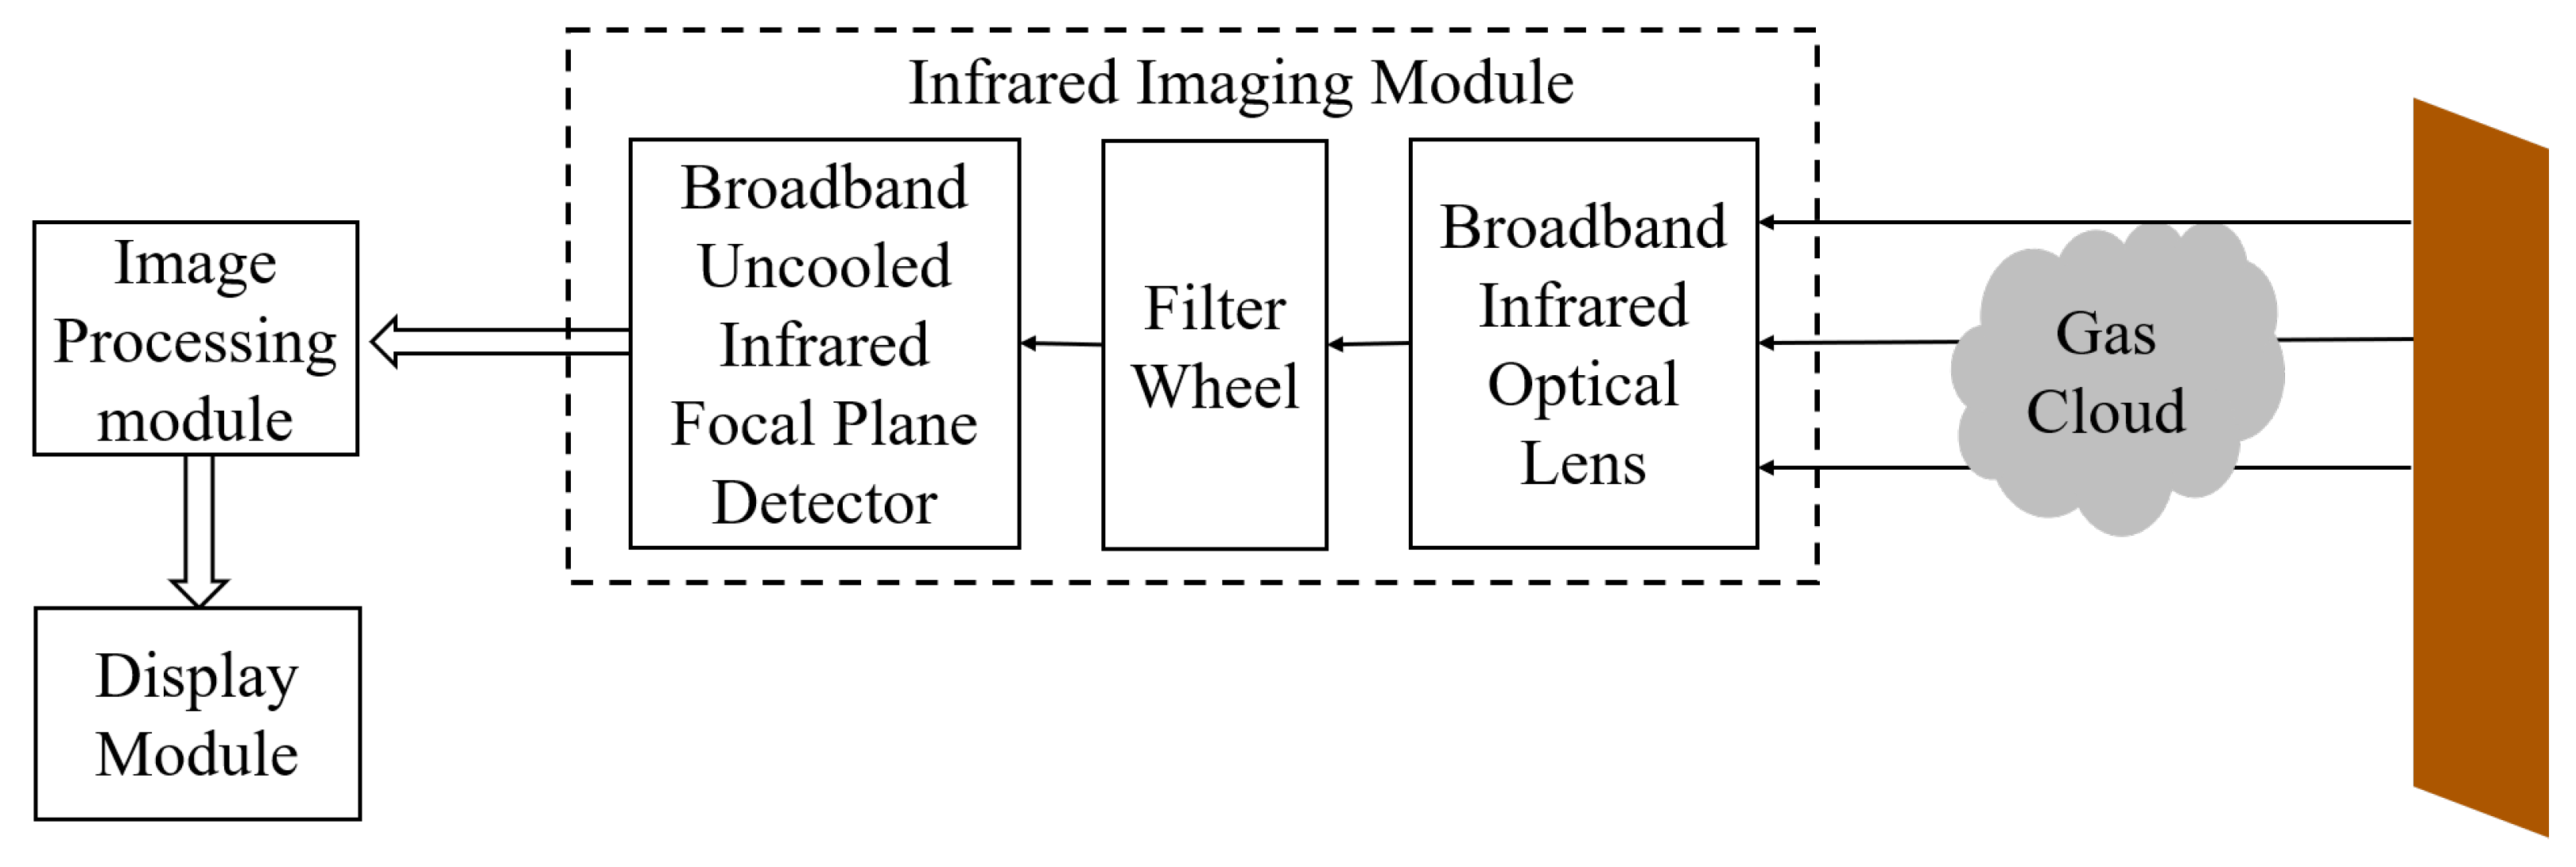
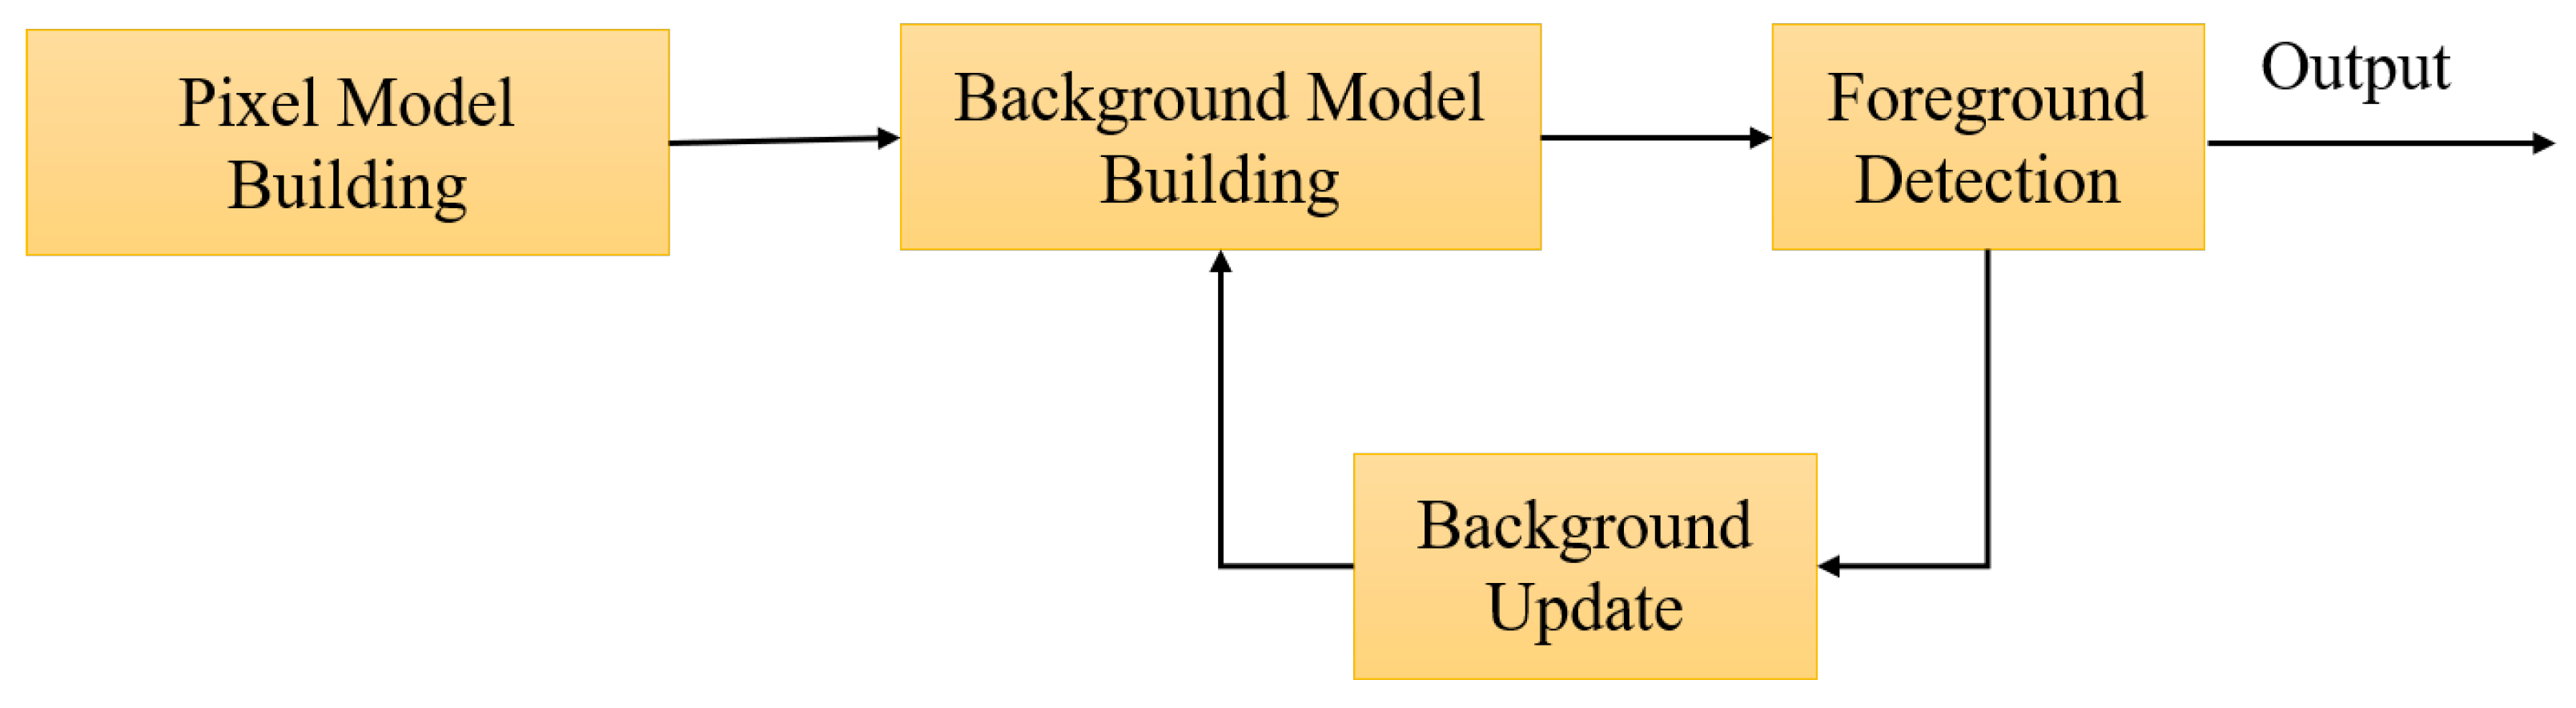
The leaking gas presents motion characteristics in the infrared video stream, and the gas leaking area can be located by the relevant algorithm. The ViBe (visual background extractor) algorithm was proposed by Olivier in 2009. The algorithm is a pixel-based foreground-extraction algorithm with excellent processing effect and high efficiency. Its important feature is the automatic update decision of the background mode, which randomly selects the pixels to be automatically updated, and then randomly selects the neighboring pixels to start the automatic update. When the pattern of an image change cannot be predicted, the random-update strategy can simulate the uncertainty of image change to a certain extent. The main processing flow of the algorithm is shown in Figure 5.
Classical background-extraction algorithms, such as the Gaussian background modeling algorithm [14], need to estimate the probability density function of pixels as information for subsequent judgments. The ViBe algorithm only needs sample values to construct a pixel model. Assuming that the pixel value of a pixel in the image is v ( x ) , a pixel model sample set M ( x ) is established for this pixel, such as the formula (10) shown.
M ( x ) = v 1 , v 2 , . . . , v N
Among them, v i represents the background sample value with index i in the sample set, and 
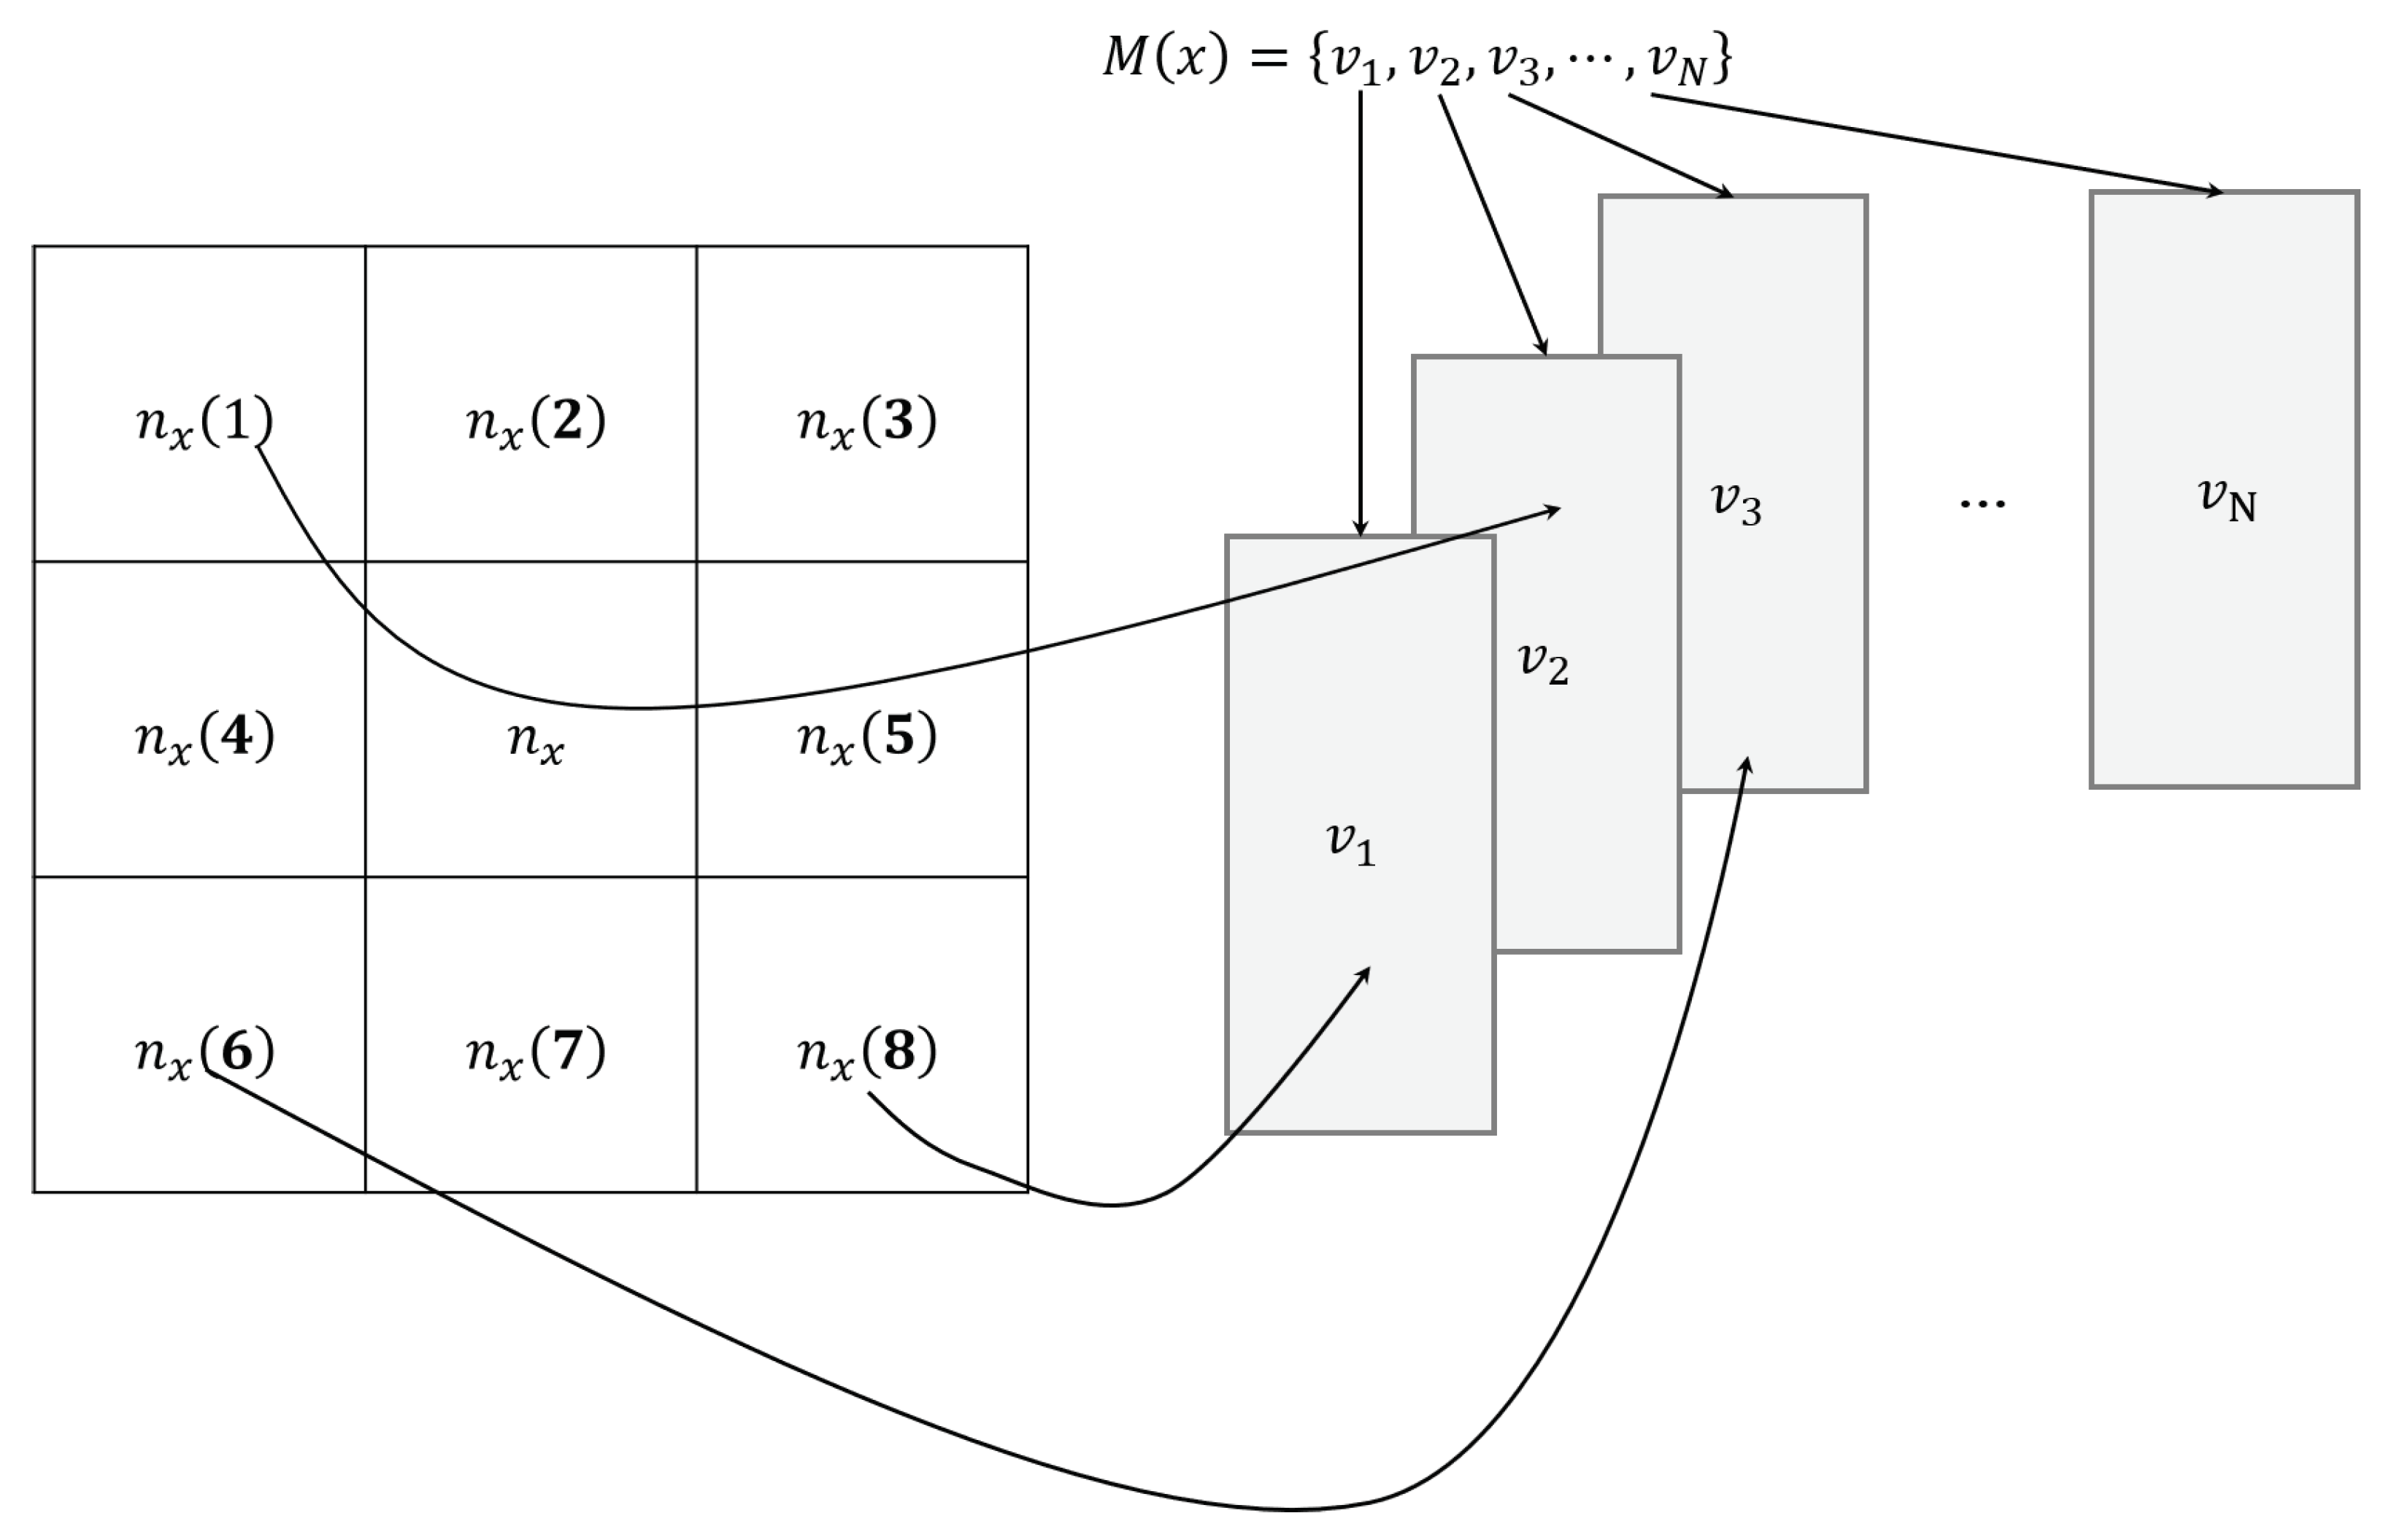
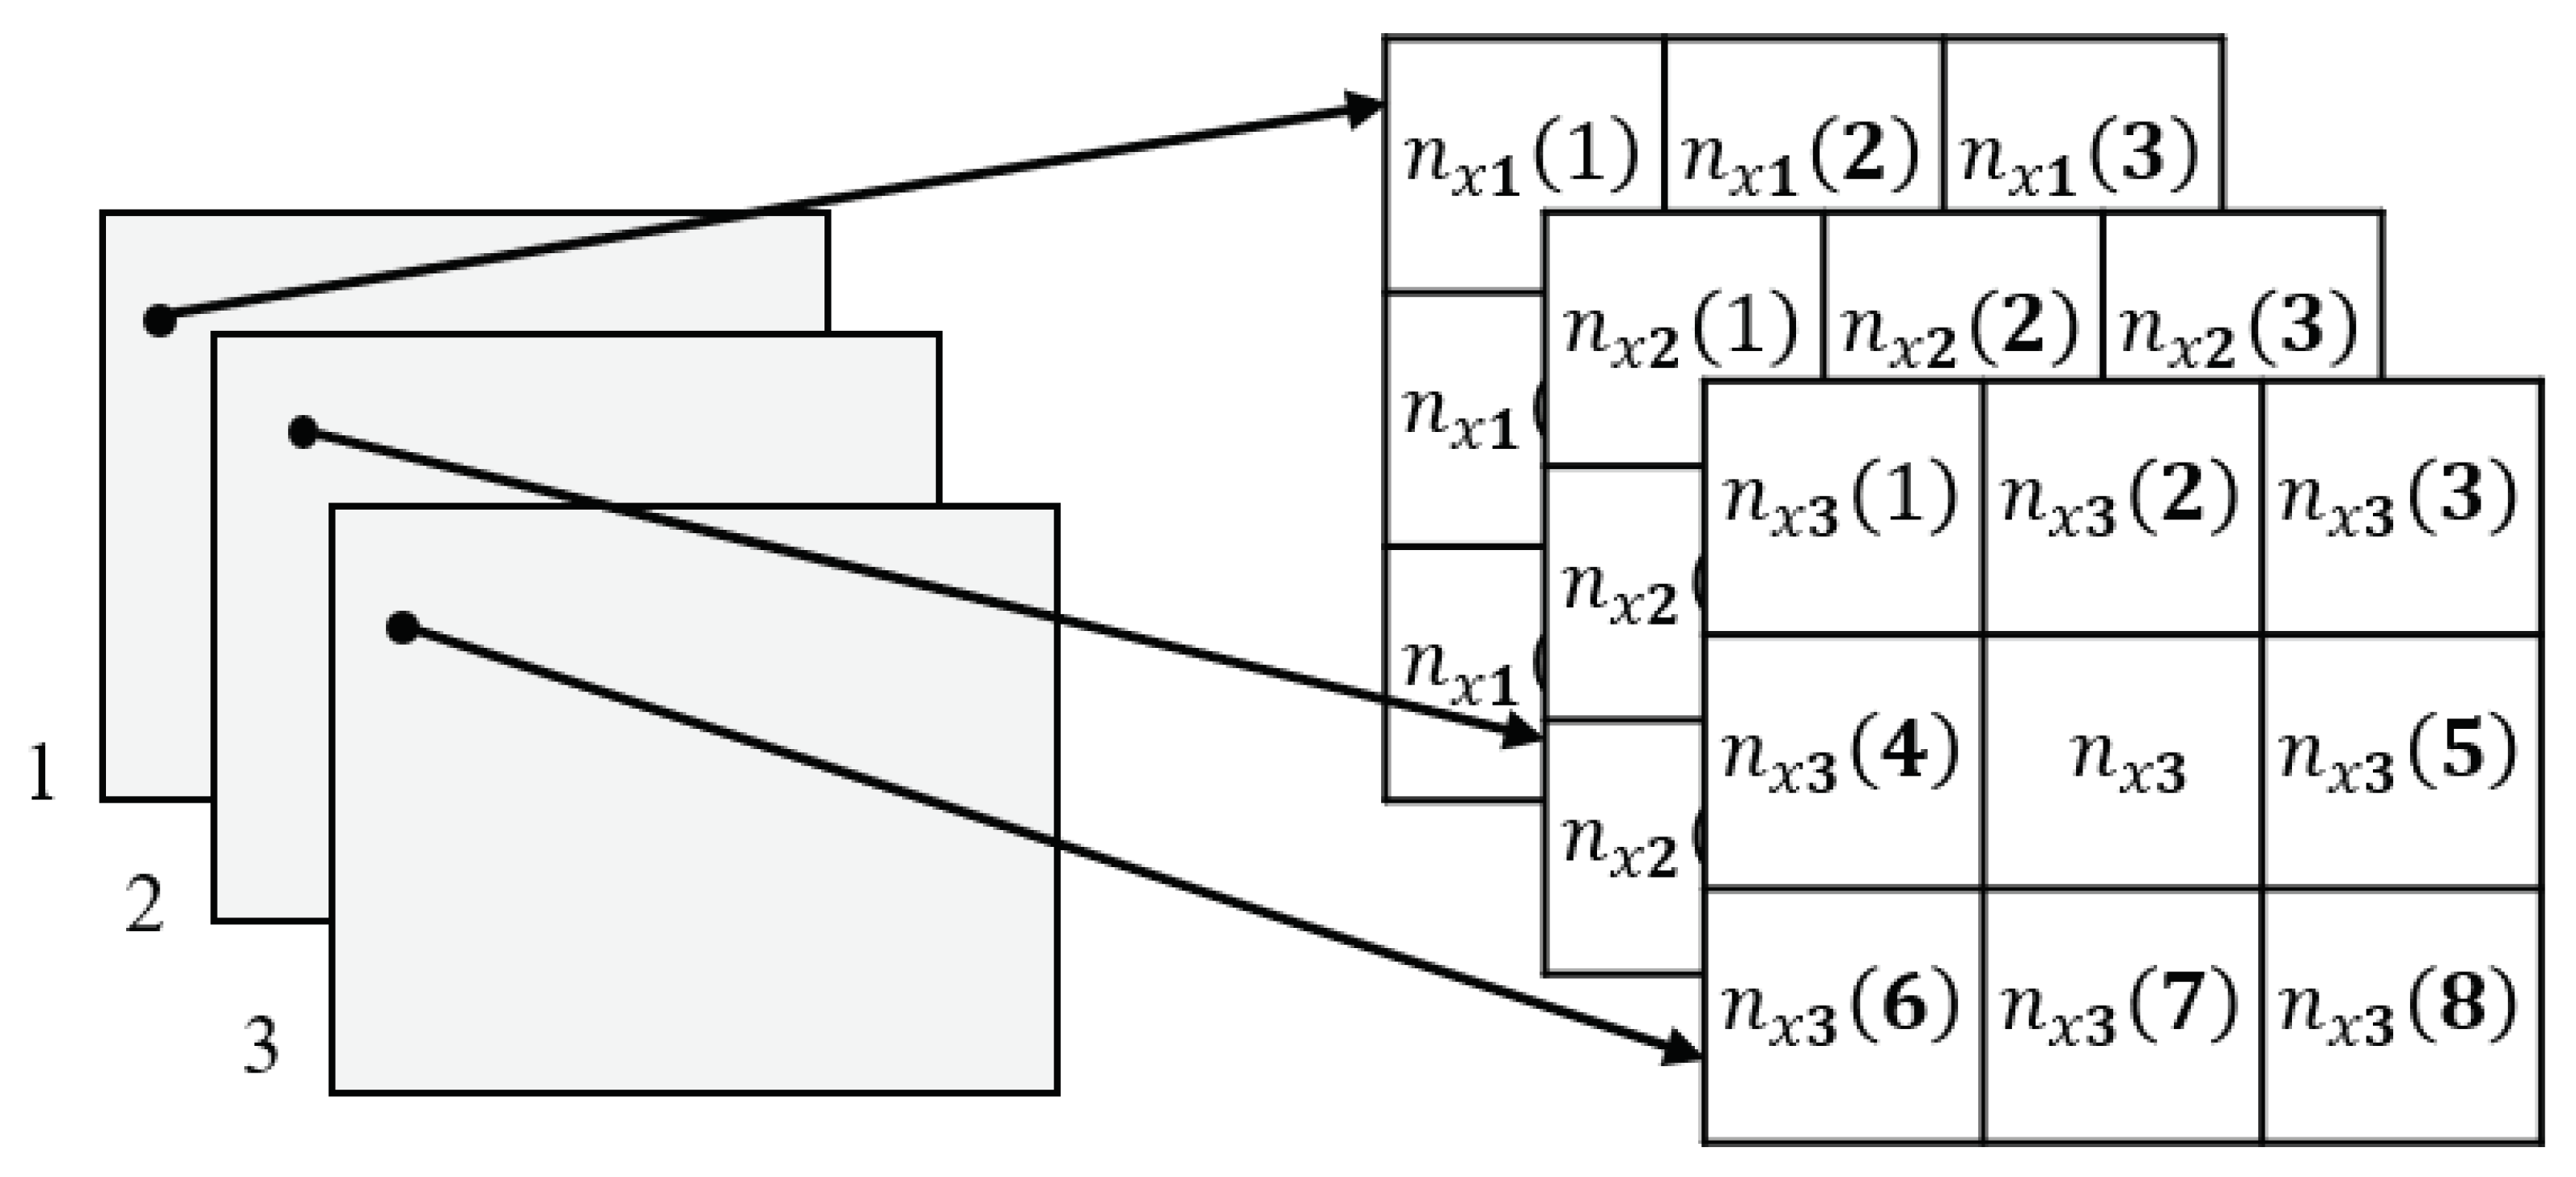
N represents the size of the sample set. When initializing the background model, ViBe only needs one frame of image. When the background model is first established, the pixel values in the eight neighborhood N g ( x ) are randomly selected with the same probability to construct the background model, and the number of selections is N. It solves the problem of insufficient samples in the process of background establishment, and can establish a background model according to a frame of an image. The construction process of the background sample set is shown in Figure 6.
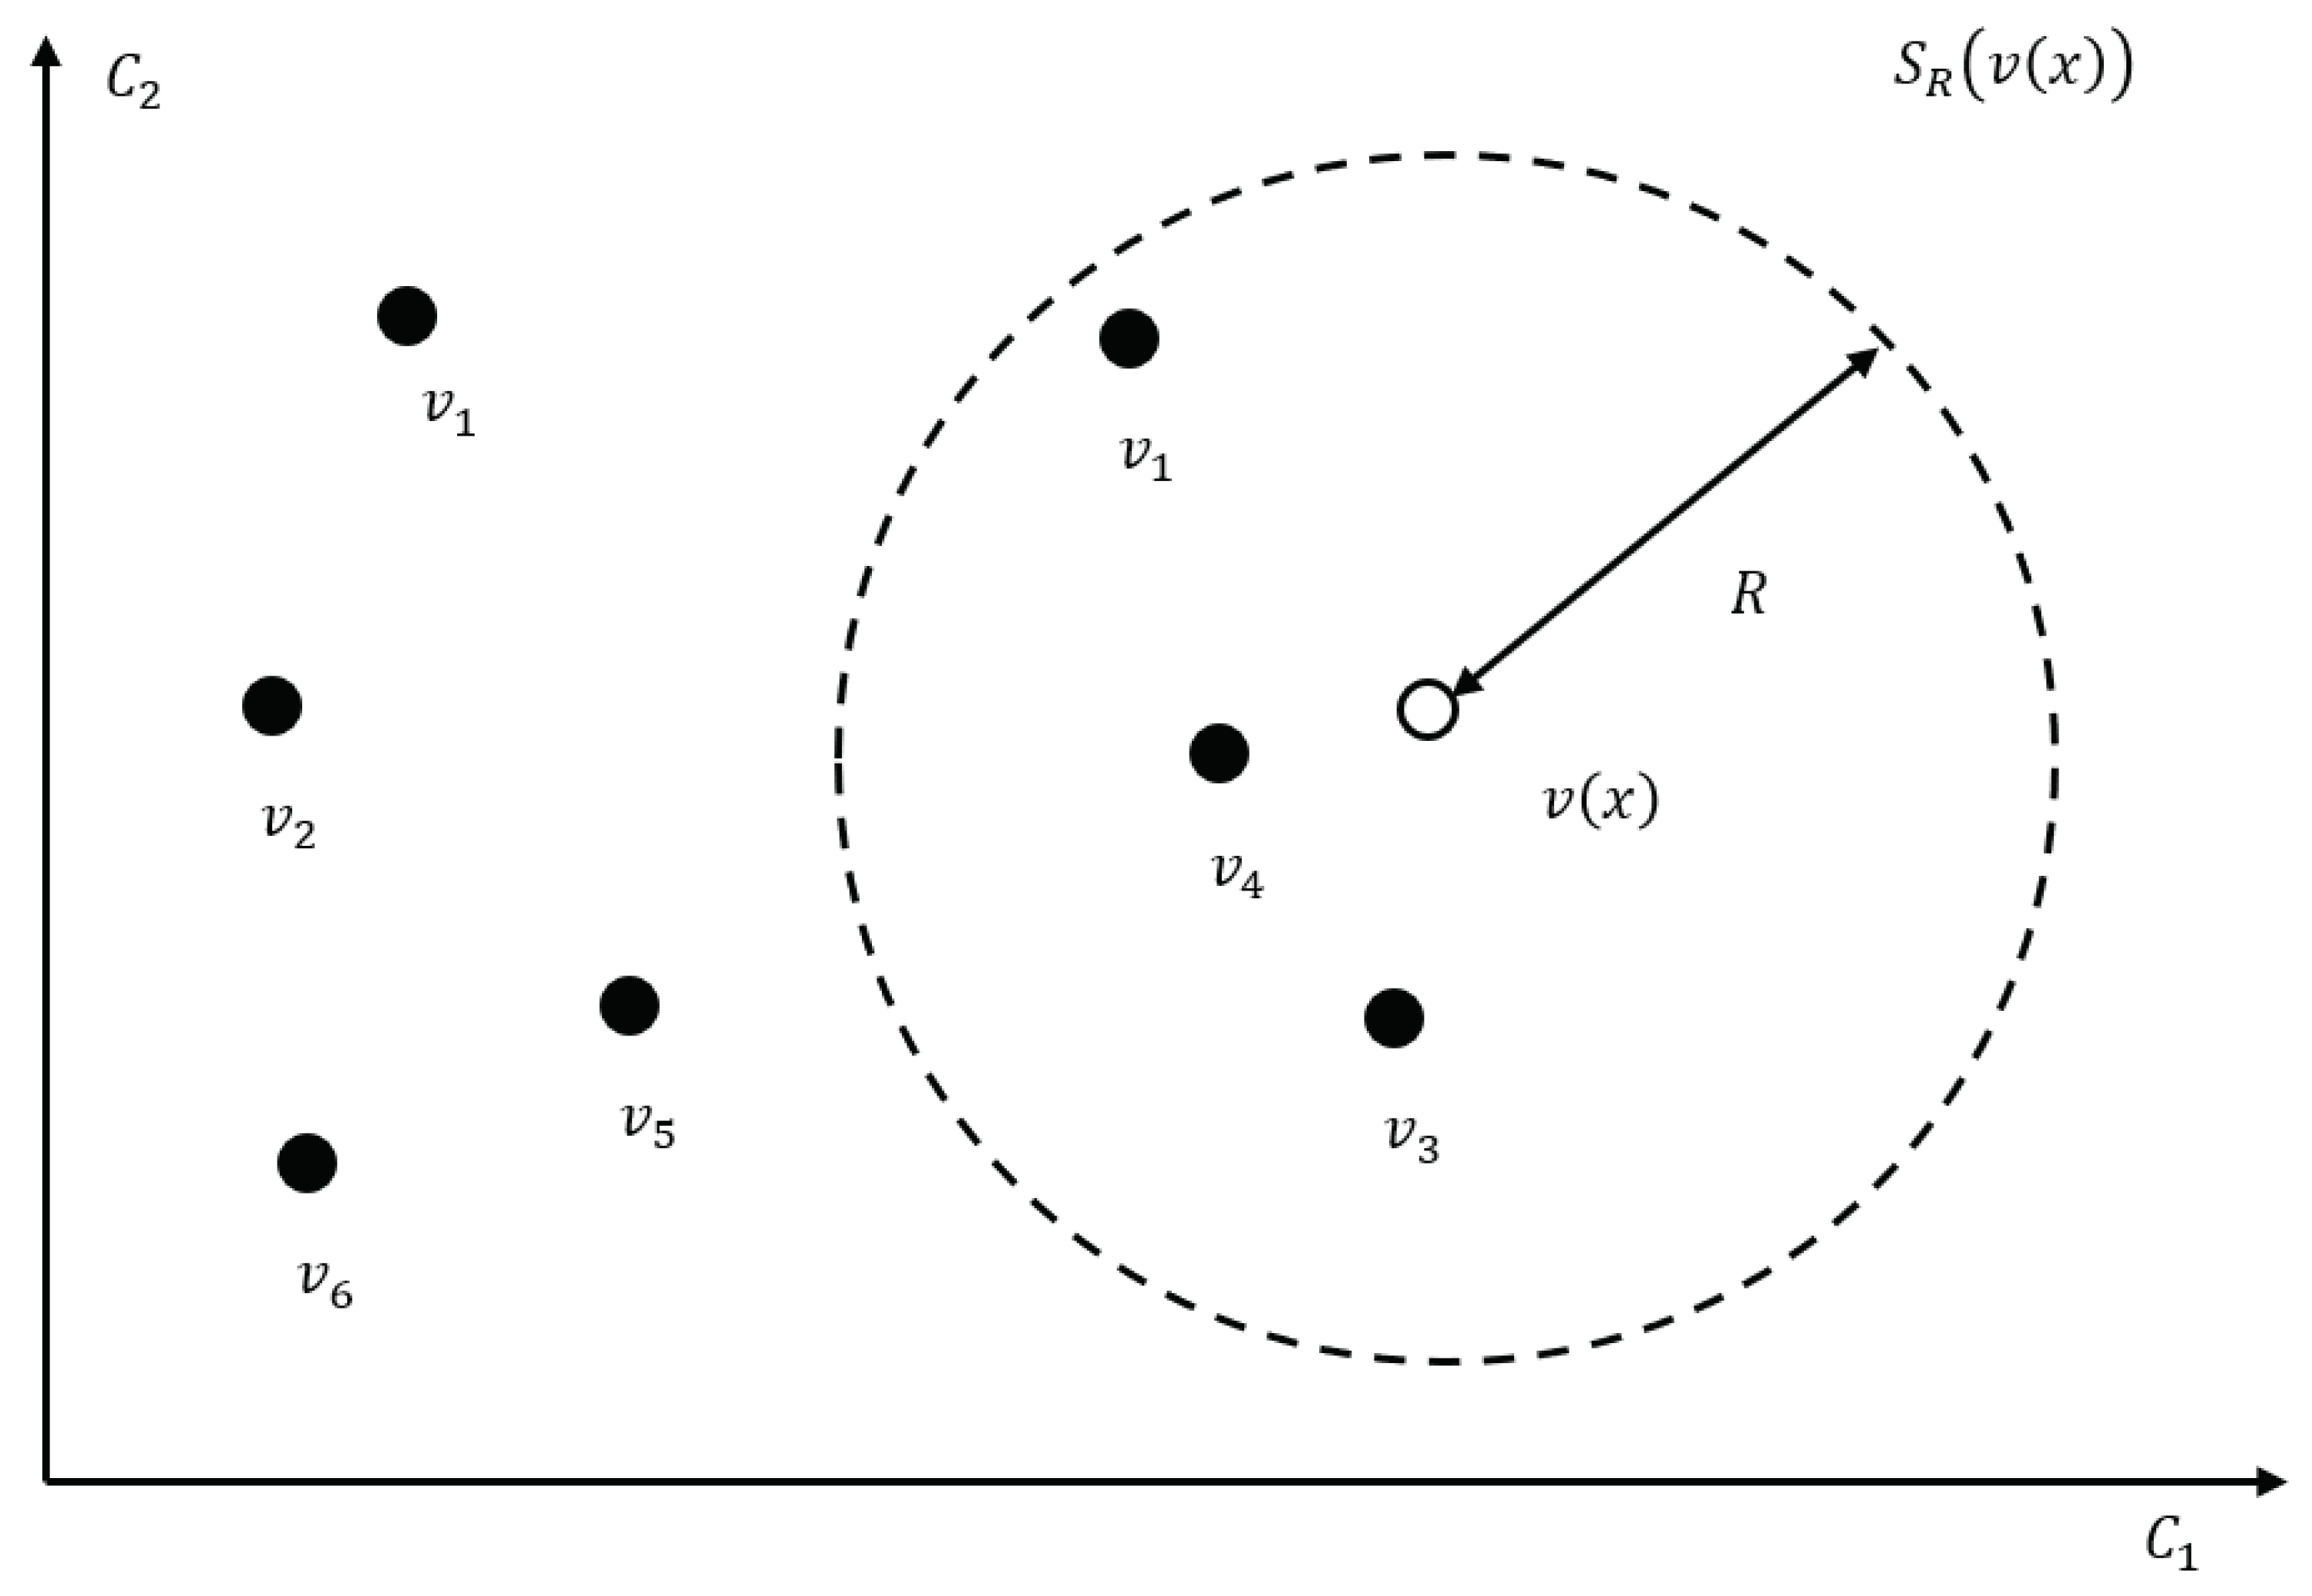
After completing the construction of the background model, the pixels are classified according to the M ( x ) corresponding to the pixels, and whether the pixel is the foreground is determined. With v ( x ) as the center, a circle S R ( v ( x ) ) with a radius of R is drawn, each sample in the sample set is traversed one by one, and it is judged whether the sample point according to the Euclidean distance between the sample and the center falls within the circle S R ( v ( x ) ) , then, the number of sample points within the circle c o u n t is counted. Next, the threshold m i n is set, and the sizes of c o u n t and the threshold m i n are compared, if c o u n t is greater than the threshold value, the pixel is the foreground, otherwise it is the background. Figure 7 shows the relevant process of pixel foreground detection.
The radius R of the circle S R ( v ( x ) ) and the threshold m i n are two key parameters in the ViBe algorithm. The algorithm works better when R = 20 and m i n = 2 . In the foreground matching process, once the min match is found, the classification work of this pixel is interrupted, which can effectively improve the computational efficiency.
As the image sequence changes, the background model must be updated periodically in order to cope with new objects appearing in the scene. In the traditional background model calculation, the newly established background model is also discarded or reconstructed due to the increase in time. The result is that the information contained in the existing background model is wasted and the computational difficulty and workload are increased. ViBe adds two update strategies: foreground pixel count and random sampling during the update process. When detecting each frame of anR image, each foreground pixel is marked and counted, and the problem of long-term stationary after the appearance of a moving object is solved by the strategy of counting foreground pixels.
For background pixels, an update strategy combining memoryless update, temporal random sampling and spatial neighborhood update is adopted in the update process. First, the random replacement principle is used for the model samples. The probability of the samples being replaced is the same, so that the sample value develops in a smooth life cycle, and the probability of the sample value in the sample set is guaranteed to decay monotonically. Second, the temporal sampling update strategy extends the time covered by the background pixel model. Finally, in order to improve the spatial unity, the mechanism of row space propagation is added.
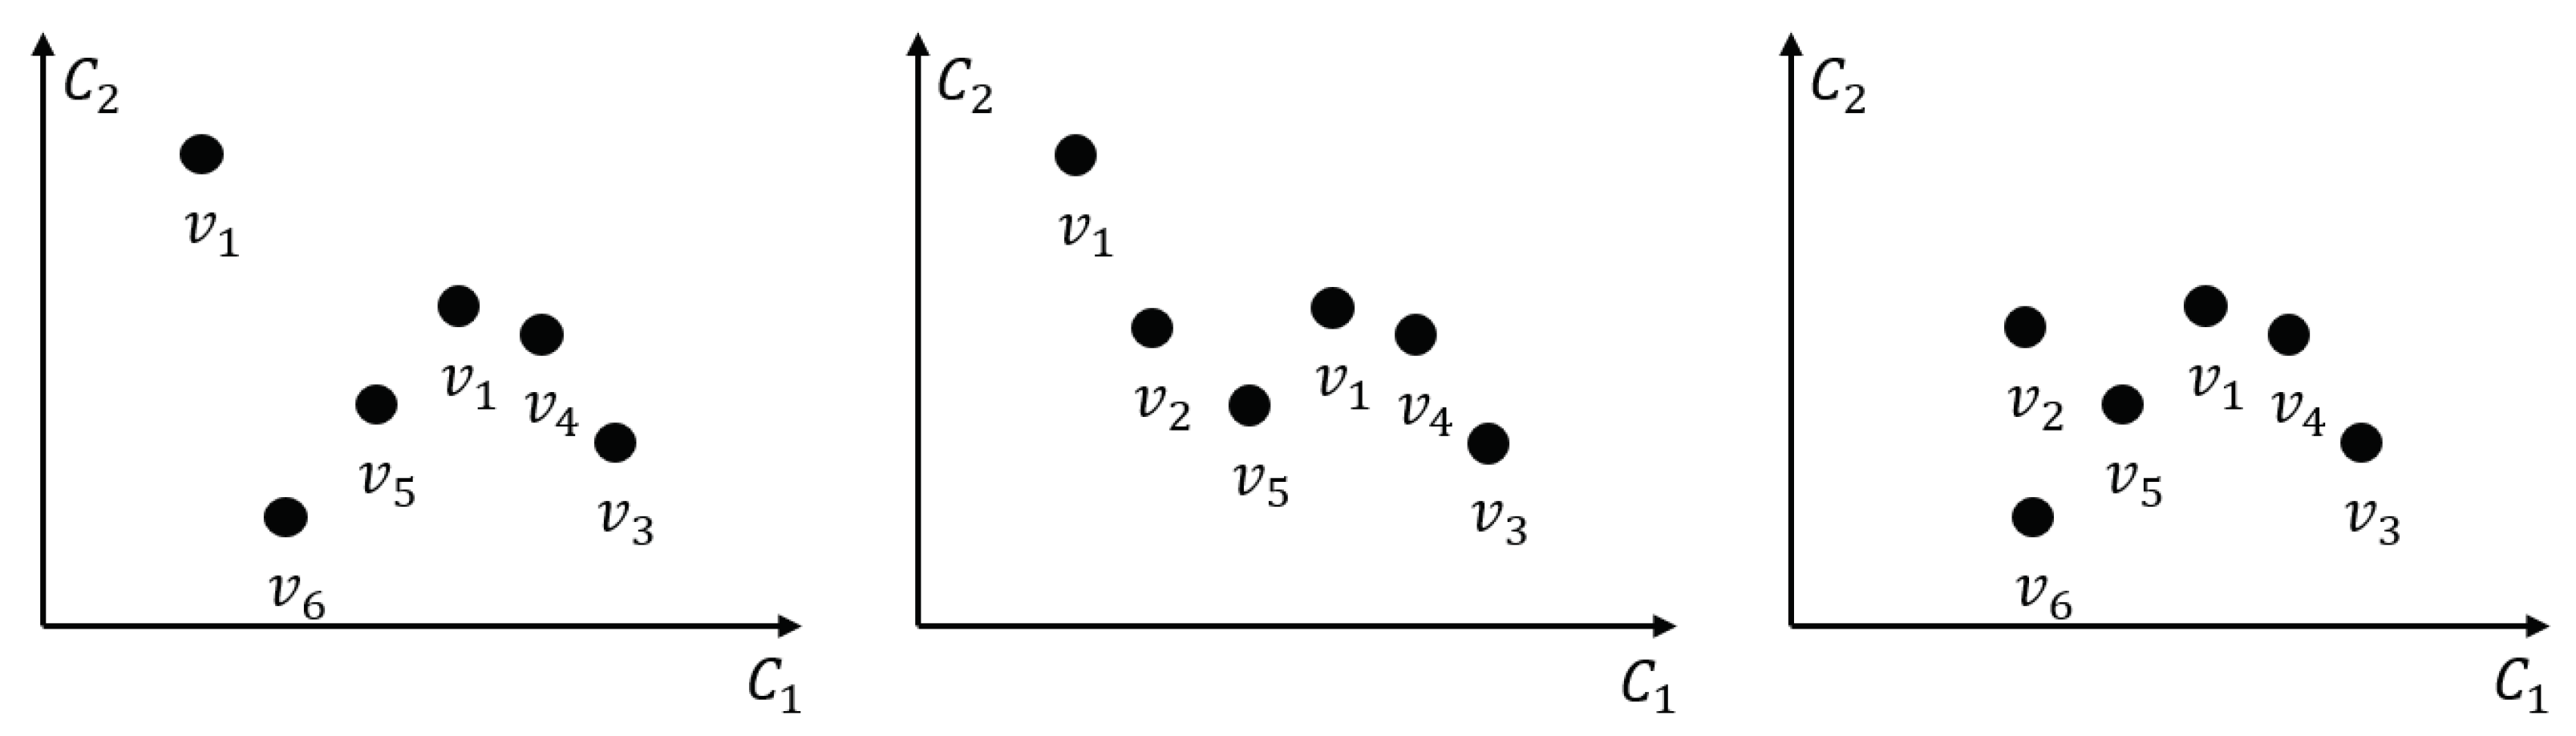
When updating the background model of the pixel point, as shown in Figure 8, a sample value of the sample set is randomly replaced, and the samples to be discarded are randomly selected, and the probability of each sample being discarded is equal. Since the sample set of the background model contains N samples, the probability of a sample being retained at time t is ( N 1 ) / N , and the probability that the sample is retained after the algorithm runs for a period of time is as follows (11):
P ( t , t + d t ) = ( N 1 N ) ( t + d t ) t
Equivalent to:
P ( t , t + d t ) = e l n ( N 1 N ) d t
The formula (12) indicates that the expected retention time of each sample in the background model decays exponentially. If there is a sample in the background model at time t, the sample will be stored at time ( t , t + d t ) . The probability of being changed is independent of time t, i.e., no memory update feature. For the update of the dynamic background model, the memoryless update strategy method is convenient and effective.
The time sampling update strategy refers to updating the background model according to the probability. Due to the periodicity of the background in the image, selecting some of the image frames at a random time in the video stream to update can enhance the robustness of the background model and increase the update cycle of the sample. When a pixel is judged to belong to the background, assuming that the current time sampling factor is φ , the probability of this pixel being selected for updating is 1 / φ .
The target of the leaking gas cloud in the infrared image is weak, and the random thermal noise in the shooting has a great influence on the target detection accuracy. Therefore, when the background model is automatically updated, it needs to be more tolerant of noise. The background model of the ViBe algorithm can be initialized in a single frame, and the foreground can be judged from the second frame, so that the background model can be quickly established and suitable for multi-spectral gas-leakage systems.The target of the leaking gas cloud in the infrared image is weak, and the random thermal noise in the shooting has a great influence on the target detection accuracy. Therefore, when the background model is automatically updated, it needs to be more tolerant of noise. The background model of the ViBe algorithm can be initialized in a single frame, and the foreground can be judged from the second frame, so that the background model can be quickly established and suitable for multi-spectral gas leakage systems.
When initializing the model, the algorithm only relies on a single frame to build a background model, which is prone to random noise, which affects the detection of weak targets such as gas clouds.
There is a correlation between a pixel and its neighboring pixels in the spatial domain, and at the same time, there is a correlation with the pixels of the adjacent frames in both the temporal and spatial domains. This paper proposes an improved background-model building method based on the association of image sequences in the video in the time domain and the pixel space propagation mechanism in the spatial domain, which improves the robustness of the background model and better suppresses random noise.
The establishment process of the background model is shown in Figure 9. When the background model is first established, the pixel values in the eight neighborhoods N g ( x ) in the initial three frames are randomly selected with the same probability to construct the background model, the number of times of selection is N. Take a certain pixel v ( x ) as an example, the pixel point establishes a pixel model sample set M ( x ) is randomly selected from N g 1 ( x ) , N g 2 ( x ) , N g 3 .
The neighborhood pixels of pixels in three consecutive frames of images in the time domain are added to the sample set, which enriches the sample set and reduces the interference of some random noise compared to the previous single-frame background. The selection range of samples is expanded from 8 neighborhoods to 24 neighborhoods, which also avoids the selection of repeated samples and improves the applicability of the background sample set. The establishment of the initial model in three frames has little effect on the timeliness of the algorithm, which is almost negligible. The improved method makes full use of the characteristics of similar distribution of adjacent pixels and random distribution of noise in time series, which not only solves the problem of insufficient samples in the process of background establishment, but also reduces the interference of randomness of independent samples, and increases the robustness of the background initialization model.
In this paper, the radius R of the circle S R ( v ( x ) ) is improved by the maximum inter-class variance method. The maximum inter-class variance method calculates the inter-class variance between the background and foreground regions, Confirm whether the decision threshold m i n value is the best division value. As can be seen from the previous section, based on the radius R value of the circle S R ( v ( x ) ) , it can be judged that a certain pixel is a foreground point or a background point, so that all pixels are divided into two categories: background and foreground. Assuming that based on the current distance threshold R, the proportion of pixels in the foreground area in the entire image is ω I , the average value of the foreground part is μ I , and the background area accounts for ω I . The ratio is ω B , the average value of the background area is μ B , and the average value of all pixels in the current image is ω , then the class of the foreground part and the background part. The inter-variance can be expressed as the formula (13):
G R = w I × μ I μ 2 + w B × μ B μ 2
The larger the value of G R , the better the segmentation effect between the foreground and the background. When G R is the largest, the R at this time is the optimal distance threshold. In order to prevent the influence of light mutation, the threshold size needs to be limited. The automatic threshold method is used to update the different thresholds of each scene, which can increase the accuracy of the algorithm for gas-leakage identification in different scenes, and reduce the false-alarm rate at the same time.

3. Results

Interframe difference can find subtle differences between the current frame and the background frame, and is more sensitive to subtle changes in gas, so its accuracy and recall rate are better, and it is also more sensitive to noise changes, so its accuracy is poor. The original ViBe algorithm and SubSENSE have different gas-detection sensitivities in different scenarios, and most of the time they cannot effectively identify the gas-leakage area. The GMM algorithm has a good effect on the initial identification of gas leakage, but after the occurrence of gas leakage, it will misjudge the gas region, and the segmentation effect on the lower part of the nozzle is poor. Combined with the algorithm recognition results and objective indicators, the algorithm proposed in this paper can effectively segment the gas cloud at different times in different scenarios, and effectively improve the F1 value under the condition of high detection accuracy.

4. Discussion

Aiming at the problems encountered in the application of ViBe algorithm in gas-leakage scenarios, the dynamic background input and automatic threshold adjustment are used to improve it. The improved algorithm is verified, and it was compared with other foreground detection algorithms in four different scenarios.
Figure 10 from left to right are the original images of four scenes and the processing results of different algorithms: Scene 1 is the outdoor carbon tetrafluoride gas leakage scene; Scene 2 is the outdoor carbon dioxide leakage scene; Scene 3 is indoor six fluorocarbon gas leakage scene; Scene 4 is an outdoor sulfur hexafluoride gas leakage scene. In four different scenes, the results of traditional foreground detection algorithms and our algorithm are compared and analyzed. The traditional algorithms are frame difference method, background extractor (ViBe) [15], Gaussian mixture model (GMM) [12], Local adaptive sensitivity detection method (SuBSENSE) [16]. The second column is a ground-truth map which is artificially annotated for the leaked area. The white part with a gray value of 255 represents the gas leakage area, and the black part with a gray value of 0 is the background area. Similarly, the rest of the algorithm results are represented by binary images, the foreground part is represented by white, and the background part is represented by black.
Although the inter-frame difference method can effectively segment the gas region, it is affected by the environment. There is a lot of noise and the background needs to be manually selected. The unimproved ViBe algorithm has poor applicability in different scenes. The effect is better in scene 2 and scene 3, but if the overall brightness changes, the effect is not ideal, such as the segmentation results in scene 1 and scene 4. The GMM algorithm performs well in the segmentation process, but it is prone to missed detections in the subsequent process. The SubSENSE method has poor sensitivity for gas detection. It can be seen from the seventh column of Figure 10 that the improved algorithm in this paper has significantly better detection ability for gas targets than other algorithms. In addition, it also shows a good detection effect when the overall environment is dark.
At the same time, our improved algorithm has good stability. When gas leaks continue to occur, due to the background update strategies of other algorithms, some gas-leak areas will be identified as backgrounds after a period of gas leakage, and the gas-leak areas cannot be effectively detected. As shown in Figure 11, the frame difference method has poor stability. When the temperature in the picture changes or the branches slightly shake, it will have a great impact on the results. The background of the frame difference method is fixed and cannot be used according to the video sequence. The background is updated in real time, making it less immune to noise. In the processing of subsequent frames by the GMM algorithm, the gas nozzle is identified as the background, which has a large error in the actual gas detection application. The SuBSENSE algorithm also decreases its detection sensitivity with the release time of the gas, and fails to effectively detect the gas leakage area in the follow-up of scenario 4. As can be seen from the seventh row of Figure 11, for the processing results of different frames of scene 3 and scene 4, the improved algorithm in this paper has a good detection effect on the gas nozzle and has good anti-noise ability.
The definition of F1 is as follows (14):
F 1 = 2     Precision     Recall Precision   +   Recall
The F1 value of the 68th frame of scene 4 is the arithmetic mean divided by the geometric mean, and both the precision rate and the recall are weighted. As shown in Table 3, the algorithm in this paper is the best value in the five results. In addition, the results of the six scenarios achieved better performance. Compared with other algorithms, the algorithm in this paper can effectively improve the F1 value under the condition of high detection accuracy, and can better segment the gas cloud.
Combining the safety issues in the laboratory, sulfur hexafluoride and carbon tetrafluoride were selected for imaging. Their absorption peaks are showed in Table 4. In addition, these videos were processed by our method.
Figure 12 shows the result of six-filter video processing of sulfur hexafluoride gas, Figure 12a shows the imaging result of filter a, and so on. It can be seen that the imaging effect of each filter is very different. According to the results, it can be concluded that gas leakage cannot be observed in filter a, b, and c, and traces of gas leakage can be observed in filter d, e, and f. By comparison, it can be determined that the gas leaking in the scene is sulfur hexafluoride gas.
Figure 13 shows the result of six-filter video processing for carbon tetrafluoride gas. Spectral filter b and e have poor imaging effects due to the absorption characteristics of water vapor in the atmosphere. Spectral channel d is located in the atmospheric window, so the imaging effect of gas is the best. According to the results, it can be concluded that no gas leakage can be observed in filter a, e, and f, and traces of gas leakage can be observed in filter b, c, and d. By comparison, it can be determined that the gas leaking in the scene is carbon tetrafluoride gas.

5. Conclusions

We propose and develop an effective method for gas-leak area detection and gas identification with mid-infrared image. The related imaging principle and gas-leak detection algorithm are presented. Gas-leak monitoring and identification experiments were conducted for two gases in four different scenarios. Two indoor scenes and one outdoor scene are included. Combining the algorithm recognition results with objective indicators, the algorithm proposed in this paper can effectively segment the gas clouds in different scenes at different times, and effectively improve the F1 values with high detection accuracy. Finally, experiments weeR conducted using sulfur hexafluoride and carbon tetrafluoride gases, and the experimental results verify that the method and system has the ability to detect and identify multiple gas leaks.

Author Contributions

The work described in this manuscript is a collaborative development of all authors. Conceptualization and resources, W.C.; methodology and software, X.N., Q.Z. and D.L.; validation, X.N., Q.Z., D.L. and J.W.; data curation, X.N. and D.L.; writing—original draft preparation, X.N.; writing—review and editing, Q.Z. and W.C.; project administration, W.C. and Q.L.; funding acquisition, W.C. All authors have read and agreed to the published version of the manuscript.

Funding

This research was funded by the Key-Area Research and Development Program of Guangdong Province (no. 2019B111102003), Youth Innovation Promotion Association CAS and International Collaborative Research Program (GJHZ20210705141403009), Shenzhen Science and Technology Innovation Committee.

Institutional Review Board Statement

Not applicable.

Informed Consent Statement

Not applicable.

Data Availability Statement

Not applicable.

Conflicts of Interest

The authors declare no conflict of interest.

References

  1. Dhall, S.; Mehta, B.R.; Tyagi, A.K.; Sood, K. A review on environmental gas sensors: Materials and technologies. Sens. Int. 2021, 2, 100116. [Google Scholar] [CrossRef]
  2. Hagen, N. Survey of autonomous gas leak detection and quantification with snapshot infrared spectral imaging. J. Opt. 2020, 20, 103001. [Google Scholar] [CrossRef]
  3. Sekhar, P.K.; Brosha, E.L.; Mukundan, R.; Linker, K.L.; Brusseau, C.; Garzon, F.H. Trace detection and discrimination of explosives using electrochemical potentiometric gas sensors. J. Hazard. Mater. 2011, 190, 125–132. [Google Scholar] [CrossRef] [PubMed]
  4. Liu, B.; Ma, H.; Zheng, X.; Peng, L.; Xiao, A. Monitoring and detection of combustible gas leakage by using infrared imaging. In Proceedings of the 2018 IEEE International Conference on Imaging Systems and Techniques (IST), Krakow, Poland, 16–18 October 2018; pp. 1–6. [Google Scholar]
  5. Zhu, L.; Suomalainen, J.; Liu, J.; Hyyppä, J.; Kaartinen, H.; Haggren, H. A review: Remote sensing sensors. In Multi-Purposeful Application of Geospatial Data; IntechOpen: London, UK, 2018; pp. 19–42. [Google Scholar]
  6. Murvay, P.S.; Silea, I. A survey on gas leak detection and localization techniques. J. Loss Prev. Process. Ind. 2012, 25, 966–973. [Google Scholar] [CrossRef]
  7. Narkhede, P.; Walambe, R.; Mandaokar, S.; Chandel, P.; Kotecha, K.; Ghinea, G. Gas detection and identification using multimodal artificial intelligence based sensor fusion. Appl. Syst. Innov. 2021, 4, 3. [Google Scholar] [CrossRef]
  8. He, Y.; Deng, B.; Wang, H.; Cheng, L.; Zhou, K.; Cai, S.; Ciampa, F. Infrared machine vision and infrared thermography with deep learning: A review. Infrared Phys. Technol. 2021, 116, 103754. [Google Scholar] [CrossRef]
  9. Linares, R.; Vergara, G.; Gutiérrez, R.; Fernández, C.; Villamayor, V.; Gómez, L.; González-Camino, M.; Baldasano, A. Gas and flame detection and identification using uncooled MWIR imaging sensors. In Proceedings of the SPIE 9485, Thermosense: Thermal Infrared Applications XXXVII, 94851F, Baltimore, MD, USA, 12 May 2015; pp. 385–390. [Google Scholar]
  10. Bernascolle, P.F.; Elichabe, A.; Fervel, F.; Haumonté, J.B. Stand-off CWA imaging system: Second sight MS. In Proceedings of the SPIE 8358, Chemical, Biological, Radiological, Nuclear, and Explosives (CBRNE) Sensing XIII. 83581B, Baltimore, MD, USA, 4 May 2012; pp. 333–339. [Google Scholar]
  11. Tombet, S.B.; Gatti, S.; Eisele, A.; Morton, V. Observation and Quantification of CO2 passive degassing at sulphur Banks from Kilauea Volcano using thermal Infrared Multispectral Imaging. In Proceedings of the Copernicus Meetings, EGU General Assembly 2020, Online, 4–8 May 2020. EGU2020-4816. [Google Scholar]
  12. Lu, Q.; Li, Q.; Hu, L.; Huang, L. An Effective Low-Contrast SF6 Gas Leakage Detection Method for Infrared Imaging. IEEE Trans. Instrum. Meas. 2021, 70, 1–9. [Google Scholar] [CrossRef]
  13. Otsu, N. A threshold selection method from gray-level histograms. IEEE Trans. Syst. Man, Cybern. 1979, 9, 62–66. [Google Scholar] [CrossRef] [Green Version]
  14. Stauffer, C.; Grimson, W.E.L. Adaptive background mixture models for real-time tracking. In Proceedings of the 1999 IEEE Computer Society Conference on Computer Vision and Pattern Recognition (Cat. No PR00149), Fort Collins, CO, USA, 23–25 June 1999; Volume 2, pp. 246–252. [Google Scholar]
  15. Barnich, O.; Van Droogenbroeck, M. ViBe: A universal background subtraction algorithm for video sequences. IEEE Trans. Image Process. 2010, 20, 1709–1724. [Google Scholar] [CrossRef] [PubMed] [Green Version]
  16. St-Charles, P.L.; Bilodeau, G.A.; Bergevin, R. SuBSENSE: A universal change detection method with local adaptive sensitivity. IEEE Trans. Image Process. 2014, 24, 359–373. [Google Scholar] [CrossRef] [PubMed]
Figure 1. Block diagram of broadband infrared spectral imaging system.
Photonics 09 00992 g001
Figure 2. (a) Physical view of broadband infrared spectral imaging system; (b) Rendering picture of broadband infrared spectral imaging system.
Photonics 09 00992 g002
Figure 3. Schematic diagram of adaptive histogram segmentation based on local minima.
Photonics 09 00992 g003
Figure 4. Comparison of infrared image-enhancement algorithm results.
Photonics 09 00992 g004
Figure 5. The construction diagram of pixel-background sample set.
Photonics 09 00992 g005
Figure 6. The construction diagram of pixel background sample set.
Photonics 09 00992 g006
Figure 7. Schematic diagram of foreground detection in two-dimensional space.
Photonics 09 00992 g007
Figure 8. Three results of updating the background model sample set when N = 6 .
Photonics 09 00992 g008
Figure 9. Improved background-model building process.
Photonics 09 00992 g009
Figure 10. Comparison of detection results of different frame algorithms in the scene.
Photonics 09 00992 g010
Figure 11. Comparison of detection results of different frame algorithms in the scene.
Photonics 09 00992 g011
Figure 12. The imaging processing results of (a) LP2000 (b) LP3750 (c) LP4750 (d) LP6360 (e) LP9000 (f) LP10150 of sulfur hexafluoride.
Photonics 09 00992 g012
Figure 13. The imaging processing results of (a) LP2000 (b) LP3750 (c) LP4750 (d) LP6360 (e) LP9000 (f) LP10150 of carbon tetrafluoride.
Photonics 09 00992 g013
Table 1. The filters of this device 1.
Filtersabcdef
TypeLP2000LP3750LP4750LP6360LP9000LP10150
Table 2. Infrared image-enhancement algorithm processing result parameter comparison.
Original Image CLAHE AHS Our Method
ParametersAGIEEMEAGIEEMEAGIEEMEAGIEEME
Scenario 10.0742.6910.50.0792.3516.50.1013.1815.50.0762.7217.3
Scenario 20.0742.3614.30.1052.8733.20.0673.7915.60.0962.9025.5
Scenario 30.0823.039.90.1643.0915.80.1183.3912.70.1633.2127.6
Table 3. F1 comparison of algorithm results in different scenarios.
F1Interframe DifferenceViBe [15]GMM [13]SubSENSE [16]Ours
Scene 10.69380.21960.66190.05550.7582
Scene 20.63830.30720.73420.58820.9358
Scene 3 Frame 1130.83940.09310.78010.53230.8972
Scene 3 Frame 2000.91420.58620.75890.13860.8236
Scene 4 Frame 680.61080.23280.5010.44250.8596
Scene 4 Frame 1860.3660.19190.6166-0.8756
Table 4. Gas absorption peak.
GasChemical FormulaAbsorption Peak
sulfur hexafluoride SF 6 10.56 μ m
carbon tetrafluoride CF 4 7.8 μ m
Publisher’s Note: MDPI stays neutral with regard to jurisdictional claims in published maps and institutional affiliations.

