1. Introduction
Since the 20th century, astronomical telescopes have shown two major development trends. One is to develop in the direction of a large aperture and large field of view [
1,
2,
3,
4,
5] to obtain higher spatial resolution and resolution efficiency; the other is to develop from ground-based telescopes to space telescopes [
6,
7,
8] to reduce the influence of atmospheric and other factors on the observation results. Therefore, large-aperture and large-field-of-view space telescopes are an important branches of the future development of astronomical observation equipment. However, due to the non-Lambertian reflection characteristics of the telescope observation target and the response characteristics of the telescope sensor, the information received by the telescope image detector contains radiometric aberrations. It is necessary to carry out flux calibration to obtain the radiometric properties of the target [
9,
10]. The high-precision flux calibration enables the telescope to measure the shape of galaxies more accurately, reduce transmission errors, and promote the upgrade of deep space exploration to quantitative and refined technology [
11,
12]. Therefore, it is of great significance to carry out high-precision flux calibrations for space telescopes with large apertures and large-fields.
At present, the integrating sphere method, the flat-field screen method, and the collimator method are commonly used to calibrate the flux of optical loads [
13,
14,
15]. To adapt to the working environment of a space telescope, the flux calibration method for a large-aperture space telescope based on multifield calibration (MFFC) is proposed. Based on flat-field calibration, the sub-field calibration is selected to obtain the full-field calibration information. In the process of sub-field scanning, the calibration light source will produce brightness drift after working for a long time. Therefore, it is necessary to accurately measure the stability of the light source to correct the calibration coefficient.
To improve the flux calibration accuracy, the calibration source is traced to the radiation standard. The common method is to use a luminous intensity standard lamp (SL) and a photometer to measure the luminous intensity of the calibration light source according to the equidistance method. For example, the radiometric calibration spectral source (RCSS) [
16] in the James Webb Telescope and the direct illumination calibration experiment (DICE) [
17] in the Sloan Digital Sky Survey project trace the stability of the light source to the national standards. However, the equidistance method of measuring the stability of the light source has the limitation that it cannot monitor the luminous intensity of the light source in real-time and the long term.
This manuscript proposes a method to measure the stability of a calibration light source using a photodetector (PD) to achieve the purpose of long-term, real-time monitoring of light source stability and, to a certain extent, improve the measurement accuracy of light source stability. The monitoring time of the stability is extended from 4 h to 8 h or more. First, a light-emitting diode (LED) is used to calibrate the stability of a PD; then, the calibrated PD is used to measure the stability of the calibrated light source; finally, the stability of the calibrated light source and the measurement uncertainty is evaluated. In the simulation analysis and experimental verification, the gaze time is 5 min, and the PD sampling frequency is 15 Hz when the flux calibration time is set to 8 h. The experimental results show that the stability uncertainty of the calibration light source was 0.42%, and the relative measurement uncertainty was 0.01%. The experimental results show that the measurement accuracy of using PD monitoring and the stability of the light source meets the calibration requirements of the space gaze camera. The method can be used to correct the coefficients in the flux calibration work of the large-aperture space telescope to obtain more accurate scientific observation results.
2. Light Source Stability on Flux Calibration
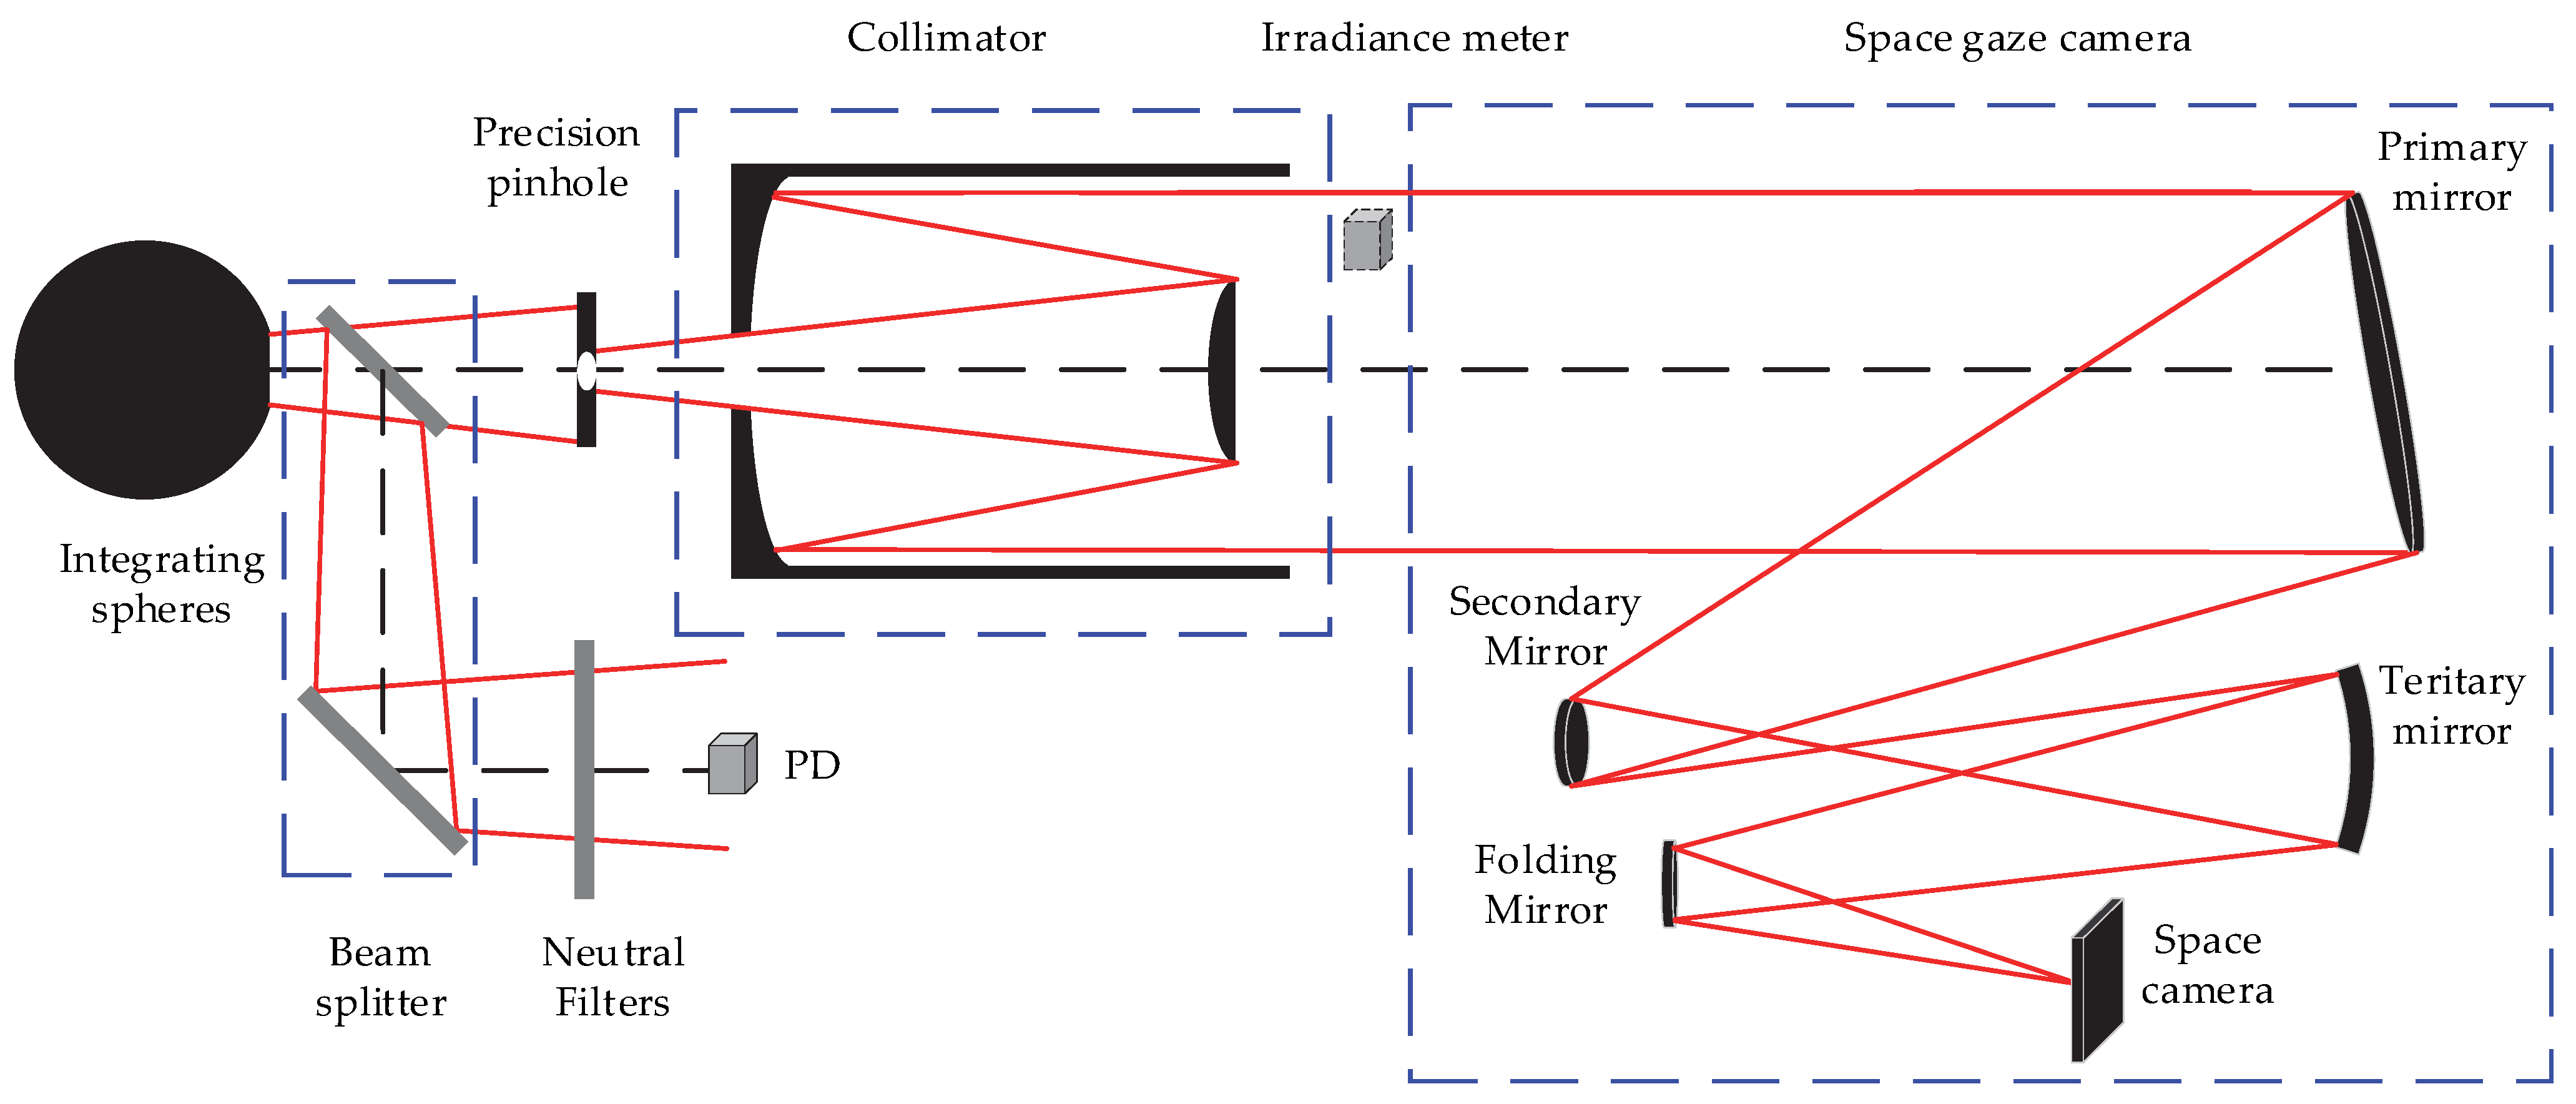
At present, space telescopes are developing toward large-aperture and large fields of view for deep space exploration. The commonly used flux calibration methods, such as the integrating sphere method, can no longer meet the calibration needs of space telescopes. Therefore, an MFFC device is proposed, as shown in
Figure 1. Based on flat-field calibration, multiple subfields are selected for calibration to achieve the purpose of full-field flux calibration. For imaging faint targets in deep space exploration, the space telescope uses a gaze camera at the image plane. The beam-splitting device divides the emergent light of the integrating sphere source into two beams; one beam is used for calibrating the space gaze camera, and the other beam is used for monitoring the stability of the light source in real-time. A neutral density filter is used to adjust the irradiance of the PD to ensure that it is within the linear operating range of the PD.
The integrating sphere light source can be approximated as a Lambertian source. The radiant flux
Φ through the precision pinhole is:
where
E represents the irradiance at the pinhole,
S represents the area of the pinhole,
π is the PI,
I represent the luminous intensity of the light source,
d represents the pinhole diameter, and
l is the distance between the light source and the pinhole. Through the collimator and the space telescope, the radiant flux received by the space camera is attenuated by
c (0 <
c < 1), i.e.,
The output voltage
V of the space camera can be calculated by the following equation [
18]:
where
P represents the responsivity of the image plane detector, and
Rf is the gain of the detector preamplifier.
The flux calibration coefficient
R of the space telescope can be calculated by the following equation:
where
L represents the radiance at the entrance pupil of the telescope, which is measured by the luminance meter.
Space telescopes have a long gaze time to achieve the detection of faint targets in deep space. To improve the accuracy of the laboratory flux calibration, the calibration coefficient of the space camera during the gaze time should be calculated.
When the space camera is used for deep space observation, the variation in the total energy
Q is received by the image plane during the gaze time. That is:
where
t0 is the start time of the single gaze imaging in the telescope and
τ is the time of the single gaze. When the luminous intensity of the calibration light source changes with time as
I(
t), the energy received by the image plane of the staring camera is a function of time
Q(
t):
The flux calibration coefficient of the space telescope at this time is:
The stability of the light source has less influence on the calibration accuracy when the gaze time of the space camera is short. There is a gradual increase in the impact of light source stability on the calibration accuracy with the growth of the gaze time. In summary, the quantitative analysis of the light source stability should be performed to improve the accuracy of space telescope flux calibrations. To improve the calibration accuracy, the light source should be corrected if the stability uncertainty is larger.
3. Measurements of Light Source Stability
Parallel light is incident on the telescope at different field-of-view angles when using the MFFC calibration space telescope. The attenuation coefficient introduced by the space telescope becomes
c(
θ), and the received energy
Q (
θ,
t) on the image plane is:
The received energy at the image plane decreases with the increasing angle at which parallel light is incident. Therefore, the stability of the calibration source cannot be analyzed directly using received energy from the spatial camera image plane detector.
3.1. Equidistance Method to Measure the Stability of the Light Source
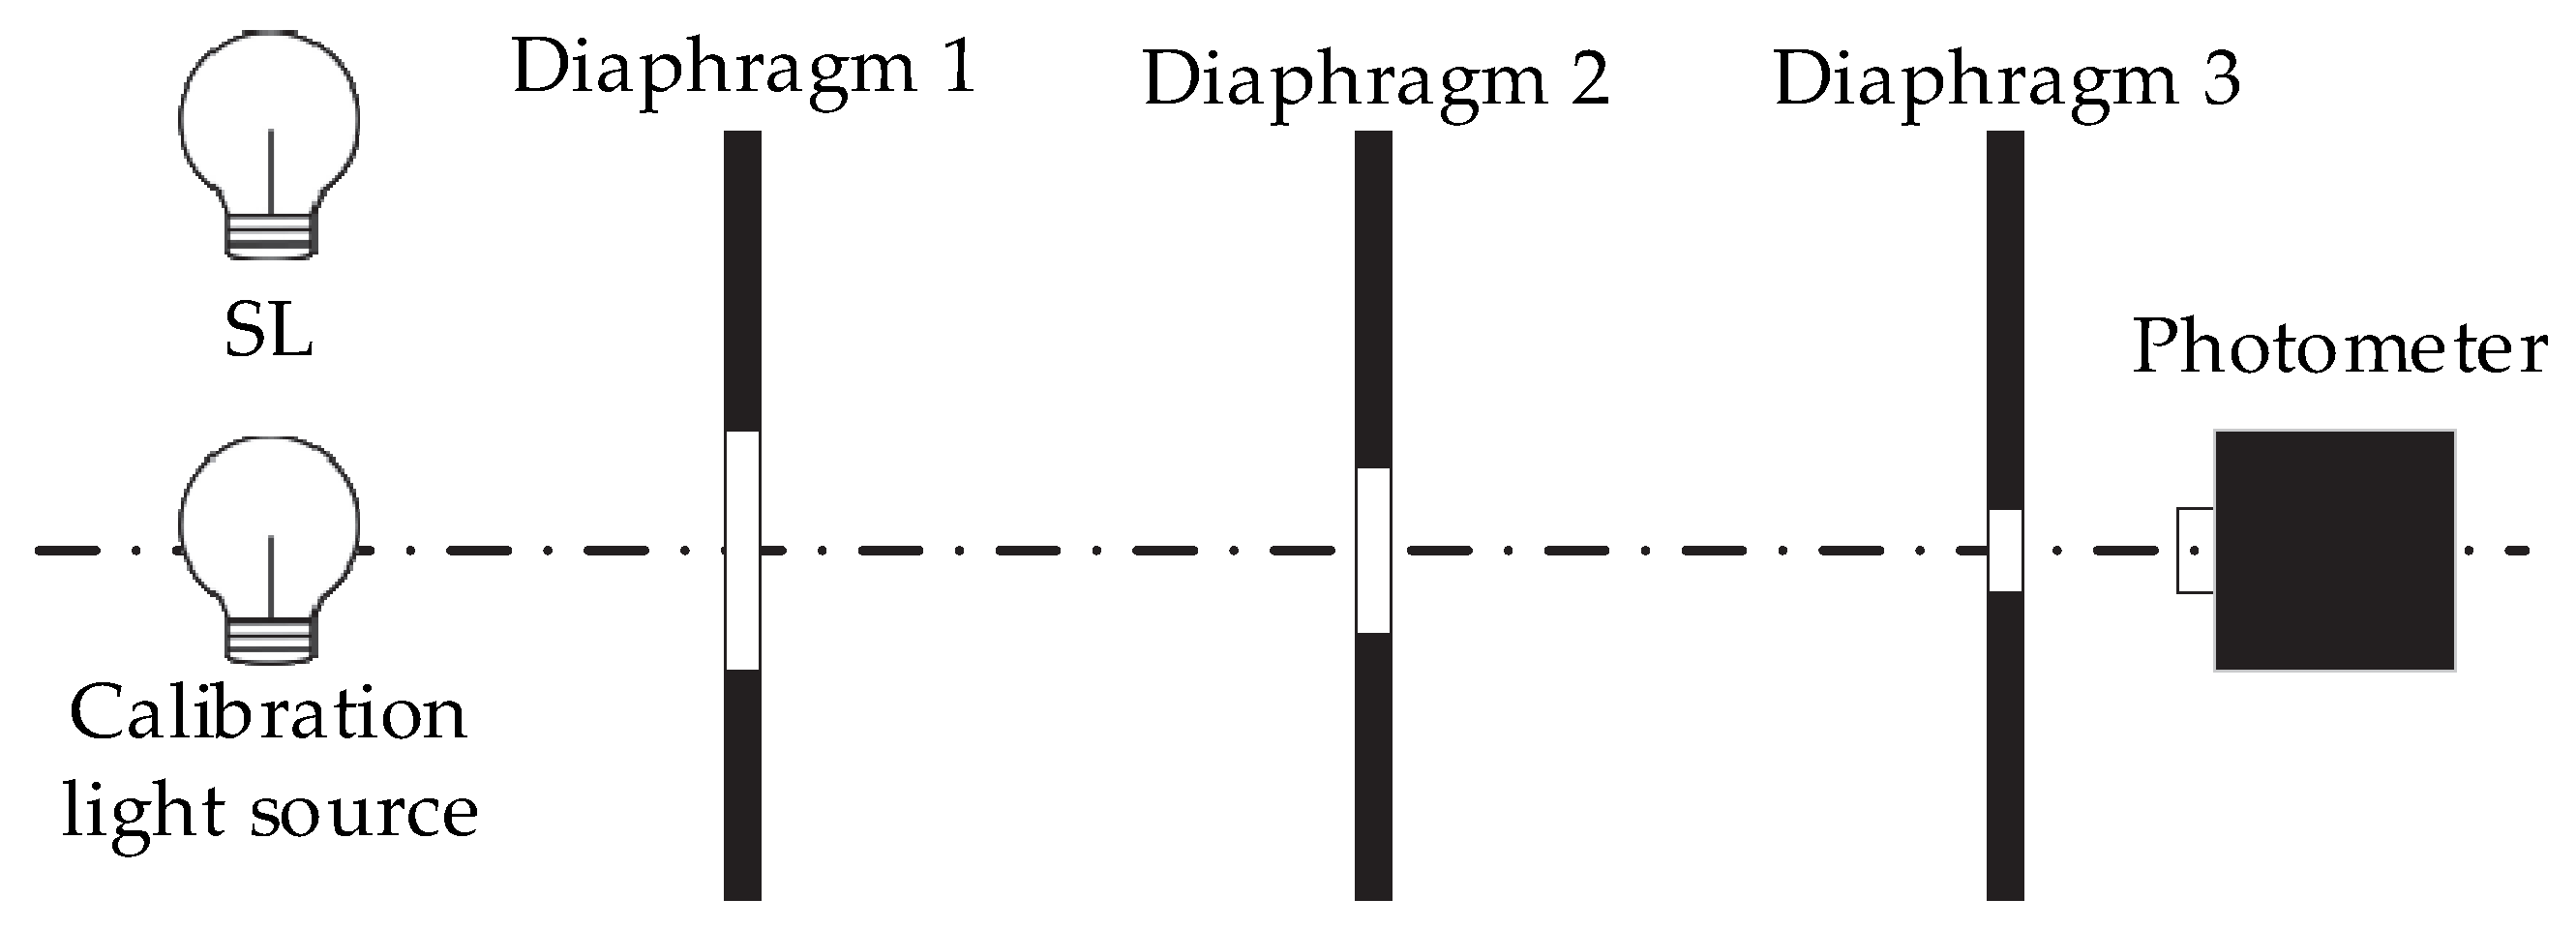
The commonly used measurement method for light source stability is shown in
Figure 2, which calibrates the light source stability with SL and the photometer according to the equidistance method.
However, the equidistance method has some limitations when measuring the stability of the light source:
The luminous intensity of the SL is used as the standard. The measurement results of luminescence intensity are transmitted using the photometer. The real-time monitoring of the calibrated light source cannot be realized.
SL was required so that the voltage change at the lamp terminal did not exceed 0.15% within 4 h of illumination. When using MFFC for the flux calibrations of space telescopes, the total calibration time is much longer than 4 h due to the large aperture and gaze imaging of the space telescope. Therefore, the equidistance method cannot achieve the long-term monitoring of the calibration light source stability.
In summary, the equidistance method cannot monitor the stability of the calibration light source in real-time and over time. The voltage fluctuations at the lamp terminal of the SL are consistent with a uniform distribution. The uncertainty
u1 of the equidistance method is calculated by the B class rating:
We propose to use PD to measure the stability of the light source in order to achieve a high-precision flux calibration for large-aperture space telescopes. This will realize the real-time and long-term monitoring of light source stability, as well as improve measurement accuracy.
3.2. PD Measurement of the Stability of the Light Source
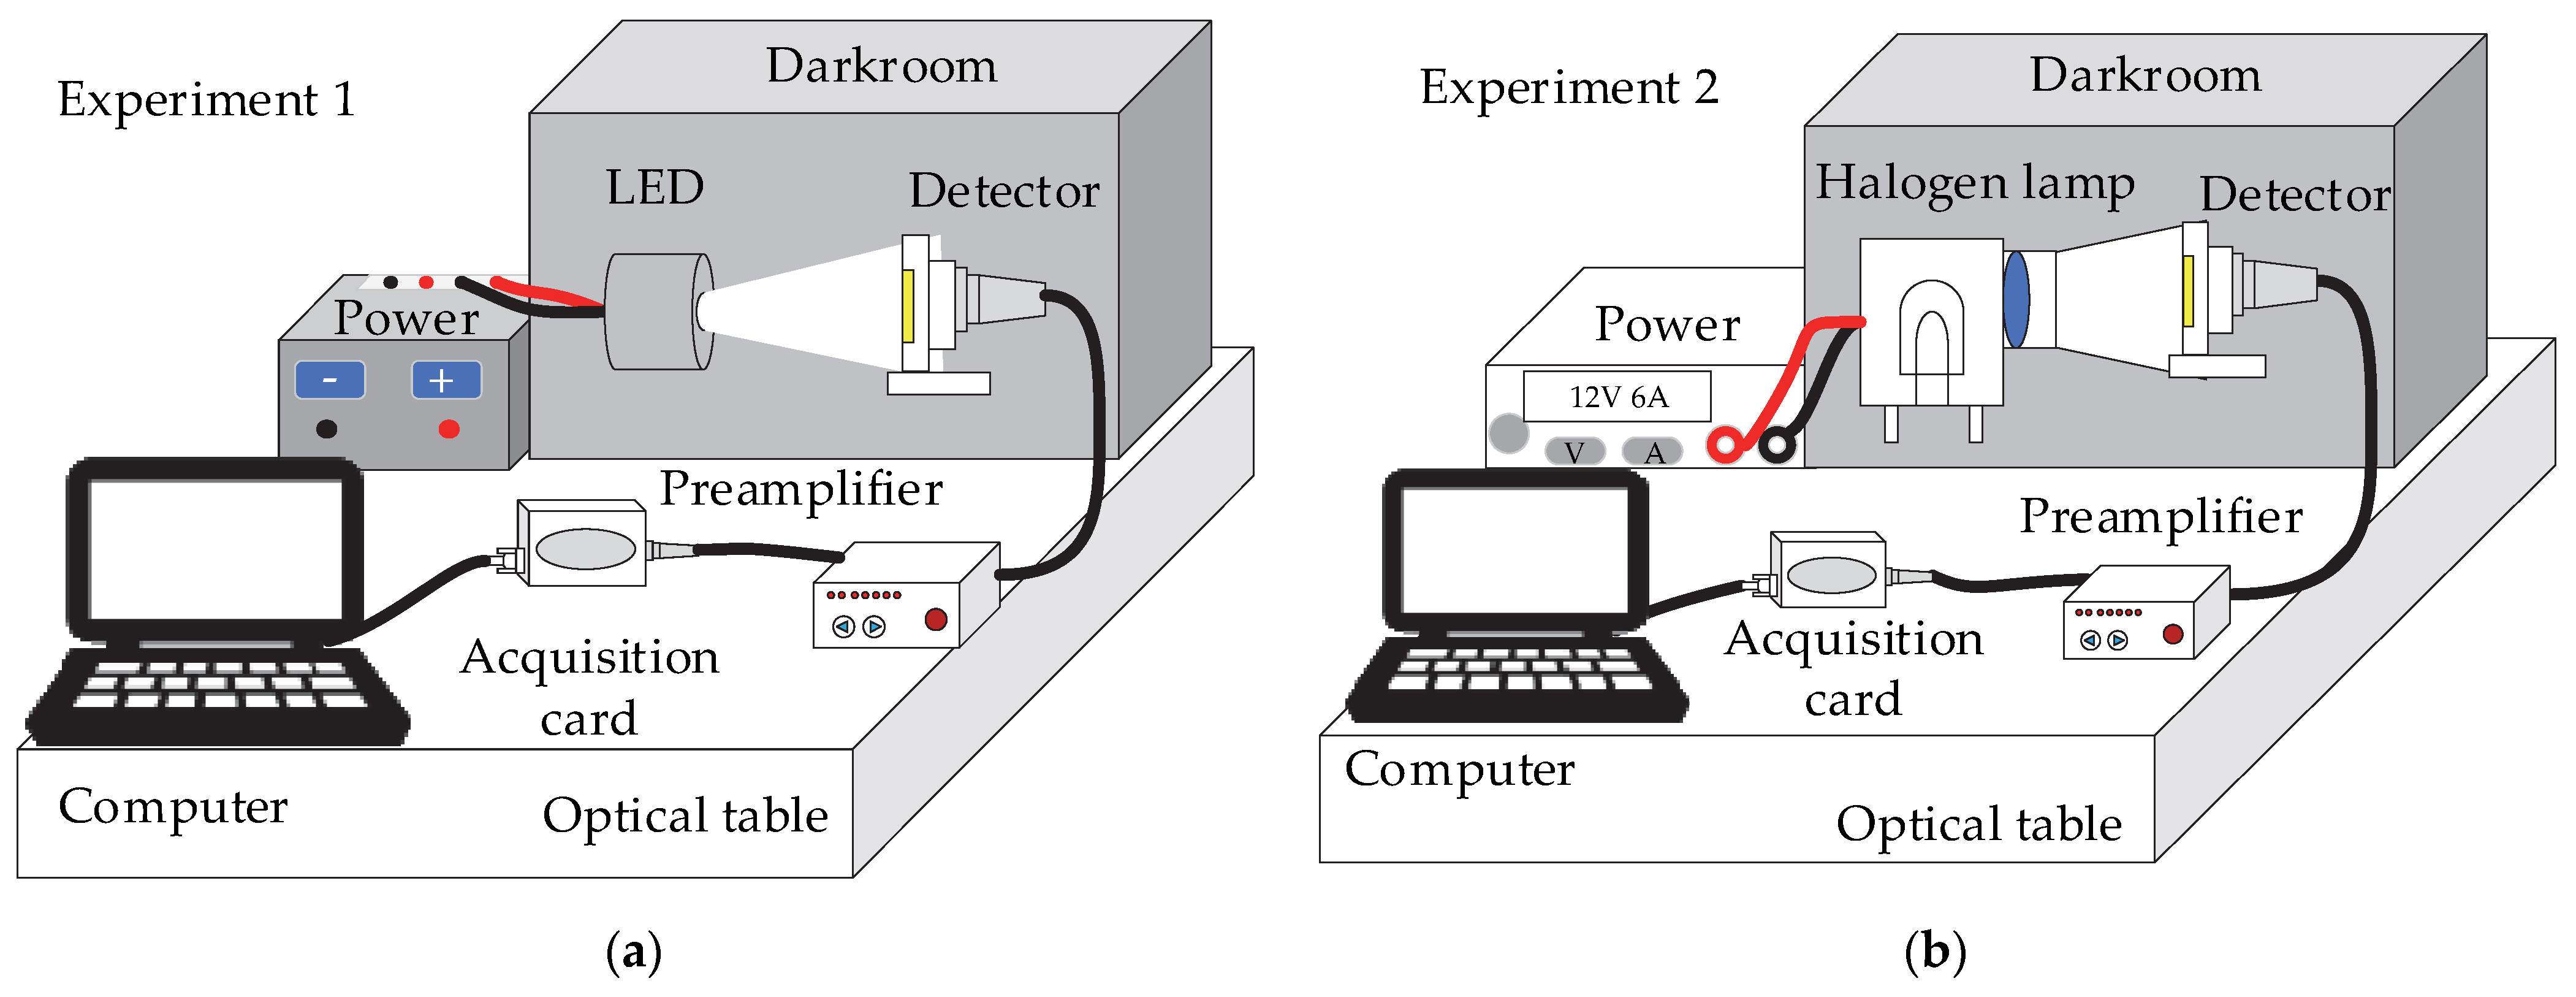
The device for the PD measurement of light source stability is shown in
Figure 3. It consists of a light source system and a real-time monitoring system. The light source system includes an LED light source and a halogen lamp. In Experiment 1, the LED light source is used to calibrate the stability of the PD, as shown in
Figure 3a; in Experiment 2, the halogen lamp is used as the calibration light source, and the stability measurement device is shown in
Figure 3b. The real-time monitoring system consists of a PD, a preamplifier, an AD acquisition card, and a computer. Since the stability of the light source characterizes the relative change degree of the light source luminance over time, the influence of the spatial uniformity of the light source luminance on the measurement results is not considered.
The total energy
Q(
T) received by the PD during the gaze time is:
The stability of PD in Experiment 1 is characterized by the fluctuation of Q(T). The main sources of uncertainty are the stability of LED and PD. Therefore, the lamp terminal voltage of the LED light source should be monitored during the experiment. In Experiment 2, the stability of the light source is characterized by the fluctuation of Q(T). The main error source is the stability of the detector.
3.3. Light Source Stability Measurement Accuracy
The factors affecting the measurement accuracy of the light source stability mainly include the following aspects:
LED stability is expressed as the stability of luminous intensity. The most important factors are the voltage fluctuation of the power supply, the ambient temperature, and the lifetime of the LED.
It is affected by the electricity consumption of the city’s power supply circuit. The voltage fluctuation between the peak and trough values ranges from −7 to 10%. It is assumed that the voltage fluctuations conform to a uniform distribution. According to the class B assessment, the introduced uncertainty is:
The introduced uncertainty is large. Voltage fluctuations are reduced by using a regulated power supply [
19].
The ambient temperature is an important factor impacting the luminous intensity of LED. LED operation creates heat accumulation in the surrounding environment. LED luminous intensity decreases as the temperature increases [
20]. To reduce the impact of temperature accumulation on the LED luminous intensity, a large number of heat sinks should be used to accelerate the temperature transfer.
The LED luminous intensity changes rapidly during the initial operation and then decays slowly. The lifetime of general lighting LED is 50,000~100,000 h [
21]. The lifetime of high-stability LED can be shortened by 10 times. The luminous intensity decreases as the LED ages. The stability of the calibration light source has a shorter measurement time compared to the lifetime of the LED. Therefore, the impact of LED aging on measurement accuracy is not considered.
- 2.
Noise of PD
The total noise introduced during the operation of the PD is:
where
r is the total noise,
rshot is the scatter noise,
rdark is the dark noise,
rVR is the thermal noise,
rread is the readout noise, and
rother is the fixed noise and other noises. Among them, thermal noise has the greatest impact on PD stability, which can be represented by the following equation:
where
k is the Boltzmann constant,
T is the absolute temperature,
R is the resistance, and Δ
f is the noise equivalent bandwidth. After the PD operate, the output voltage value increases with internal temperature accumulation. Dynamic stability is achieved after some time.
- 3.
Uncertainty introduced by stray light
The lower irradiance of the observed target is used for deep space exploration by space telescopes. The luminous intensity of the calibration light source is low during the flux calibration in the laboratory. Straying light from the external environment has a greater impact on the stability of the light source. Therefore, the experimental setup should be placed in a dark room when using PD to measure the stability of the light source.
In summary, the measurement uncertainty of the calibration source stability mainly comes from LED stability and PD stability. The uncertainty introduced by these two factors is finally expressed as the measurement uncertainty of PD in Experiment 1.
3.4. Light Source Stability Algorithm
For the flux calibration of space gaze cameras, the impact of light source stability on calibration accuracy is characterized as the change in the total energy received by the image plane during the gaze time. The change in the total energy received by the image plane during the gaze time should be considered when using PD to measure the stability of the light source. Therefore, a light source stability metrology algorithm is proposed for the flux calibration of the gaze camera. Based on the method for measuring the stability of the light source, the algorithm is used for measuring the stability of the flux calibration light source of the space gaze camera. This realizes the real-time, long-term, and high-efficient stability monitoring of the calibration light source. Improving the flux calibration precision of the space gaze camera is essential to obtaining more accurate scientific observation results.
In the light source stability measurement device shown in
Figure 3, the luminous flux received by the photosensitive surface at a single sampling of the PD can be calculated according to Equation (3):
The total energy
Q(
T) received by the PD during the gaze time can be calculated by:
where
f is the PD sampling frequency (in Hz) and
m is the number of PD sampled in the gaze time:
The uncertainty of the light source stability is evaluated using the standard deviation
s:
where
vi is the residual error,
n is the number of gaze times in the calibration time, and
Q0 is the estimate of
Q(
T).
Q0 is the mean when
Q(
T) does not drift significantly; otherwise, the initial value is taken. To describe the stability of the light source more accurately, the relative uncertainty
u is used to evaluate the influence of the light source stability on the calibration coefficient:
Formulas (15)–(19) are used to process the measurement results of Experiment 1 and Experiment 2, respectively. In this case, the stability uncertainty of the calibration source and the relative measurement uncertainty of the measurement method can be obtained.
4. Simulation Verification
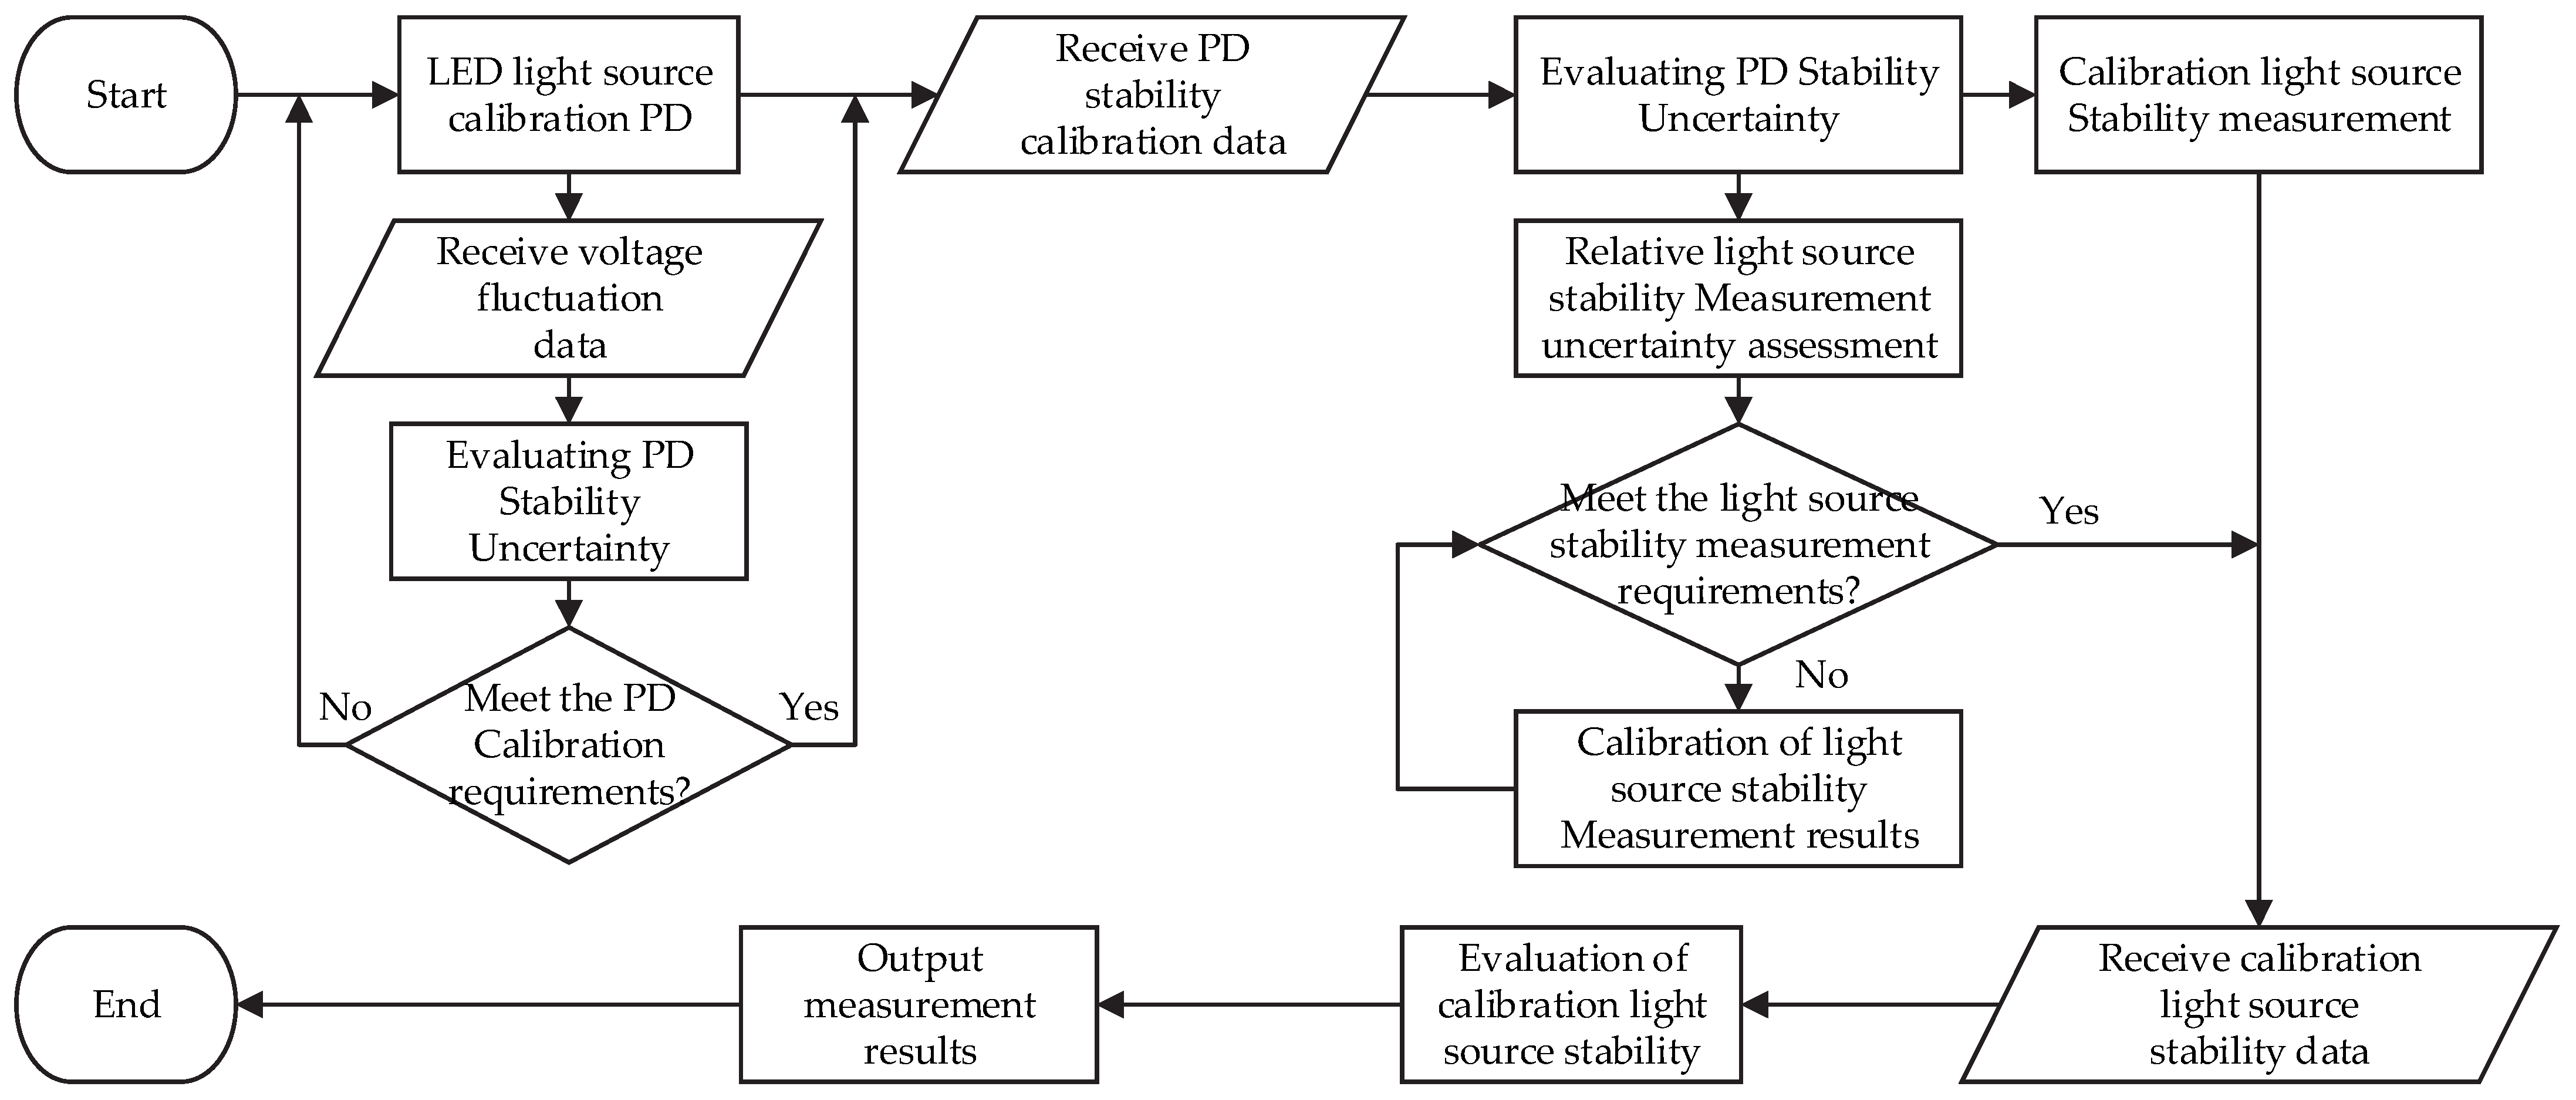
Figure 4 shows the flowchart of the light source stability measurement for the flux calibration of the space gaze camera. Firstly, the stability of PD is calibrated using the LED light source, and the output voltage of PD and the terminal voltage of the LED light source are measured. When the lamp terminal voltage fluctuation can meet the PD calibration requirements, the calibrated PD is used to measure the stability of the calibration light source. The measurement result is output if the measurement uncertainty introduced by the PD stability can meet the light source stability requirements of the flux calibration of the space gaze camera.
The total calibration time of the spatial gaze camera is controlled at 8 h, and the single gaze time is 5 min. Moreover, the sampling frequency of PD is set to 15 Hz. The feasibility of the light source stability for measuring the flux calibration of the space gaze camera by PD is verified through the simulation analysis of Experiment 1 and Experiment 2.
When the luminous intensity of the LED light source is set to 0.5 cd, there is a random error of 0.05%, which conforms to the uniform distribution. This produces a drift of 0.01% in the calibration process. The PD photosensitive surface area is 100 mm
2, and the responsiveness is 0.52 A/W. The gain of the preamplifier circuit is 10
4 V/A. Moreover, the distance between the LED and the PD is 1000 mm. There is a 0.05% random error in the PD, which conforms to the normal distribution. The PD output voltage in Experiment 1 is shown in
Figure 5.
Substitute the measured data in
Figure 5 into Equation (15). The change in the total energy received by PD with time within the imaging time of a single gaze in Experiment 1 can be obtained as shown in
Figure 6.
The statistical analysis of the results in
Figure 6 shows that the relative uncertainty of PD stability was 0.01% when the gaze time was 8 h.
It is assumed that the spectral range of the space gaze camera flux calibration light source is the same as that of the LED light source. Set the luminous intensity to 1 cd, and the relative error limit is 0.05%, which conforms to the normal distribution. Moreover, the luminous intensity has a drift of 0.5% in the calibration process. The distance between the light source and the PD is 1000 mm. The output voltage of PD in Experiment 2 is shown in
Figure 7.
Substitute the data in
Figure 7 into Equation (15). The change in the total energy received by PD over time within a single gaze time in Experiment 2 can be obtained, as shown in
Figure 8.
The statistical analysis of the data in
Figure 8 can be seen in that the relative uncertainty of the calibration light source stability was 0.58% when the gaze time was 8 h.
The simulation result shows that when the gaze time is 5 min and the PD sampling frequency is 15 Hz within the 8 h flux calibration time, the stability of the calibration light source is 0.58%. The relative measurement uncertainty of this method was 0.01%. It was proved that the stability of the light source for the flux calibration of the space gaze camera using PD measurement could meet the accuracy requirement of long-time flux calibration.
5. Validation Experiments and Results
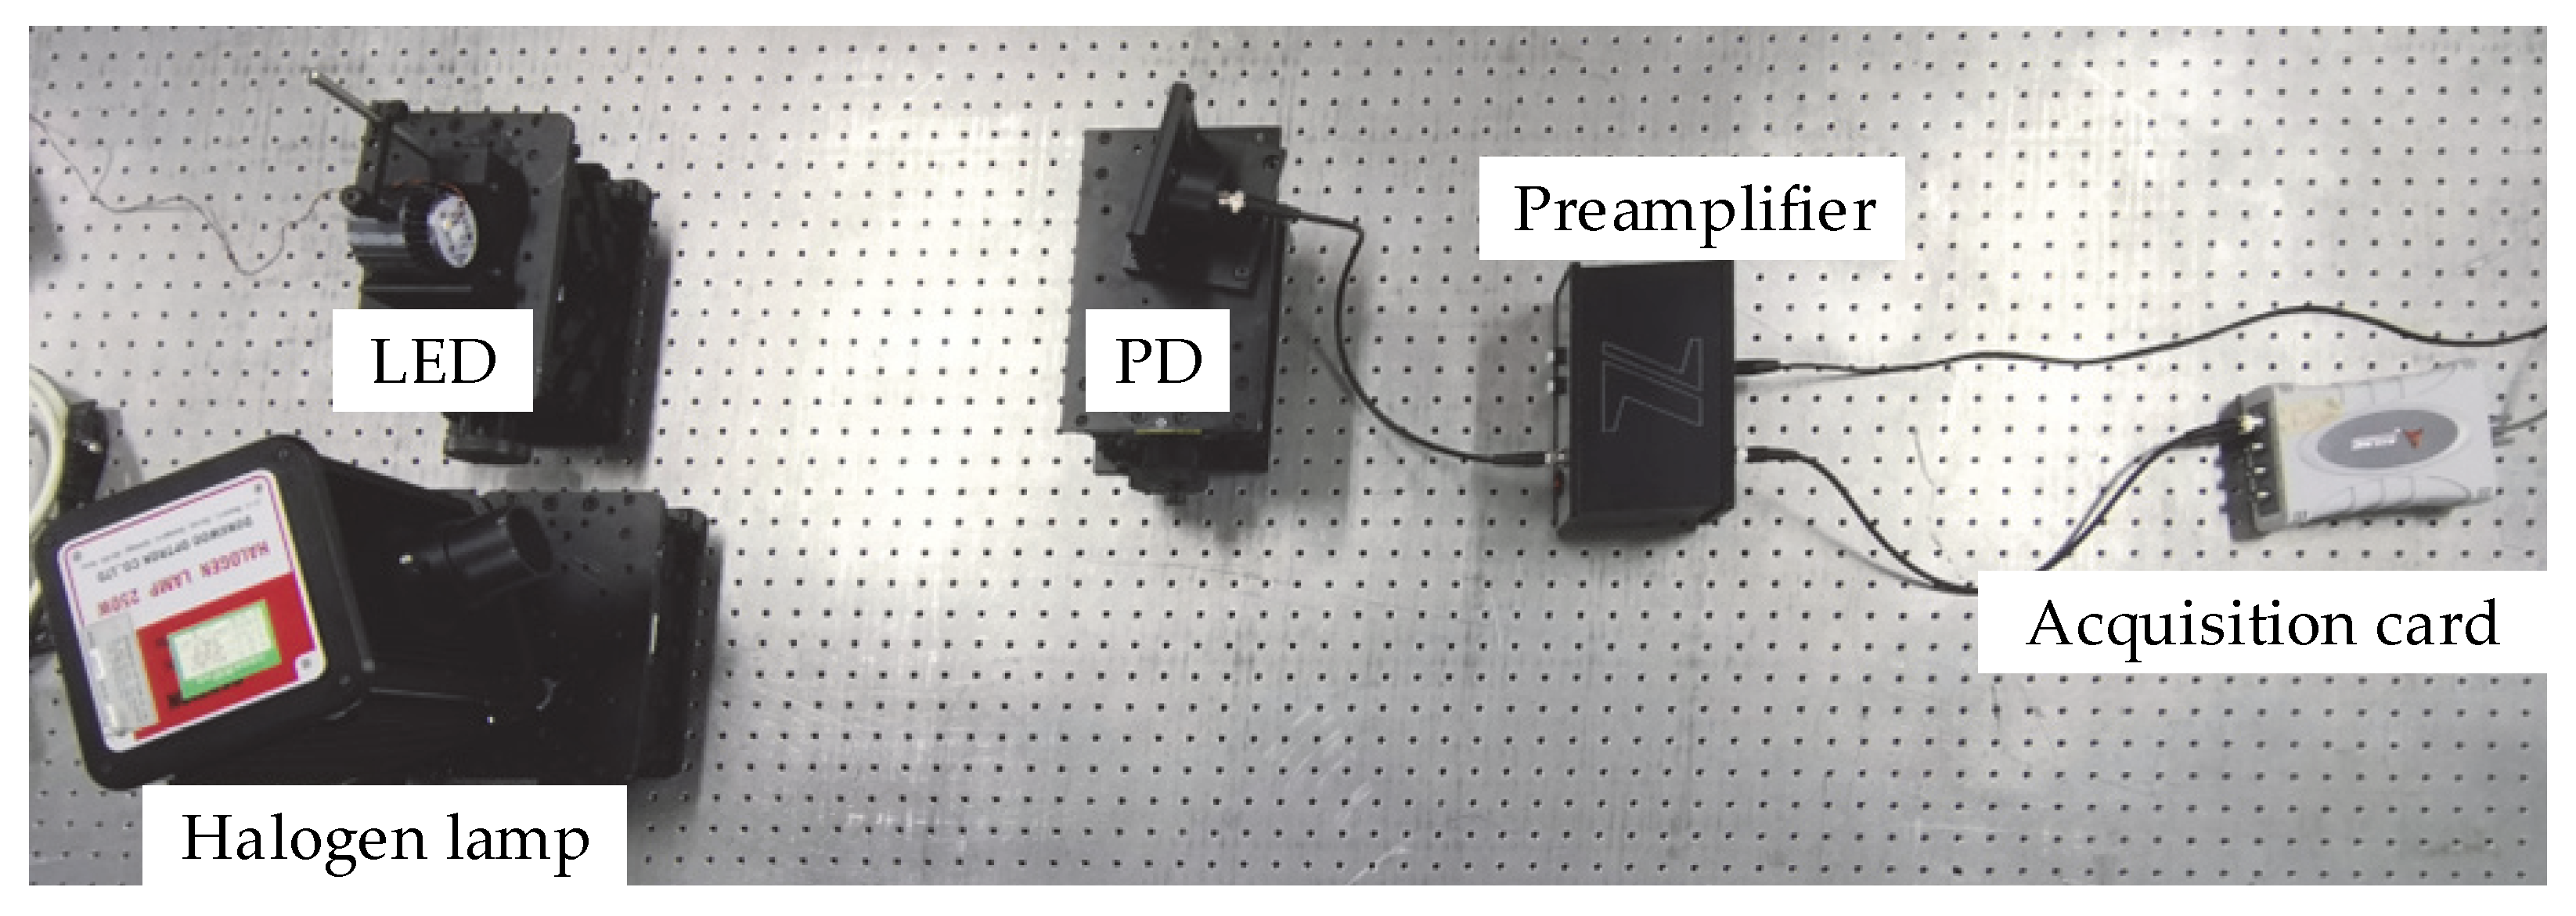
5.1. Experimental Device
The device for the real-time measurement of the calibration light source stability is shown in
Figure 9 and includes the light source system and real-time monitoring system. To reduce the influence of the external environment on measurement accuracy, the experiment was carried out in a dark room. The ambient temperature was controlled to 25 ± 0.5 °C.
In Experiment 1, a white LED was used as the light source. A heat sink was used to improve the heat dissipation efficiency of the LED and reduce the influence of temperature accumulation on the LED light source stability. In Experiment 2, a halogen lamp with a similar detection band as that of the space gaze camera was selected as the flux calibration light source.
To reduce the impact of voltage fluctuations on the LED luminous intensity using a regulated power supply, the voltage change at the lamp terminal of the LED was monitored using a 6-1/2 digit precision multimeter to quantitatively assess the voltage fluctuation at this point.
The PD was selected from the Zolix (Beijing, China) DSi300 silicon photodetector. The structure diagram and photoelectric parameters are shown in
Figure 10 and
Table 1, respectively. The ZAMP-A was used for the preamplifier. The ADLINK 2405 data acquisition card was used to connect with the computer for data acquisition. This set of optoelectronic measurement equipment has the advantages of a wide detection wavelength range and low equivalent noise power. It can be used for the precision measurement of the luminous intensity of the flux-calibrated light source for space telescopes.
The sampling frequency in the experiment was 15 Hz. The preamplifier gain was set to 104 V/A. A neutral density filter was used to adjust the irradiance of the PD within the linear operating range.
5.2. Experimental Program
The PD was calibrated using LED in Experiment 1. The voltage at the lamp terminal of the LED is measured using a 6-1/2-digit precision multimeter at 1 h intervals. The number of single measurement readings was not less than three, and the mean should be taken as the single measurement result of the lamp terminal voltage. In Experiment 2, PD was used to measure the stability of the halogen lamp.
The measurement time for both experiments was 8 h. The experiments were set up with a gaze imaging of 5 min. The output voltage of PD when the luminous intensity of the light source was stable was selected for data processing. The relative uncertainty of the PD stability in Experiment 1 was the relative measurement uncertainty of this experiment. To ensure the accuracy of the measurement results, the stability of the calibration light source was repeatedly measured three times. The average value of the relative uncertainty was taken as the final measurement result.
5.3. Experimental Results and Analysis
Table 2 shows the measurement results of the terminal voltage at the LED light source in Experiment 1. The results show that the maximum relative error of the lamp terminal voltage was 0.002% when it conformed to the uniform distribution. The uncertainty introduced by the voltage fluctuation of the supply power supply
u3 is:
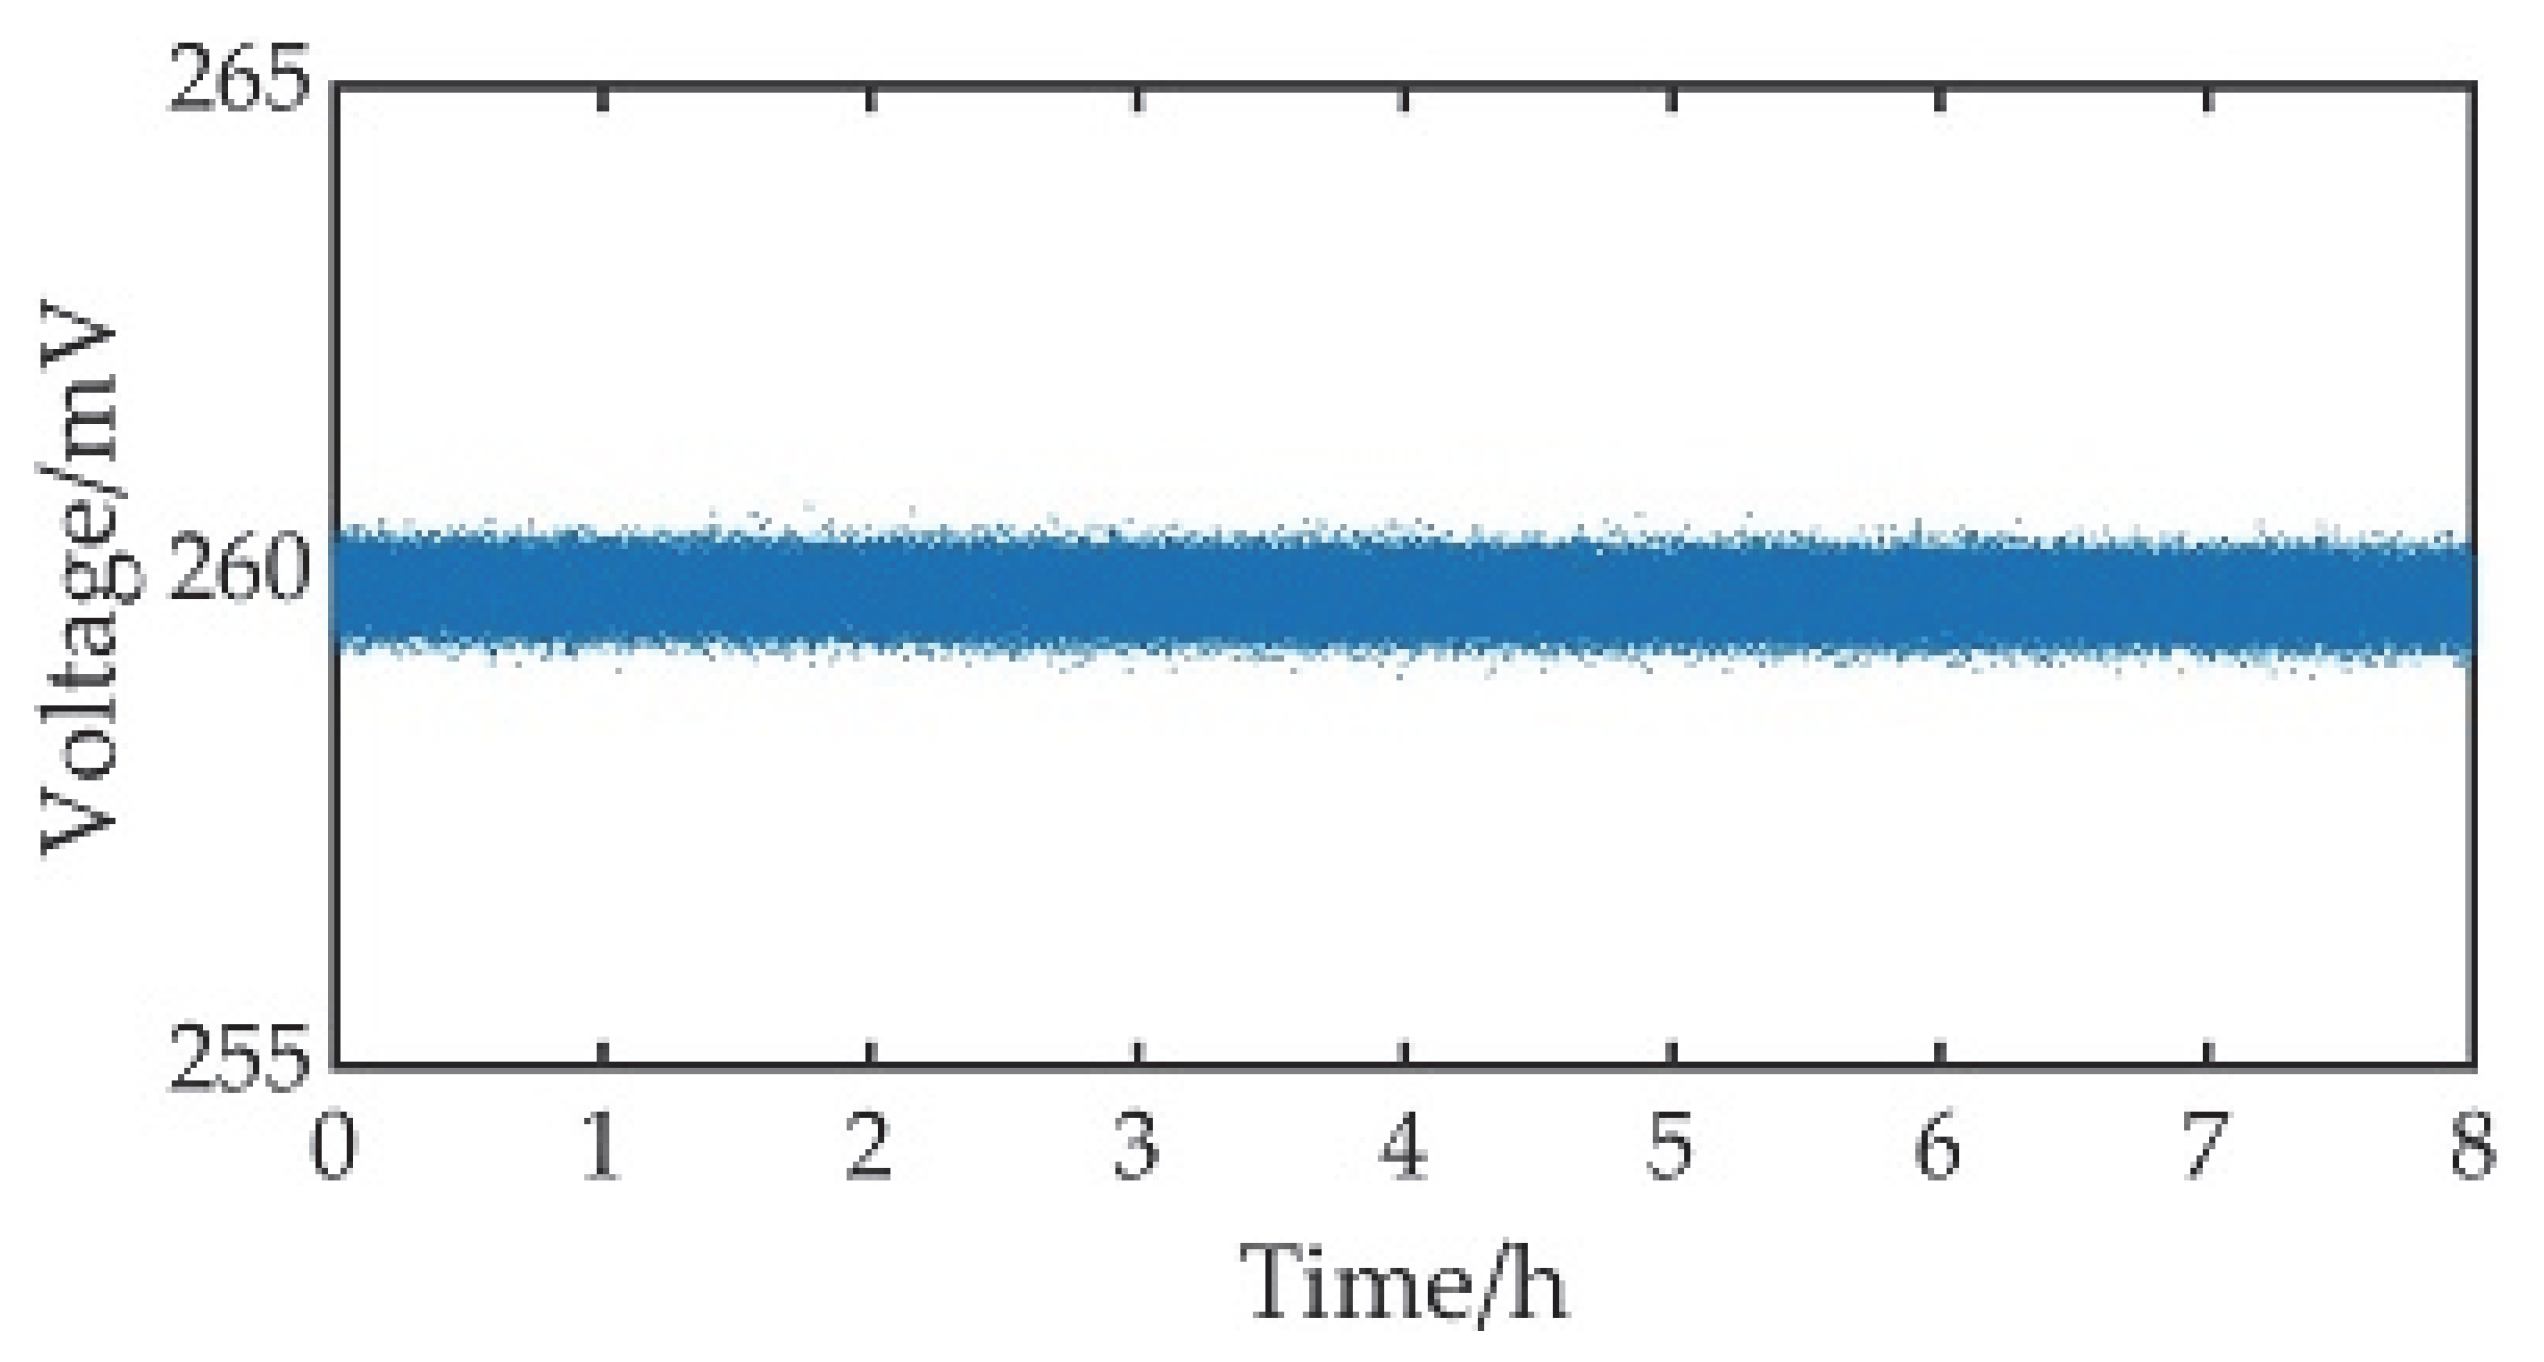
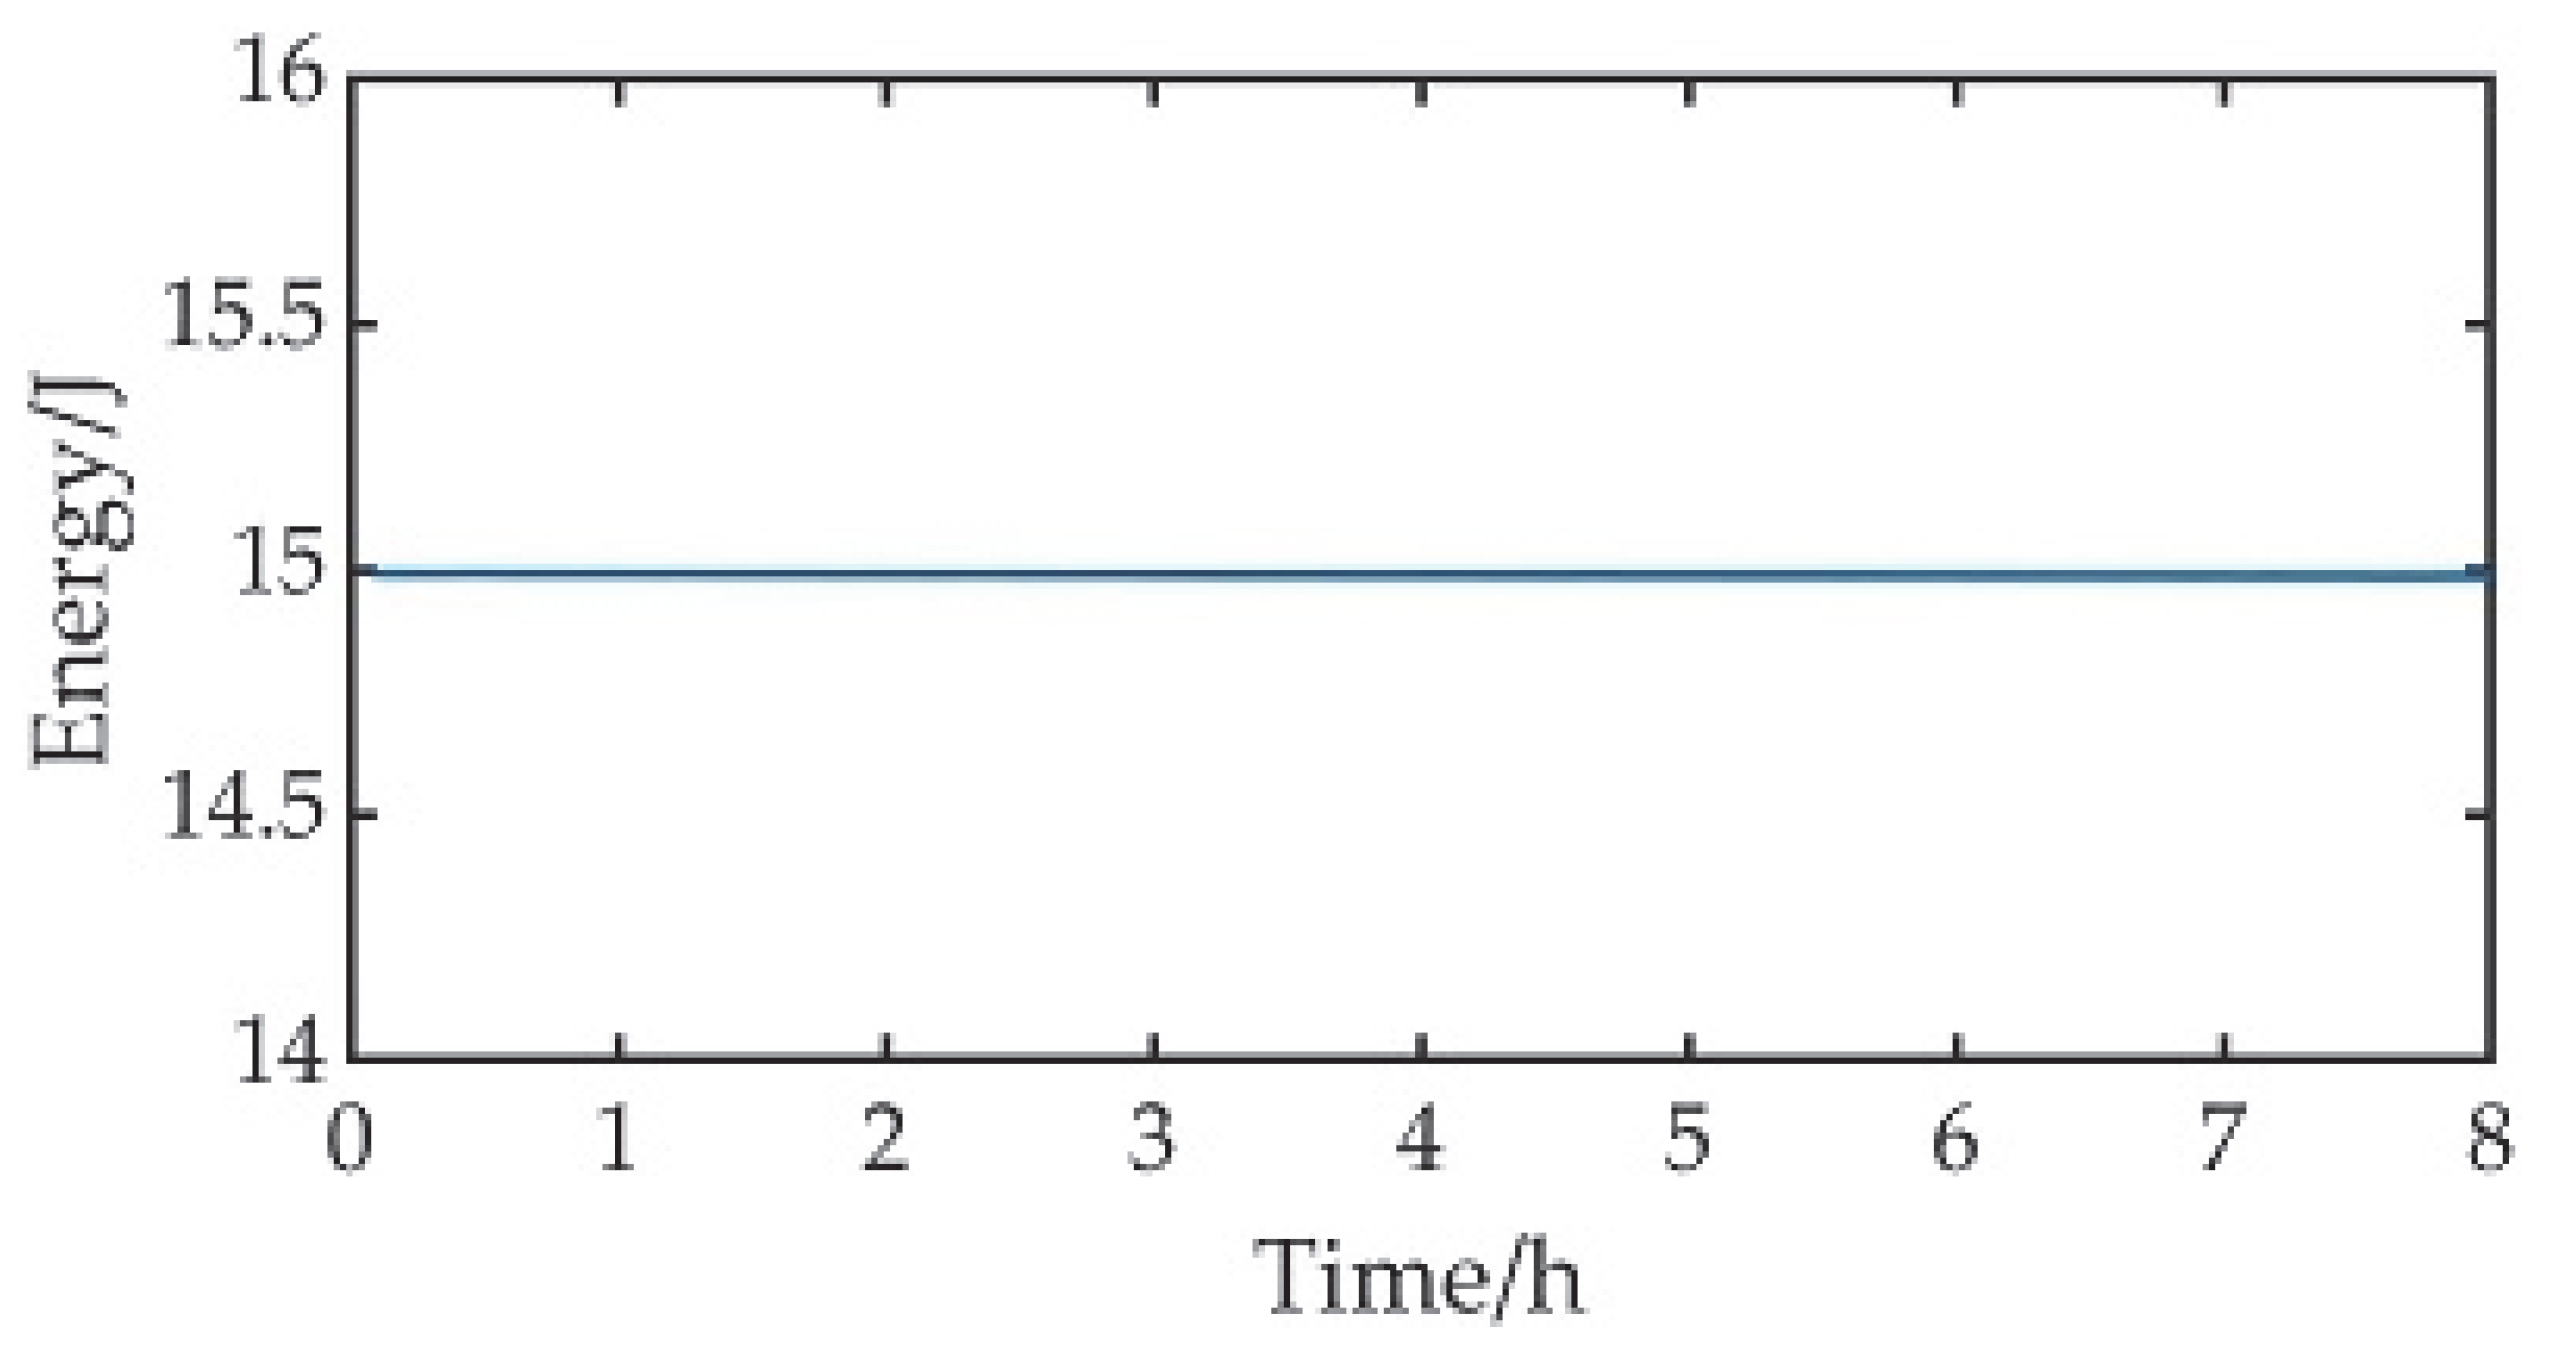
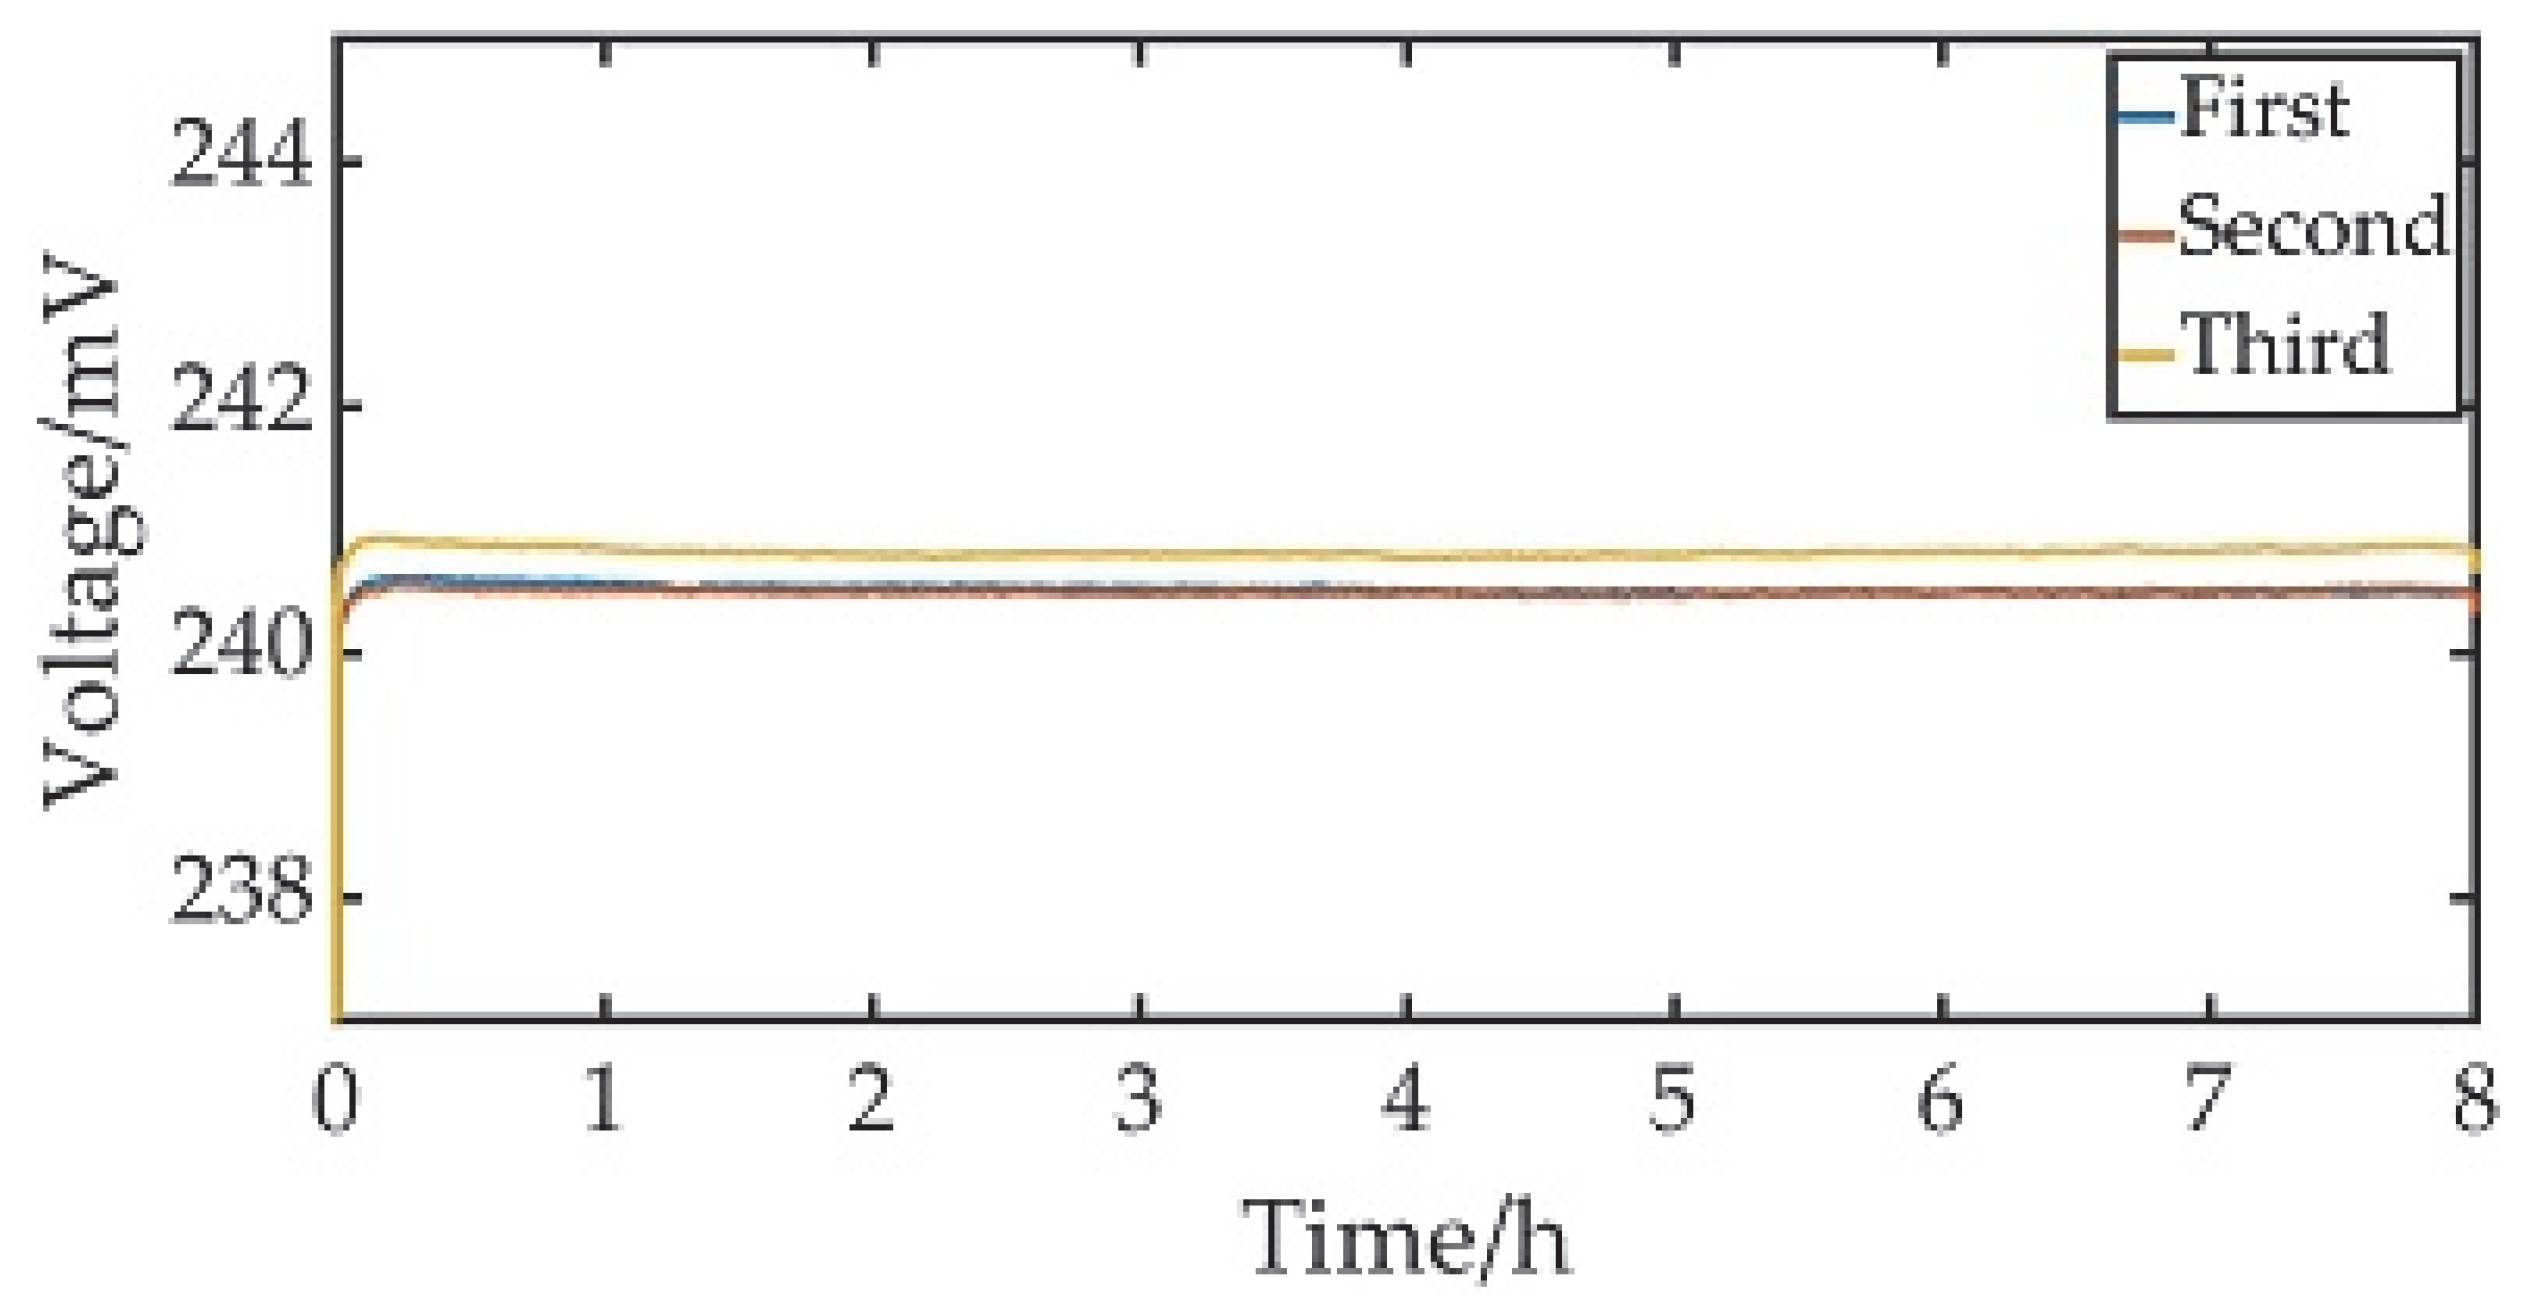
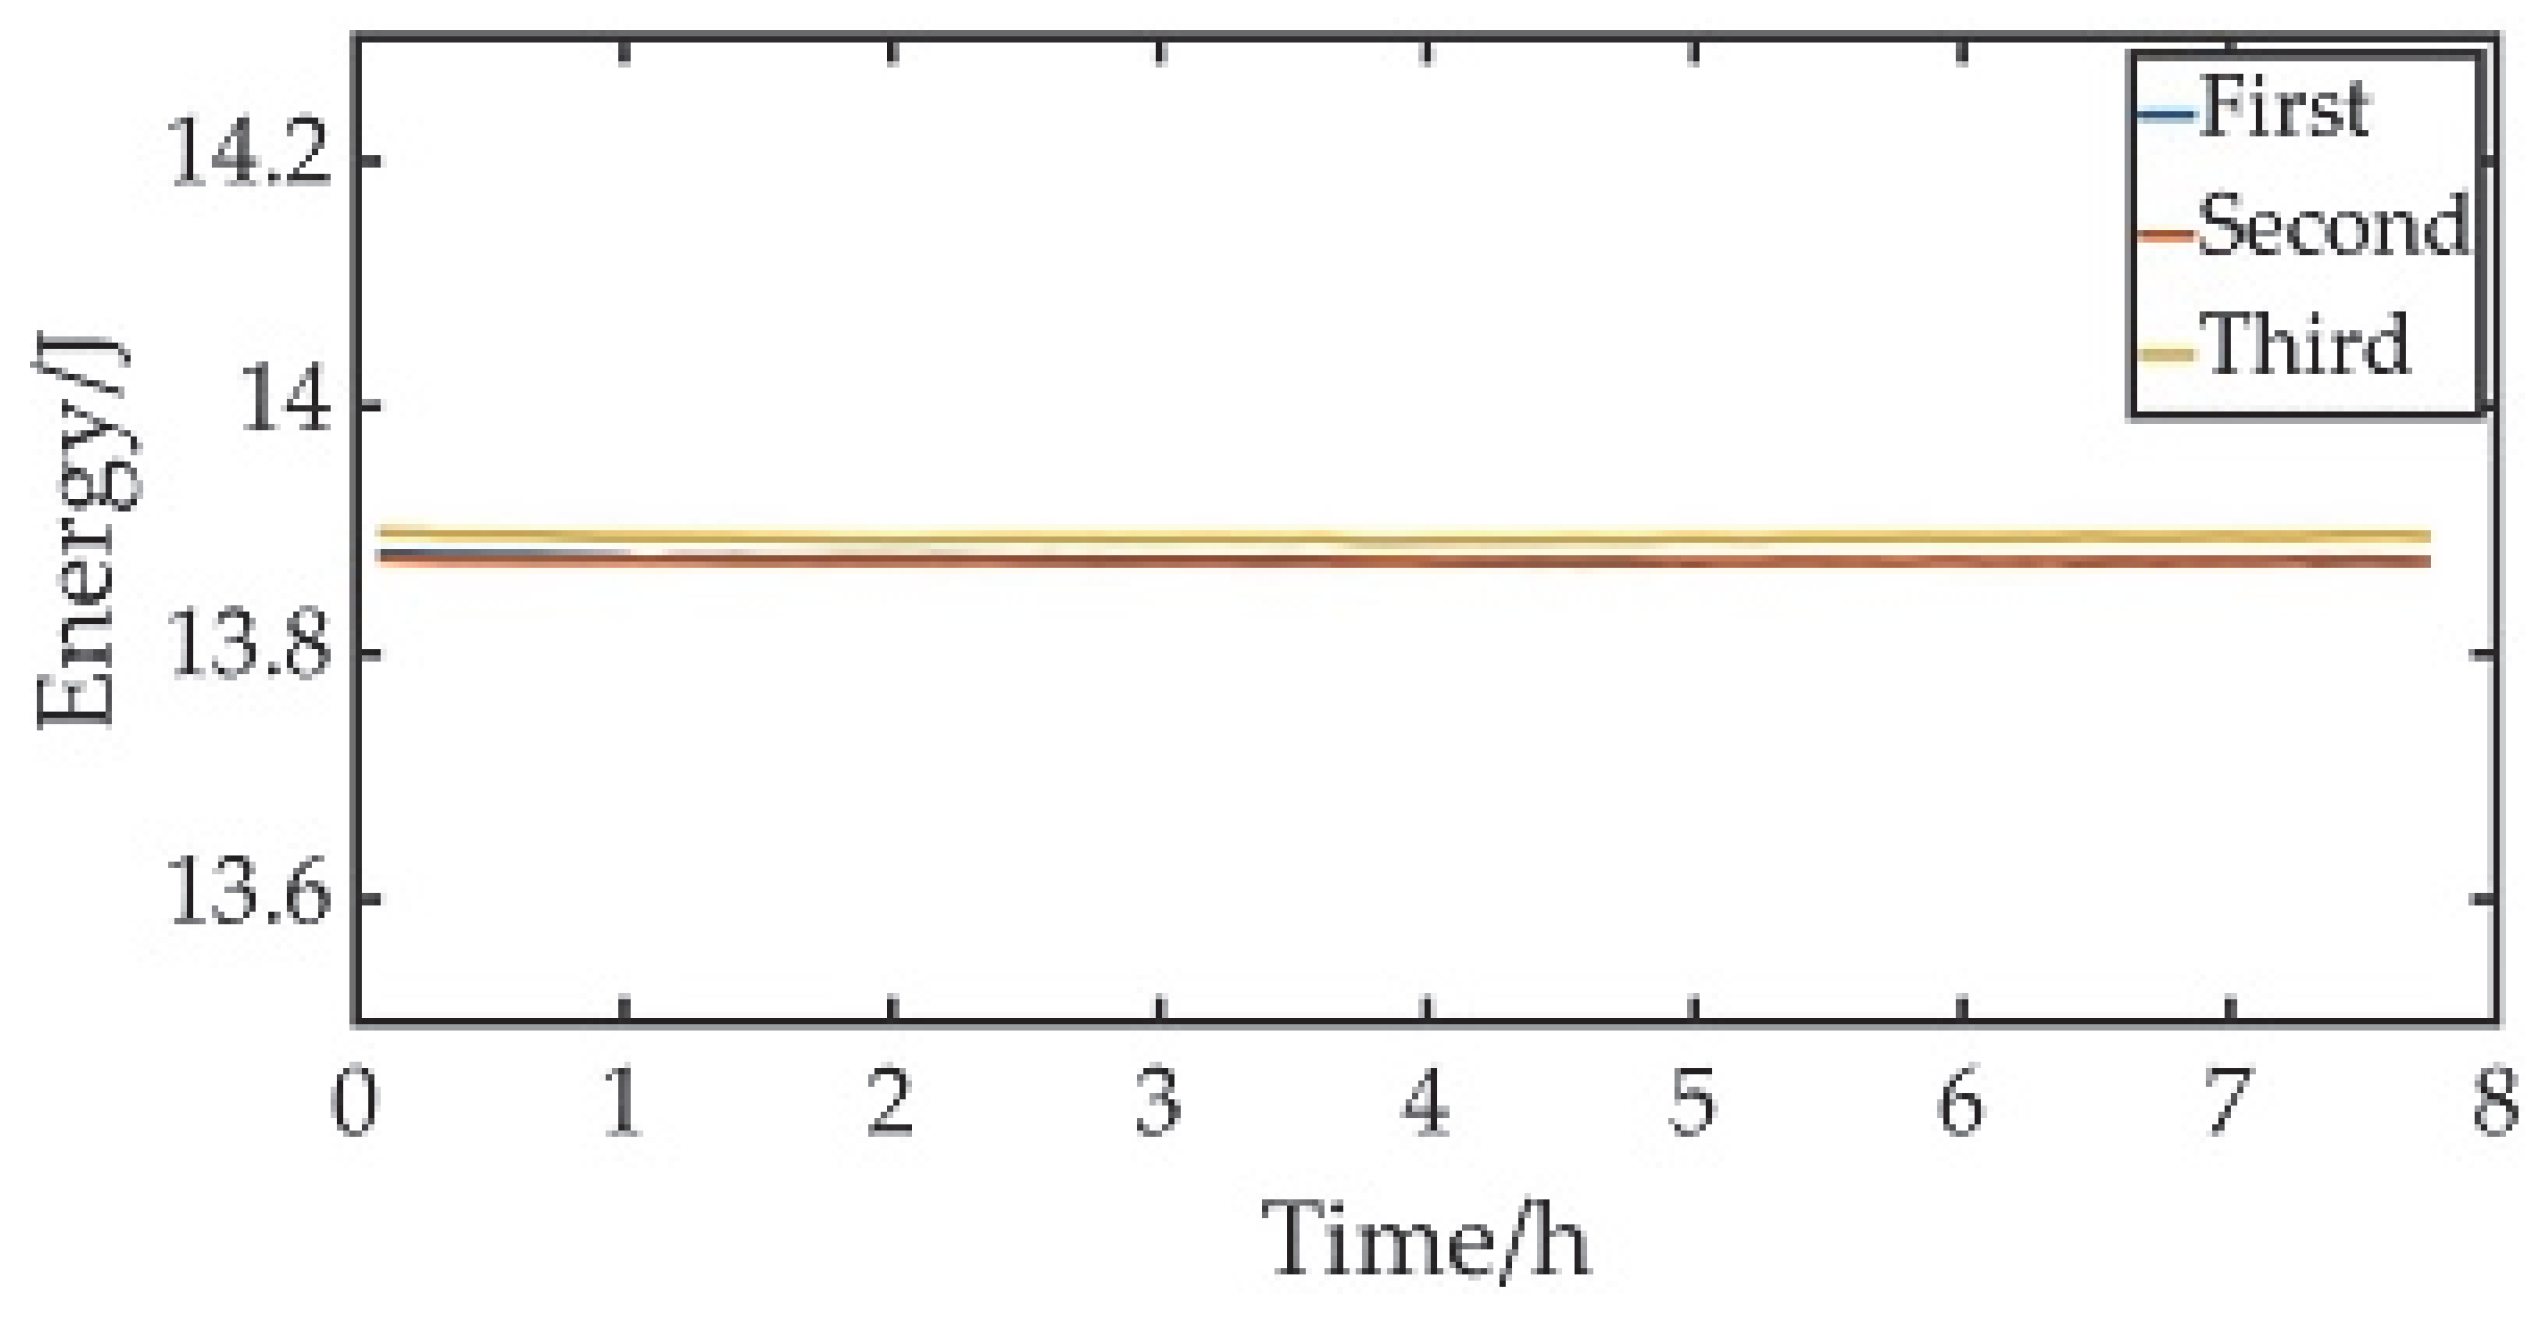
Figure 11 shows the PD output voltage during the measurement time of 8 h in Experiment 1. This can be substituted into the light source stability measurement algorithm for the flux calibration of the space gaze camera.
Figure 12 demonstrates the change in the total energy over time in gaze time. Statistical analysis was performed on the three-measurement data, respectively. The results of the error analysis for a single measurement are shown in
Table 3.
As can be seen from the above table, the relative uncertainty of PD stability obtained by triplicate measurement was 0.012%, 0.007%, and 0.012%, respectively. The mean of 0.01% was taken as the relative uncertainty of PD stability.
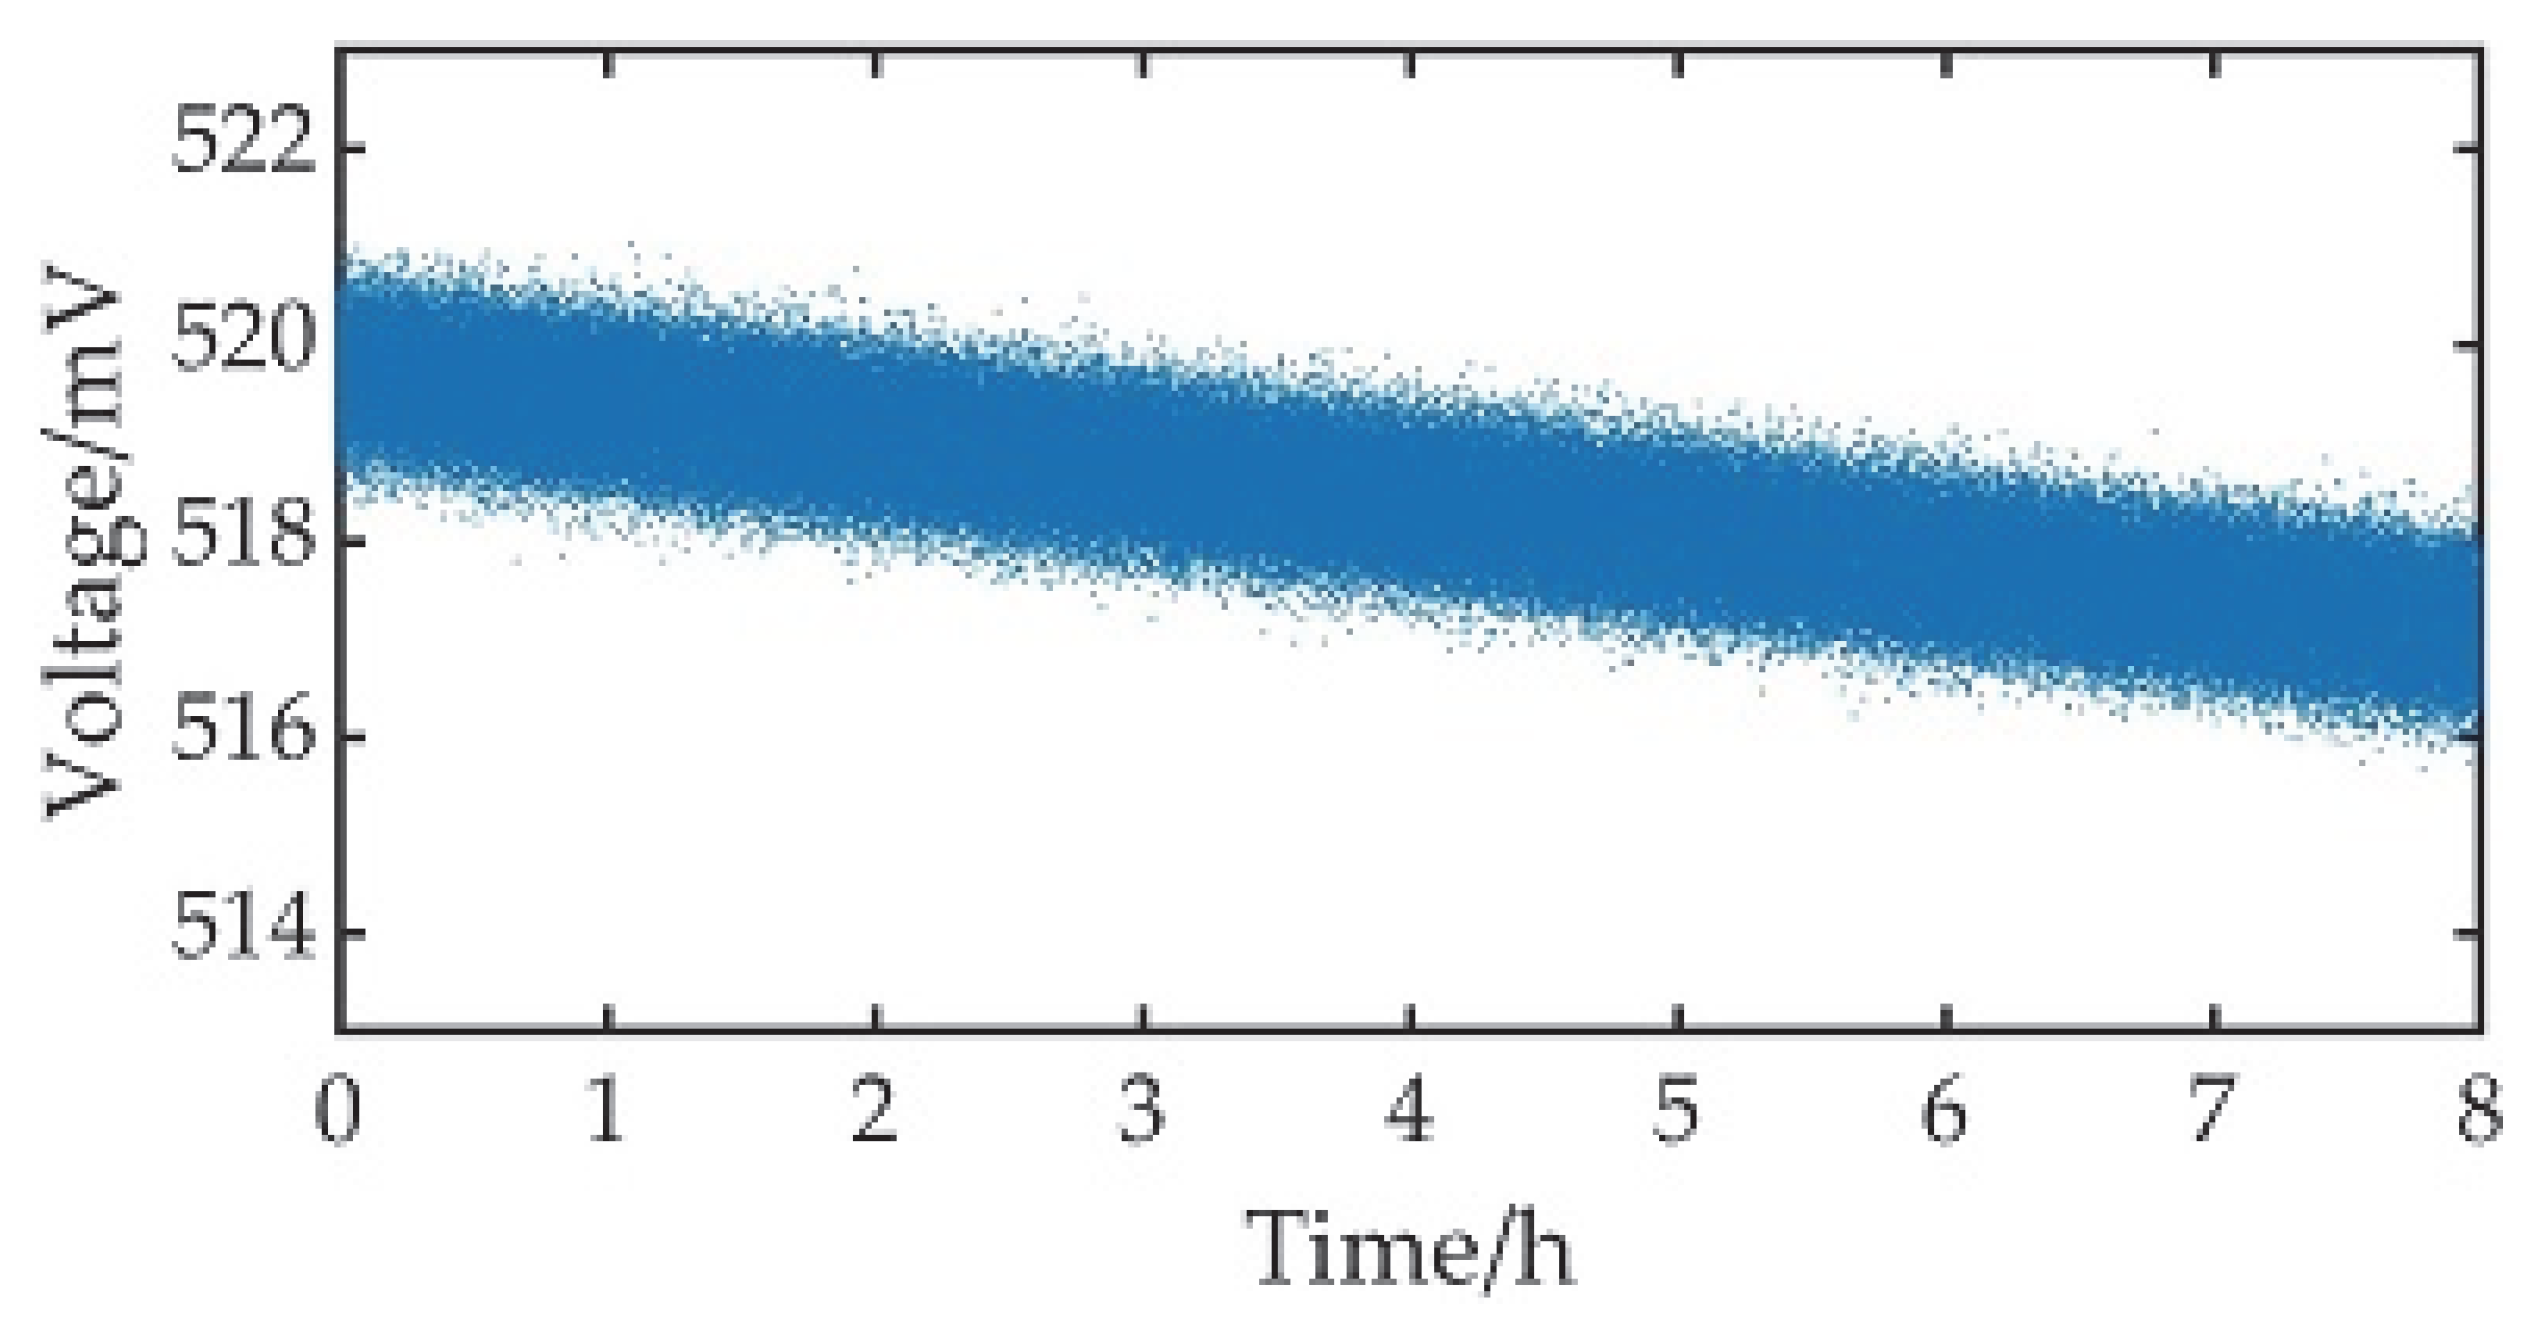
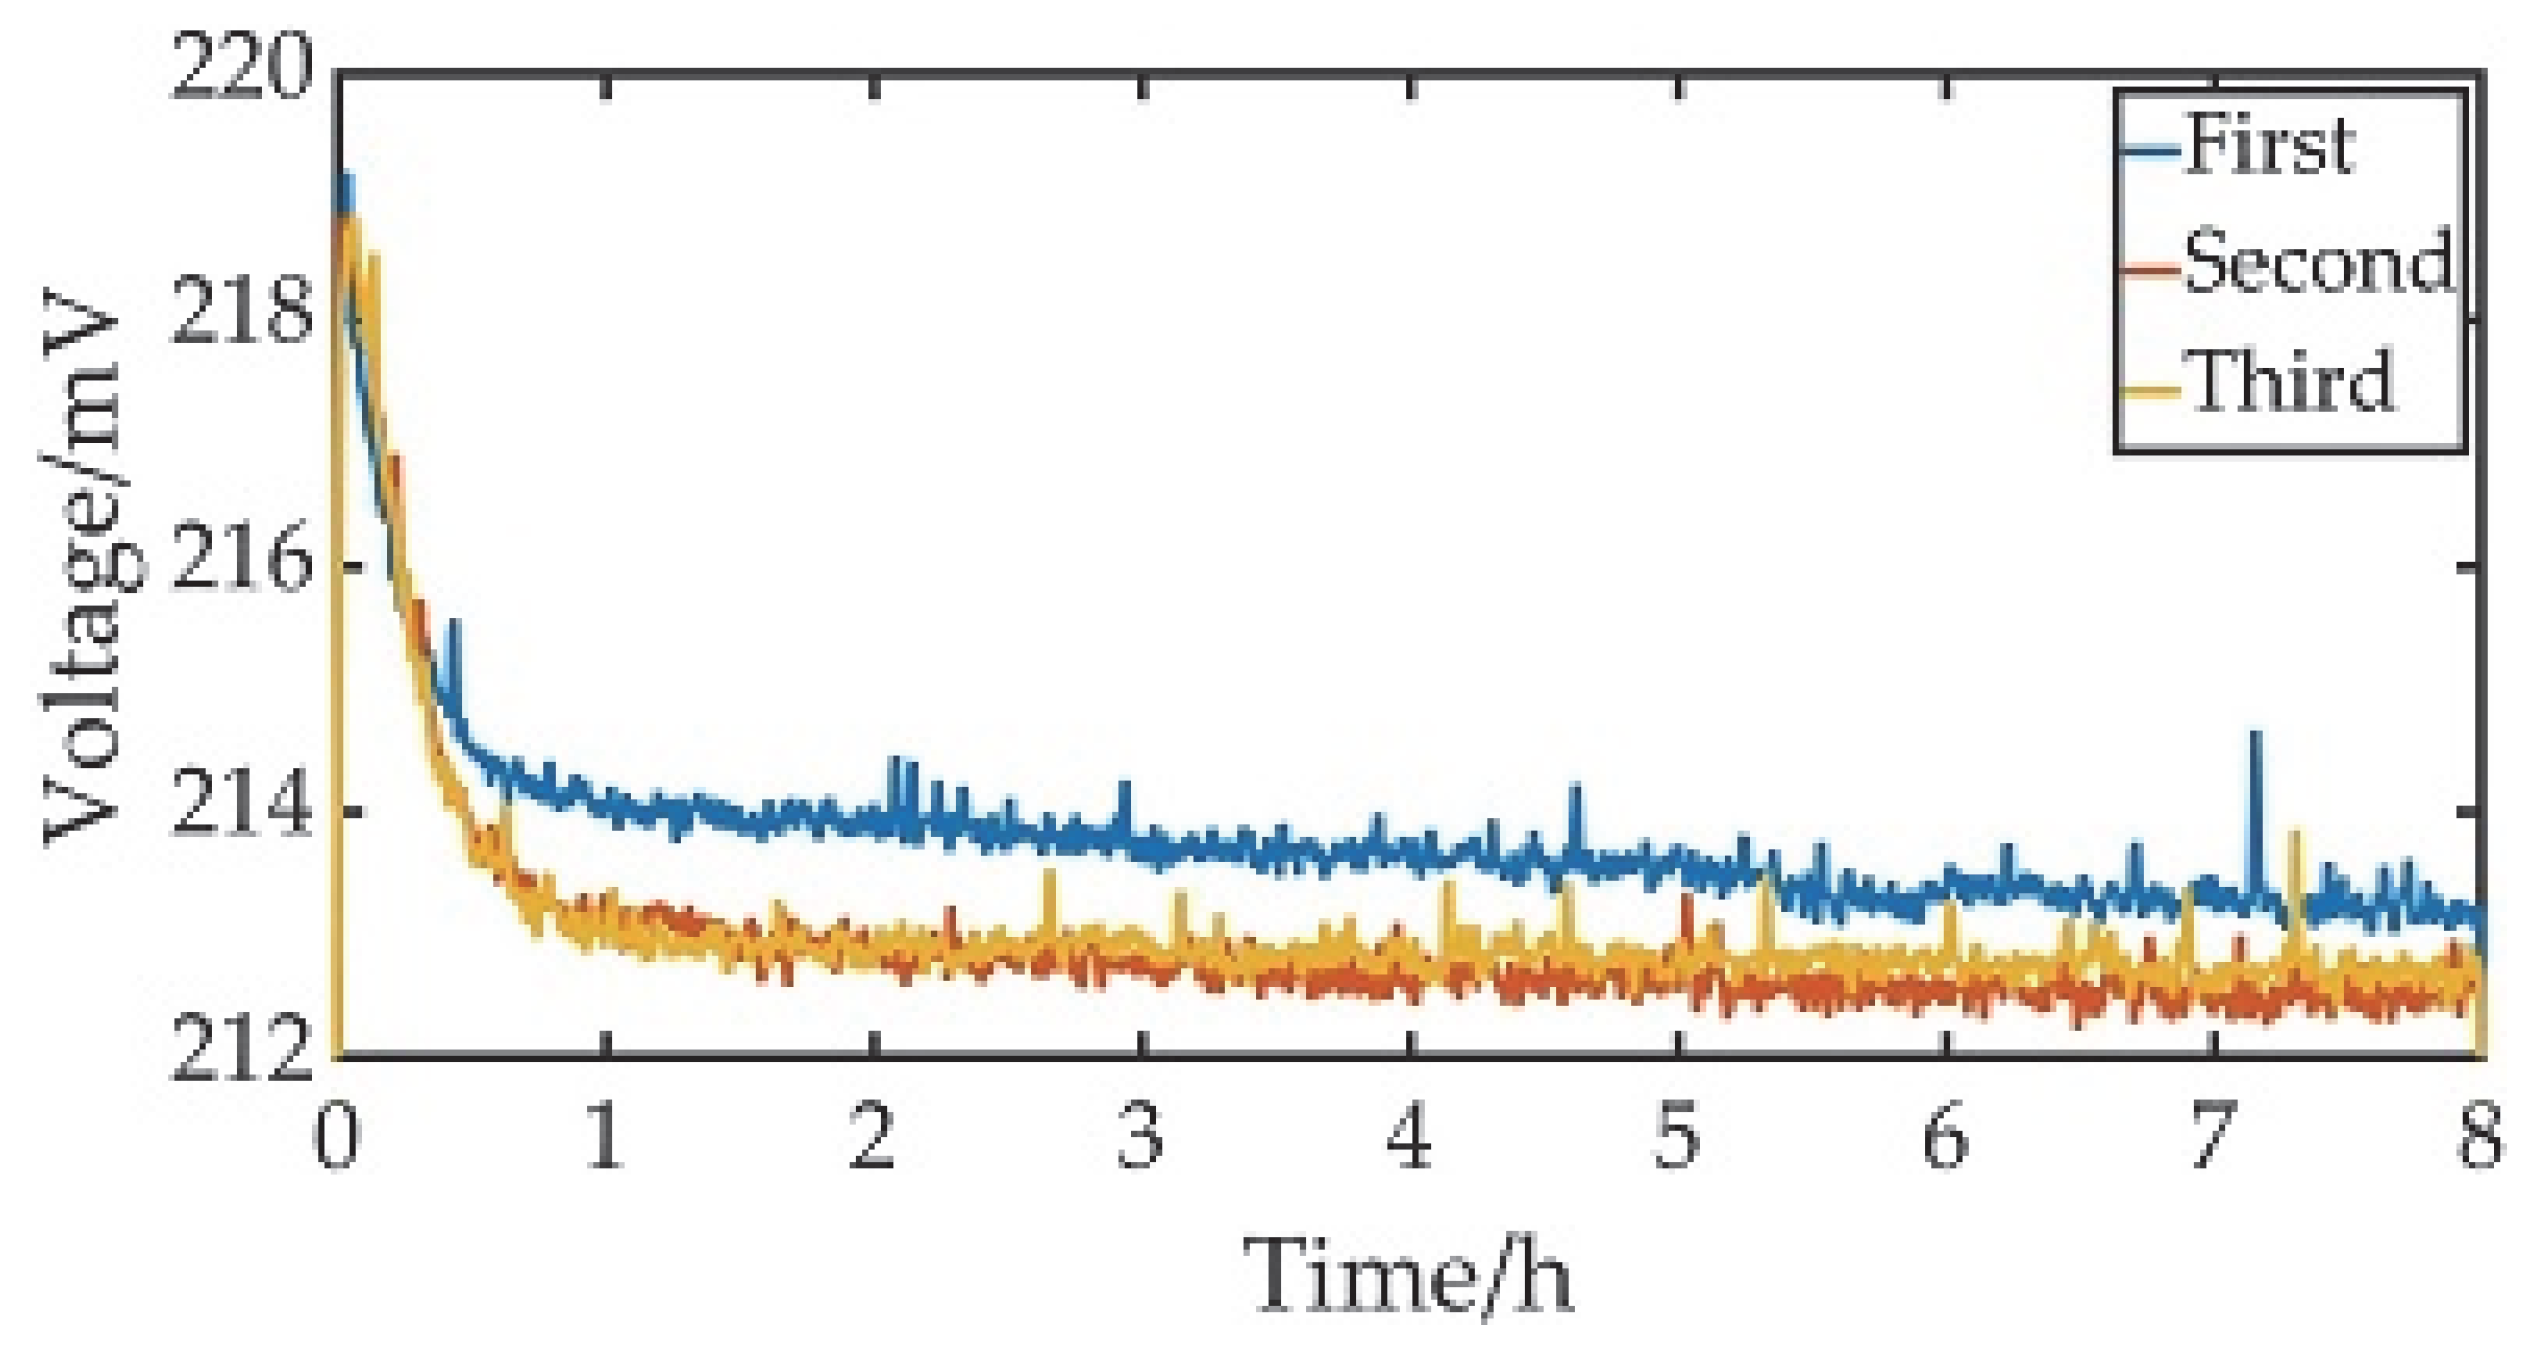
The PD output voltage in Experiment 2 is shown in
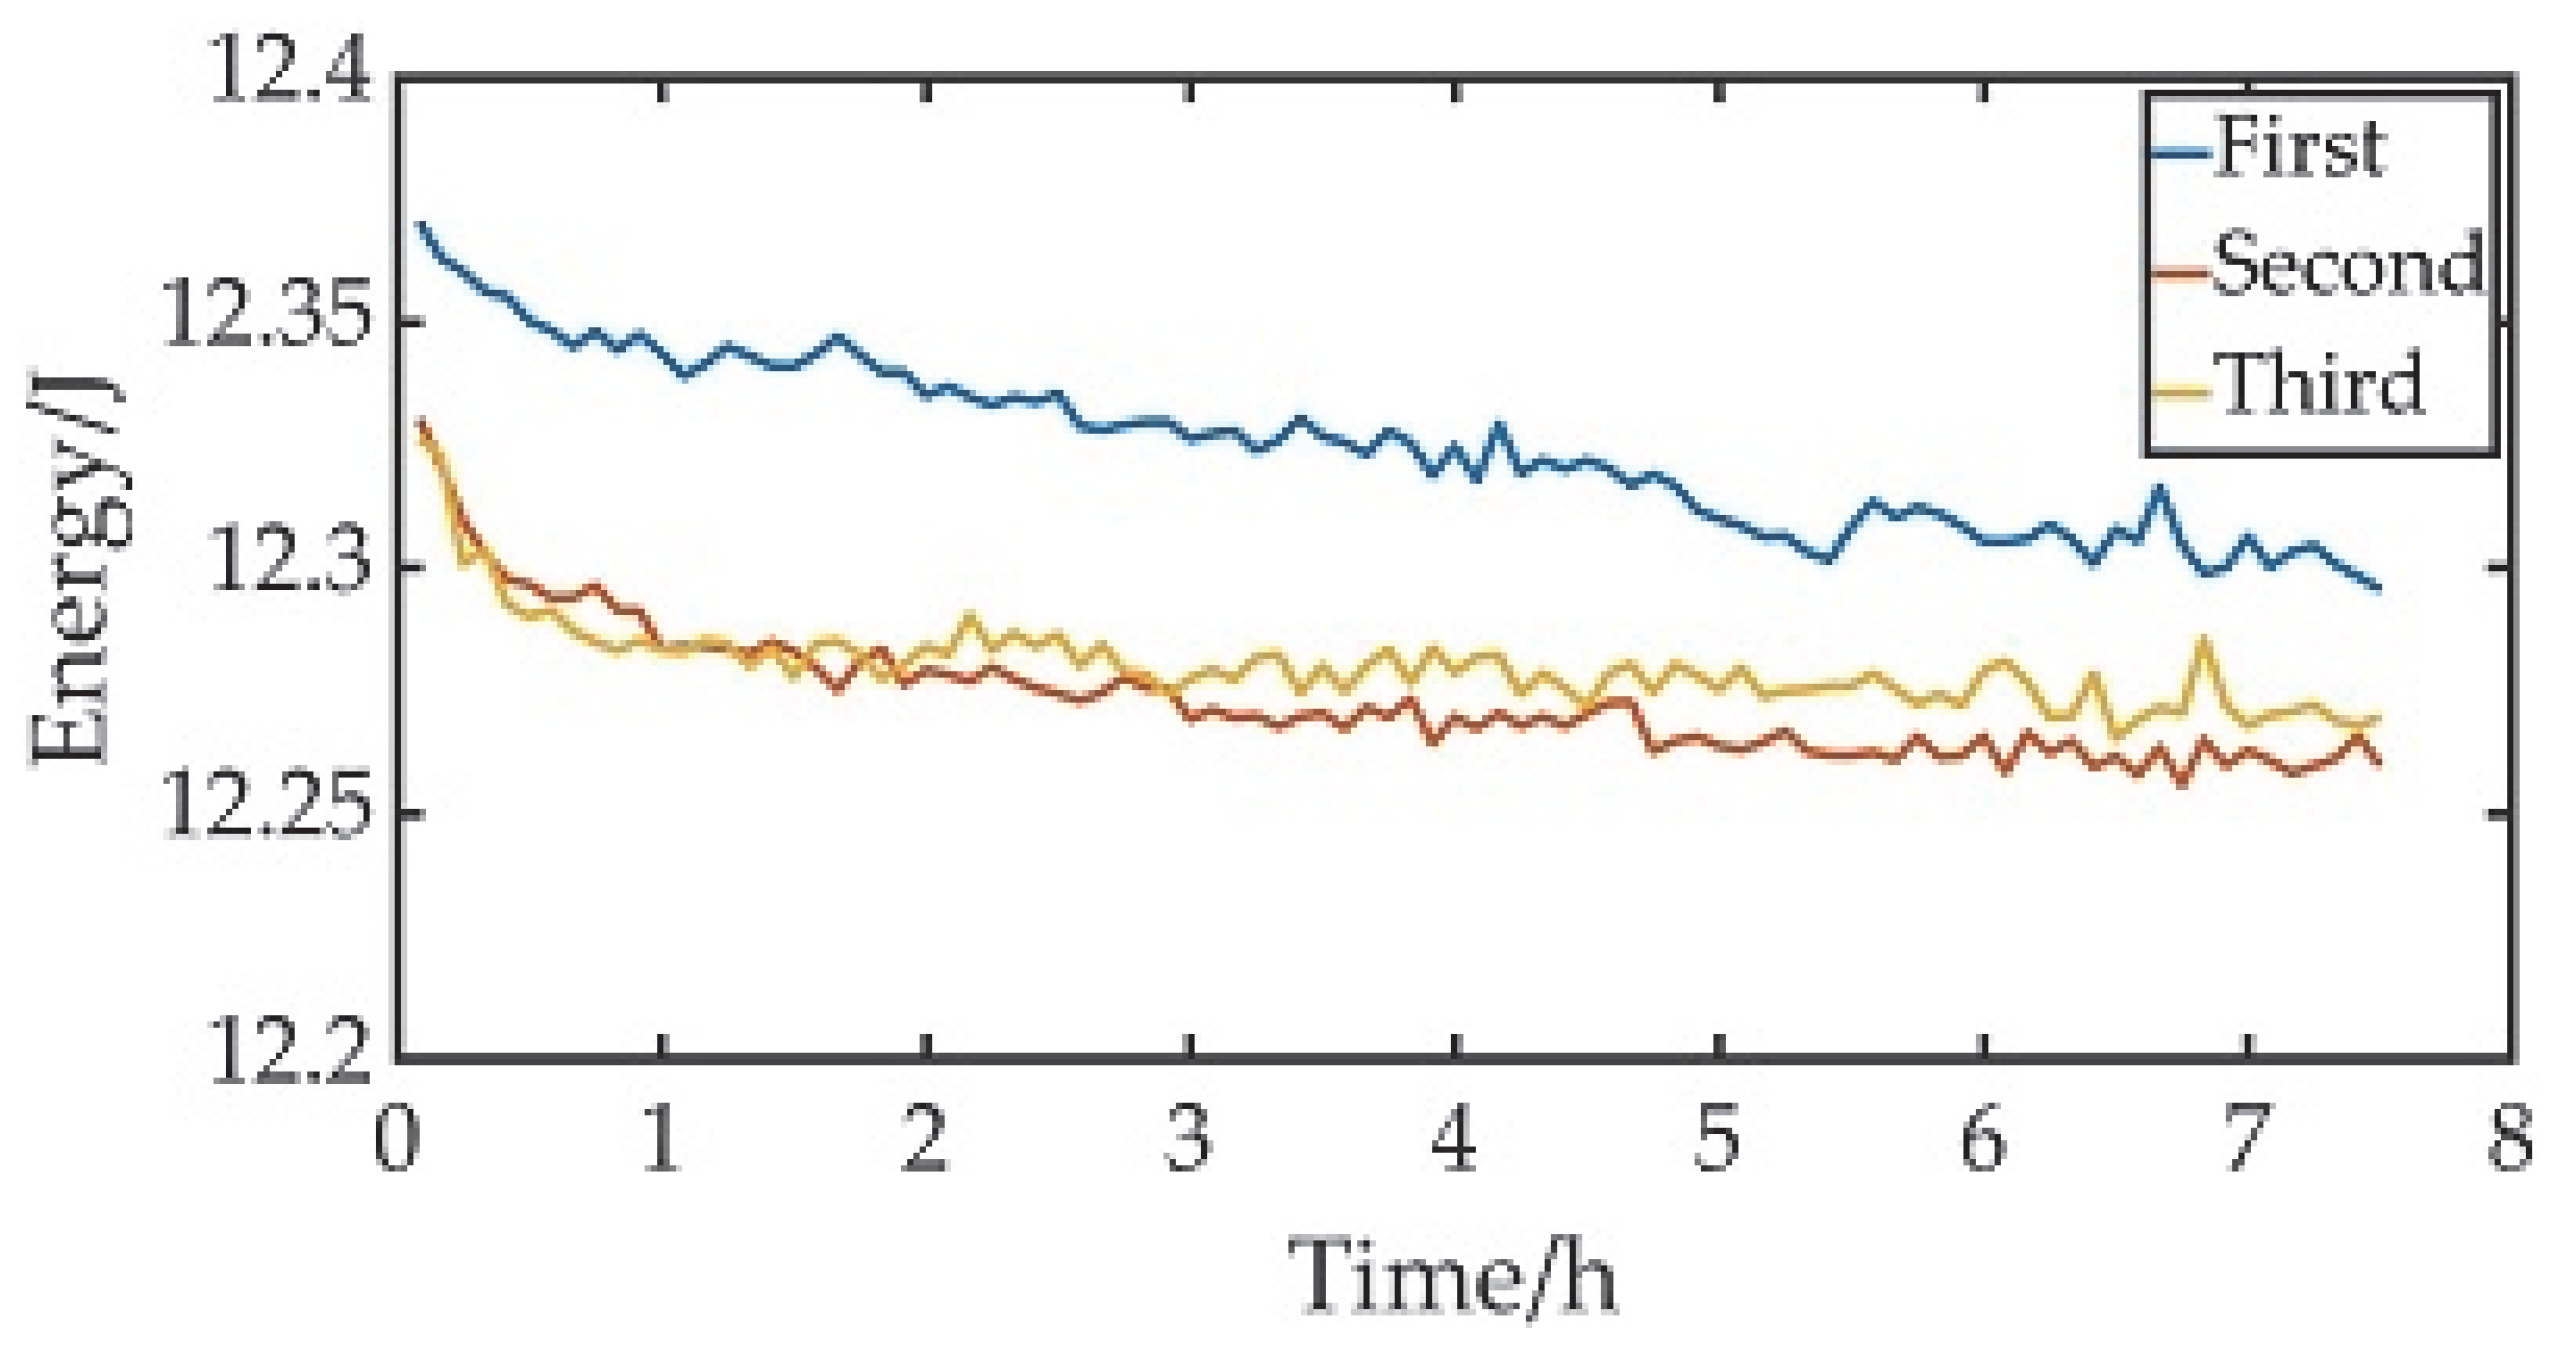
Figure 13. The halogen lamp light source at 0~30 min was poor in stability, so these data were omitted when analyzing the stability of the light source. The data shown in
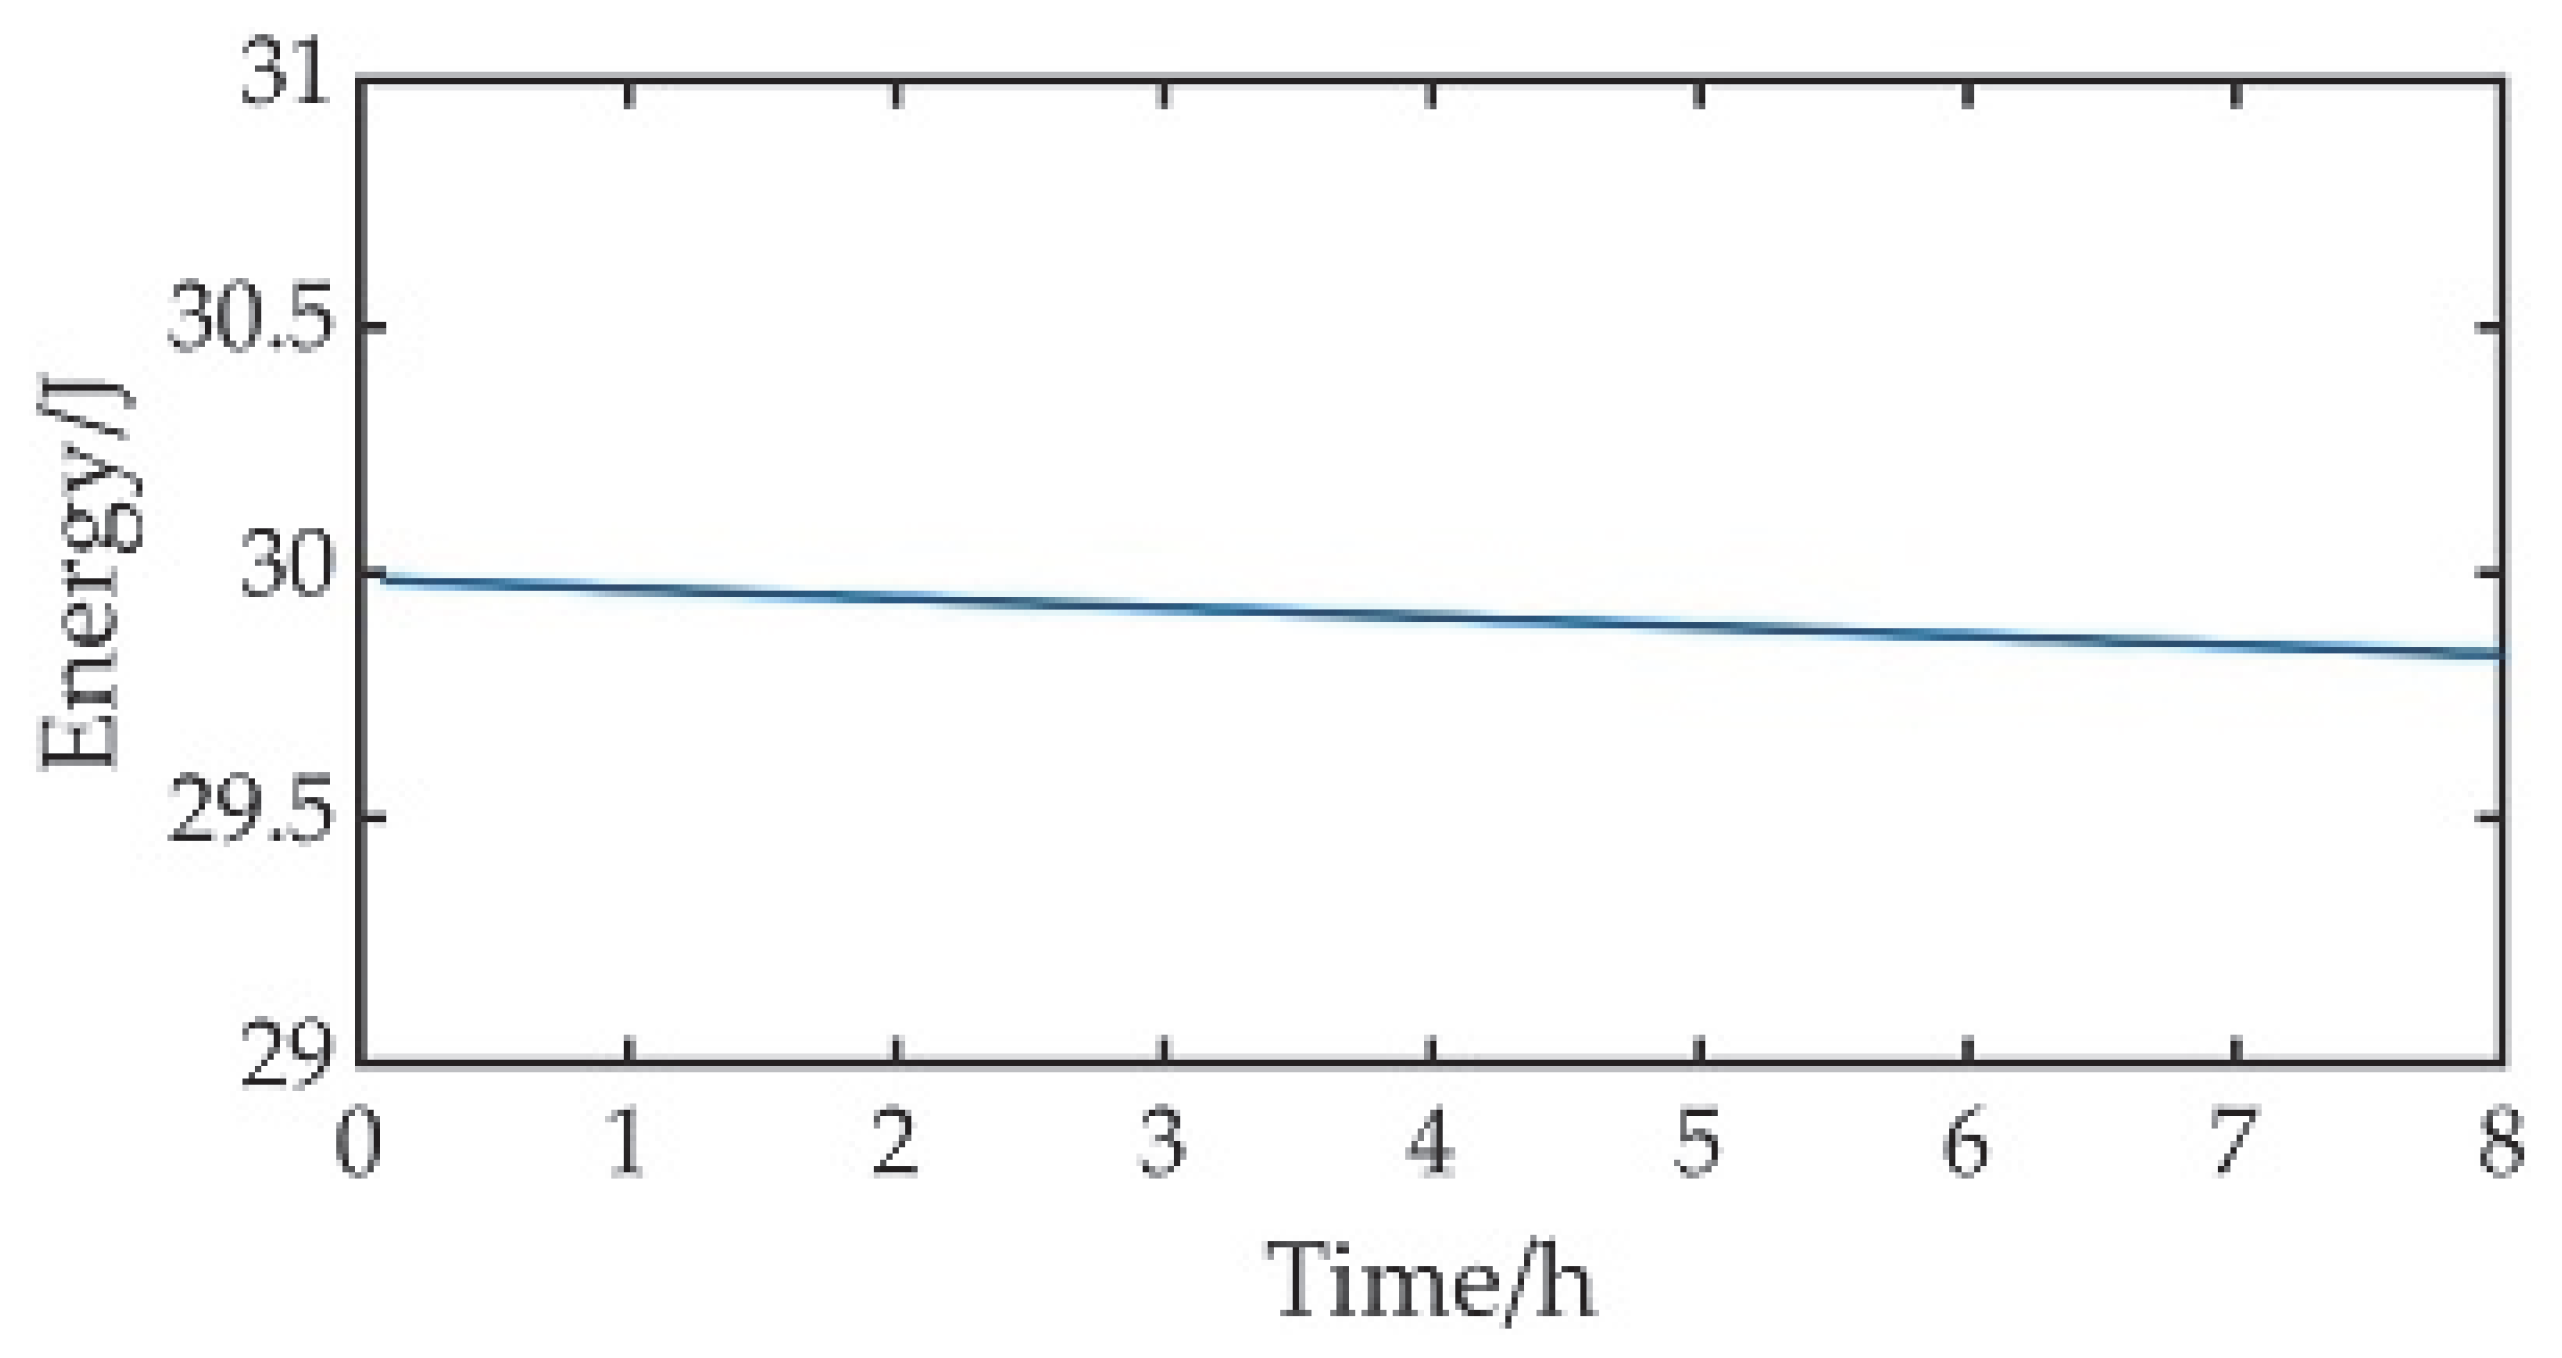
Figure 13 can be substituted into the light source stability algorithm for the flux calibration of the space gaze camera. The change in the total energy received by PD with time during a single gaze time in Experiment 2 is shown in
Figure 14. The relative uncertainty of the halogen lamp stability obtained after analysis is shown in
Table 4.
From the above table, the relative uncertainty of the light source stability in the three repeated measurements was 0.399%, 0.478%, and 0.385%. The mean of 0.42% was taken as the relative measurement uncertainty of the halogen lamp light source.
6. Discussion
The equidistance method has the limitation that it cannot monitor the luminous intensity in real time for a long time when measuring the stability of the light source. To improve the above issues, a method to measure the stability of the light source using PD is proposed in this manuscript. It is also combined with algorithms for light source stability in the flux calibrations of space gaze cameras. The comparison of the two methods is shown in
Table 5.
The table shows that the PD measurement source stability improves the measurement accuracy from 0.09% to 0.01%. The measurement time was increased from a maximum of 4 h to 8 h in the validation experiment. A total of 8 h is not the limit length of the measurement. Furthermore, the PD measurement of the light source stability achieves real-time measurement of the stability of the space gaze camera flux calibration light source. It reduces the measurement uncertainty of the light source stability caused by changes in the external environment.
To reduce the impact of voltage fluctuations on the power supply of the light source stability measurement in the verification experiment, a regulated power supply is used to power the LED. The uncertainty introduced by the voltage fluctuation before using the regulated power supply was 3.33%. The uncertainty introduced by the voltage fluctuation was changed to 0.001% after using the regulated power supply. It proves the necessity of a regulated power supply.
There are also some problems in the experimental verification of this paper, which will be improved in the future. For example:
In this paper, a halogen lamp was selected as the light source to be measured. To verify the wide practicality of the method for measuring the stability of light sources by PD, other types of light sources, such as xenon and mercury lamps, will be selected for subsequent experiments.
The time settings in the experimental validation are an estimate based on the scientific objectives of a particular model of space camera. There were differences between them and the parameter settings during the actual flux calibration.
In the experiment, the PD stability selected by many comparisons can meet the measurement accuracy of the light source stability for the space gaze camera, so the stability of the light source is not corrected. If the calibration accuracy of PD cannot meet the calibration requirements of the space gaze camera, the corresponding algorithm should be used to calibrate the PD output voltage in the experiment.
7. Conclusions
The purpose of this paper is to solve the problem of measuring the stability of the space gaze camera flux calibration light source in the multi-field calibration of large-aperture and large-field space telescope flux calibration. The equidistance method cannot monitor the luminous intensity of the light source in real-time. Additionally, the long-term stability of SL cannot be guaranteed. The method of using PD to measure the stability of the calibration light source was proposed. This paper introduces the principle and algorithm of a light source stability measurement for a space gaze camera flux calibration. Moreover, the design for the simulation analysis and experimental scheme to verify the correctness of the measurement method has also been proposed. First, PD was calibrated by using an LED light source; then, this PD was used to measure the stability of a calibration light source. At this time, the main sources of measurement uncertainty in the stability of the light source are the stability uncertainty of LED and the stability uncertainty of PD. The gaze time in the validation experiment was set to 5 min, and the sampling frequency of PD was 15 Hz. When the flux calibration time was 8 h, the stability uncertainty of the calibration light source was 0.42%, and the relative measurement uncertainty was 0.01%. At this time, the uncertainty caused by power supply fluctuation was 0.001%, which had little influence on the measurement uncertainty and could be ignored. Compared to the traditional method, this enables the real-time monitoring of the luminous intensity of the light source; moreover, the measuring time is not limited by the SL. The measuring time of the light source stability was prolonged from 4 h in the traditional measuring method to 8 h or even longer. It improves the situation that the measurement accuracy cannot be guaranteed when the calibration light source runs for a long time in the traditional method. The measurement accuracy of light source stability was improved by 0.01%, which meets the requirement of the high-precision flux calibration for a large-aperture space telescope.
Author Contributions
Conceptualization, C.L. and X.Z.; methodology, C.L.; software, C.L.; validation, C.L., N.Z., J.Z. and T.Z.; formal analysis, C.L. and N.Z.; investigation, C.L. and T.Z.; resources, X.Z. and J.L.; data curation, C.L.; writing—original draft preparation, C.L.; writing—review and editing, C.L., N.Z., J.L. and X.Z; visualization, C.L.; supervision, X.Z.; project administration, X.Z.; funding acquisition, X.Z. All authors have read and agreed to the published version of the manuscript.
Funding
Supported by the National Natural Science Foundation of China (No. 12003033).
Data Availability Statement
Data are contained within the article.
Acknowledgments
The authors would like to thank the anonymous reviewers for their constructive comments.
Conflicts of Interest
The authors declare no conflict of interest.
References
- Szeto, K.; Roberts, S.; Gedig, M.; Austin, G.; Lagally, C.; Patrick, S.; Tsang, D.; MacMynowski, D.; Sirota, M.; Stepp, L.; et al. TMT Telescope Structure System: Design and Development Progress Report. In Proceedings of the Ground-Based and Airborne Telescopes II, Marseille, France, 23–28 June 2008. [Google Scholar]
- Fanson, J.L.; Bernstein, R.A.; Angeli, G.Z.; Ashby, D.S.; Bigelow, B.C.; Brossus, G.P.; Bouchez, A.H.; Burgett, W.S.; Contos, A.R.; Demers, R.; et al. Overview and Status of the Giant Magellan Telescope Project. In Proceedings of the Ground-Based and Airborne Telescopes VIII, Online, 14–22 December 2020. [Google Scholar]
- Gressler, W.; DeVries, J.; Hileman, E.; Neill, D.R.; Sebag, J.; Wiecha, O.; Andrew, J.; Lotz, P.; Schoening, W. LSST Telescope and Site Status. In Proceedings of the Ground-Based and Airborne Telescopes V, Montréal, QC, Canada, 22–27 June 2014. [Google Scholar]
- Lou, Z.; Liang, M.; Yao, D.; Zheng, X.; Cheng, J.; Wang, H.; Liu, W.; Qian, Y.; Zhao, H.; Yang, J. Optical Design Study of the Wide Field Survey Telescope (WFST). In Proceedings of the International Symposium on Optoelectronic Technology and Application, Beijing, China, 9–11 May 2016. [Google Scholar]
- The 2.5 m Telescope of the Sloan Digital Sky Survey—IOPscience. Available online: https://iopscience.iop.org/article/10.1086/500975/meta (accessed on 19 October 2022).
- Sabelhaus, P.A.; Decker, J.E. An Overview of the James Webb Space Telescope (JWST) Project. In Proceedings of the SPIE Astronomical Telescopes and Instrumentation Symposium, Glasgow, UK, 21–25 June 2004. [Google Scholar]
- Robberto, M.; Sivaramakrishnan, A.; Bacinski, J.J.; Calzetti, D.; Krist, J.E.; MacKenty, J.W.; Piquero, J.; Stiavelli, M. Performance of HST as an Infrared Telescope. In Proceedings of the 2000 SPIE-ESO Symposium on Astronomical Telescopes and Instrumentation, Munich, Germany, 27–31 March 2000. [Google Scholar]
- Prusti, T.; de Bruijne, J.H.J.; Brown, A.G.A.; Vallenari, A.; Babusiaux, C.; Bailer-Jones, C.A.L.; Bastian, U.; Biermann, M.; Evans, D.W.; Eyer, L.; et al. The Gaia Mission. Astron. Astrophys. 2016, 595, A1. [Google Scholar] [CrossRef] [Green Version]
- Sebag, J.; Gressler, W.J.; Liang, M.; Axelrod, T.; Claver, C.; Andrew, J. Calibration Systems for LSST. In Proceedings of the Ground-Based and Airborne Telescopes V, Montréal, QC, Canada, 22–27 June 2014. [Google Scholar]
- Bagnasco, G.; Ferruit, P.; Boeker, T.; Closs, M.; Dorner, B.; Gnata, X.; Koehler, J.; Kolm, M.; Kuechel, C.; Langenbach, H.; et al. The On-Ground Calibration of the near Infrared Spectrograph (NIRSpec) Instrument On-Board the James Webb Space Telescope (JWST). In Proceedings of the SPIE Astronomical Telescopes and Instrumentation Symposium, Marseille, France, 23–28 June 2008. [Google Scholar]
- Lemieux, S.; Giese, E.; Fickler, R.; Chekhova, M.V.; Boyd, R.W. A Primary Radiation Standard Based on Quantum Nonlinear Optics. Nat. Phys. 2019, 15, 529–532. [Google Scholar] [CrossRef] [Green Version]
- Guo, Q.; Chen, F.; Li, X.; Chen, B.; Wang, X.; Chen, G.; Wei, C. High-Accuracy Source-Independent Radiometric Calibration with Low Complexity for Infrared Photonic Sensors. Light Sci. Appl. 2021, 10, 163. [Google Scholar] [CrossRef] [PubMed]
- Building a Better Flat-Field: An Instrumental Calibration Projector for the Large Synoptic Survey Telescope. Available online: https://dspace.mit.edu/handle/1721.1/65435 (accessed on 16 August 2022).
- A Scheme of Flat-Fielding for LAMOST. Available online: https://www.spiedigitallibrary.org/conference-proceedings-of-spie/5493/0000/A-scheme-of-flat-fielding-for-LAMOST/10.1117/12.548014.short (accessed on 19 October 2022).
- Coughlin, M.; Abbott, T.M.C.; Brannon, K.; Claver, C.; Doherty, P.; Fisher-Levine, M.; Ingraham, P.; Lupton, R.; Mondrik, N.; Stubbs, C. A Collimated Beam Projector for Precise Telescope Calibration. In Proceedings of the SPIE Astronomical Telescopes + Instrumentation, Edinburgh, UK, 26 June–1 July 2016. [Google Scholar]
- Taubert, R.D.; Monte, C.; Baltruschat, C.; Schirmacher, A.; Gutschwager, B.; Hartmann, J.; Hollandt, J.; Kochems, D.; Küchel, C.; te Plate, M. The Spectral Photon Flux of the Radiometric Calibration Spectral Source for the NIRSpec Instrument of the James Webb Space Telescope. Metrologia 2009, 46, S207. [Google Scholar] [CrossRef]
- Regnault, N.; Guyonnet, A.; Schahmanèche, K.; Le Guillou, L.; Antilogus, P.; Astier, P.; Barrelet, E.; Betoule, M.; Bongard, S.; Cuillandre, J.-C.; et al. The DICE Calibration Project Design, Characterization, and First Results. Astron. Astrophys. 2015, 581, A45. [Google Scholar] [CrossRef] [Green Version]
- Zhang, N.; Ye, L.; Song, Y. Design and Detection for the Photoelectric Device Used in the Point Source Transmission Testing. Yi Qi Yi Biao Xue Bao/Chin. J. Sci. Instrum. 2018, 39, 92–99. [Google Scholar] [CrossRef]
- Borecki, M.; Kruszewski, J. Laser Diode Supply for Fiber Optic Sensors. In Proceedings of the Lightguides and Their Applications, Krasnobród, Poland, 14–16 October 1999. [Google Scholar]
- Bürmen, M.; Pernuš, F.; Likar, B. Smart LED Light Source Driver for Machine Vision System. In Proceedings of the Light-Emitting Diodes: Research, Manufacturing, and Applications XII, San Jose, CA, USA, 21–24 January 2008. [Google Scholar]
- Narendran, N.; Gu, Y.; Freyssinier, J.P.; Yu, H.; Deng, L. Solid-State Lighting: Failure Analysis of White LEDs. J. Cryst. Growth 2004, 268, 449–456. [Google Scholar] [CrossRef]
Figure 1.
Schematic diagram of the flux calibration device for a large-aperture space telescope.
Figure 1.
Schematic diagram of the flux calibration device for a large-aperture space telescope.
Figure 2.
Equidistance method to measure light source stability.
Figure 2.
Equidistance method to measure light source stability.
Figure 3.
Schematic diagram of the light source stability measurement: (a) Device for calibrating PD stability; (b) Device for measuring the stability of the light source.
Figure 3.
Schematic diagram of the light source stability measurement: (a) Device for calibrating PD stability; (b) Device for measuring the stability of the light source.
Figure 4.
Flowchart of light source stability measurement for space gaze camera flux calibration.
Figure 4.
Flowchart of light source stability measurement for space gaze camera flux calibration.
Figure 5.
Simulation results of PD output voltage in Experiment 1.
Figure 5.
Simulation results of PD output voltage in Experiment 1.
Figure 6.
Simulation results of the total energy received by the PD in a single gaze time versus time in Experiment 1.
Figure 6.
Simulation results of the total energy received by the PD in a single gaze time versus time in Experiment 1.
Figure 7.
Simulation results of PD output voltage in Experiment 2.
Figure 7.
Simulation results of PD output voltage in Experiment 2.
Figure 8.
Simulation results of total energy received by PD over time in Experiment 2.
Figure 8.
Simulation results of total energy received by PD over time in Experiment 2.
Figure 9.
Device for measuring the stability of the calibration light source in real time.
Figure 9.
Device for measuring the stability of the calibration light source in real time.
Figure 10.
Structure of DSI300 silicon photodetector: (a) Main view; (b) Top view.
Figure 10.
Structure of DSI300 silicon photodetector: (a) Main view; (b) Top view.
Figure 11.
The output voltage of PD in Experiment 1.
Figure 11.
The output voltage of PD in Experiment 1.
Figure 12.
Variation in the total energy received with time during the PD gaze time in Experiment 1.
Figure 12.
Variation in the total energy received with time during the PD gaze time in Experiment 1.
Figure 13.
The output voltage of PD in Experiment 2.
Figure 13.
The output voltage of PD in Experiment 2.
Figure 14.
Variation in the total energy received with time during the PD gaze time in Experiment 2.
Figure 14.
Variation in the total energy received with time during the PD gaze time in Experiment 2.
Table 1.
Parameters of DSI300 Silicon Photodetector.
Table 1.
Parameters of DSI300 Silicon Photodetector.
| Technical Specifications | Value |
|---|
| Model | DSi300 |
| Effective reception area (mm2) | 100 (ø11.28) |
| Wavelength usage range (nm) | 350–1100 |
| Peak wavelength (nm), typical | 970 |
| Peak wavelength responsiveness (A/W) | 0.6 (>0.55) |
| Typical wavelength responsiveness (A/W) | 0.2 (>0.15) @410 nm |
| Equivalent noise power NEP (W/√Hz) | 2.0 × 10⁻¹³ |
Table 2.
Voltage fluctuation of LED light source in Experiment 1.
Table 2.
Voltage fluctuation of LED light source in Experiment 1.
| Number | Voltage (V) | Average (V) | Maximum Relative Deviation (%) |
|---|
| 1 | 3.07245 | 3.07238 | 0.002% |
| 2 | 3.07238 |
| 3 | 3.07238 |
| 4 | 3.07237 |
| 5 | 3.07232 |
| 6 | 3.07243 |
| 7 | 3.07234 |
| 8 | 3.07242 |
| 9 | 3.07233 |
Table 3.
The relative uncertainty of PD stability in Experiment 1.
Table 3.
The relative uncertainty of PD stability in Experiment 1.
| Number | Estimated Value
(mW) | Maximum
(mW) | Minimum
(mW) | Standard Deviation
(mW) | Relative Uncertainty Degree
(%) |
|---|
| 1 | 13.8759 | 13.8814 | 13.8738 | 0.0017 | 0.012 |
| 2 | 13.8748 | 13.8777 | 13.8728 | 0.0010 | 0.007 |
| 3 | 13.8936 | 13.8985 | 13.8911 | 0.0016 | 0.012 |
Table 4.
The relative uncertainty of the stability of halogen lamp in Experiment 2.
Table 4.
The relative uncertainty of the stability of halogen lamp in Experiment 2.
| Number | Estimated Value
(mW) | Maximum
(mW) | Minimum
(mW) | Standard Deviation
(mW) | Relative Uncertainty Degree
(%) |
|---|
| 1 | 12.3705 | 12.3705 | 12.2957 | 0.0493 | 0.399 |
| 2 | 12.3305 | 12.3305 | 12.2559 | 0.0589 | 0.478 |
| 3 | 12.3265 | 12.3265 | 12.2655 | 0.0475 | 0.385 |
Table 5.
Comparison of light source stability measurement methods.
Table 5.
Comparison of light source stability measurement methods.
| Parameters | Equidistance Method | PD Measures Light Source Stability |
|---|
| Measurement equipment | SL and Photometers | LED, PD, Preamplifiers, and Acquisition cards |
| Measurement time (h) | 4 | 8 |
| Real-time measurements | No | Yes |
| Measurement uncertainty (%) | 0.09 | 0.01 |
| Publisher’s Note: MDPI stays neutral with regard to jurisdictional claims in published maps and institutional affiliations. |
© 2022 by the authors. Licensee MDPI, Basel, Switzerland. This article is an open access article distributed under the terms and conditions of the Creative Commons Attribution (CC BY) license (https://creativecommons.org/licenses/by/4.0/).


