Communication

Airborne Sound Sensing System Based on DAS and Ultra-Simple Transducer Structure

1
CGN New Energy Holding Co., Ltd., Beijing 100071, China
2
College of Electrical Engineering, Sichuan University, Chengdu 610065, China
*
Author to whom correspondence should be addressed.
Photonics 2022, 9(12), 975; https://doi.org/10.3390/photonics9120975
Submission received: 24 November 2022 / Revised: 8 December 2022 / Accepted: 9 December 2022 / Published: 12 December 2022
(This article belongs to the Special Issue Advances of Optical Fiber Sensors)

Abstract

:
Fiber-distributed optical fiber acoustic sensor (DAS) is generally used in distributed long-distance acoustic/vibration measurement. Recently, DAS is also used in weak airborne sound detection. To improve the sensitivity of DAS, using a state-of-the-art acoustic transducer or a special enhanced scattering fiber, which are uncommon in the industrial site, is often essential, according to the previous research. In this work, the fading of DAS is suppressed by the multi-frequency probes and polarization-diversity-receiver scheme. The self-noise of DAS is further lowered by the phase averaging of multiple acoustic channels wound on the transducer. We found that, supported by this high-performance DAS, even if the transducer is made with an ultra-simple plastic structure in daily life, the system can achieve high-sensitivity airborne sound sensing. The proposed simple acoustic transducer can reach the sensitivity level of −106.5 dB re. 1 rad/μPa at a sensing range of 5.1 km, which can meet many demands on the industrial site.

1. Introduction

A fiber-distributed acoustic sensor (DAS), based on Rayleigh scattering, employs an existing low-cost common single-mode fiber (SMF) to achieve quantitative acoustic measurements of long distances with high spatial resolution and high sensitivity [1,2,3]. Because of these advantages, DAS is widely used in fields such as third-party interference (TPI) and leakage detection of pipelines [2,4], earthquake [5,6], perimeter safety [7,8], traffic flow [9,10], etc.
Among DAS based on Rayleigh scattering, phase-sensitive OTDR optical time domain reflectometry (φOTDR), which can quantitatively measure the phase of Rayleigh scattering, has achieved commercial success because it not only has the common advantages of DAS but also is relatively low-cost [11,12]. However, due to the ultra-low Rayleigh scattering intensity, the acoustic sensitivity of φOTDR is difficult to be improved [13,14]. For example, the sensitivity of the φOTDR used to detect seismic activity is still far lower than that of the traditional geophone [2]. Recently, more work has turned to increasing the distributed backscattering throughout the fiber, substantially improving the sensitivity and significantly suppressing the fading [1]. However, it is still a great challenge for DAS to detect ultra-weak sounds such as airborne sounds. The main reason is that the sound pressure coefficient of the optical fiber is minimal; therefore, it is difficult to quantify such a small phase change, even using the state-of-the-art DAS [15]. The idea to solve this problem is to design a sound pressure transducer with exquisite structure [16,17]. Although the effect of these transducers has been proven to be excellent, special customized mechanical designs are required [17]. When there is an urgent need for high-sensitivity acoustic measurement on the industrial site, there is no time to customize special transducers and order special enhanced scattering optical fiber (uncommon in daily life).
In this work, we obtained a DAS with low-self noise and anti-fading performance through multi-frequency probe, polarization diversity receiver (PDR), and multi-channel phase averaging to reduce the dependence on special optical fibers and a well-designed transducer, making the system more versatile. Then we connected the DAS to SMF and obtained an ultra-simple sound wave transducer with a good performance by manually winding the SMF to an ordinary plastic bottle. We can quickly meet such urgent measurement needs, which could significantly improve the flexibility of the deployment of DAS.

2. Principle and Experiment Setup

The multi-frequency probes and PDR scheme were proven effective in suppressing fading of φOTDR [13,18]. This paper adopts linear frequency modulation phase-sensitive optical time domain reflectometry (LFM-φOTDR) with a multi-frequency probe and PDR as the DAS, whose system structure is shown in Figure 1.
The light emitted by a narrow linewidth laser (NLL) with low phase noise, 3 kHz FWHM linewidth, and 13 dBm maximum power first passes through a polarization maintaining (PM) coupler. An acousto-optic modulator (AOM) modulates 90% of the light to generate probe light. Thus, 10% of the light as a local oscillator signal can be expressed as:
E L t = P L exp j ω c t
P L is the power of the local light. One wideband AWG generates LFM pulses, whose sweep range of two adjacent interrogation periods is 150 MHz~200 MHz ( n = 1 ) and 200 MHz~250 MHz ( n = 2 ), respectively,
s n t = W t T p exp j 2 π f n , 0 t + π κ t 2
where f n , 0 represents the initial frequency of the nth LFM pulse, and κ represents the chirp rate. The limit of the spatial resolution is 2 m because the bandwidth of each sweeping band is 50 MHz (if we set the gauge length to 2 m or even shorter). The LFM pulse of these two frequencies (pulse width is T p = 2 μs and pulse repetition rate is 25 kHz) is amplified by the power amplifier to drive the acoustic–optic modulator AOM to generate multi-frequency LFM pulse light. We use pulse EDFA to amplify the multi-frequency LFM pulse light to increase the power entering the optical fiber. Here, we need to avoid nonlinear effects, such as modulation instability [19], caused by the system with excessive power injected into the fiber. The peak power of the light into the fiber is ~23 dBm. The light field of the probe light entering the optical fiber can be expressed as:
E p , n t = P P W t T p exp j ω c t + 2 π f n , 0 t + π κ t 2
When the probe light is injected into the fiber to be tested, Rayleigh scattered light returns to the receiver through port two and port three of the circulator in turn. The returned Rayleigh backscattered light field can be expressed as
E R , n t = i = 1 N E i W t τ i T p exp j ω c t τ i + 2 π f n , 0 t τ i + π κ t τ i 2
where 𝑁 is the total number of scattering points in the fiber, E i is the electric field intensity of the scattered light at each scattering point, and τ i is the time delay of Rayleigh backscattered light generated at a certain position 𝑖 on the optical fiber returning to the receiver. PDR is used to reduce polarization fading. The local oscillator and Rayleigh scattered light are mixed in the PDR, and then the Rayleigh scattered light of two polarization states is detected by two balanced detectors with a bandwidth of 350 MHz, where the detected x-polarization signal can be expressed as:
i n , x t J E R n t E L * t = i = 1 N A i W t τ i T p sin 2 π f n , 0 t τ i + π κ t τ i 2 ω c τ i
where * is the complex conjugate sign, and 𝐴 is the amplitude of Rayleigh backscattered light converted into electrical signal by BPD. Then, i t is converted to a digital signal by two 250 M A/D converters and demodulated in real-time by high-speed FPGA. We use Hilbert transform to change the real signal i t   into the complex signal, which can be expressed as follows in the x polarization:
I n , x t = 0 T A τ W t τ T p exp j [ 2 π f n , 0 t τ + π κ t τ 2 ω c τ ] d τ = h t s n t
where T is the total round-trip time in the optical fiber, h t is defined as the impact response of the fiber under test (FUT). We generate the matching filter s n * t (inverse and conjugate of the original LFM signal s n t ) on FPGA, convoluted with i n , x t , to obtain the Rayleigh scattering signal in the x polarization direction after pulse compression
I n , x t = h t s n t s n * t  
Finally, we obtain four complex vectors I 1 , x t , I 1 , y t , I 2 , x t , I 2 , y t . The relative relationship of these four complex vectors in time is shown in Figure 2.
I 2 , x t   I 2 , y t is 0.04 ms later than I 1 , x t , I 1 , y t ; we first delay the I 1 , x t , I 1 , y t by 0.04 ms and then use the rotated vector sum method (RVSM) to synthesize the four complex vectors. Since the randomness of Rayleigh scattering intensity is related to the polarization and frequency of the detection light, the four signals can play a significant anti-fading effect by RVSM. Therefore, within 0.08 ms, one complex vector signal is obtained by RVSM, so the interrogation frequency of the system is 12.5 kHz, which can respond to acoustic signals with a frequency less than 6.25 kHz, covering ordinary acoustic frequencies such as mechanical vibration and voice. The complex vector signal is transmitted to the upper computer through the PCIe x4 bus for spatial difference and unwrapping operations. Finally, the acoustic signal of the entire optical fiber φ i   is demodulated in real-time. The multi-frequency and PDR can suppress the fading and self-noise, but the Rayleigh intensity of each spatial position (so-called acoustic channel) is still uneven. Fortunately, when the fiber wound on the handmade microphone is long (multiple acoustic channels), we can use the multiple channels to reduce the self-noise further. In this work, we averaged the phase of multiple channels wound on the handmade microphone to obtain the phase of the handmade microphone φ A :
φ A = 1 N i = M M + N φ i
where M and N are the starting channel and the number of channels wound on the handmade microphone, respectively. The demodulated signal represents the backscattering light’s phase change, which is proportional to the fiber strain. The relationship between the phase change and fiber strain can be expressed as:
d φ A = ε L k
where d φ A is the demodulated signal of the DAS, which represents the phase change of the backscattering; L   is the gauge length; and k is the proportional constant, which is 110.37 n ε · m / rad . Then, we can define the sensitivity S of a DAS under a sound pressure P as [14]:
S = d φ A P

3. Results

3.1. Anti-Fading Effect of the DAS

The route of the FUT was: 5.1 km standard SMF reel—20 m SMF wound on PZT—100 m jumper—self-made microphone with 20 m standard SMF—0.8 km standard SMF reel. We applied a signal with a frequency of 400 Hz to the PZT and recorded the 480 m signal around the PZT when using the different polarization and frequencies. The four signals of the time-differential phase of “1-polarization-1-frequency” have many fading points (Figure 3a–d), and phase (Figure 3f) and its time differential phase (Figure 3e) synthesized by “2-polarization-2-frequency” almost had no obvious fading points, which means that the system could recover and output high-quality acoustic signals consistently.

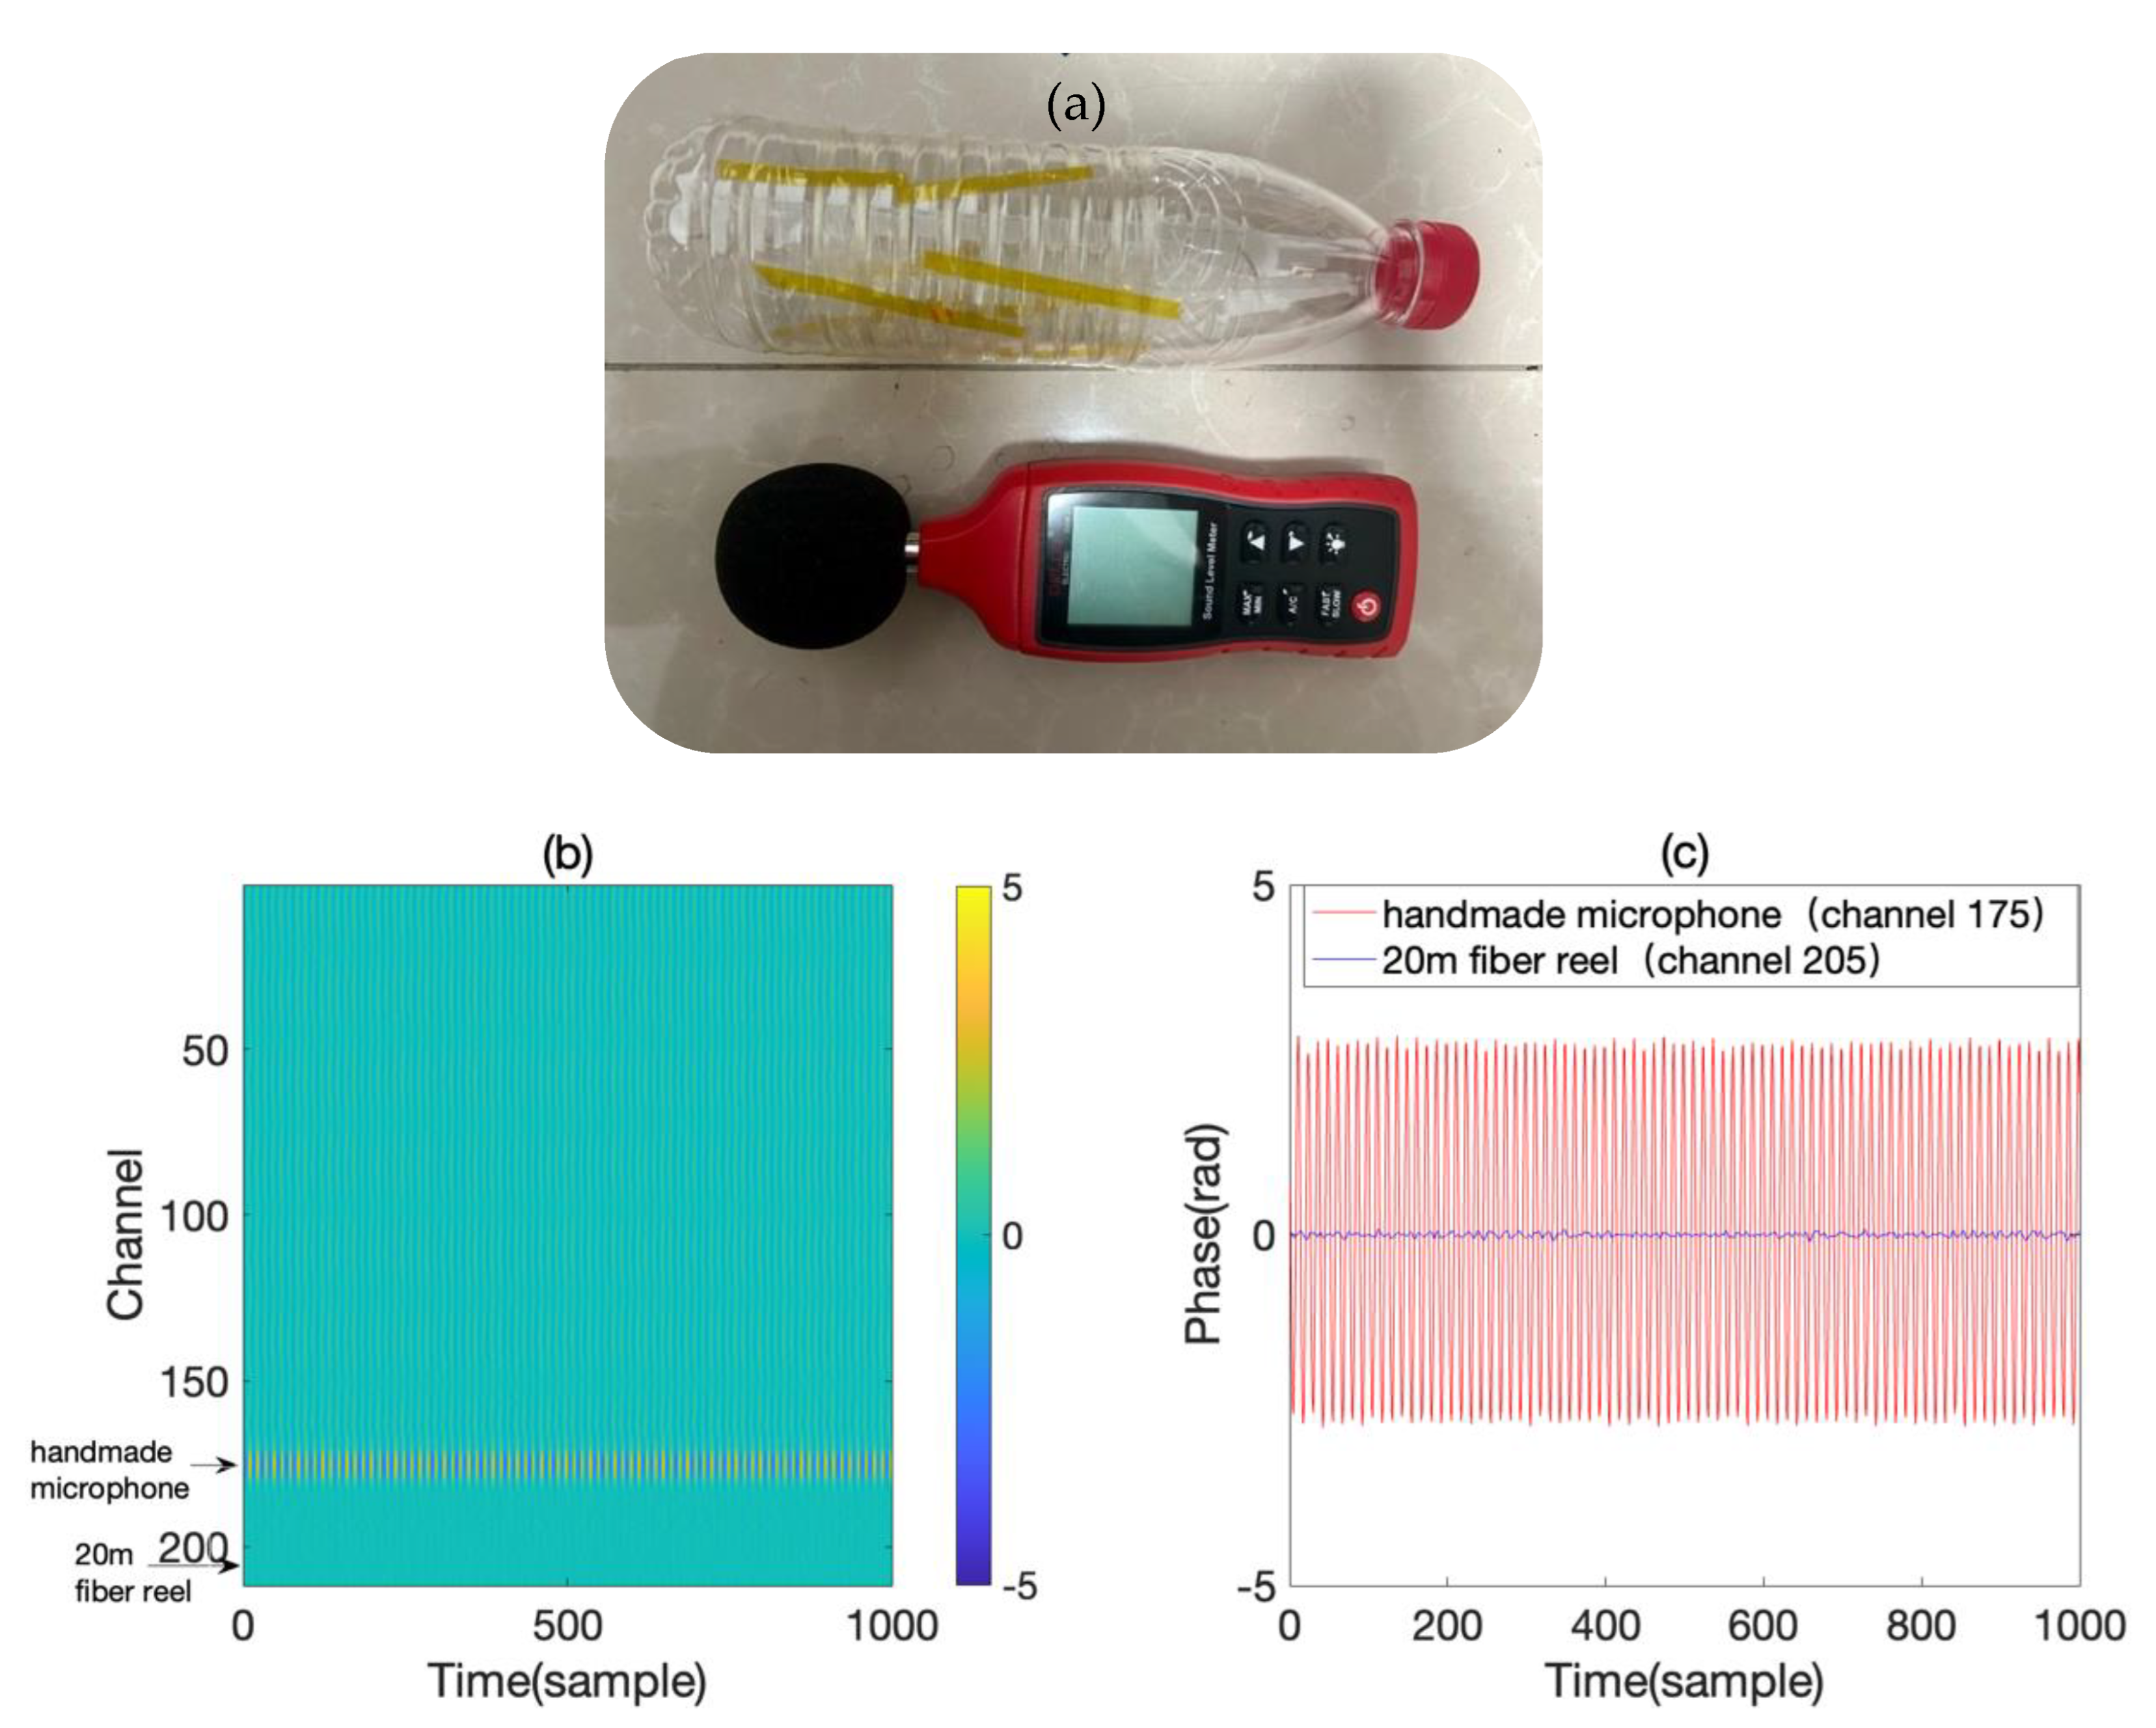
3.2. Fabricate of Microphone

When we talk close to the plastic bottle, if we hold the plastic bottle, we feel noticeable vibration, which inspires us that if the fiber is wound onto the plastic bottle, the phase change of Rayleigh scattering will be much larger due to the increase in strained fiber length. We used an ordinary empty plastic drink bottle with a diameter of ~6.5 cm and a total length of ~23 cm as the acoustic transducer structure. We wound the 20 m fiber in the regular and shallow grooves on the bottle. The fiber was wound slightly tight to obtain an initial strain. Finally, we used high-temperature tape to fix the fiber on the bottle. The handmade microphone is shown in Figure 4a. We put a sound level meter (SLM) together with the microphone to measure the sound level of the speaker. To compare the gain generated by the bottle, we placed a 20 m stand SMF reel with the same diameter as the bottle. The gauge length L of DAS was set to 22.4 m (~7 acoustic channels), a little longer than the length of the fiber wound onto the microphone (20 m), to match the fiber length on the microphone. To compare the sensitivity of the handmade microphone and the optical fiber, we connected the same length of optical fiber coil behind the microphone. We played 500 Hz sound at the same distance from the handmade microphone and the fiber reel. The sound detected by the handmade microphone is far larger than that detected by the 20 m fiber coil (Figure 4b,c). This proves that the strain produced by the airborne sound directly acting on the optical fiber is very small, and the transducer structure must be used to increase the strain of the fiber to detect airborne sound effectively.
The loss of optical fiber will degrade the system’s signal-to-noise ratio, so we measured the loss of the handmade microphone through OTDR. The measured loss is ~0.158 dB, part of which is the fusion loss, most of which may be caused by micro bending and twisting during winding. In this experiment, there is only one microphone. If multiple microphones are connected in series at the industrial site, more additional loss will be induced. Therefore, it is better to reduce fiber twisting and control fusion loss when winding the fiber onto the transducer.

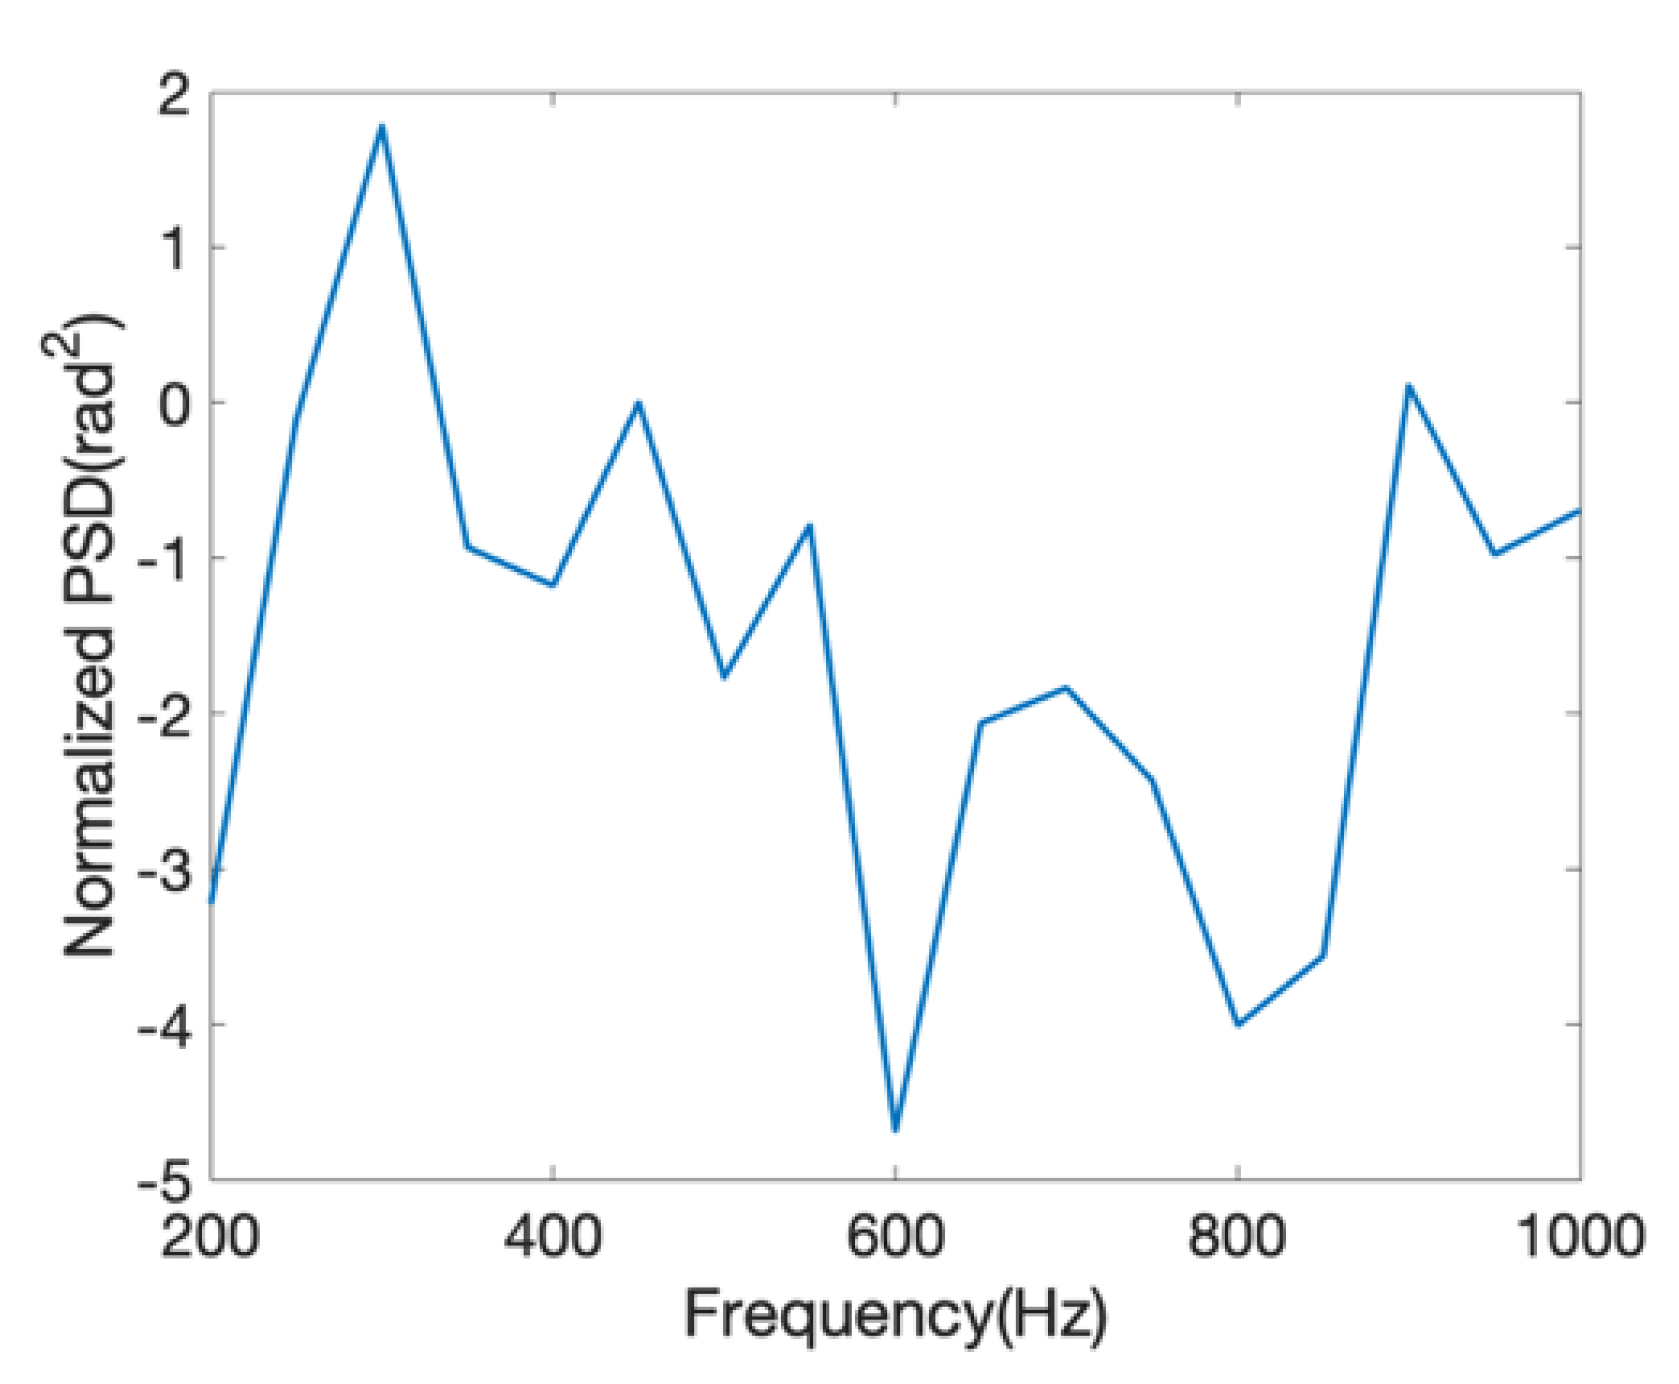
3.3. The Performance of DAS and Handmade Microphone

To test the performance of this handmade microphone, we placed a speaker 50 cm from the microphone and then allowed the speaker to generate sound waves with a frequency of 500 Hz and a decibel of 84 dB (tested by the SLM near the microphone). At the same time, we applied a 200 Hz 3 V drive signal to the PZT. The phase before averaging ( φ i ) waterfall of 6 km fiber was collected by the DAS system (Figure 5).
We indexed φ i   at the PZT and handmade microphone positions, respectively (Figure 6a,b), whose power spectral Density(PSD) were shown in Figure 6d,e, repectively. Even though the scheme of multi-frequency probe and PDR was adopted, the recovered phase still had some minor glitches (Figure 6b). To lower the self-noise, the phase of the seven acoustic channels wound on the handmade microphone was averaged by Equation (8). The glitches almost disappeared (Figure 6c), and the self-noise after averaging the acoustic channels was much lower (Figure 6e,f).
The PZT and the microphone were not placed in a vibration isolation room; there would be some environmental interference, especially the low-frequency sound mixed with the acquired signal. We could estimate that the self-noise of the system (from the PSD in Figure 6f) above 250 Hz and below 250 Hz was ~ 60   dB   r a d 2 / Hz   and ~ 50   dB   rad 2 / Hz , i.e., ~0.001 rad / Hz   and ~0.003 rad / Hz , respectively. According to Equation (8), the minimum detectable strain was ~5 pε/ Hz   (above 250 Hz) and ~15 pε/ Hz   (below 250 Hz), respectively. Furthermore, the phase change generated by the handmade microphone was ~1.5 rad (Figure 6b). Considering the sound pressure level of 84 dB, we calculated the P as 0.317 Pa. According to Equation (9), the measured sensitivity was −106.5 dB re. 1 rad/μPa.
Then, we tested the microphone’s normalized frequency response (Figure 7) by tuning the speaker’s frequency from 200 Hz to 1000 Hz in steps of 50 Hz. We used the SLM to ensure the speaker was kept at a fixed volume. When we tuned the speaker’s frequency, we recorded the amplitude of the corresponding frequency responses of DAS. The largest response frequency was at approximately ~300 Hz, which may be related to the material of the plastic bottle, whose elastic modulus is relatively large. Therefore, the handmade microphone may be more suitable for detecting low-frequency mechanical vibration. If the frequency band of the detected sound is higher, the material with a small elastic modulus should be selected. The sensitivity deviation is ±6.5 dB, which may be led by the measurement error of SLM and the structure of the plastic bottle.

3.4. The Simulation Sound of Valve Acquisition by the Handmade Microphone

To simulate the ability of the handmade microphone to deploy in the industrial field, we played two mechanical audio files of an open dataset [20] for malfunctioning industrial machine investigation and inspection (MIMII dataset). The sound file we played was generated by valves. The first part of the sound file we played was generated by the normal valves and the second part was abnormal. The signal recorded by our microphone was processed by a high pass filter (the stop edge frequency is 80 Hz, and the pass edge frequency is 100 Hz) to remove most of the DC noise generated by temperature or low-frequency vibration. The recorded signal of the valve can be seen in Figure 8.

4. Discussion

The previous work focused on improving the airborne sensing performance of DAS by the well-designed transducer and enhanced scattering fiber, which is not common in industrial applications. We demonstrated that airborne acoustic sensing could be realized by a relatively high-performance DAS combined with the ultra-simple transducer. A DAS with low self-noise and fading can reduce the requirements for the transducer. We can wind standard SMF fiber onto objects (such as plastic bottles) around us, and then we can quickly achieve high-sensitivity airborne acoustic measurements. The fabrication of this transducer is simple: it only takes 20 min to wind a 20-m-long optical fiber onto a drink plastic bottle. That means when the airborne measurement requirements may be urgent, we can still acquire a distributed high-sensitivity airborne acoustic sensor even if we do not have a well-designed transducer and special fiber if the performance of the DAS is good enough. It is worth mentioning that this work is not to pursue the optimal airborne sensing performance but to provide an airborne sensing solution that is readily available and easy to use against the backdrop of significant progress in DAS performance in recent years.

5. Conclusions

In this work, the performance of DAS is improved by the multi-frequency probes and polarization-diversity-receiver scheme. The self-noise of DAS is further lowered by the phase averaging of multiple acoustic channels wound on the transducer. We found that supported by this high-performance DAS, even if the transducer is made by an ultra-simple plastic structure in daily life, the system can achieve high-sensitivity airborne sound sensing. The experiments demonstrated that the proposed ultra-simple acoustic transducer achieved a sensitivity level of −106.5 dB re. 1rad/μPa at 5.1 km, which meets many demands on the industrial site. We will try more materials and simple structures to realize higher sensitivity and flatten frequencies response in the future.

Author Contributions

Conceptualization, J.T. and F.P.; methodology, J.T.; software, F.P.; validation, M.H.; formal analysis, M.H.; investigation, F.P.; resources, J.T.; data curation, X.Z. and F.P.; writing—original draft preparation, J.T.; writing—review and editing, F.P. and G.J.; visualization, M.H. All authors have read and agreed to the published version of the manuscript.

Funding

This work was partially supported by the National Natural Science Foundation of China under Grant 51907135, partly by the Fundamental Research Funds for the Central Universities under Grant YJ201654.

Data Availability Statement

The data presented in this study are available upon request from the corresponding author.

Conflicts of Interest

The authors declare no conflict of interest.

References

  1. Sun, Y.; Li, H.; Fan, C.; Yan, B.; Chen, J.; Yan, Z.; Sun, Q. Review of a Specialty Fiber for Distributed Acoustic Sensing Technology. Photonics 2022, 9, 277. [Google Scholar] [CrossRef]
  2. Ashry, I.; Mao, Y.; Wang, B.; Hveding, F.; Bukhamsin, A.; Ng, T.K.; Ooi, B.S. A Review of Distributed Fiber–Optic Sensing in the Oil and Gas Industry. J. Light. Technol. 2022, 40, 1407–1431. [Google Scholar] [CrossRef]
  3. Lu, X.; Krebber, K. Phase Error Analysis and Unwrapping Error Suppression in Phase-Sensitive Optical Time Domain Reflectometry. Opt. Express 2022, 30, 6934–6948. [Google Scholar] [CrossRef] [PubMed]
  4. Muggleton, J.M.; Hunt, R.; Rustighi, E.; Lees, G.; Pearce, A. Gas Pipeline Leak Noise Measurements Using Optical Fibre Distributed Acoustic Sensing. J. Nat. Gas Sci. Eng. 2020, 78, 103293. [Google Scholar] [CrossRef]
  5. Williams, E.F.; Fernández-Ruiz, M.R.; Magalhaes, R.; Vanthillo, R.; Zhan, Z.; González-Herráez, M.; Martins, H.F. Distributed Sensing of Microseisms and Teleseisms with Submarine Dark Fibers. Nat. Commun. 2019, 10, 5778. [Google Scholar] [CrossRef] [PubMed] [Green Version]
  6. Martuganova, E.; Stiller, M.; Norden, B.; Henninges, J.; Krawczyk, C.M. 3D Deep Geothermal Reservoir Imaging with Wireline Distributed Acoustic Sensing in Two Boreholes. Solid Earth 2022, 13, 1291–1307. [Google Scholar] [CrossRef]
  7. Li, Z.; Zhang, J.; Wang, M.; Zhong, Y.; Peng, F. Fiber Distributed Acoustic Sensing Using Convolutional Long Short-Term Memory Network: A Field Test on High-Speed Railway Intrusion Detection. Opt. Express 2020, 28, 2925. [Google Scholar] [CrossRef] [PubMed]
  8. Zhu, P.; Xu, C.; Ye, W.; Bao, M. Self-Learning Filtering Method Based on Classification Error in Distributed Fiber Optic System. IEEE Sens. J. 2019, 19, 8929–8933. [Google Scholar] [CrossRef]
  9. Chambers, K. Using DAS to Investigate Traffic Patterns at Brady Hot Springs, Nevada, USA. Lead. Edge 2020, 39, 819–827. [Google Scholar] [CrossRef]
  10. Xu, S.; Qin, Z.; Zhang, W.; Xiong, X. Monitoring Vehicles on Highway by Dual-Channel φ-OTDR. Appl. Sci. 2020, 10, 1839. [Google Scholar] [CrossRef]
  11. Wang, Z.; Lu, B.; Ye, Q.; Cai, H. Recent Progress in Distributed Fiber Acoustic Sensing with Φ-OTDR. Sensors 2020, 20, 6594. [Google Scholar] [CrossRef] [PubMed]
  12. Wang, Y.; Zheng, H.; Lu, C. High-Sensitivity Distributed Relative Salinity Sensor Based on Frequency-Scanning φ-OTDR. Opt. Express 2022, 30, 22860. [Google Scholar] [CrossRef] [PubMed]
  13. Ogden, H.M.; Murray, M.J.; Murray, J.B.; Kirkendall, C.; Redding, B. Frequency Multiplexed Coherent Φ-OTDR. Sci. Rep. 2021, 11, 17921. [Google Scholar] [CrossRef] [PubMed]
  14. Lu, X.; Thomas, P.J. Numerical Modeling of Fcy OTDR Sensing Using a Refractive Index Perturbation Approach. J. Light. Technol. 2020, 38, 974–980. [Google Scholar] [CrossRef]
  15. Hocker, G.B. Fiber-Optic Sensing of Pressure and Temperature. Appl. Opt. 1979, 18, 1445–1448. [Google Scholar] [CrossRef] [PubMed]
  16. Li, H.; Sun, Q.; Liu, T.; Fan, C.; He, T.; Yan, Z.; Liu, D.; Shum, P.P. Ultra-High Sensitive Quasi-Distributed Acoustic Sensor Based on Coherent OTDR and Cylindrical Transducer. J. Light. Technol. 2020, 38, 929–938. [Google Scholar] [CrossRef]
  17. Wu, Y.; Gan, J.; Li, Q.; Zhang, Z.; Heng, X.; Yang, Z. Distributed Fiber Voice Sensor Based on Phase-Sensitive Optical Time-Domain Reflectometry. IEEE Photonics J. 2015, 7, 1–10. [Google Scholar] [CrossRef]
  18. Zhang, J.; Wu, H.; Zheng, H.; Huang, J.; Yin, G.; Zhu, T.; Qiu, F.; Huang, X.; Qu, D.; Bai, Y. 80 Km Fading Free Phase-Sensitive Reflectometry Based on Multi-Carrier NLFM Pulse Without Distributed Amplification. J. Light. Technol. 2019, 37, 4748–4754. [Google Scholar] [CrossRef]
  19. Martins, H.F.; Martin-Lopez, S.; Corredera, P.; Salgado, P.; Frazão, O.; González-Herráez, M. Modulation Instability-Induced Fading in Phase-Sensitive Optical Time-Domain Reflectometry. Opt. Lett. 2013, 38, 872. [Google Scholar] [CrossRef] [PubMed]
  20. Purohit, H.; Tanabe, R.; Ichige, K.; Endo, T.; Nikaido, Y.; Suefusa, K.; Kawaguchi, Y. MIMII Dataset: Sound Dataset for Malfunctioning Industrial Machine Investigation and Inspection. arXiv 2019, arXiv:1909.09347. [Google Scholar]
Figure 1. The DAS system based on multi-frequency and PDR receiver.
Photonics 09 00975 g001
Figure 2. The space and time relationship of I 1 , x t , I 1 , y t , I 2 , x t , I 2 , y t .
Photonics 09 00975 g002
Figure 3. The time differential phase waterfall demodulated by (a) 1st frequency of X polarization; (b) 2nd frequency of X polarization; (c) 1st frequency of Y polarization; (d) 2nd frequency of Y polarization; the time differential phase (e) and phase (f) waterfall synthesized by a “2-polarization-2-frequency”.
Photonics 09 00975 g003
Figure 4. (a) Handmade microphone (up) and sound level meter SLM (down). (b) Phase waterfall of handmade microphone and 20 m fiber reel. (c) The phase of handmade microphone and 20 m fiber reel.
Photonics 09 00975 g004
Figure 5. The phase before averaging ( φ i ) waterfall of (a) 6 km fiber and (b) near PZT and microphone.
Photonics 09 00975 g005
Figure 6. Phase at the positions of (a) PZT and (b) handmade microphone before multi-channel averaging. Phase at the position of handmade microphone after multi-channel averaging (c). PSD of phase at the positions of (d) PZT, (e) handmade microphone before multi-channel averaging and (f) handmade microphone after multi-channel averaging.
Photonics 09 00975 g006
Figure 7. Normalization frequency response of the handmade microphone.
Photonics 09 00975 g007
Figure 8. The recovered simulated valve sound by the handmade microphone.
Photonics 09 00975 g008
Publisher’s Note: MDPI stays neutral with regard to jurisdictional claims in published maps and institutional affiliations.

