Communication

Overcoming the Lead Fiber-Induced Limitation on Pulse Repetition Rate in Distributed Fiber Sensors

Institute for Infocomm Research, Agency for Science, Technology and Research, Singapore 138632, Singapore
*
Author to whom correspondence should be addressed.
Photonics 2022, 9(12), 965; https://doi.org/10.3390/photonics9120965
Submission received: 15 November 2022 / Revised: 1 December 2022 / Accepted: 8 December 2022 / Published: 10 December 2022
(This article belongs to the Topic Advances in Optical Sensors)

Abstract

:
Distributed fiber sensor (DFS)-based dynamic sensing has attracted increasing attention thanks to the growing demand in areas such as structural health monitoring and geophysical science. The maximum detectable frequency of DFSs depends on the maximum pulse repetition rate (MPRR), which is limited by the total length of the fiber under test (FUT). In some real-world applications, there is some distance between the interrogator and the monitoring site. Therefore, only a small part of the FUT acts as a sensing fiber (SF), while the other major part just acts as a lead fiber (LF), and the MPRR is limited by the LF and SF. Overcoming the LF-induced extra limitation on the MPRR is a practical problem for many DFS applications. In this paper, to the best of our knowledge, we propose a simple approach for overcoming the LF-induced extra limitation on the MPRR by dividing the DFS interrogator into two parts, for the first time. The proposed approach can be easily implemented for the real-world applicationsof DFSs whose LF is much longer than SF. It has been experimentally validated by using conventional phase-sensitive optical time domain reflectometry and Brillouin optical time domain analysis.

1. Introduction

Distributed optical fiber sensors (DFSs) have attracted increasing attention in academia and industry over the past decades, as there are many intrinsic advantages such as employing the entire fiber as the sensing element, immunity to electromagnetic interference, easy installation, corrosion resistance, overall cost reduction, and the capability of distributed sensing in harsh environments [1]. In general, DFSs are mainly based on three types of intrinsic physical phenomena in optical fiber, i.e., Rayleigh, Brillouin, or Raman scattering [2,3]. Different types of DFSs have been demonstrated and are widely used in real-world applications. For instance, Raman optical time domain reflectometry (ROTDR) has been widely used for distributed temperature sensing (DTS), Brillouin optical time domain reflectometry (BOTDR), and Brillouin optical time domain analysis (BOTDA) have been used for distributed strain and/or temperature sensing, distributed acoustic sensors (DASs) based on phase-sensitive optical time domain reflectometry (ϕ-OTDR) have been widely used for detecting vibrations. Polarization-sensitive optical time domain reflectometry (P-OTDR) has been demonstrated for measuring distributed physical fields such as magnetic fields, electric fields, temperature, and strain [4].
Normally, the DFS interrogators are designed for usage in dry, indoor environments, and are usually installed in a server room or control room for practical applications. Therefore, there is always some distance between the targeted monitoring site and the interrogators, i.e., part of the fiber under test (FUT) does not act as the sensing fiber (SF), but only a lead fiber (LF). In other words, FUT = LF + SF. The LF has some negative effects on system performance. For example, in P-OTDR, perturbations on the LF will generate an unnecessary signal, which will mask the real signal in the SF. Feng Wang et al. demonstrated an approach for overcoming the perturbation of the LF in P-OTDR [5]. Another negative effect of LF is its extra limitation on the maximum pulse repetition rate (MPRR) in DFSs. Conventionally, in the above DFS systems, only one optical pulse is allowed to propagate in the FUT at a time. The backscattered light is measured as a function of time corresponding to the distributed locations along the FUT. In other words, each optical pulse generates one trace corresponding to the entire fiber. Therefore, the MPRR is limited by the total length of the FUT. In some scenarios, the LF is a few times longer than the SF. As a result, the MPRR is mainly limited by the LF but not the SF. This issue is a practical problem in the field of DFS application.
Actually, in many real-world applications of DFSs, the LF is much longer than the SF, for example, when using DFSs to monitor underground mines or the deformation during coal mining. In 2007, Hiroshi Naruse et al. reported the field trial results of monitoring underground mines by using BOTDR; the total lengths of the SF and LF were 420 m and 2.6 km, respectively [6]. In 2015, Gang Cheng et al. reported a field study of BOTDR-based overlying strata deformation monitoring during coal mining. Because there was no power at the project site and the transportation of the BOTDR interrogator was inconvenient, they used a remote monitoring scheme. The length of the LF for remote data collection was 3.7 km, while the total depth (sensing length) of the monitored rock strata was 600 m [7]. For the above two applications, if the LF-induced limitation on the MPRR was overcome, the time cost of each measurement could be reduced by about 7 times.
In the past several years, thanks to the growing demand in areas such as structural health monitoring, geophysical science, and gas and oil industries, the research and development of DFS-based dynamic sensing for vibrations and dynamic strain measurement have been accelerated [8]. As for BOTDA-based dynamic strain sensing, the sensing length conventionally ranges from tens of meters to a few hundred meters [9,10,11], thus in many real-world applications, the LF is much longer than the SF. As for some applications of vibration detection systems based on ϕ-OTDR, such as monitoring runways of airports [12], the LF may be also longer than the SF. The maximum detectable frequency (MDF) will be largely limited by the long LF. Therefore, there is a real demand to overcome the LF-induced limitation on the MPRR for applications in which the LF is longer than the SF, especially for dynamic sensing.
Monitoring the structural health of wind turbines is another example. DFSs such as PS-OTDR and BOTDA offer the ability to monitor the dynamic behavior and structural health of wind turbines [13,14]. For wind turbines installed in the ocean, due to the harsh surrounding environments, the interrogators cannot be installed at the site for long-term monitoring. As a result, there will be a substantial length of LF between the interrogator and the wind turbines, and the LF is much longer than the SF mounted on the wind turbines. With the conventional DFS solutions, the MPRR and MDF will be mainly limited by the long LF, which may be one of the reasons to limit the use of DFSs in monitoring the dynamic behavior of wind turbines. If the LF-induced limitation on the MPRR is overcome, the maximum detectable dynamic frequency can be increased significantly.
One more example is monitoring the dynamic strain response of a scale ship for developing a digital twin. In the maritime industry, structural digital twins based on physical sensor information and digital models, play a significant role in monitoring the dynamic structural responses, providing accurate assessments, predictions, and insights for structural integrity [15,16,17]. A test of the scale model is often used to validate the digital model, and DFSs can be used for monitoring the global dynamic responses of the scale model. Conventionally, for monitoring a scale ship model which is on the water in a basin, it needs centimeter-level or even sub-centimeter-level spatial resolution and the length of the SF may be tens of meters, while the LF may be a few times longer. Due to the LF-induced limitation on the MPRR, the MDF of the existing DFSs’ solution may not meet the demand. For instance, in our ongoing project, one of the objectives is utilizing BOTDA to monitor the dynamic strain response of the scale ship model with a centimeter-level spatial resolution for developing a digital twin. 
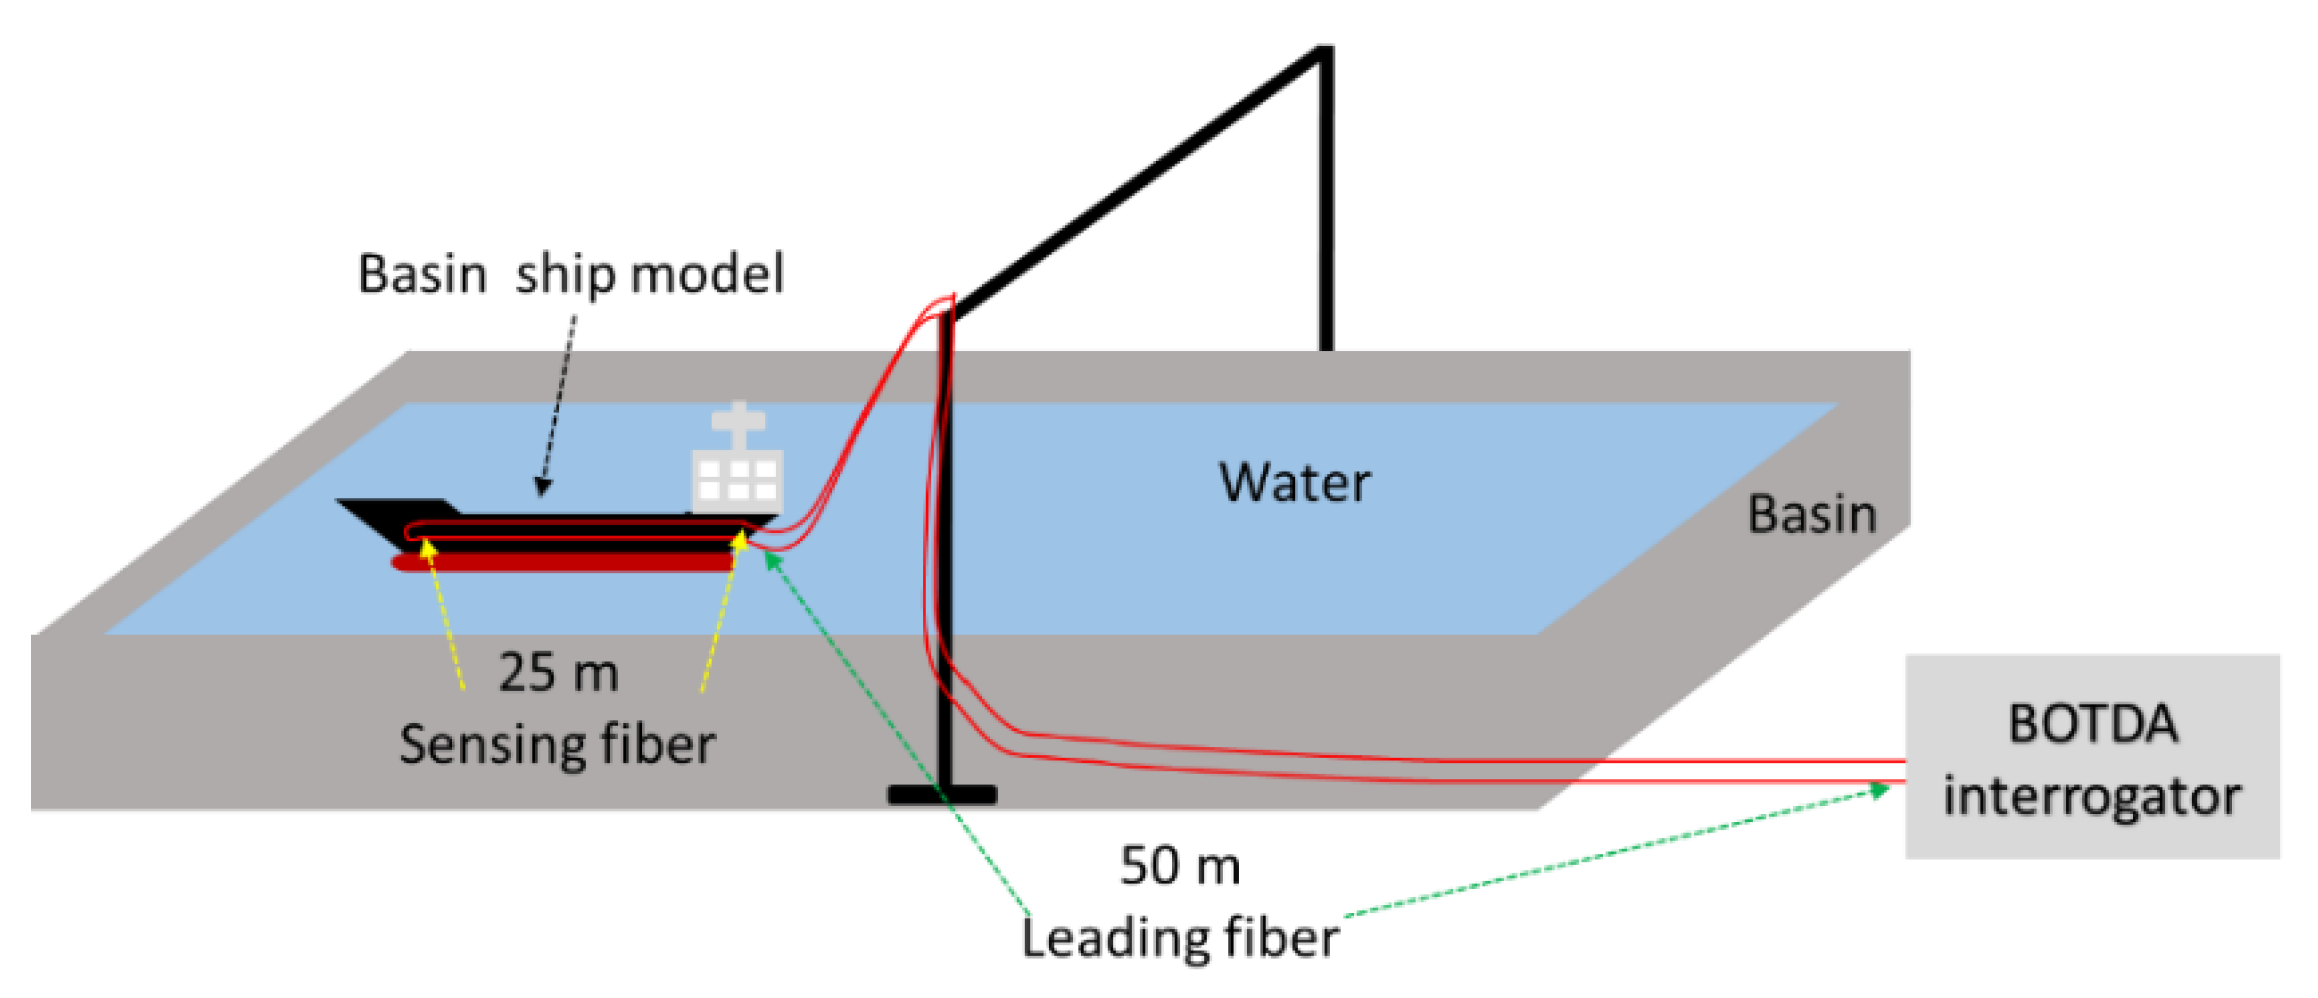
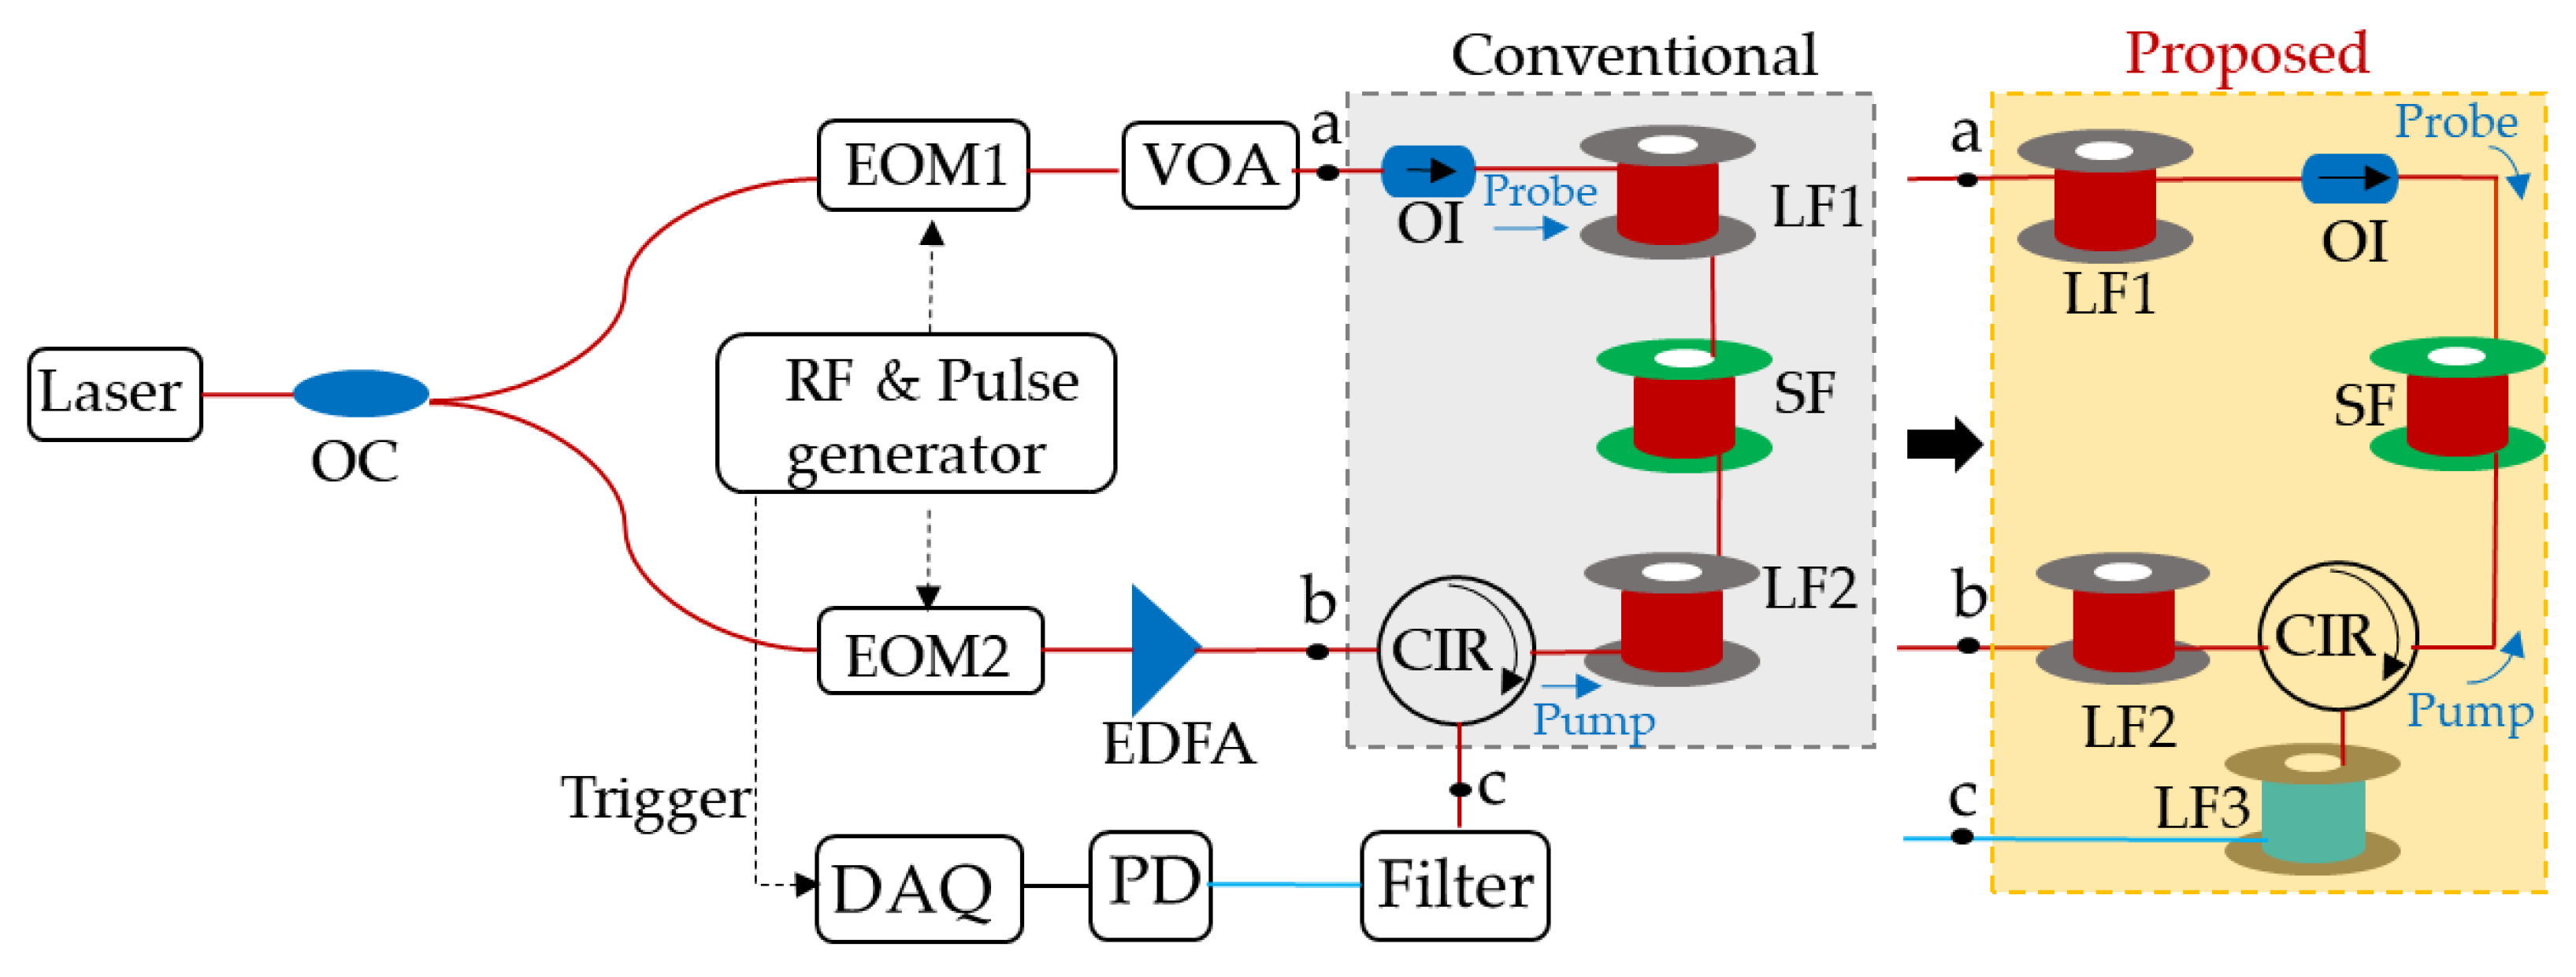
Figure 1 illustrates the schematic diagram of the experimental setup for monitoring the dynamic strain of the ship model. The ship model is on the water in a basin. The details of the basin can be found in [17]. The length of the SF mounted on the ship model is only 25 m, while the lengths of the two LFs between the ship model and the BOTDA interrogator are about 50 m. To obtain a centimeter-level spatial resolution, the differential pulse-width pair (DPP) technique is used. The number of scanning frequencies is 200, and the traces are averaged by 250 times. If using the conventional configuration of BOTDA, the MPRR is limited by the total length of SF + LF, i.e., 125 m. According to Shannon–Nyquist sampling theory, the MDF is half of the MPRR (about 8 Hz). Therefore, the MDF is about 4 Hz. However, the targeted maximum frequency for the dynamic strain is 20 Hz. It should be noted that all the existing BOTDA interrogators in the market cannot meet our project demand. If the LF-induced limitation on the MPRR is overcome, then the MPRR only depends on the SF, i.e., 25 m, and the MDF can be increased to 20 Hz.
If the LF-induced extra limitation on the MPRR is overcome, the time cost of each sensing measurement can be reduced drastically. As a result, the MDF can be increased significantly for dynamic monitoring, or more average times for the signal within a certain timeframe can be realized, which will benefit the signal-to-noise ratio (SNR). Thus, solving the issue could have a great impact on some practical applications of DFSs. However, to the best of our knowledge, all the existing commercial DFS interrogators are designed for the entire FUT, i.e., they are designed without consideration of overcoming the LF-induced extra limitation on MPRR. In addition, there are also no prior papers reporting methods of overcoming the LF-induced extra limitation on MPRR.
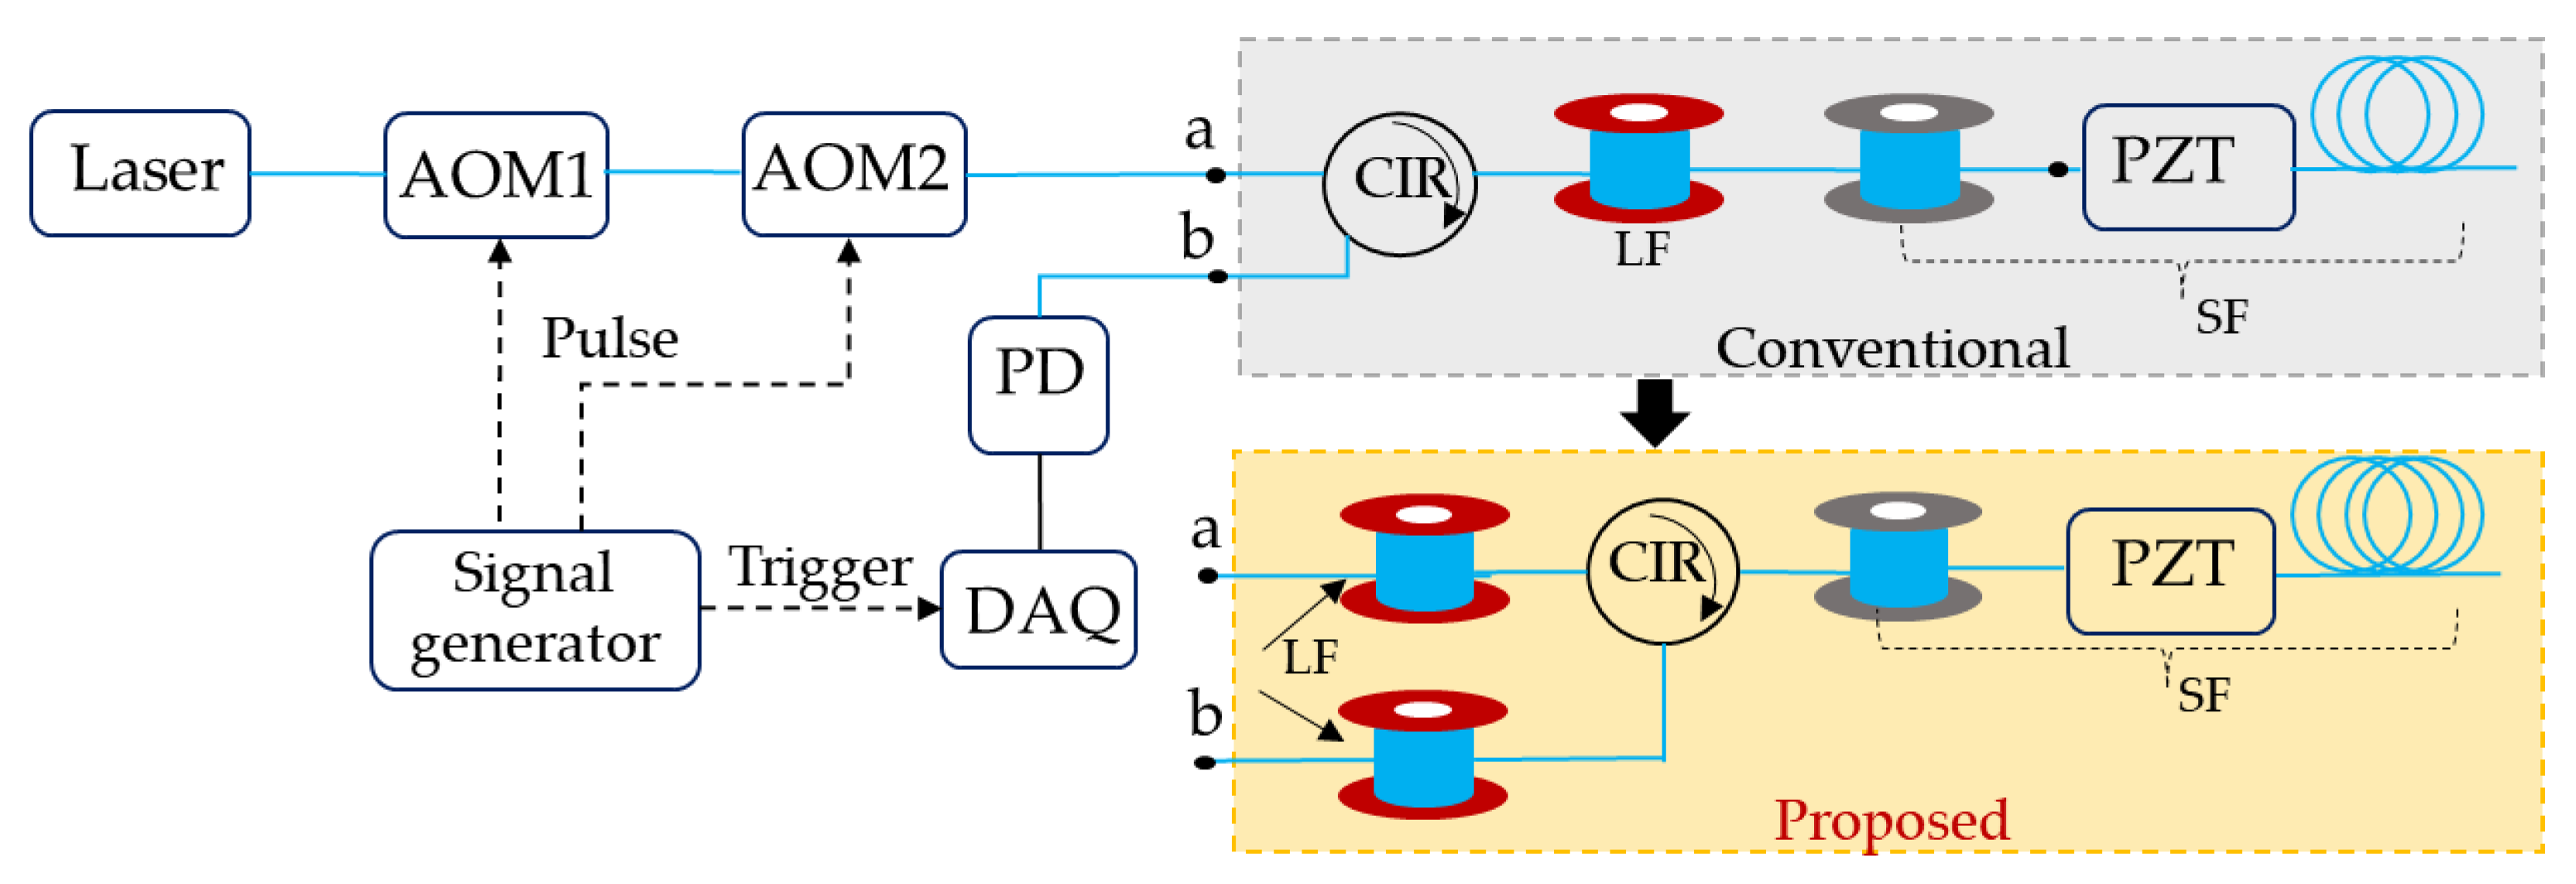
In this paper, for the first time, to the best of our knowledge, we propose a simple approach to effectively overcome the LF-induced extra limitation on the MPRR, which is a practical problem in DFSs for some real-world applications. Our proposed approach only needs to divide the conventional DFS interrogator into two parts, i.e., the in-house part and the on-site part, and then move the passive components, the optical circulator (CIR) and/or optical isolator (OI), to the on-site part. In detail, for single-end-access DFSs such as ϕ-OTDR, P-OTDR, ROTDR, and BOTDR, the CIR is moved to the on-site part from the interrogator. In other words, it only needs to change the relative positions of the LF and the CIR, i.e., moving the LF to the front of port 1 of the CIR, and adding one more LF between port 3 of the CIR and the photodetector (PD), as demonstrated in Section 3. As for two-end-access DFSs such as conventional BOTDA, the OI and CIR are installed in the on-site part, i.e., in addition to adding one more LF, it only needs to change the relative positions of the original two LFs, OI, and CIR, as demonstrated in Section 4. The proposed approach has been experimentally validated for ϕ-OTDR and BOTDA. Notably, the proposed approach only requires a minor system modification and could be easily implemented for other single-end-access DFSs mentioned above.

2. Operating Principle

In a conventional ɸ-OTDR system, a highly coherent optical pulse is launched into the FUT and the Rayleigh backscattered light from a great number of different scattering centers within the same optical pulse width interference coherently at the receiver. In the time domain, the backscattered light is a speckle-like trace during the duration corresponding to the whole length of the FUT.
The round-trip time (RTT) T r t of the optical pulse over the entire FUT can be expressed as:
T r t = 2 L n g c
where L,   n g , and c are the length of the FUT, group refractive index of the fiber, and speed of light in a vacuum, respectively [18,19,20]. The MPRR is limited by RTT, which can be described by the equation for R m p p :
R m p p = c 2 L n g
when the FUT consists of LF and SF, Equation (2) can be rewritten as:
R m p p = c 2 ( L l f + L s f ) n g
where L l f and L s f represent the lengths of LF and SF, respectively. Assuming the length of LF is N times the SF, i.e., L l f = N L s f , Equation (3) can be further rewritten as:
R m p p = c 2 ( N + 1 ) L s f n g
As can be seen from Equations (3) and (4), when the length of the LF is much longer than that of the SF, the MPRR is mainly limited by the LF. By using our proposed approach, as the LF will not have an impact on the RTT, Equation (4) can be revised as
R m p p = c 2 L s f n g
Comparing Equations (4) and (5), we can find that the MPRR can be increased by N + 1 times after using our proposed ɸ-OTDR configuration.
BOTDA is based on the stimulated Brillouin scattering (SBS) effect, which is realized by launching a pump pulse and a counter-propagating continuous-wave (CW) probe into the FUT from its two ends, respectively. SBS only occurs locally at the position where the probe and pump light meet [21,22]. The SBS signal is detected at the fiber end where the pump pulse launches, and recorded as a function of time which corresponds to the whole FUT length. Thus, the MPRR of BOTDA also depends on the RTT. Unlike single-end-access DFS systems, BOTDA has one LF at each side of the FUT, i.e., the FUT consists of two LFs and one SF. Therefore, Equation (4) can be rewritten as:
R m p p = c 2 ( 2 N + 1 ) L s f n g
Similarly, after using our proposed revision, the LF-induced limitation on the MPRR of BOTDA can be removed, thus the MPRR can be increased by 2N + 1 times.

3. Experiments for ɸ-OTDR

3.1. Experimental Setup for ɸ-OTDR

Figure 2 illustrates the schematic diagram of the experimental setup for demonstrating the proposed approach for overcoming the LF-induced limitation on the MPRR in the ϕ-OTDR system. The difference between the conventional setup and the proposed one is highlighted with dashed rectangles. Points “a” and “b” represent the connection points. For the conventional ϕ-OTDR system, the CIR is inside of the interrogator. In our proposed setup, the interrogator is divided into an in-house part and an on-site part, and the CIR is moved to the on-site part from the interrogator.
An external cavity low-noise laser (RIO Grande high-power laser) was used as the laser source, whose center wavelength and line-width were 1550.12 nm and less than 1 kHz, respectively. In the experiment, the power of the CW light from the laser was 29 dBm. The CW light was modulated into optical pulses with a width of 100 ns by an acousto-optic modulator (AOM), which was controlled by a signal generator. The corresponding spatial resolution of the optical pulse was about 10 m. The pulses generated by of the signal generator were also used to trigger the data acquisition (DAQ) card.
As shown in Figure 2, in a conventional setup, the generated optical pulses were launched into the FUT via CIR directly. The FUT consisted of an LF and an SF. The length of the LF was 10.25 km, and the SF includes three parts, i.e., a roll of 2.19 km long single-mode fiber (SMF), a PZT transducer (OPTIHASE PZ1) with 12 m SMF, and 40 m long SMF at the end. The PZT controlled by another signal generator was used to generate vibration signals to simulate external events. The Rayleigh backscattered light passed through the CIR again and was detected via intensity-based direct detection by a PD (COUQER, 10 MHz PIN PD) and recorded by the DAQ card (ADLINK 9852) with a sampling rate of 200 MS/s. The data sampling resolution is about 0.5 m.
In the proposed setup, the LF was moved to the front of the CIR port 1, and one more LF with a 10.25 km length was added between the PD and the CIR. The FUT only consisted of the SF.

3.2. Experimental Results for ɸ-OTDR

In the proposed setup, as the total FUT including the LF and SF was about 12.5 km, the RTT was about 125 µs. According to Equation (2), the MPRR was about 8 kHz. If the pulse repetition rate is larger than 8 kHz, there will be more than one pulse propagating in the FUT simultaneously, which is strictly not allowed in ϕ-OTDR system. The collected signal at any time will be the superimposition of the Rayleigh backscattered light from multiple zones covered by more than one pulse, which will be incorrect. An experiment was conducted to demonstrate common knowledge. In the experiment, the pulse width was 100 ns. The repetition rate of the optical pulse was set to 40 kHz, which was 5 times the correct MPRR. As recording one trace for the whole FUT took about 125 µs, the sampling rate of the recording signal for a local position was 8 kHz. Thus, the frequency of the signal for controlling the PZT was set as 3.8 kHz. Figure 3a shows the measured incorrect ϕ-OTDR traces while filtering out the low-frequency components by using a high-pass filter (>100 Hz). No vibration zone can be observed at the PZT zone (around 12.44 km) in the incorrect signal. It should be noted that the strong incorrect signal located around the position of 12.39 km was not the vibration signal caused by the PZT, as the position was outside of the PZT zone. Figure 3b shows the FFT result of the signal located at the local position of 12,445 m. As can be seen, the frequency of the measured signal covered the whole frequency range, and the vibration frequency of 3.8 kHz cannot be observed.
By revising the ϕ-OTDR setup according to our proposed configuration, the FUT only consists of the SF, i.e., 2242 m. Thus, the LF-induced limitation on MPRR can be overcome causing the MPRR to depend only on the SF. As a result, the MPRR can be increased from 8 kHz to about 40 kHz. An experiment was implemented to validate the proposed approach. The pulse repetition rate was set as the same as that in the experiment of Figure 3a, i.e., 40 kHz. The frequency of the signal for controlling the PZT was set to 18 kHz. The experimental results are depicted in Figure 4a,b. As can be seen in Figure 4a, the vibration zone can be observed obviously. It should be noted that the location of the PZT zone on the SF in Figure 4a was the same as that in Figure 3a. The frequency spectrum of the signal located at 2195 m (corresponds to the location of 12445 m with the LF) within the PZT zone is depicted in Figure 4b, and as can be seen, the measured frequency was 18 kHz, which coincides with the controlling signal applied to the PZT. Some weaker-frequency components can be observed, which were caused by the system and the background vibrations. The correct measured frequency demonstrates the capability of our proposed ϕ-OTDR setup to overcome the LF-induced limitation on MPRR.

4. Experiments for BOTDA

4.1. Experimental Setup for BOTDA

Figure 5 illustrates the schematic diagram of the experimental setup for demonstrating the proposed approach of overcoming the LF-induced limitation on pulse repetition rate in BOTDA. The difference between the conventional setup and the proposed one is highlighted with a dashed rectangle, as shown in Figure 5. It should be noted that polarization-maintaining components were used to avoid the polarization-fading issue without using a polarization scrambler. As shown in Figure 5, the fibers in a red color and blue color represent polarization-maintaining fiber (PMF) and SMF, respectively.
In the experiment, a distributed feedback (DFB) laser operating at 1550.12 nm was used as the laser source. Its linewidth was less than 5 kHz and the output power was about 60 mW. The CW output of the laser was split into two branches by a 3 dB optical coupler (OC). In the upper branch, the light was modulated by electro-optic modulator 1 (EOM1) which was driven by a radio frequency (RF) source via double-sideband suppressed-carrier modulation. The modulation frequency was scanned from 10.75 GHZ to 11.148 GHz with a step of 2 MHz. A variable optical attenuator (VOA) was used to adjust the power of the probe light, and an optical isolator (OI) was used to prevent the pump pulse from injecting back into the laser source. In the lower branch, the light was modulated into a train of 10 ns pulses by another EOM (EOM2) which was driven by a pulse generator. The corresponding spatial resolution was 1 m. The pump pulses were amplified by an erbium-doped fiber amplifier (EDFA) and then entered into the FUT via a CIR. A tunable optical filter in the receiver path was used to select the probe light. A PIN photodetector (Thorlabs FPD610-FC-NIR) and DAQ card (Acqiris SA240P) were utilized to detect and record the signal. The data sampling speed was 1 GS/s, thus the sampling resolution was 10 cm. In the conventional setup, the FUT consists of lead fiber 1 (LF1), SF, and lead fiber 2 (LF2). The lengths of LF1, SF, and LF2 were about 205 m, 105 m, and 205 m, respectively. The RTT of the pulse is determined by the total length of the FUT, i.e., 515 m. According to Equation (1), the RTT of the conventional setup is about 5.04 µs. In other words, the maximum repetition rate of the pump pulse is about 198 kHz. If the pump pulse repetition rate is greater than 198.4 kHz (the pulse period is less than 5.04 µs), the BOTDA signal will be incorrect and the temperature or strain distribution along the sensing fiber will not be able to be extracted.
In contrast, after simply revising the setup by using our proposed approach, as shown in the dashed rectangle with the yellow color in Figure 5, the RTT only depends on the SF. In our proposed setup, LF1 and LF2 were moved to the front of OI and CIR port 1, respectively. Lead fiber 3 (LF3) was added for transferring the signal from the site back to the interrogator. As the SF was 105 m, the RTT of the proposed setup was about 1.03 µs, unveiling a maximum pulse repetition rate of about 980 kHz, which was almost 5 times the conventional setup.

4.2. Experimental Results for BOTDA

In order to demonstrate the proposed configuration, we measured the Brillouin gain spectrum (BGS) of the SF when the period and duration of the pump pulse were set as 1.2 µs and 10 ns, respectively. The static strain was applied to a 2 m long segment of the SF. The position of the strain zone ranged from about 16 m to 18 m on the SF. Then the strain distribution along the whole SF was measured. The Figure 6a shows the BGS averaged by 50 times along the whole SF. The brillouin frequency shift (BFS) of the SF was around 10.85 GHz without applied strain at room temperature (23 °C). The distributed BFS (strain distribution) was extracted by using the conventional Lorentzian curve-fitting (LCF) method, as shown in Figure 6b. The measured width and the location of the strain zone were about 2 m and ranged from 16 m to 18 m, respectively, which coincides with the setup. However, as mentioned above, when using the conventional setup, as the total length of FUT is about 515 m, if the pump pulse period is 1.2 µs, the results will be incorrect.

5. Discussion

Normally, in real-world applications, the DFS interrogators are installed in a server room or controlling room. In some scenarios, the interrogators may be far away from the sensing site. The long fiber between the interrogator and the sensing site only acts as an LF, which induces an extra limitation on the MPRR. It should be noted that, after overcoming the LF-induced extra limitation by using our approach, the measurement distance of DFSs will not be reduced, as the propagation distance of the light is the same as when using the conventional method. When the DFS interrogators are installed far away from the sensing site, in conventional DFS systems, the FUT consists of an LF and a sensing SF. By using our approach, FUT = SF, the LF-induced extra limitation on MPRR can be overcome. In other words, the MPRR only depends on the SF. As the MPRR is inversely proportional to the length of FUT, under the condition that the SNR is good enough, for a certain MPRR, the measurement range (i.e., SF) can be increased. Especially for Brillouin gain-based BOTDA, by using the conventional setup, due to the energy transfer between the probe and pump light in the long LF, the power of the pump may decrease significantly before it arrives at the SF. By using our approach, the energy transfer only occurs in the SF, thus, it is possible to have a larger sensing length.
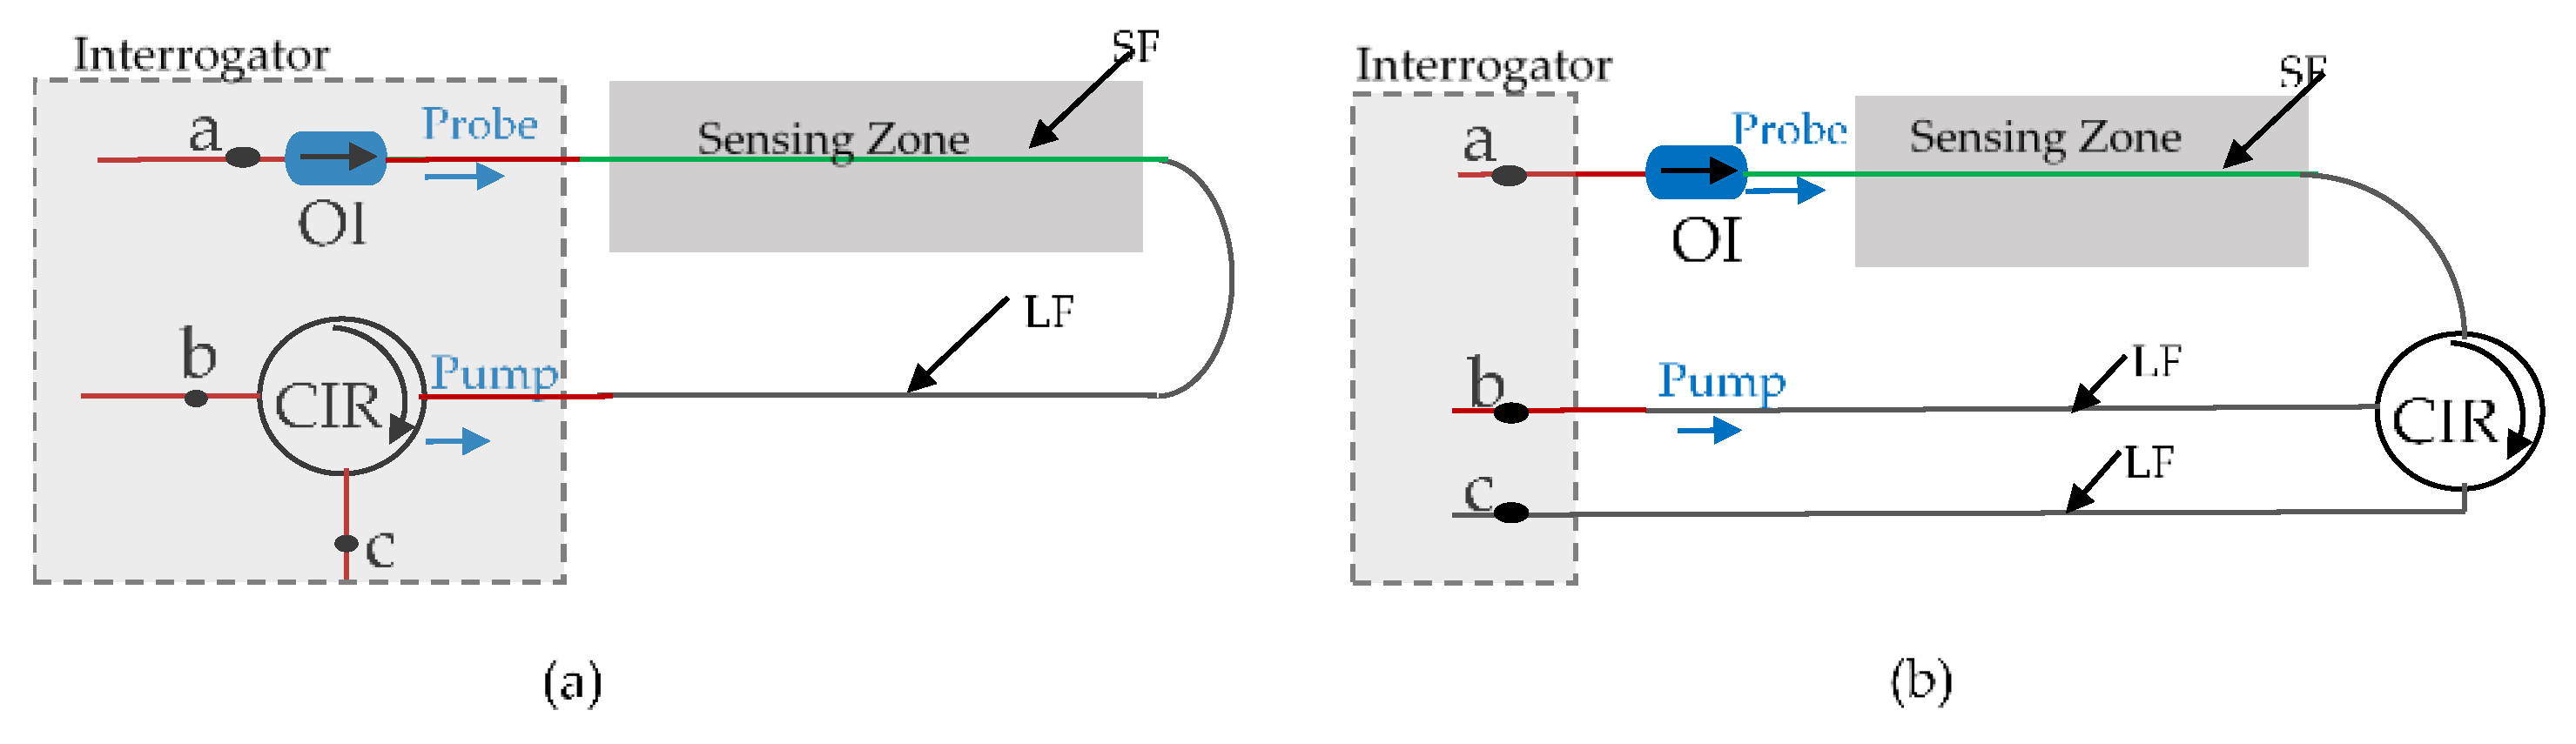
In fact, our proposed approach can also be used for the linear sensing applications of two-end-access BOTDA, even if the BOTDA interrogator is installed close to the sensing zone. For example, in the applications of monitoring pipelines, by using the conventional system, given that the probe light has to propagate up to the end of the sensing zone and back, the sensing range is limited to half of the BOTDA interrogator’s maximum measurement length [23], as shown in Figure 7a. After revising the system by using our approach, as shown in Figure 7b, as there is no energy transfer between the pump and probe light in the LF, when the pump enters the SF, its power will be larger. As a result, the sensing range can be increased to the maximum measurement length of the BOTDA interrogator.
Our proposed approach is a simple and effective way to solve the practical problem of the LF inducing an extra limitation on the MPRR in DFSs. In addition, it does not introduce any additional complexity to the systems. Only one more LF is required, while in real-world applications, normally, there are a few fibers in the sensing optical fiber cable. One of the fibers can be used as the added LF. Therefore, the proposed approach will not increase the cost either.

6. Conclusions

We proposed and demonstrated a very simple approach by slightly revising the system configurations to overcome the LF-induced limitation on the MPRR in both single-end-access and two-end-access DFSs. In our proposed approach, the interrogator is divided into two parts, i.e., an in-house part and an on-site part, it just needs to move the passive components, circulator and/or isolator, to the on-site part. The proposed approach was demonstrated by using ɸ-OTDR and BOTDA. By revising the DFS system configurations according to our proposed methods, the MPRR can be increased by N times and 2N + 1 times, for single-end-access DFSs and two-end-access DFSs, respectively, where N = L l f / L s f . Our proposed approach is also suitable for P-OTDR, ROTDR, and BOTDR. Similar revision schemes can be expected for other DFSs, such as optical frequency domain reflectometry (OFDR). The proposed approach can be widely used in many real-world DFS applications such as monitoring underground mines or the deformation during coal mining, monitoring the structural health of wind turbines, and monitoring the dynamic strain response of scale ships for developing digital twins. By utilizing the proposed approach, the maximum detectable frequency can be increased significantly for dynamic monitoring, or more average times for the signal in a certain time can be realized, which will benefit the SNR.

Author Contributions

Conceptualization, H.D. and H.Z.; Investigation, H.Z.; writing—original draft preparation, H.Z.; writing—review and editing, H.D., H.Z., D.J.J.H. and J.H.; project administration, H.D., D.J.J.H. and J.H; funding acquisition, H.D., D.J.J.H. and J.H. All authors have read and agreed to the published version of the manuscript.

Funding

This work presented in this paper is a result of the research effort through Enhancing Offshore System Productivity, Integrity and Survivability in Extreme Environments (ENSURE) programme financed by A*STAR under its RIE 2020 Industry Alignment Fund (Grant No: A19F1a0104).

Institutional Review Board Statement

Not applicable.

Informed Consent Statement

Not applicable.

Data Availability Statement

Not applicable.

Conflicts of Interest

The authors declare no conflict of interest.

References

  1. Lu, P.; Lalam, N.; Badar, M.; Liu, B.; Chorpening, B.T.; Buric, M.P.; Ohodnicki, P.R. Distributed optical fiber sensing: Review and perspective. Appl. Phys. Rev. 2019, 6, 041302. [Google Scholar] [CrossRef]
  2. Fernández-Ruiz, M.R.; Costa, L.; Martins, H.F. Distributed acoustic sensing using chirped-pulse phase-sensitive OTDR technology. Sensors 2019, 19, 4368. [Google Scholar] [CrossRef] [PubMed] [Green Version]
  3. Rogers, A. Distributed optical-fibre sensing. Meas. Sci. Technol. 1999, 10, R75. [Google Scholar] [CrossRef]
  4. Rogers, A.J. Polarization-optical time domain reflectometry: A technique for the measurement of field distributions. Appl. Opt. 1981, 20, 1060–1074. [Google Scholar] [CrossRef] [PubMed]
  5. Wang, F.; Zhang, Y.; Wang, W.; Dou, R.; Lu, J.; Xu, W.; Zhang, X. Development of a multiperimeter sensing system based on POTDR. IEEE Photonics J. 2018, 10, 1–7. [Google Scholar] [CrossRef]
  6. Naruse, H.; Uehara, H.; Deguchi, T.; Fujihashi, K.; Onishi, M.; Espinoza, R.; Guzman, C.; Pardo, C.; Ortega, C.; Pinto, M. Application of a distributed fibre optic strain sensing system to monitoring changes in the state of an underground mine. Meas. Sci. Technol. 2007, 18, 3202. [Google Scholar] [CrossRef]
  7. Cheng, G.; Shi, B.; Zhu, H.H.; Zhang, C.C.; Wu, J.H. A field study on distributed fiber optic deformation monitoring of overlying strata during coal mining. J. Civ. Struct. Health Monit. 2015, 5, 553–562. [Google Scholar] [CrossRef]
  8. Peled, Y.; Motil, A.; Tur, M. Fast Brillouin optical time domain analysis for dynamic sensing. Opt. Express 2012, 20, 8584–8591. [Google Scholar] [CrossRef] [PubMed]
  9. Dong, Y.; Ba, D.; Jiang, T.; Zhou, D.; Zhang, H.; Zhu, C.; Lu, Z.; Li, H.; Chen, L.; Bao, X. High-spatial-resolution fast BOTDA for dynamic strain measurement based on differential double-pulse and second-order sideband of modulation. IEEE Photonics J. 2013, 5, 2600407. [Google Scholar] [CrossRef]
  10. Sovran, I.; Motil, A.; Tur, M. Frequency-scanning BOTDA with ultimately fast acquisition speed. IEEE Photonics Technol. Lett. 2015, 27, 1426–1429. [Google Scholar] [CrossRef]
  11. Ba, D.; Wang, B.; Zhou, D.; Yin, M.; Dong, Y.; Li, H.; Lu, Z.; Fan, Z. Distributed measurement of dynamic strain based on multi-slope assisted fast BOTDA. Opt. Express 2016, 24, 9781–9793. [Google Scholar] [CrossRef] [PubMed] [Green Version]
  12. Merlo, S.; Malcovati, P.; Norgia, M.; Pesatori, A.; Svelto, C.; Pniov, A.; Zhirnov, A.; Nesterov, E.; Karassik, V. Runways ground monitoring system by phase-sensitive optical-fiber OTDR. In Proceedings of the 2017 IEEE International Workshop on Metrology for AeroSpace (MetroAeroSpace), Padua, Italy, 21–23 June 2017. [Google Scholar]
  13. Coscetta, A.; Minardo, A.; Olivares, L.; Mirabile, M.; Longo, M.; Damiano, M.; Zeni, L. Wind turbine blade monitoring with Brillouin-based fiber-optic sensors. J. Sens. 2017, 2017, 9175342. [Google Scholar] [CrossRef]
  14. Hubbard, P.G.; Xu, J.; Zhang, S.; Dejong, M.; Luo, L.; Soga, K.; Papa, C.; Zulberti, C.; Malara, D.; Fugazzotto, F.; et al. Dynamic structural health monitoring of a model wind turbine tower using distributed acoustic sensing (DAS). J. Civ. Struct. Health Monit. 2021, 11, 833–849. [Google Scholar] [CrossRef]
  15. Liu, X.; Liu, H.; Serratella, C. Application of Structural Health Monitoring for Structural Digital Twin. In Proceedings of the Offshore Technology Conference Asia, Kuala Lumpur, Malaysia, 2–6 November 2020; OnePetro: Richardson, TX, USA, 2020. [Google Scholar]
  16. Fonseca, Í.A.; Gaspar, H.M.; de Mello, P.C.; Sasaki, H.A.U. A Standards-Based Digital Twin of an Experiment with a Scale Model Ship. Comput. Aided Des. 2022, 145, 103191. [Google Scholar] [CrossRef]
  17. Chen, Y.; Zhang, S.; Chen, W.K.; Magee, A. Design and Fabrication of a Fully Elastic Ship Model. In Proceedings of the ASME 2020 39th International Conference on Ocean, Offshore and Arctic Engineering, Virtual Online, 3–7 August 2020; American Society of Mechanical Engineers: New York, NY, USA, 2020; Volume 84386. [Google Scholar]
  18. Masoudi, A.; Newson, T.P. Contributed Review: Distributed optical fibre dynamic strain sensing. Rev. Sci. Instrum. 2016, 87, 011501. [Google Scholar] [CrossRef] [PubMed] [Green Version]
  19. Coscetta, A.; Minardo, A.; Zeni, L. Distributed dynamic strain sensing based on brillouin scattering in optical fibers. Sensors 2020, 20, 5629. [Google Scholar] [CrossRef] [PubMed]
  20. Muanenda, Y. Recent advances in distributed acoustic sensing based on phase-sensitive optical time domain reflectometry. J. Sens. 2018, 2018, 3897873. [Google Scholar] [CrossRef]
  21. Galindez-Jamioy, C.A.; Lopez-Higuera, J.M. Brillouin distributed fiber sensors: An overview and applications. J. Sens. 2012, 2012, 204121. [Google Scholar] [CrossRef] [Green Version]
  22. Hu, D.J.J.; Humbert, G.; Dong, H.; Zhang, H.; Hao, J.; Sun, Q. Review of specialty fiber based Brillouin optical time domain analysis technology. Photonics 2021, 8, 421. [Google Scholar] [CrossRef]
  23. Angulo-Vinuesa, X.; Dominguez-Lopez, A.; Lopez-Gil, A.; Ania-Castañón, J.D.; Martin-Lopez, S.; Gonzalez-Herraez, M. Limits of BOTDA range extension techniques. IEEE Sens. J. 2015, 16, 3387–3395. [Google Scholar] [CrossRef]
Figure 1. Schematic diagram of experimental setup for monitoring the dynamic strain of the basin ship model.
Photonics 09 00965 g001
Figure 2. Schematic diagram of ϕ-OTDR system. The gray dashed rectangle and red dashed rectangle show the difference between the conventional ϕ-OTDR system and our proposed one. Points “a” and “b” represent the connection points. In the conventional setup, the CIR is inside of the interrogator, and FUT = LF + SF. In our proposed setup, CIR is moved to the sensing site from the interrogator, and FUT = SF. AOM: acousto-optic modulator, CIR: circulator, PD: photodetector, DAQ: data acquisition card. LF: lead fiber, SF: sensing fiber.
Photonics 09 00965 g002
Figure 3. Experimental results of using conventional ϕ-OTDR setup, the total length of the FUT was about 12.5 km. (a) Measured incorrect ϕ-OTDR traces while filtering out the low-frequency components when the pulse repetition rate was 40 kHz. (b) Frequency spectrum of the measured incorrect signal located at 12,445 m, which was within the PZT zone.
Photonics 09 00965 g003
Figure 4. Experimental results of using the proposed ϕ-OTDR setup. (a) Measured correct ϕ-OTDR traces corresponding to the 2.19 km SF while filtering out the low-frequency components when the pulse repetition rate was 40 kHz, the location of PZT zone on the SF was the same as that in Figure 3a. (b) Frequency spectrum of the measured signal located at 2195 m (the same location as Figure 3b, 2195 m + LF = 12,445 m) within the PZT zone.
Photonics 09 00965 g004
Figure 5. Schematic diagram of BOTDA setup. The gray dashed rectangle and red dashed rectangle show the difference between the conventional BOTDA system and our proposed one. Points “a”, “b” and “c” represent the connection points. In conventional setup, the OI and CIR are inside of the interrogator, and FUT = LF1 + SF + LF2. In our proposed setup, the OI and CIR are moved to the sensing site from the interrogator, and FUT = SF. OC: optical coupler; EOM: electro-optic modulator; VOA: variable optical attenuator; OI: optical isolator; LF1: lead fiber 1; LF2: lead fiber 2; LF3: lead fiber 3; SF: sensing fiber; CIR: circulator; EDFA: erbium-doped fiber amplifier PD: photodetector, DAQ: data acquisition card.
Photonics 09 00965 g005
Figure 6. Experimental results of using the proposed BOTDA setup. (a) Measured BGS distribution along the sensing fiber. (b) Extracted strain distribution along the sensing fiber.
Photonics 09 00965 g006
Figure 7. Comparison between the conventional and our proposed BOTDA systems when the interrogator is close to the sensing zone. Points “a”, “b” and “c” represent the connection points. (a) Conventional BOTDA system, in which the OI and CIR are integrated into the interrogator. (b) By using our proposed approach, the OI and CIR are installed on-site. OI: optical isolator; CIR: circulator.
Photonics 09 00965 g007
Publisher’s Note: MDPI stays neutral with regard to jurisdictional claims in published maps and institutional affiliations.

