Capturing the Motion of Laser Pulse in Photoresist Mixture with Compressed Ultrafast Photography

Abstract
:1. Introduction
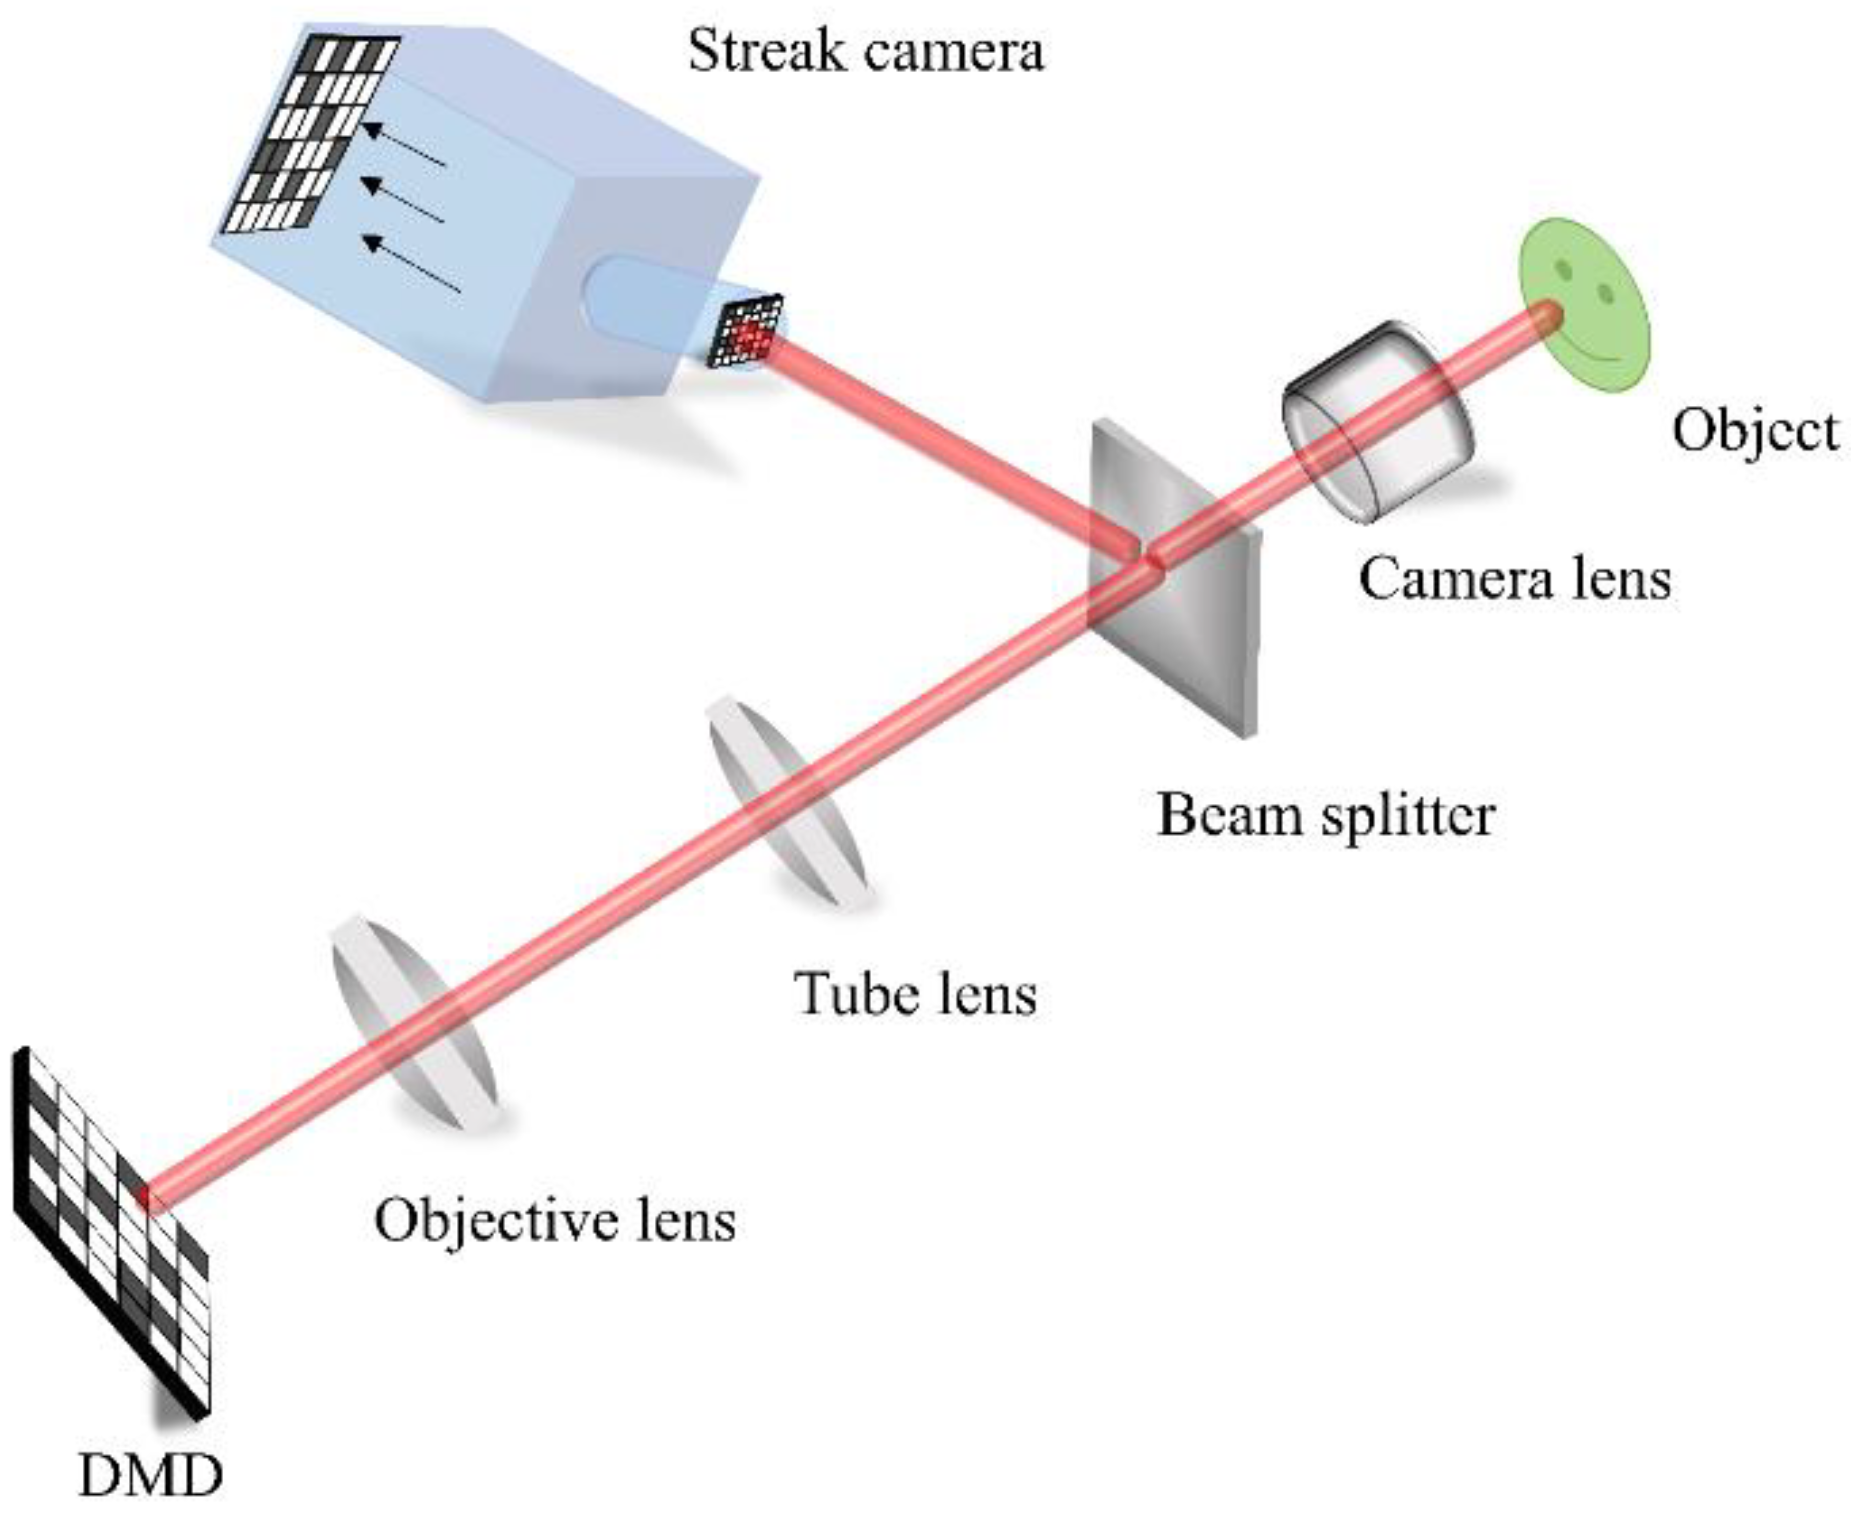
2. Principles
3. Experiments and Results Analysis
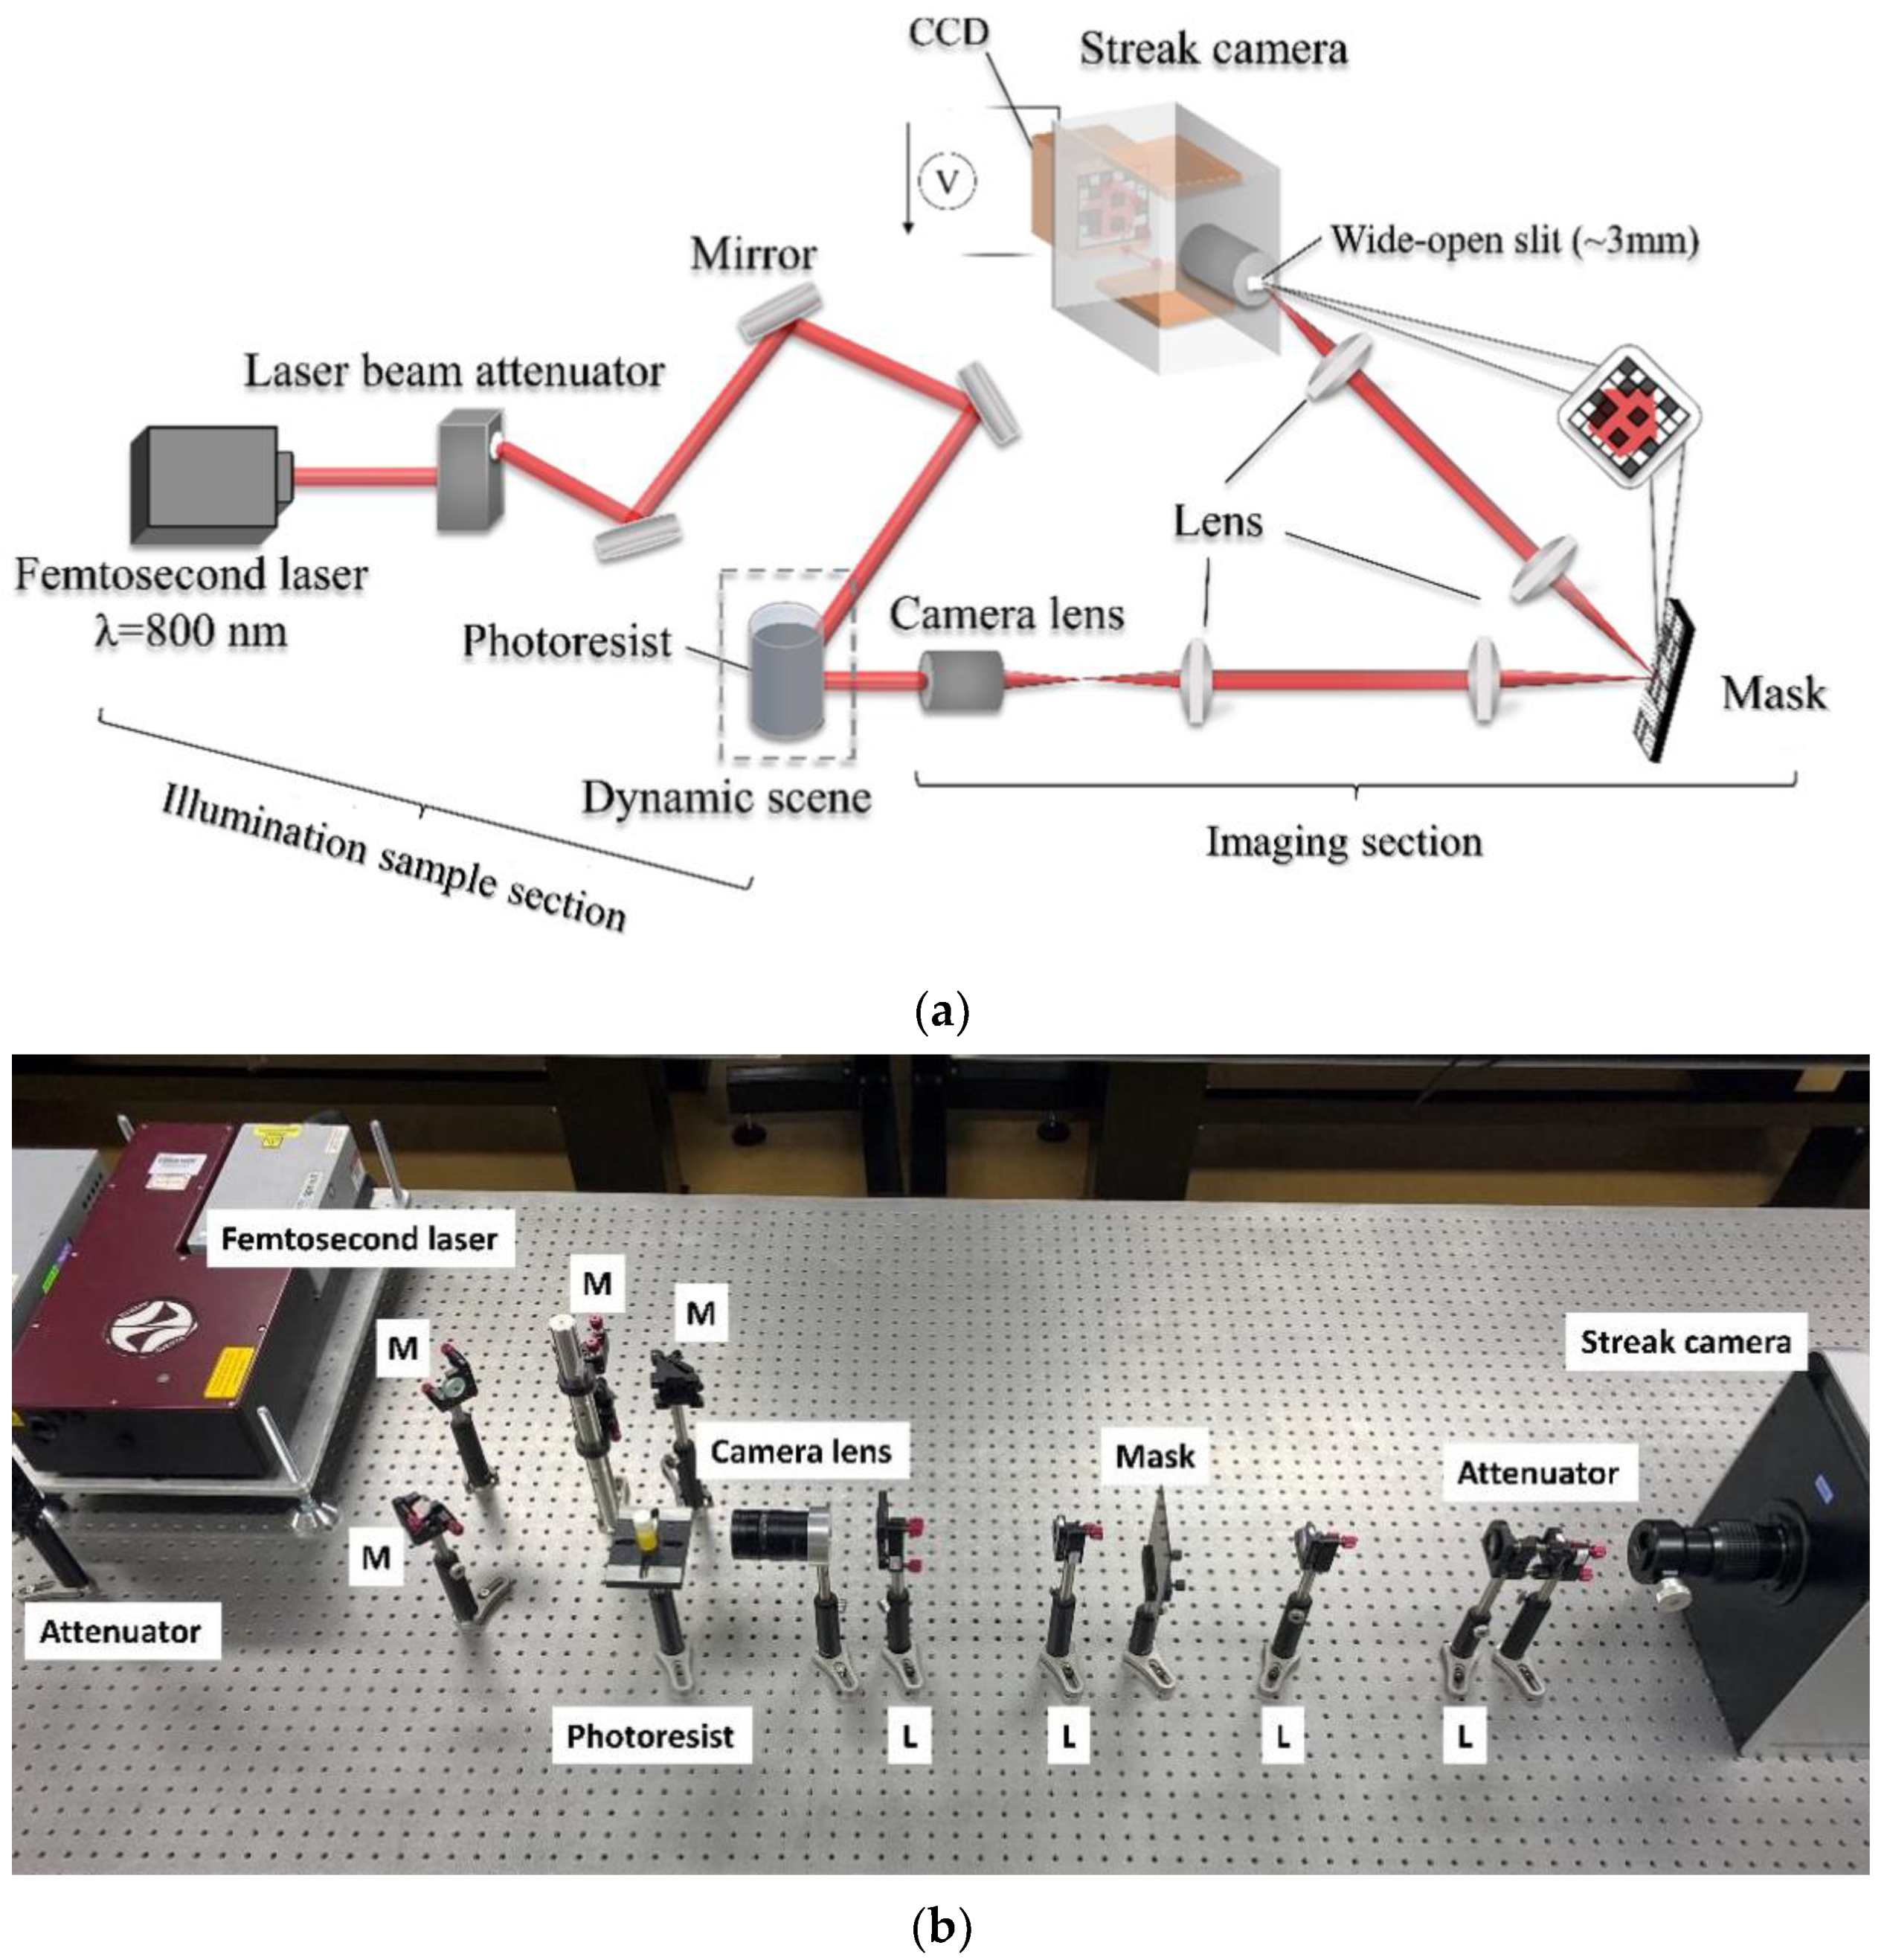
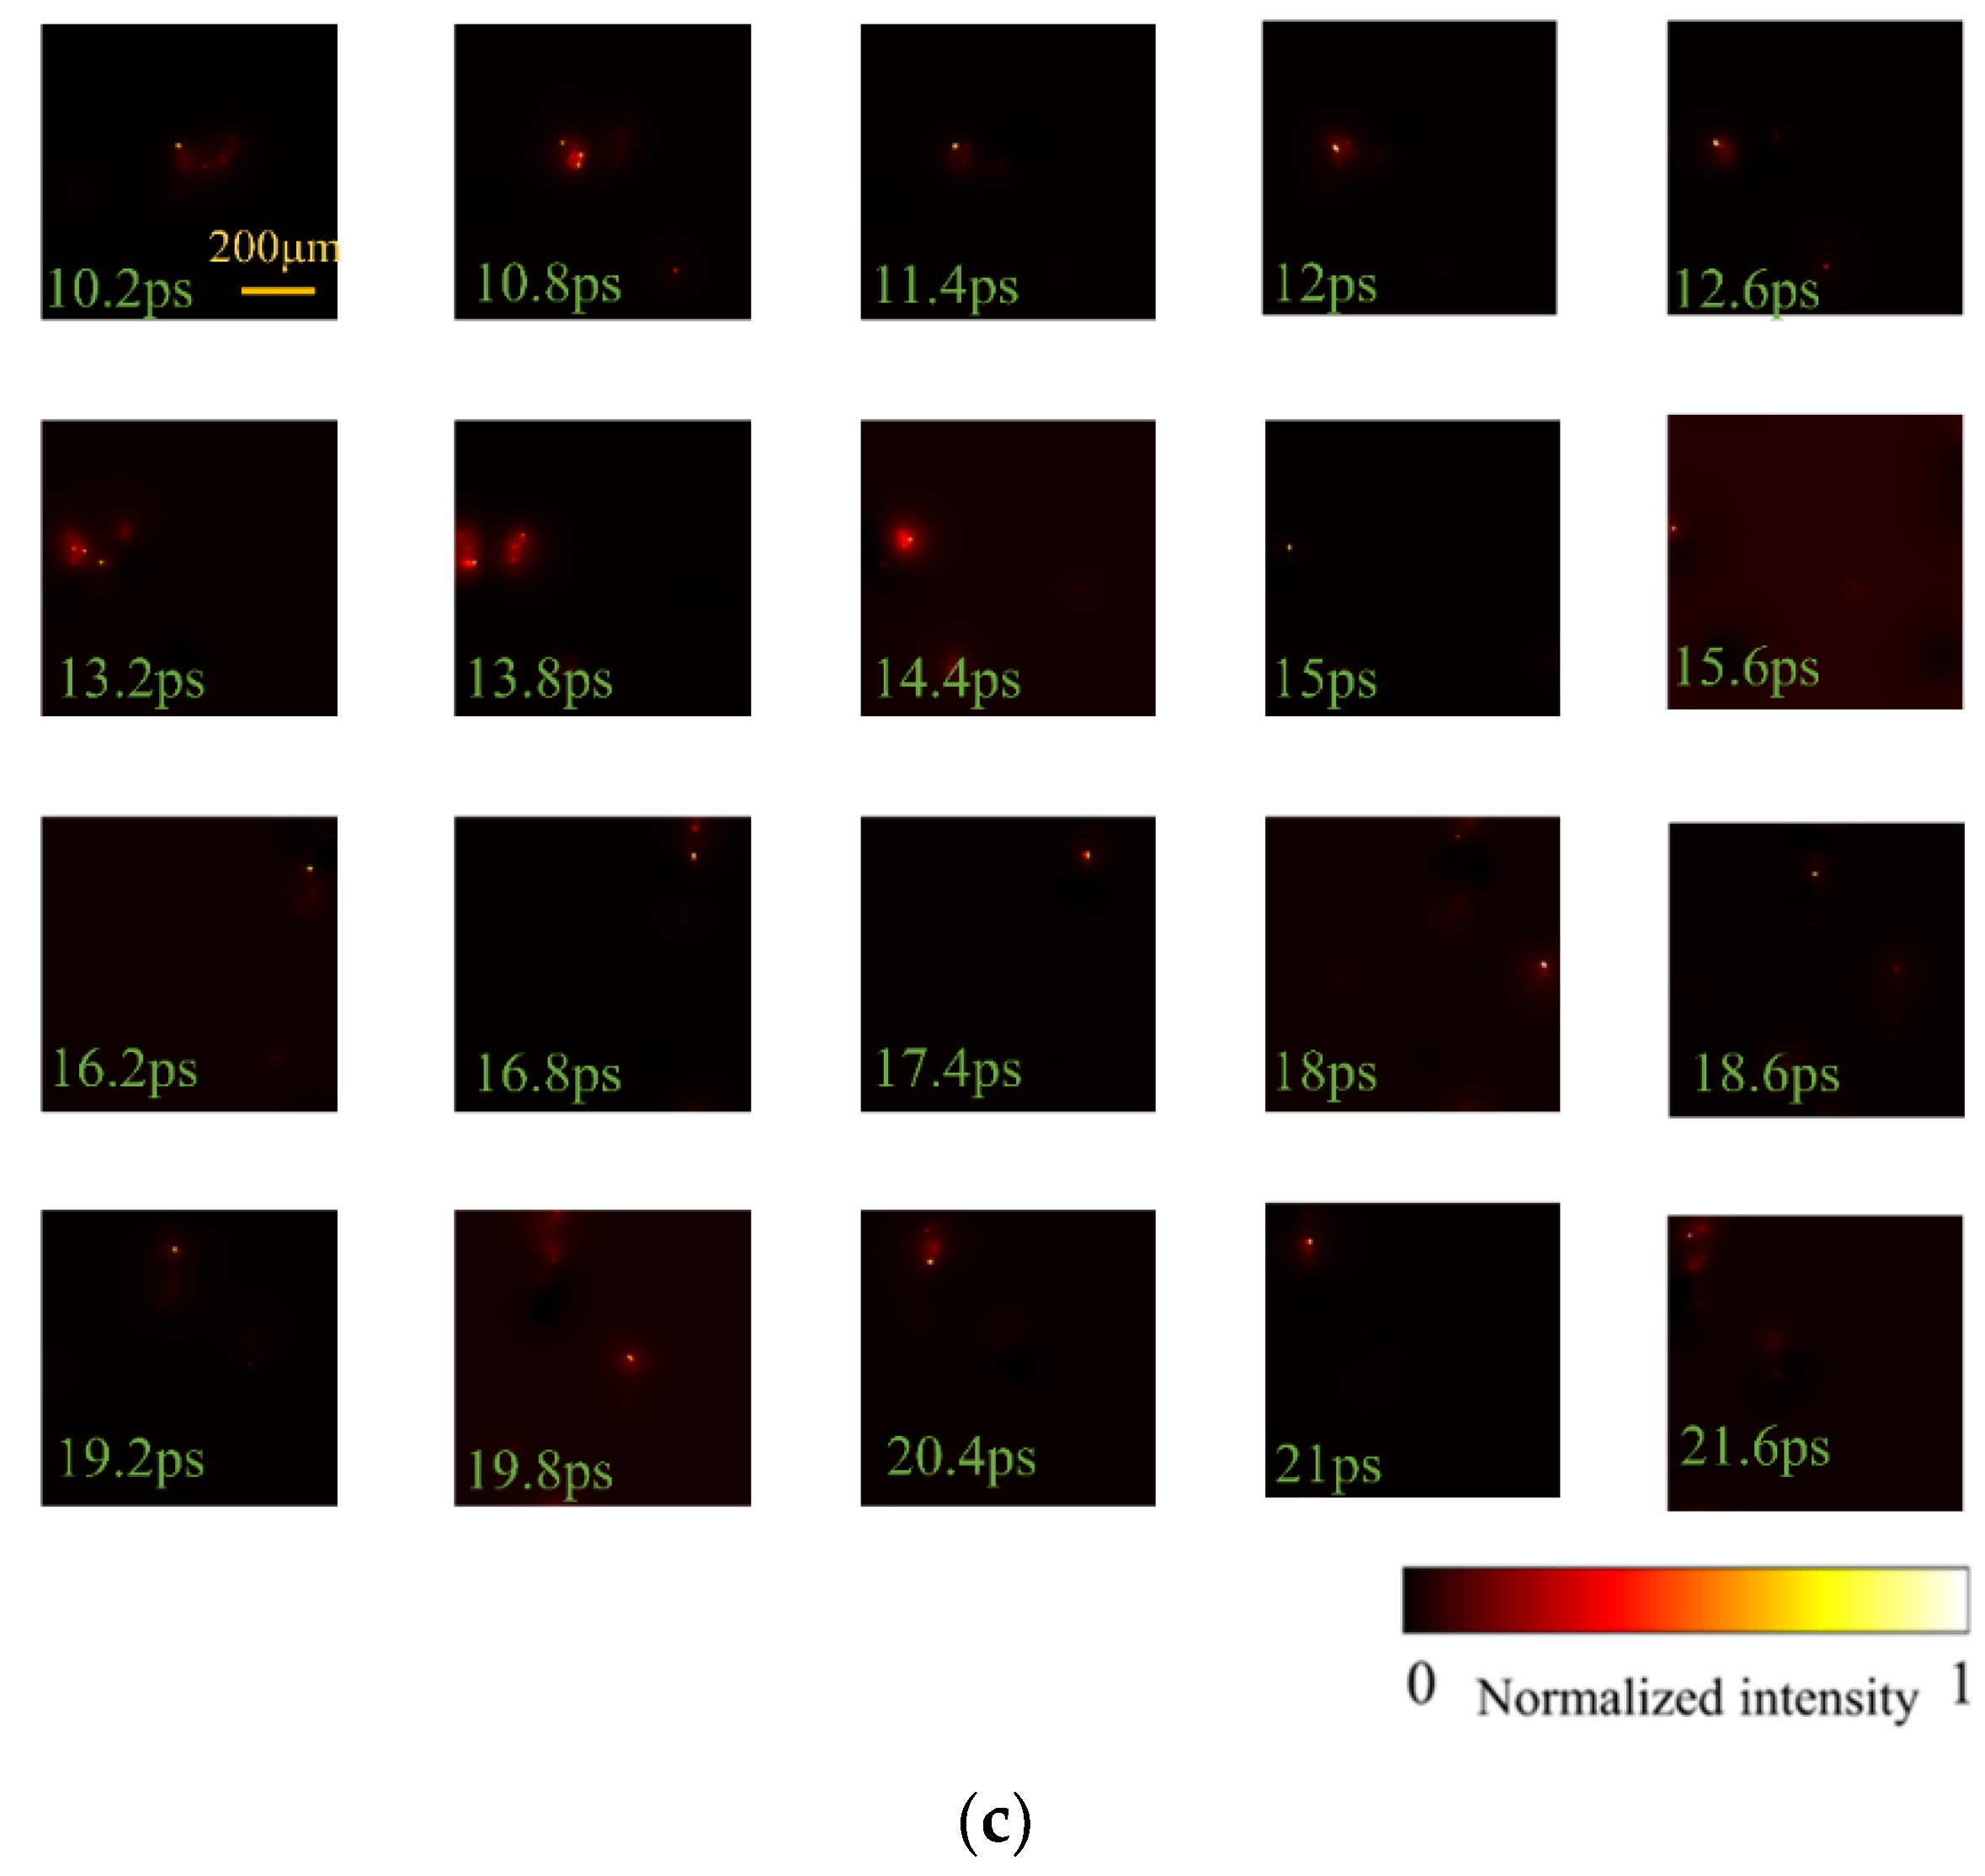
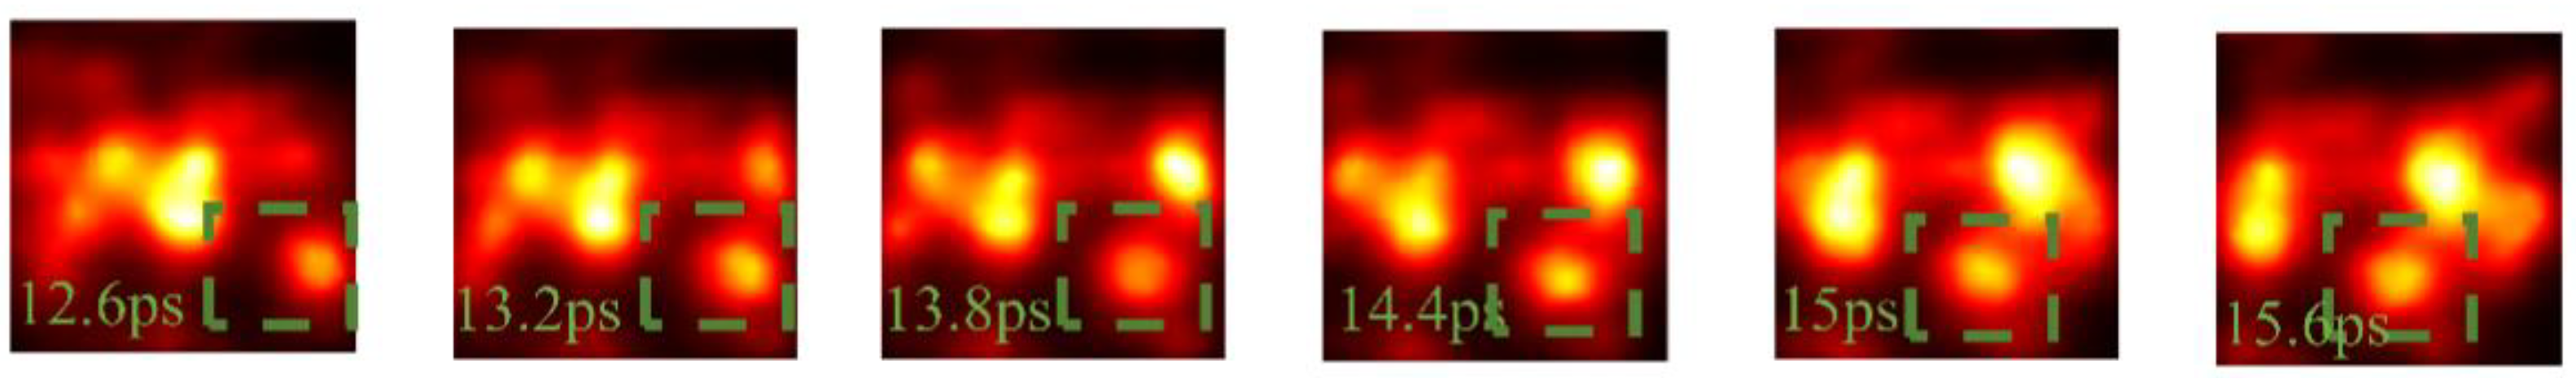
3.1. Experimental Setup and Results
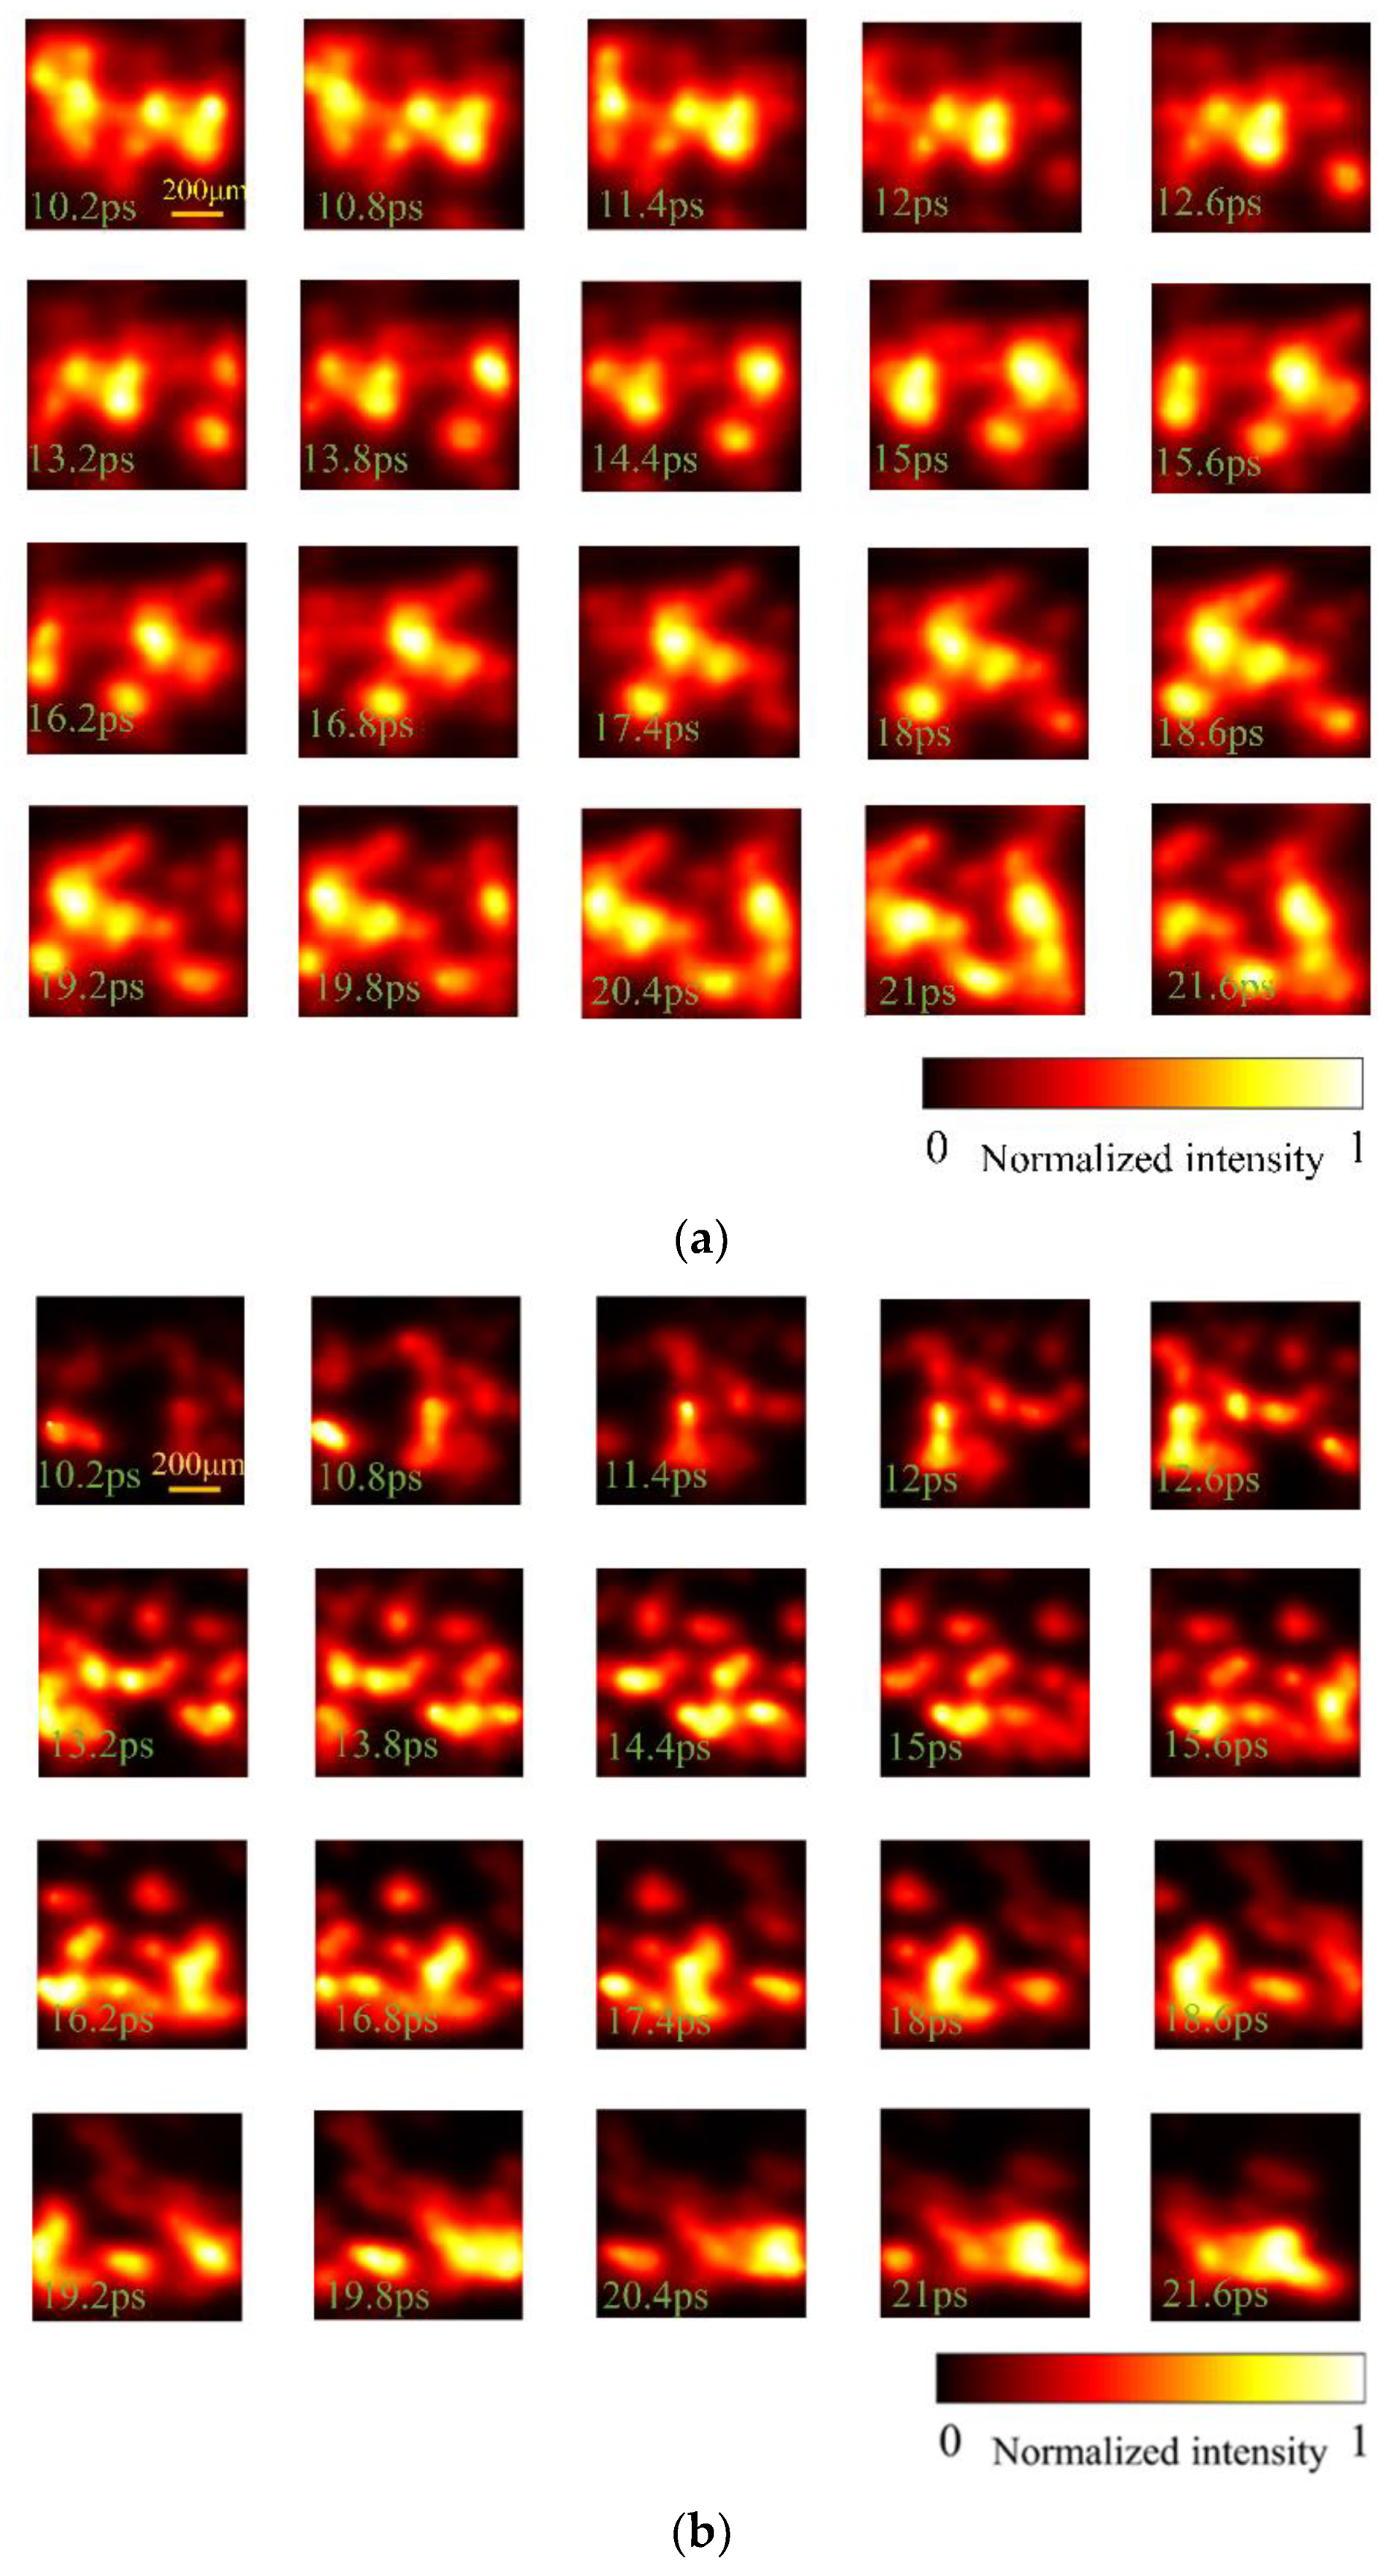
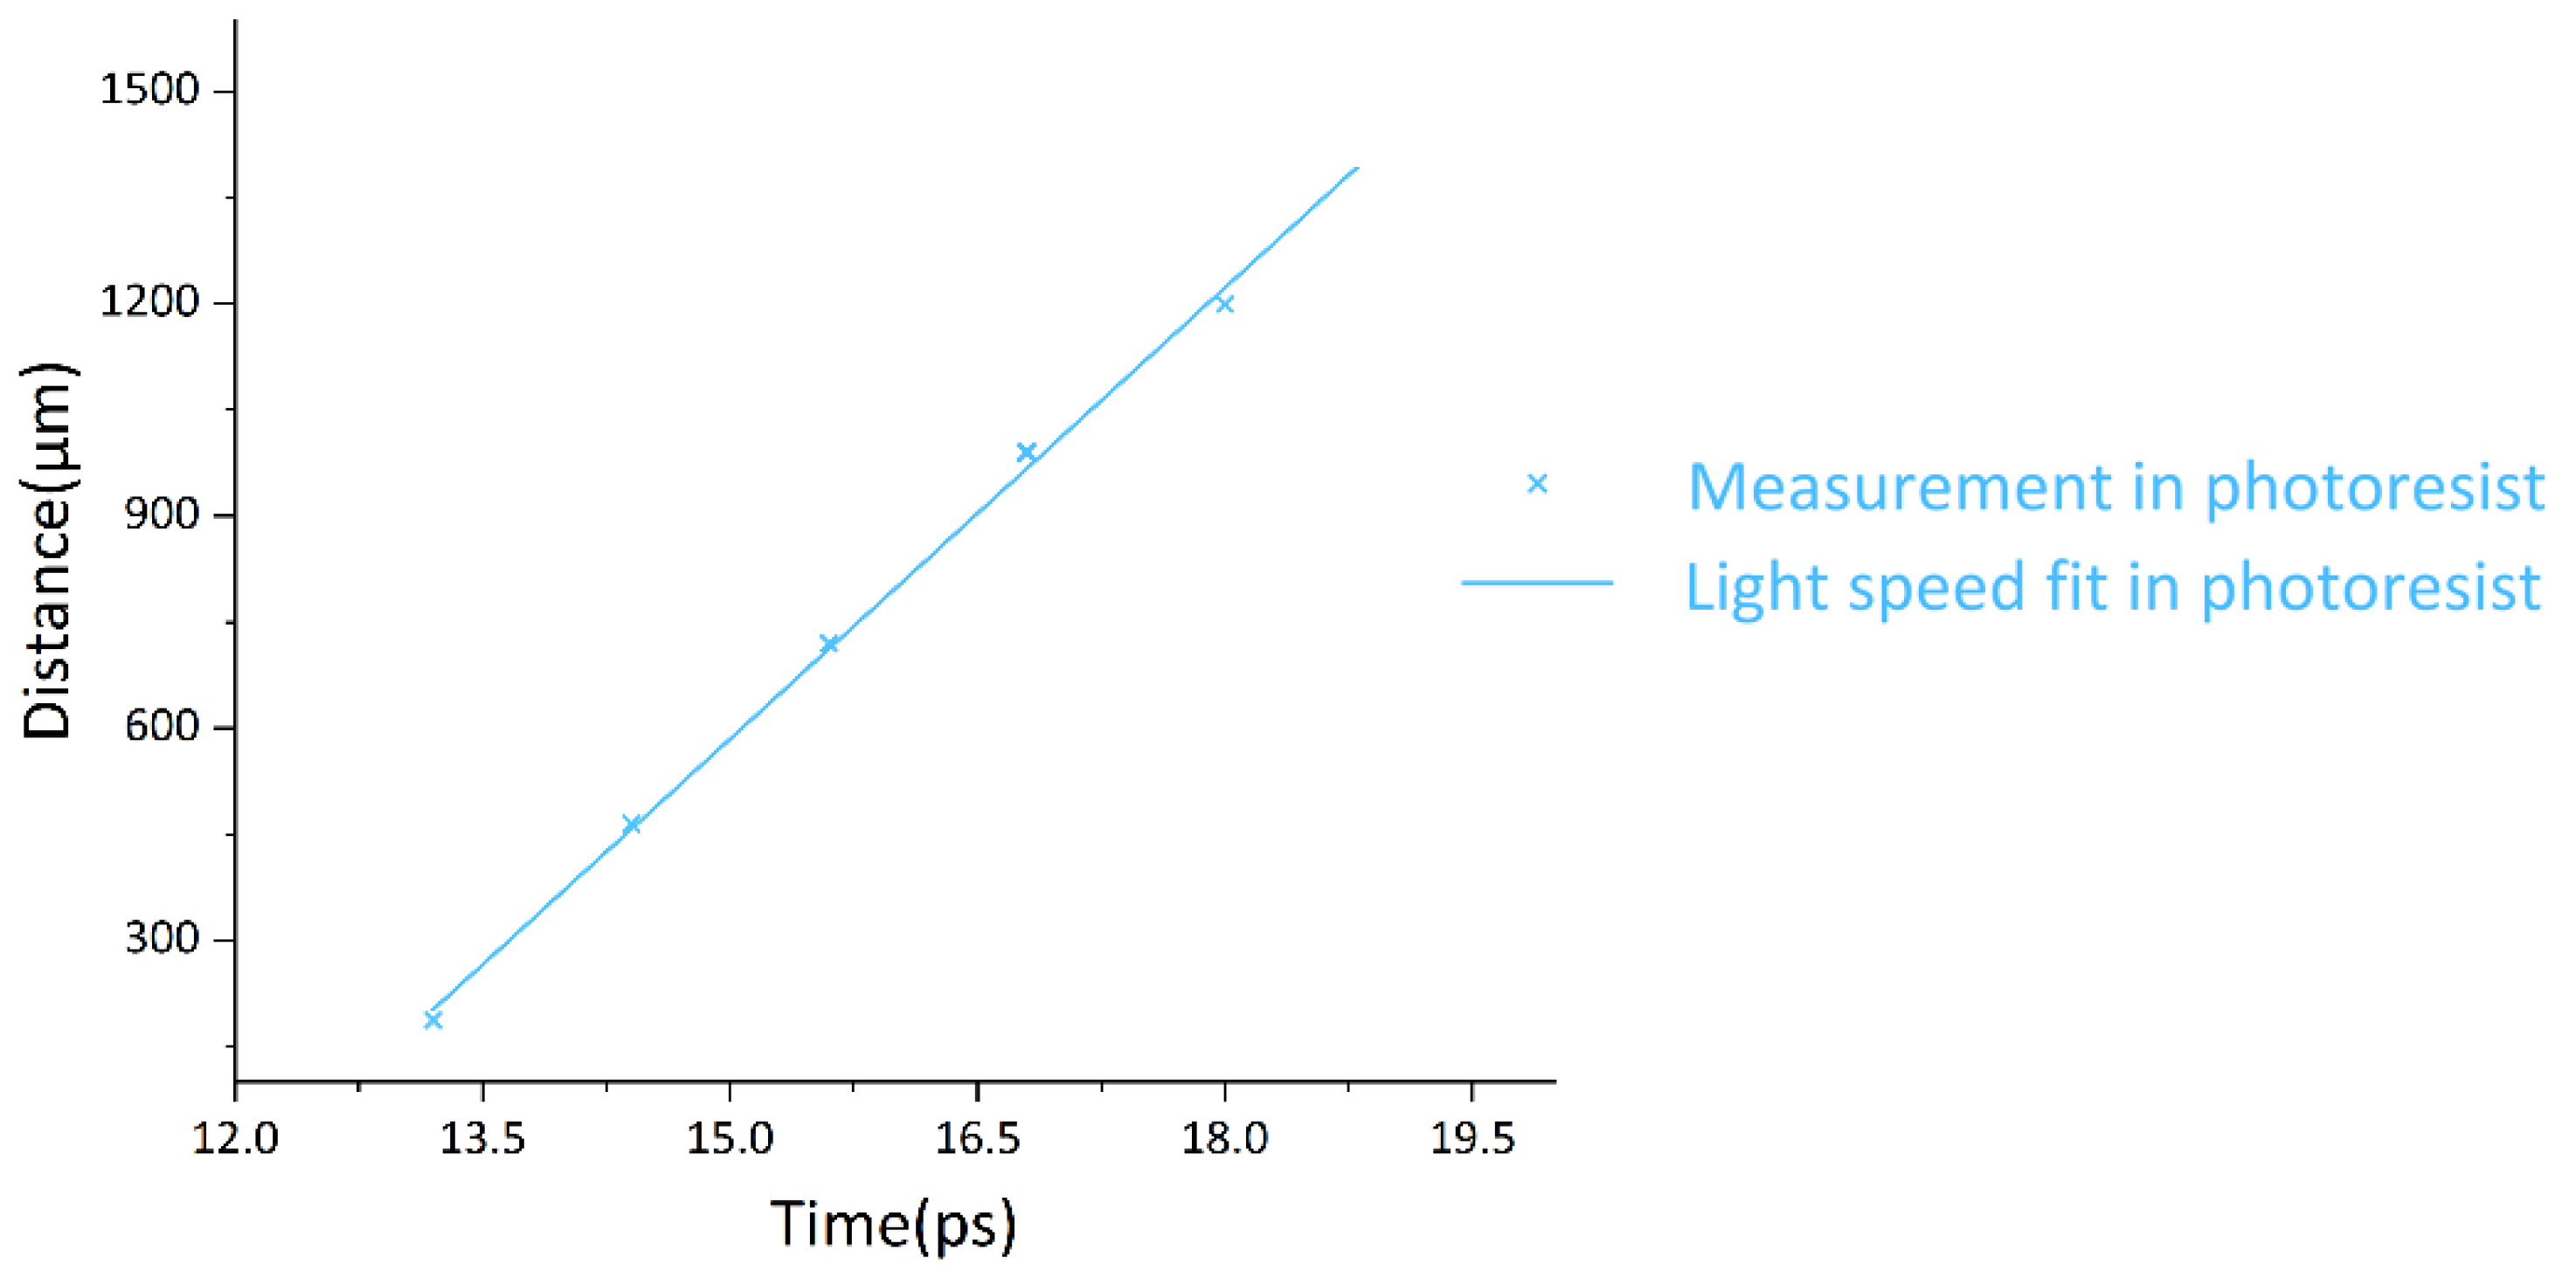
3.2. Analysis
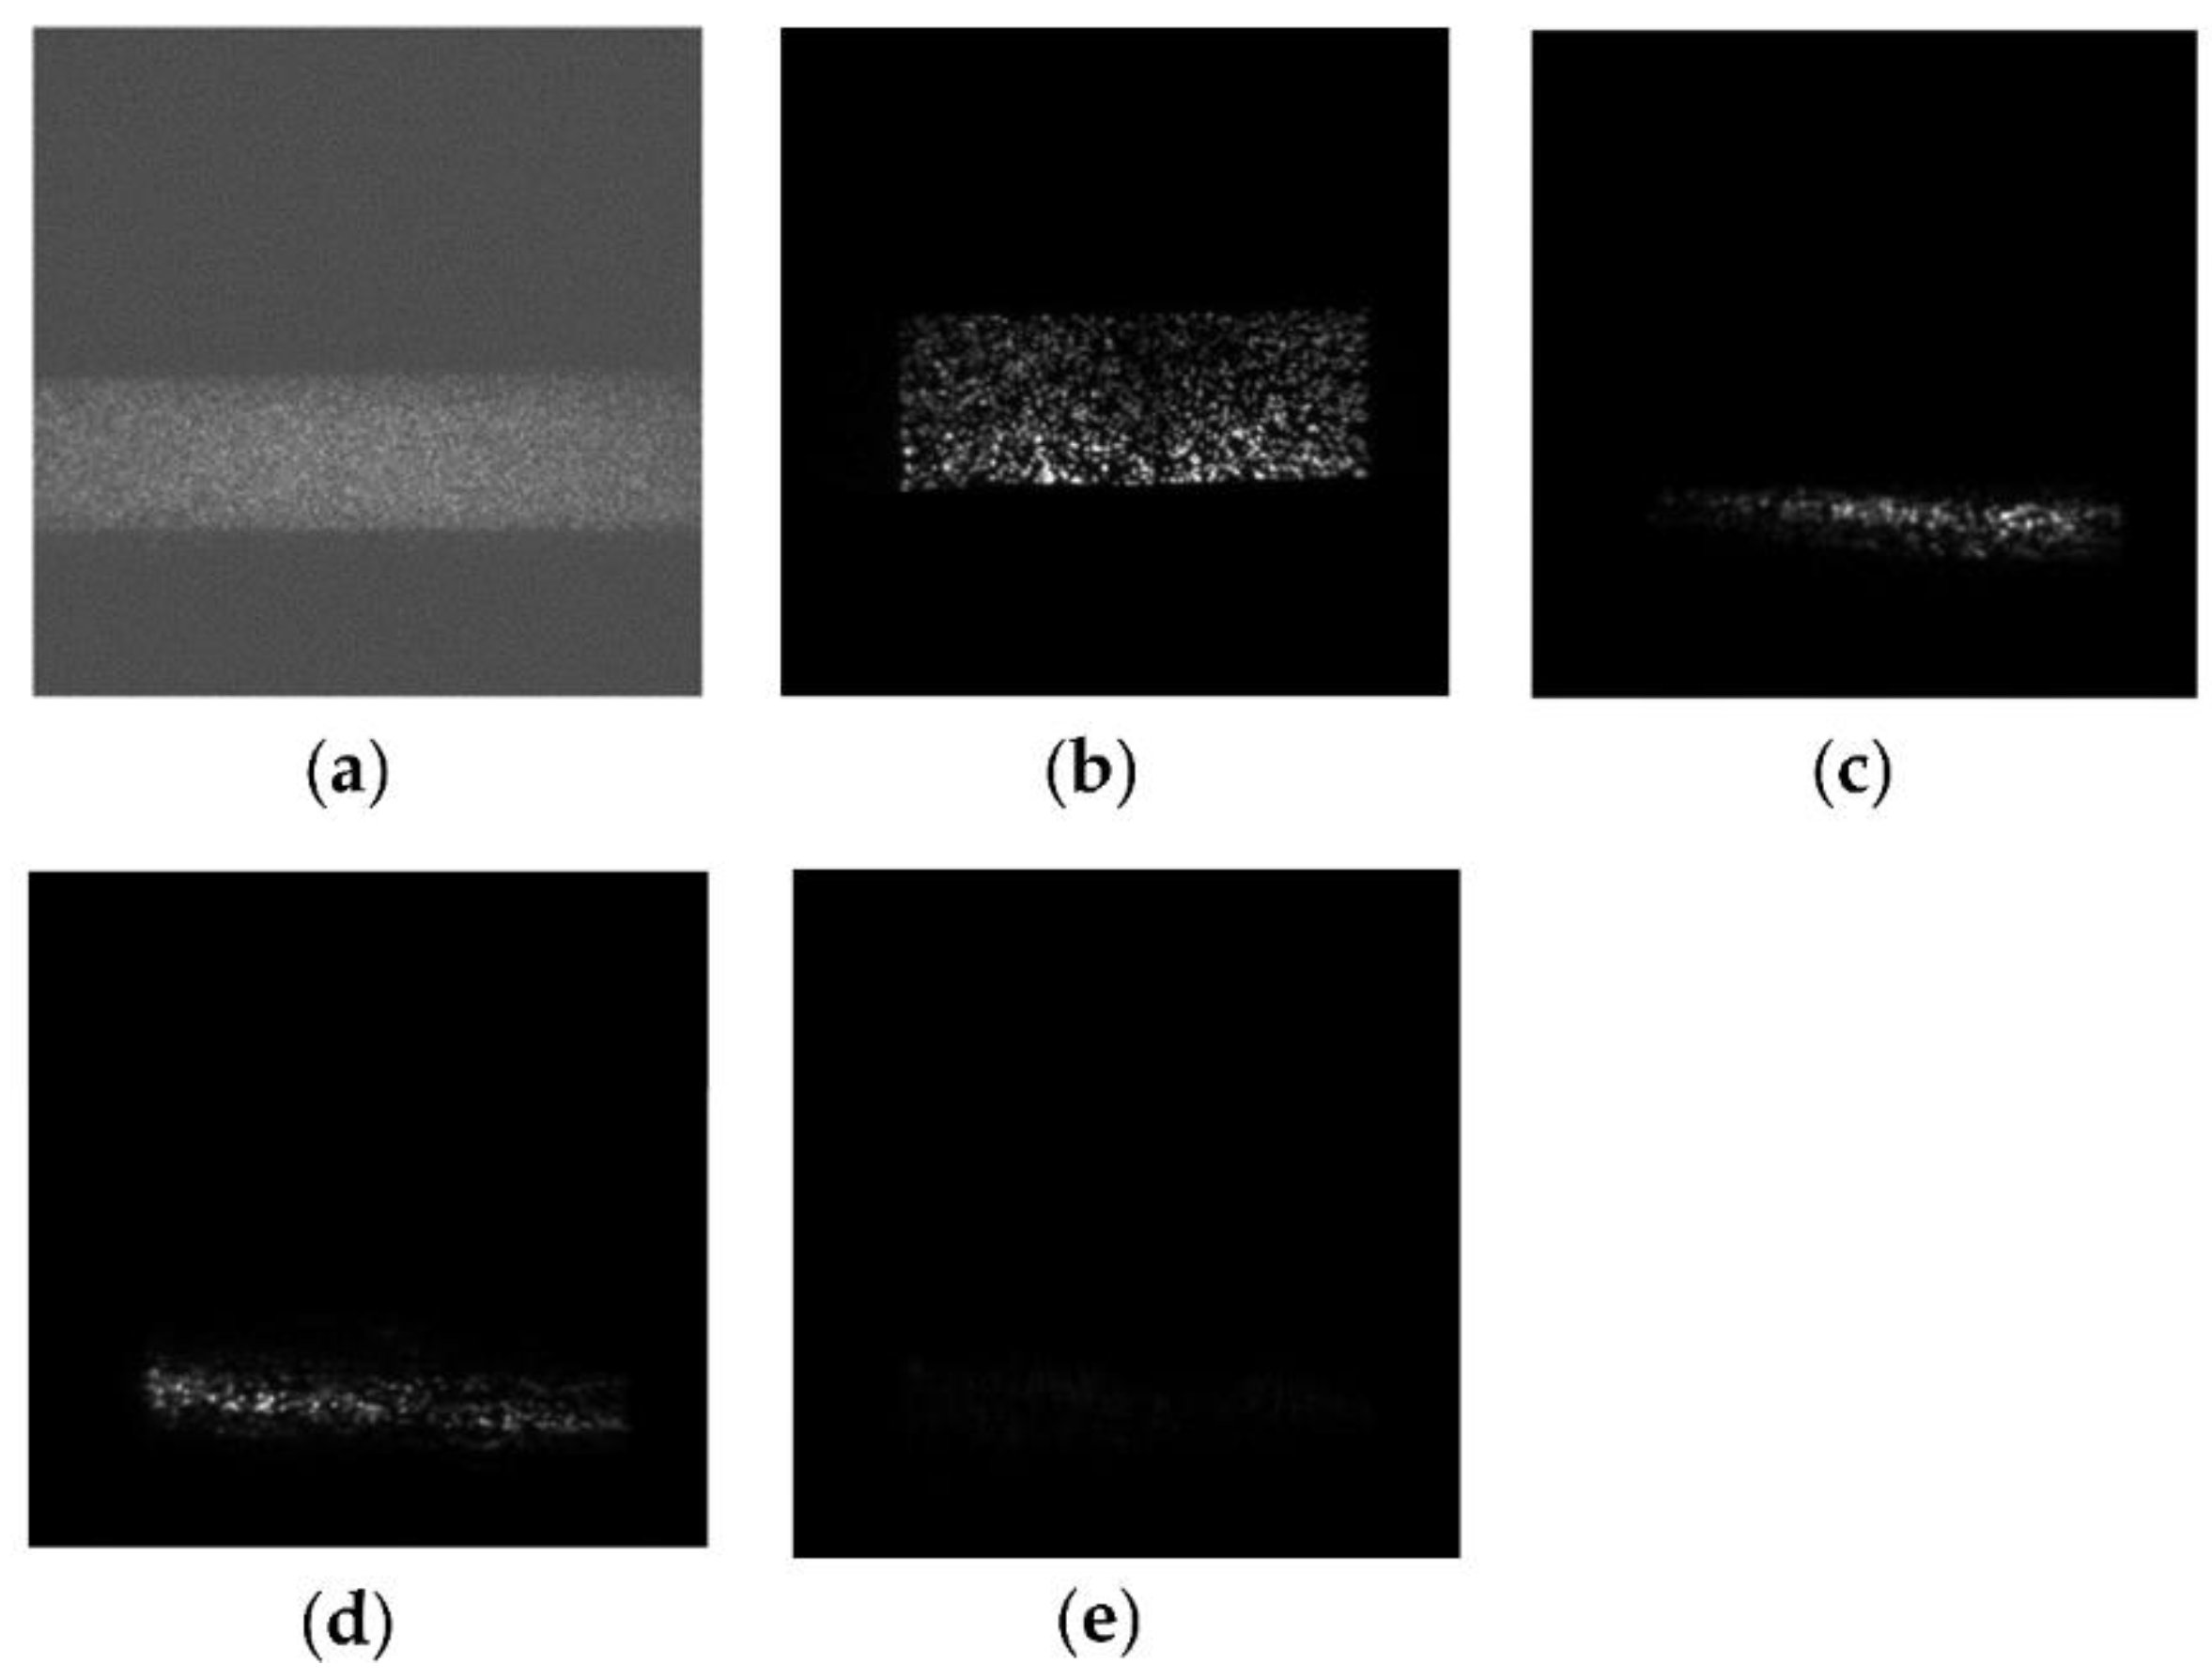
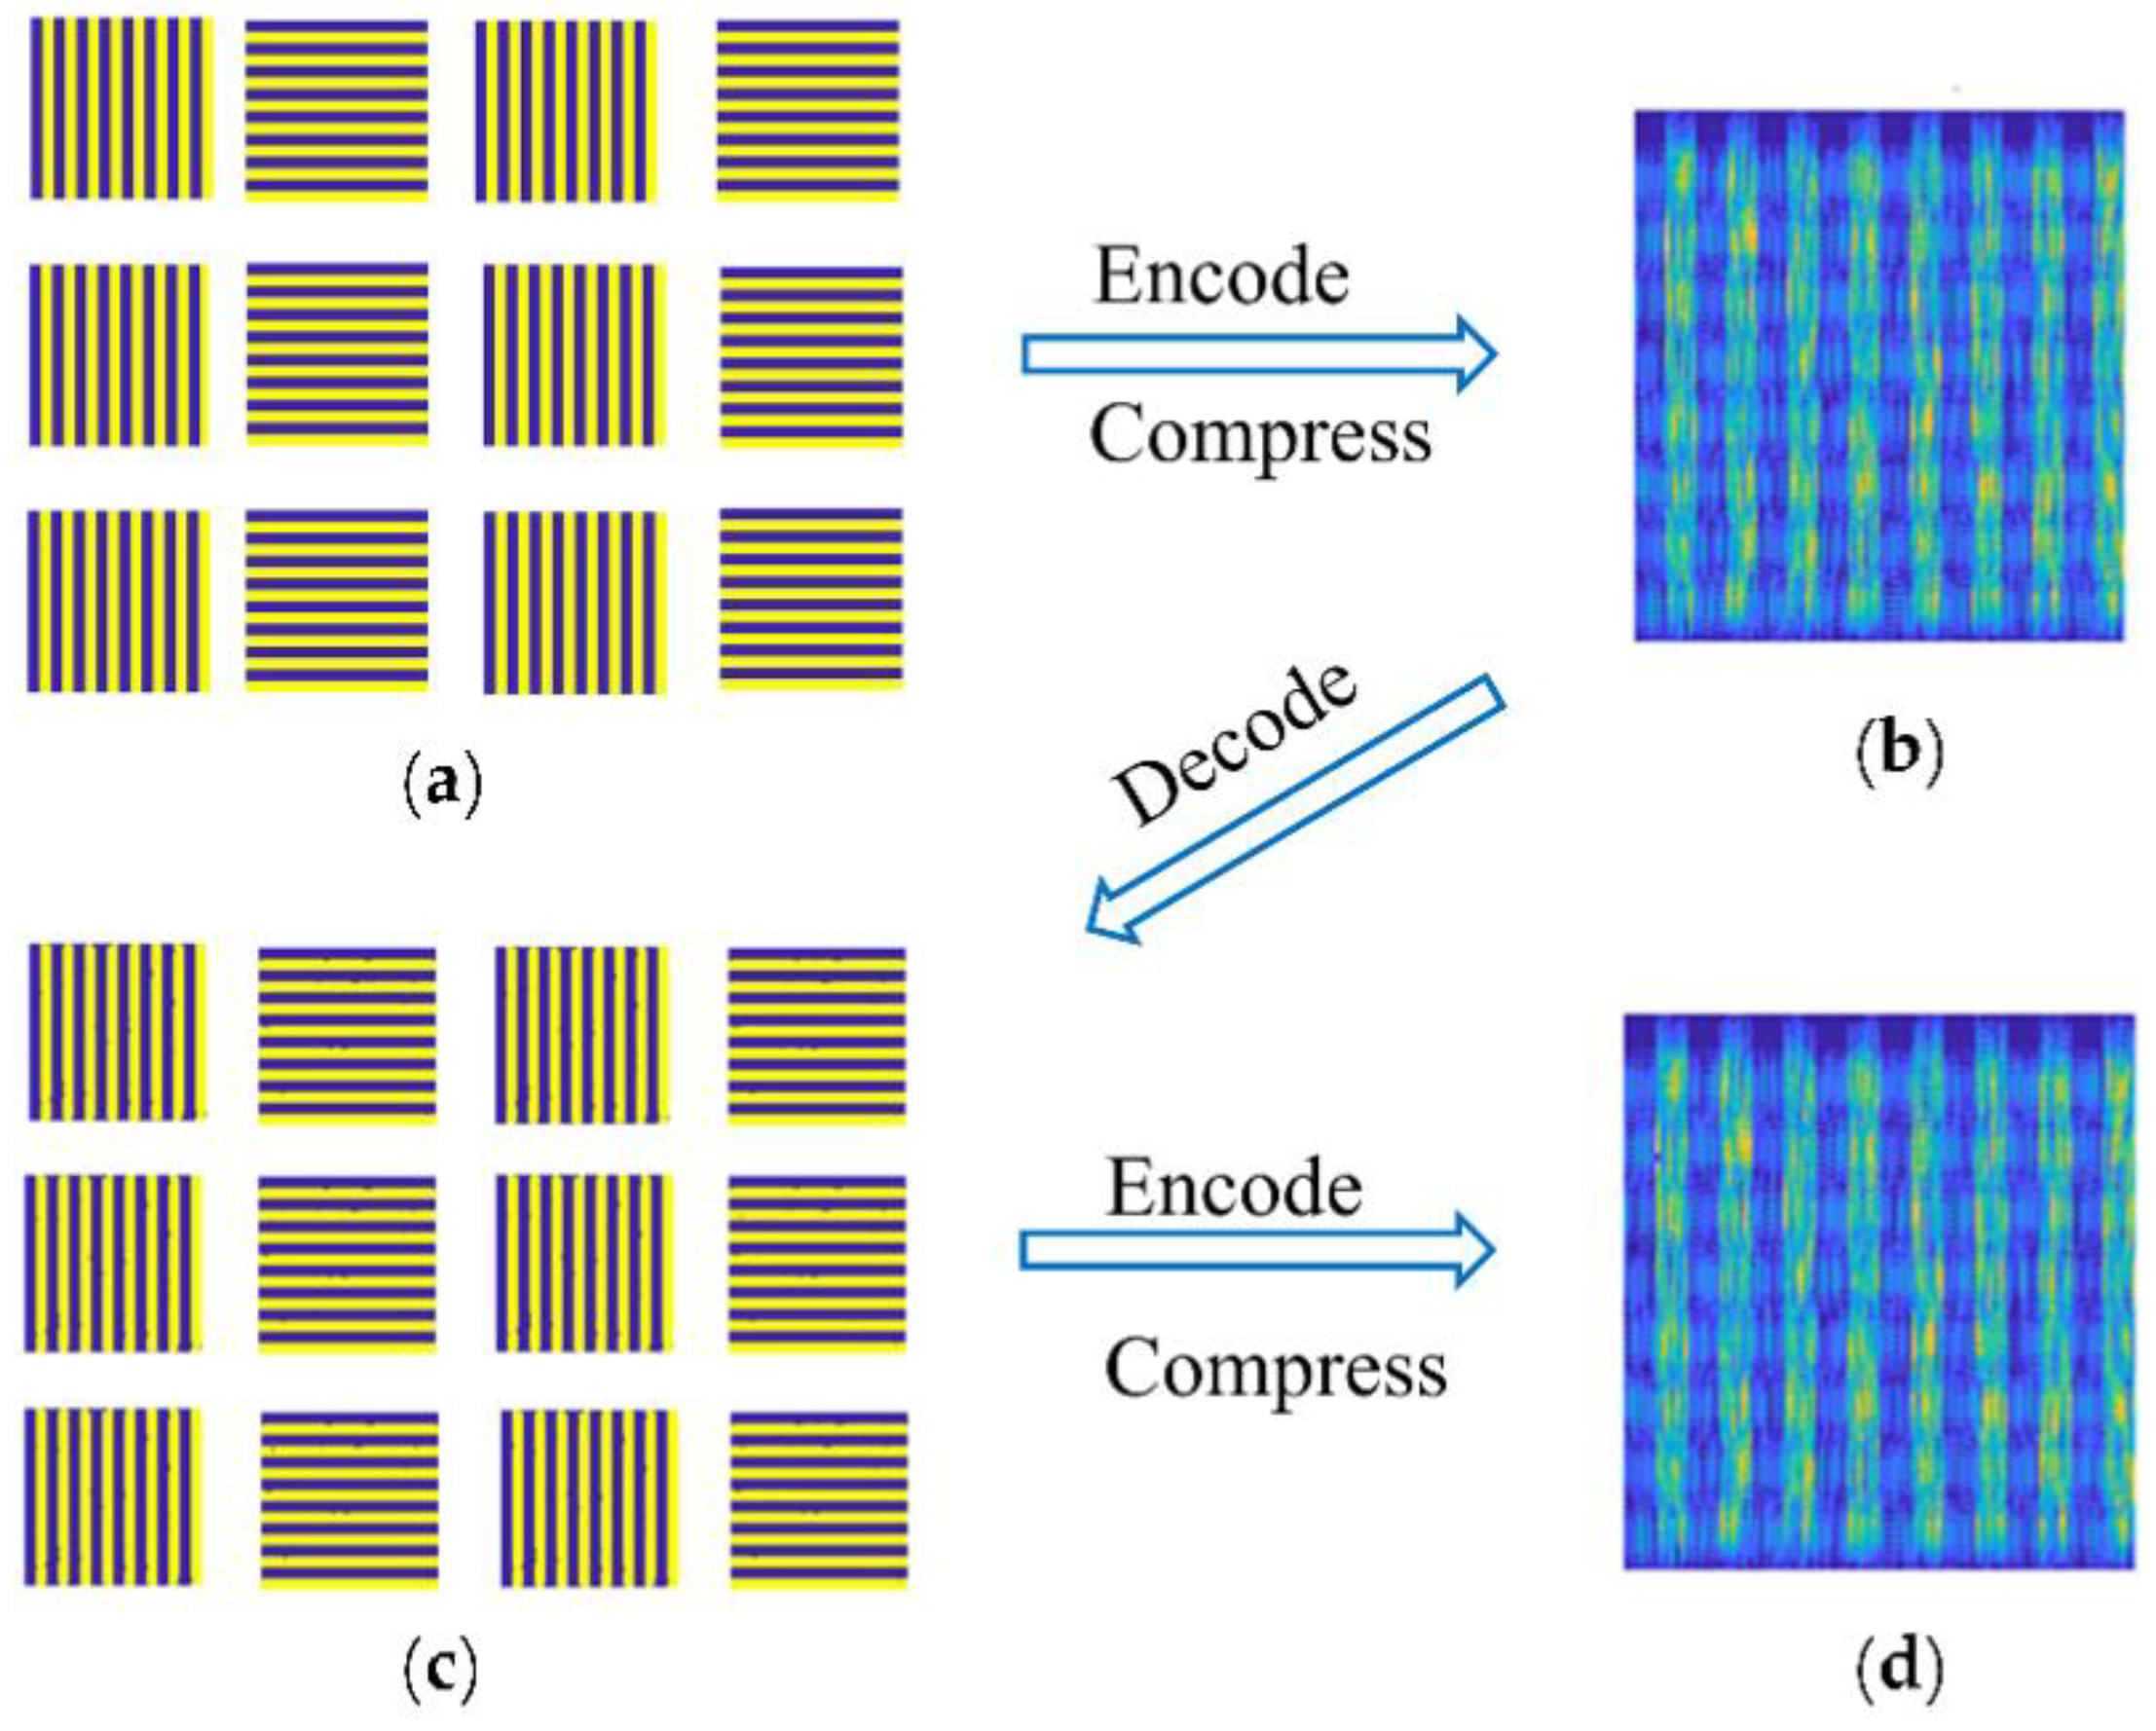
- The first step is to capture the ultrafast dynamic scene with the compressed ultrafast imaging system. The ultrafast scene images are encoded, compressed, and superimposed into the streak camera; the captured image of the streak camera is , as shown in Figure 7b.
- In the second step, a series of reconstructed images are obtained by using the TwIST algorithm, as shown in Figure 7c.
4. Discussion
5. Conclusions
Author Contributions
Funding
Institutional Review Board Statement
Informed Consent Statement
Data Availability Statement
Conflicts of Interest
References
- Dill, F.H.; Hornberger, W.P.; Hauge, P.S.; Shaw, J.M. Characterization of positive photoresist. IEEE Trans. Electron. Devices 1975, 22, 445–452. [Google Scholar] [CrossRef]
- Kowalevicz, A.; Sharma, V.; Ippen, E.; Fujimoto, J.G.; Minoshima, K. Three-dimensional photonic devices fabricated in glass by use of a femtosecond laser oscillator. Opt. Lett. 2005, 30, 1060–1062. [Google Scholar] [CrossRef] [PubMed]
- Borowiec, A.; Haugen, H.K. Femtosecond laser micromachining of grooves in indium phosphide. Appl. Phys. A 2004, 79, 521–529. [Google Scholar] [CrossRef]
- Sohn, I.-B.; Ahsan, M.S.; Noh, Y.-C.; Choi, H.-K.; Kim, J.-T.; Ko, M.J. Fabrication of Fresnel zone plate lens in fused silica glass using femtosecond laser lithography technology. Opt. Eng. 2014, 53, 55107. [Google Scholar] [CrossRef]
- Wu, D.; Wu, S.-Z.; Niu, L.-G.; Chen, Q.-D.; Wang, R.; Song, J.-F.; Fang, H.-H.; Sun, H.-B. High numerical aperture microlens arrays of close packing. Appl. Phys. Lett. 2010, 97, 31109. [Google Scholar] [CrossRef] [Green Version]
- Liang, Y.; Zhou, J.; Yin, D.; Zheng, Y.; Qi, H.; Wang, M.; Cheng, Y. Monolithically integrated electro-optic modulator fabricated on lithium niobate on insulator by photolithography assisted chemo-mechanical etching. J. Phys. Photonics 2021, 3, 34019. [Google Scholar] [CrossRef]
- Sakakura, M.; Terazima, M.; Shimotsuma, Y.; Miura, K.; Hirao, K. Observation of pressure wave generated by focusing a femtosecond laser pulse inside a glass. Opt. Express 2007, 15, 5674–5686. [Google Scholar] [CrossRef]
- Wei, Y.; Li, B.; Wei, X.; Yu, Y.; Wong, K.K.Y. Ultrafast spectral dynamics of dual-color-soliton intracavity collision in a mode-locked fiber laser. Appl. Phys. Lett. 2018, 112, 81104. [Google Scholar] [CrossRef]
- Šiaulys, N.; Melninkaitis, A.; Dubietis, A. In situ study of two interacting femtosecond filaments in sapphire. Opt. Lett. 2015, 4, 2285–2288. [Google Scholar] [CrossRef]
- Geints, Y.E.; Minina, O.V.; Geints, I.Y.; Seleznev, L.V.; Pushkarev, D.V.; Mokrousova, D.V.; Rizaev, G.E.; Shipilo, D.E.; Nikolaeva, I.A.; Kurilova, M.V.; et al. Nonlinear Propagation and Filamentation on 100 Meter Air Path of Femtosecond Beam Partitioned by Wire Mesh. Sensors 2022, 22, 6322. [Google Scholar] [CrossRef]
- Lei, C.; Kobayashi, H.; Wu, Y.; Li, M.; Isozaki, A.; Yasumoto, A.; Mikami, H.; Ito, T.; Nitta, N.; Sugimura, T. High-throughput imaging flow cytometry by optofluidic time-stretch microscopy. Nat. Protoc. 2018, 13, 1603–1631. [Google Scholar] [CrossRef] [PubMed]
- Kudryashov, S.I.; Seleznev, L.V.; Rudenko, A.A.; Ionin, A.A. In situ supercontinuum nanopatterning of silicon surface by femtosecond laser super-filaments. JETP Lett. 2019, 109, 157–162. [Google Scholar] [CrossRef]
- Etoh, T.G.; Vo Le, C.; Hashishin, Y.; Otsuka, N.; Takehara, K.; Ohtake, H.; Hayashida, T.; Maruyama, H. Evolution of ultra-high-speed CCD imagers. Plasma Fusion Res. 2007, 2, S1021. [Google Scholar] [CrossRef] [Green Version]
- Tiwari, V.; Sutton, M.; McNeill, S.R. Assessment of high speed imaging systems for 2D and 3D deformation measurements: Methodology development and validation. Exp. Mech. 2007, 47, 561–579. [Google Scholar] [CrossRef]
- Nakagawa, K.; Iwasaki, A.; Oishi, Y.; Hirosaki, R.; Tsukamoto, A.; Hirosawa, K.; Liao, H.; Ushida, T.; Goda, K.; Kannari, K. Sequentially timed all-optical mapping photography (STAMP). Nat. Photonics 2014, 8, 695–700. [Google Scholar] [CrossRef]
- Suzuki, T.; Hida, R.; Yamaguchi, Y.; Nakagawa, K.; Saiki, T.; Kannari, F. Single-shot 25-frame burst imaging of ultrafast phase transition of Ge2Sb2Te5 with a sub-picosecond resolution. Appl. Phys. Express 2017, 10, 92502. [Google Scholar] [CrossRef]
- Domke, M.; Rapp, S.; Schmidt, M.; Huber, H.P. Ultrafast pump-probe microscopy with high temporal dynamic range. Opt. Express 2012, 20, 10330–10338. [Google Scholar] [CrossRef]
- Wei, J.; Zhang, B.; Liu, H.; Zhang, H. Time-Resolved Shadowgraphic Imaging of Femtosecond Laser Ablated Micro-Holes in Silica Glass. Chin. J. Lasers 2019, 46, 508020. [Google Scholar]
- Bergner, K.; Seyfarth, B.; Lammers, K.A.; Ullsperger, T.; Döring, S.; Heinrich, M.; Kumkar, M.; Flamm, D.; Tünnermann, A.; Nolte, S. Spatio-temporal analysis of glass volume processing using ultrashort laser pulses. Appl. Opt. 2018, 57, 4618–4632. [Google Scholar] [CrossRef]
- Yu, Y.; Jiang, L.; Cao, Q.; Xia, B.; Wang, Q.; Lu, Y. Pump-probe imaging of the fs-ps-ns dynamics during femtosecond laser Bessel beam drilling in PMMA. Opt. Express 2015, 23, 32728–32735. [Google Scholar] [CrossRef]
- Unger, C.; Koch, J.; Overmeyer, L.; Chichkov, B.N. Time-resolved studies of femtosecond-laser induced melt dynamics. Opt. Express 2012, 20, 24864–24872. [Google Scholar] [CrossRef] [PubMed]
- Gao, L.; Liang, J.; Li, C.; Wang, L.V. Single-shot compressed ultrafast photography at one hundred billion frames per second. Nature 2014, 516, 74–77. [Google Scholar] [CrossRef] [PubMed]
- Liang, J.; Ma, C.; Zhu, L.; Chen, Y.; Gao, L.; Wang, L.V. Single-shot real-time video recording of a photonic Mach cone induced by a scattered light pulse. Sci. Adv. 2017, 3, e1601814. [Google Scholar] [CrossRef] [PubMed] [Green Version]
- Jing, J.; Wei, X.; Wang, L.V. Spatio-temporal-spectral imaging of non-repeatable dissipative soliton dynamics. Nat. Commun. 2020, 11, 2059. [Google Scholar] [CrossRef]
- Fan, L.; Yan, X.; Wang, H.; Wang, L.V. Real-time observation and control of optical chaos. Sci. Adv. 2021, 7, eabc8448. [Google Scholar] [CrossRef]
- Bioucas-Dias, J.M.; Figueiredo, M.A. A New TwIST: Two-step iterative shrinkage/thresholding algorithms for image restoration. IEEE Trans. Image Proc. 2007, 16, 2992–3004. [Google Scholar] [CrossRef] [Green Version]
- Guan, Z.; Li, Y.; Wang, F.; Liu, X.; Peng, X.; Xu, T.; Liu, Y. Study on the length of diagnostic time window of CUP-VISAR. Meas. Sci. Technol. 2021, 32, 125208. [Google Scholar] [CrossRef]
- Dudley, D.; Duncan, W.M.; Slaughter, J. Emerging digital micromirror device (DMD) applications. Proc. SPIE 2003, 4985, 14–25. [Google Scholar]
- Feng, J.; Shin, H.J.; Nasiatka, J.R.; Wan, W.; Young, A.T.; Huang, G.; Comin, A.; Byrd, J.; Padmore, H.A. An X-ray streak camera with high spatiotemporal resolution. Appl. Phys. Lett. 2007, 91, 134102. [Google Scholar] [CrossRef] [Green Version]
- Eldar, Y.C.; Kutyniok, G. Compressed Sensing: Theory and Applications; Cambridge University Press: Cambridge, UK, 2012. [Google Scholar]
- Donoho, D.L. Compressed sensing. IEEE Trans. Inf. Theory. 2006, 52, 1289–1306. [Google Scholar] [CrossRef]
- Fruehling, U.; Wieland, M.; Gensch, M.; Gebert, T.; Schuette, B.; Krikunova, M.; Kalms, R.; Budzyn, F.; Grimm, O.; Rossbach, J.; et al. Single-shot terahertz-field-driven X-ray streak camera. Nat. Photonics 2009, 3, 523–528. [Google Scholar] [CrossRef]
- Erdmann, A.; Fühner, T.; Evanschitzky, P.; Agudelo, V.; Freund, C.; Michalak, P.; Xu, D.B. Optical and EUV projection lithography: A computational view. Microelectron. Eng. 2015, 132, 21–34. [Google Scholar] [CrossRef]
- Begum, M.; Uddin, M.S. Digital Image Watermarking Techniques: A Review. Information 2020, 11, 110. [Google Scholar] [CrossRef] [Green Version]
- Wang, Z.; Bovik, A.C.; Sheikh, H.R.; Simoncelli, E.P. Image quality assessment: From error visibility to structural similarity. IEEE Trans. Image Proc. 2004, 13, 600–612. [Google Scholar] [CrossRef] [PubMed]


Publisher’s Note: MDPI stays neutral with regard to jurisdictional claims in published maps and institutional affiliations. |
© 2022 by the authors. Licensee MDPI, Basel, Switzerland. This article is an open access article distributed under the terms and conditions of the Creative Commons Attribution (CC BY) license (https://creativecommons.org/licenses/by/4.0/).
Share and Cite
Liu, X.; Xu, B.; Du, Z.; Ding, Y.; Hu, Y.; Zhan, X.; Liao, S.; Xi, J. Capturing the Motion of Laser Pulse in Photoresist Mixture with Compressed Ultrafast Photography. Photonics 2022, 9, 903. https://doi.org/10.3390/photonics9120903
Liu X, Xu B, Du Z, Ding Y, Hu Y, Zhan X, Liao S, Xi J. Capturing the Motion of Laser Pulse in Photoresist Mixture with Compressed Ultrafast Photography. Photonics. 2022; 9(12):903. https://doi.org/10.3390/photonics9120903
Chicago/Turabian StyleLiu, Xinyue, Bin Xu, Zihao Du, Yi Ding, Yi Hu, Xiaojiang Zhan, Shengbin Liao, and Jiangtao Xi. 2022. "Capturing the Motion of Laser Pulse in Photoresist Mixture with Compressed Ultrafast Photography" Photonics 9, no. 12: 903. https://doi.org/10.3390/photonics9120903