1. Introduction
Electro-optic intensity/phase modulators (MODs) attract significant applications in optical fiber communication systems, coherent optical communication systems and microwave photonic systems [
1,
2,
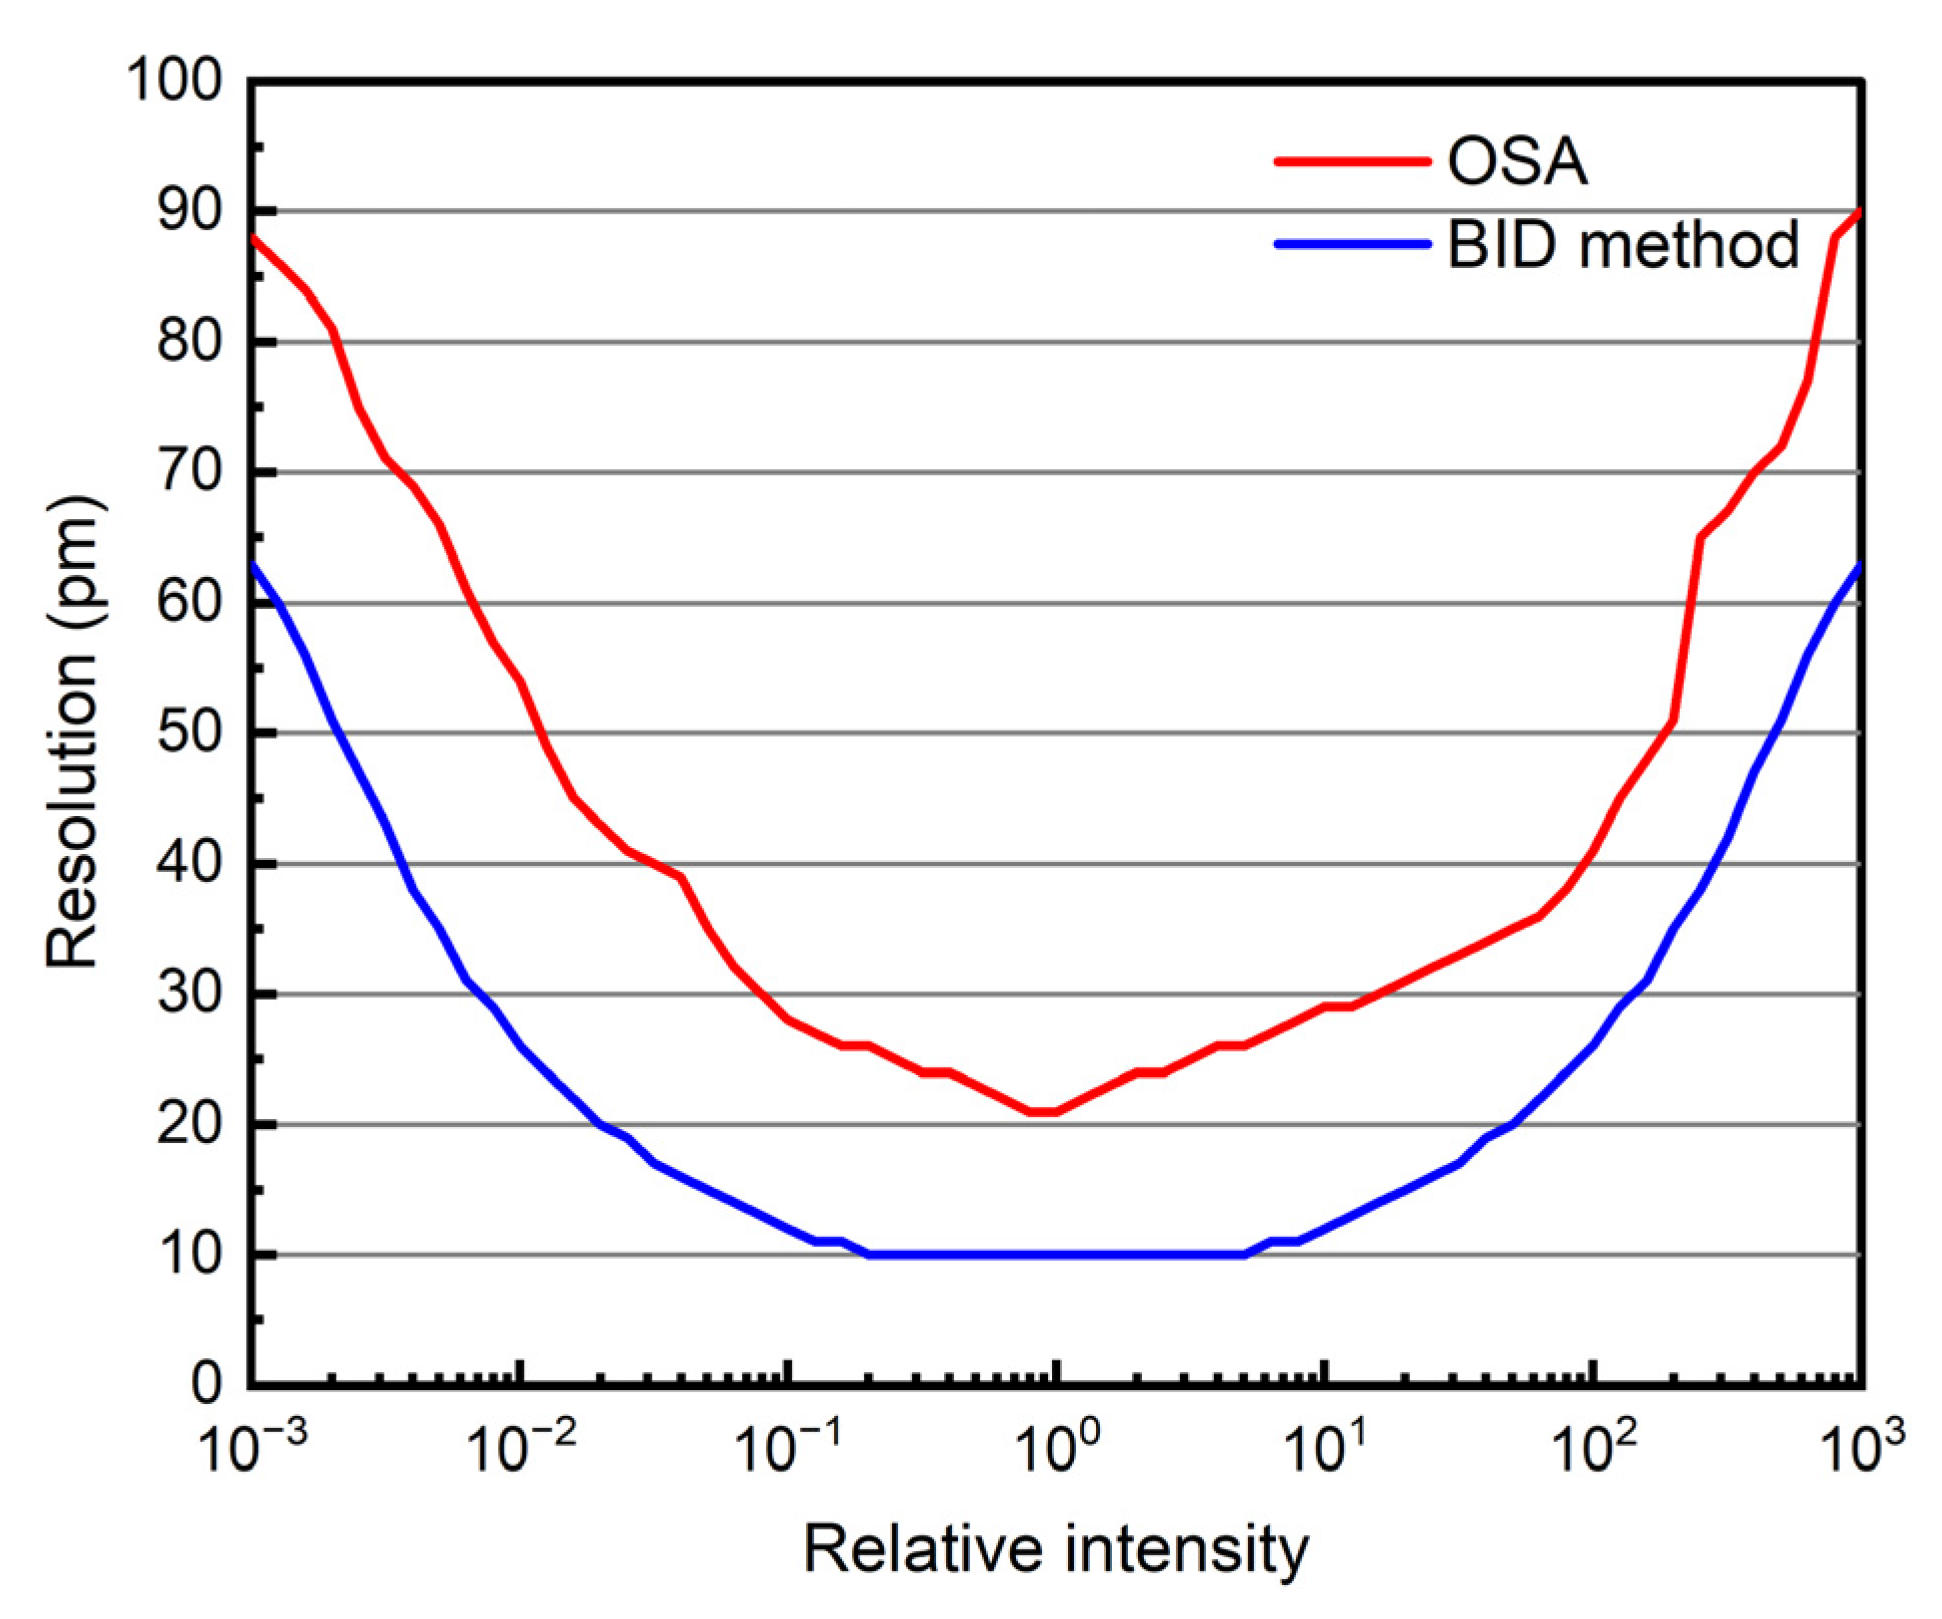
3]. As is known, electro-optic modulation efficiency will deteriorate with modulation frequency because of the phase velocity mismatch and the microwave impedance mismatch, and frequency response parameters are critical to the characterization and optimization of MODs. The most direct method for measuring the frequency response parameters of MODs is optical spectrum analysis, in which the modulation depth is determined by resolving the electro-optic modulation spectral lines, including the optical carrier and its sidebands, with an optical spectrum analyzer (OSA). According to the Rayleigh criterion, two spectral lines spaced by full-width at half-maximum (FWHM) can be exactly resolved in cases of iso-intensity. However, in the case of non-iso-intensity, the spectral lines cannot be resolved even when they are spaced by the FWHM. For example, the commercially available grating-based OSA can reach a best resolution of 20 p.m. when the spectral lines have the same intensity. In contrast, as shown in
Figure 1, the OSA resolution will deteriorate from 20 p.m. to 90 p.m. as the relative intensity changes from 0.001 to 1000. As shown in
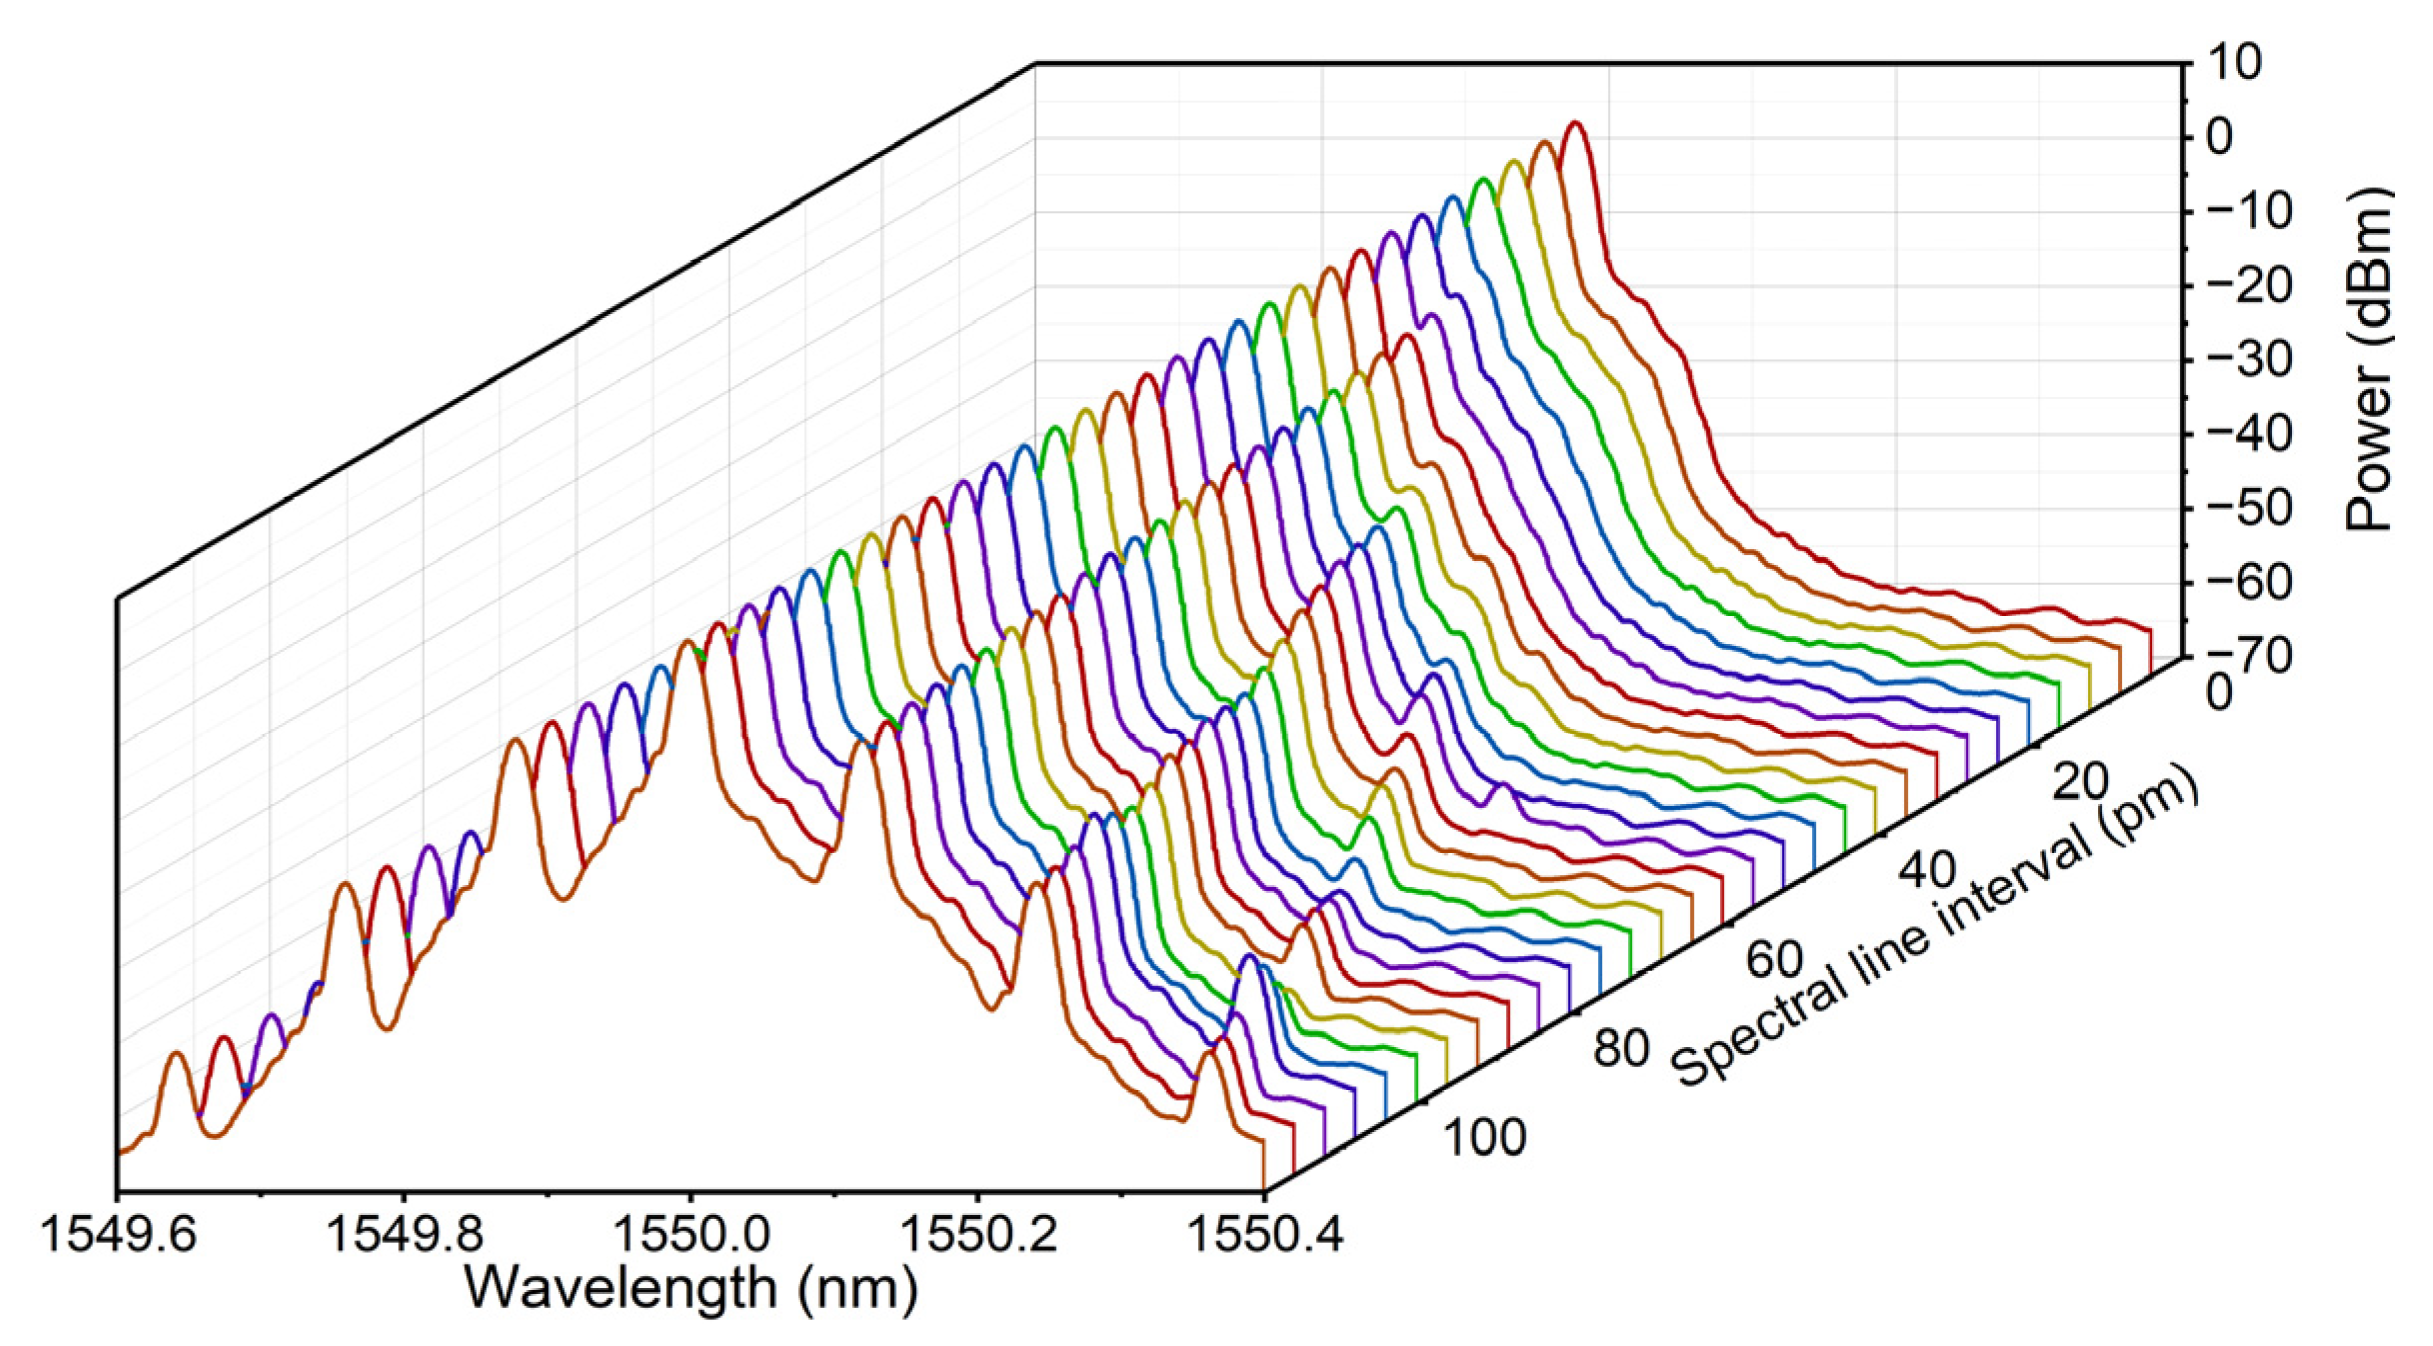
Figure 2, when the optical carrier and its weak sidebands are kept at constant relative intensity, the weak sidebands are gradually covered by the optical carrier and become indistinguishable when the sidebands are located more and more closely to the optical carrier. Therefore, the methods that are capable of improving the resolution for resolving those non-iso-intensity spectral lines are of great significance, which are also promising for resolving the electro-optic modulation spectrum with high accuracy.
From the perspective of signal and system, the measured modulation spectrum of an OSA can be considered the convolution of the intrinsic modulation spectrum and the point spread function (PSF) of the OSA. If the PSF is known, there are several non-blind deconvolution (NBD) methods proposed [
4], such as the Wiener filtering algorithm [
5], Fourier self-deconvolution (FSD) algorithm [
6], maximum Burg’s entropy deconvolution (MaxEntD) algorithm [
7] and iterative deconvolution algorithm [
8,
9]. The iterative deconvolution is proven to be an effective method for resolving those spectral lines with low signal-to-noise ratio (SNR). Nevertheless, it may encounter the problem of slow subconvergence, leading to difficulty in extracting the intrinsic spectrum [
10]. In 2011, Miroslav Morhač proposed a boosted iterative deconvolution (BID) algorithm [
11] for high-resolution deconvolution, which enables fast convergence to
δ-function by introducing a boost factor in the iteration process. In 2019, Shijie Song et al. proposed a technique based on matrix pencil-assisted deconvolution to improve the measurement resolution in scanning receiver systems for microwave frequency measurements, which improved the system’s resolution from 1 GHz to 0.4 GHz in their experiment [
12].
In this paper, we propose a BID method to resolve the intrinsic modulation spectral lines from the measured optical carrier and modulation spectra. In our scheme, the electro-optic modulation spectrum is considered the convolution of the optical carrier spectrum and the intrinsic
δ-function modulation spectrum, and the BID algorithm enables fast and accurate extraction of the
δ-function spectral lines from the measured modulation spectrum. In contrast, the conventional iterative deconvolution (CID) algorithm leads to subconvergence to
δ-functions, even with many more iterations. In terms of resolving the intrinsic modulation spectral lines, our method has higher resolution and accuracy than OSA directly measured modulation spectra. Compared with the heterodyne spectrum mapping (HSM) method, which maps the desired optical spectrum from optical domain to electrical domain and obtain indirect but equivalent observation of these optical spectral lines in the electrical domain by using an electrical spectrum analyzer (ESA) [
13,
14,
15], our method does not need complex structures but an OSA, providing a simpler choice.
2. Theoretical Principle
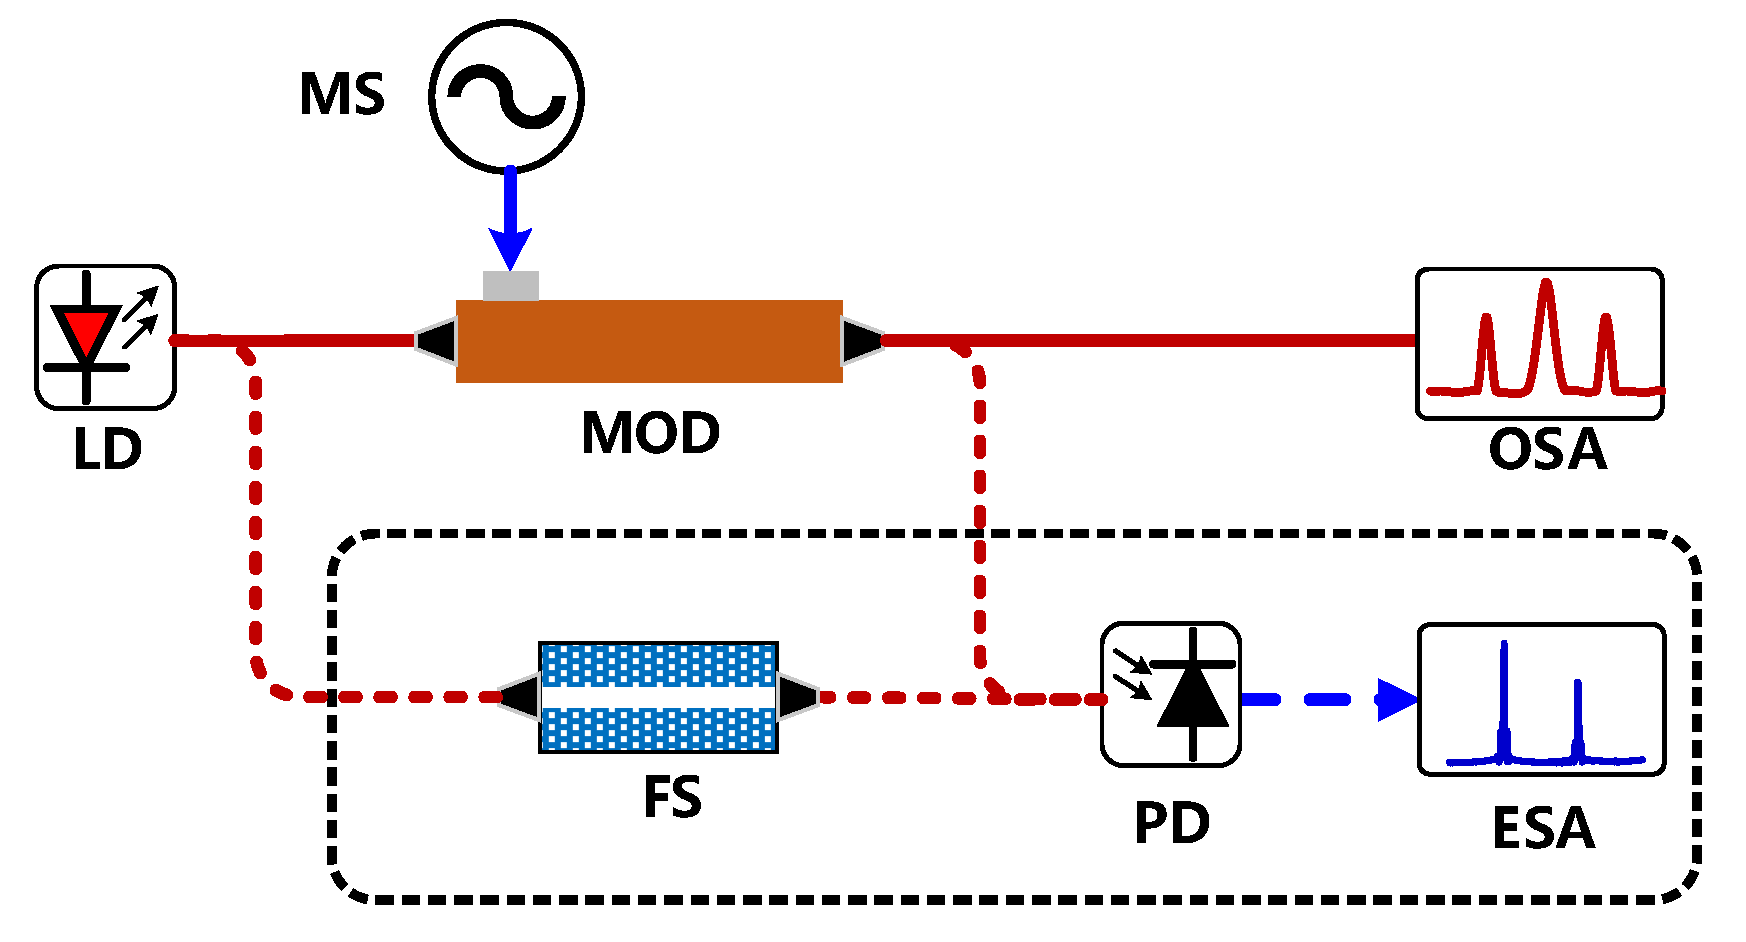
Figure 3 shows the schematic setup for measuring an electro-optic modulation spectrum, in which an optical carrier from a laser diode (LD) is modulated by an electro-optic modulator (MOD) and then analyzed by an OSA. When the MOD is under off-modulation, the measured carrier spectrum of the OSA is the convolution of the intrinsic carrier spectrum
L(
λ) and the PSF
h(
λ) expressed by
with the wavelength
λ. When the MOD is under a sinusoidal-wave modulation, different order sidebands will be generated on both sides of the optical carrier, which can be expressed by a series of
δ functions as
with the wavelength
λi and intensity
ai of the
i-th spectral line, respectively. The measured modulation spectrum of the OSA is the convolution of the intrinsic modulation spectrum
xm(
λ), the intrinsic carrier spectrum
L(
λ) and the PSF
h(
λ), expressed by
From Equation (3), the measured modulation spectrum can also be considered the convolution of the intrinsic modulation spectrum
xm(
λ) and the measured carrier spectrum
h(
λ), indicating the intrinsic modulation spectrum can be theoretically restored from the measured carrier and modulation spectrum by means of iterative deconvolution. The process can be expressed as in [
8,
9].
where
xm(k)(
λ) is the
k-th estimation of
xm(
λ). In this paper, we call the iterative deconvolution algorithms based on Equation (4) the conventional iterative deconvolution (CID) algorithms. In the case of non-negative spectra, the typical iteration formula
F are often written with the multiplication correction factor as
in which the subscripts correspond to RL method [
16,
17], MAP method [
18] and Gold method [
19]. However, whatever method is used, the main difficulty lies in that the CID algorithms often lead to subconvergence to
δ-functions when restoring the intrinsic modulation spectrum from the measured modulation spectrum, while the BID algorithm guarantees the convergence of the spectral lines to
δ-functions by introducing a boost factor in the iteration process of CID algorithm.
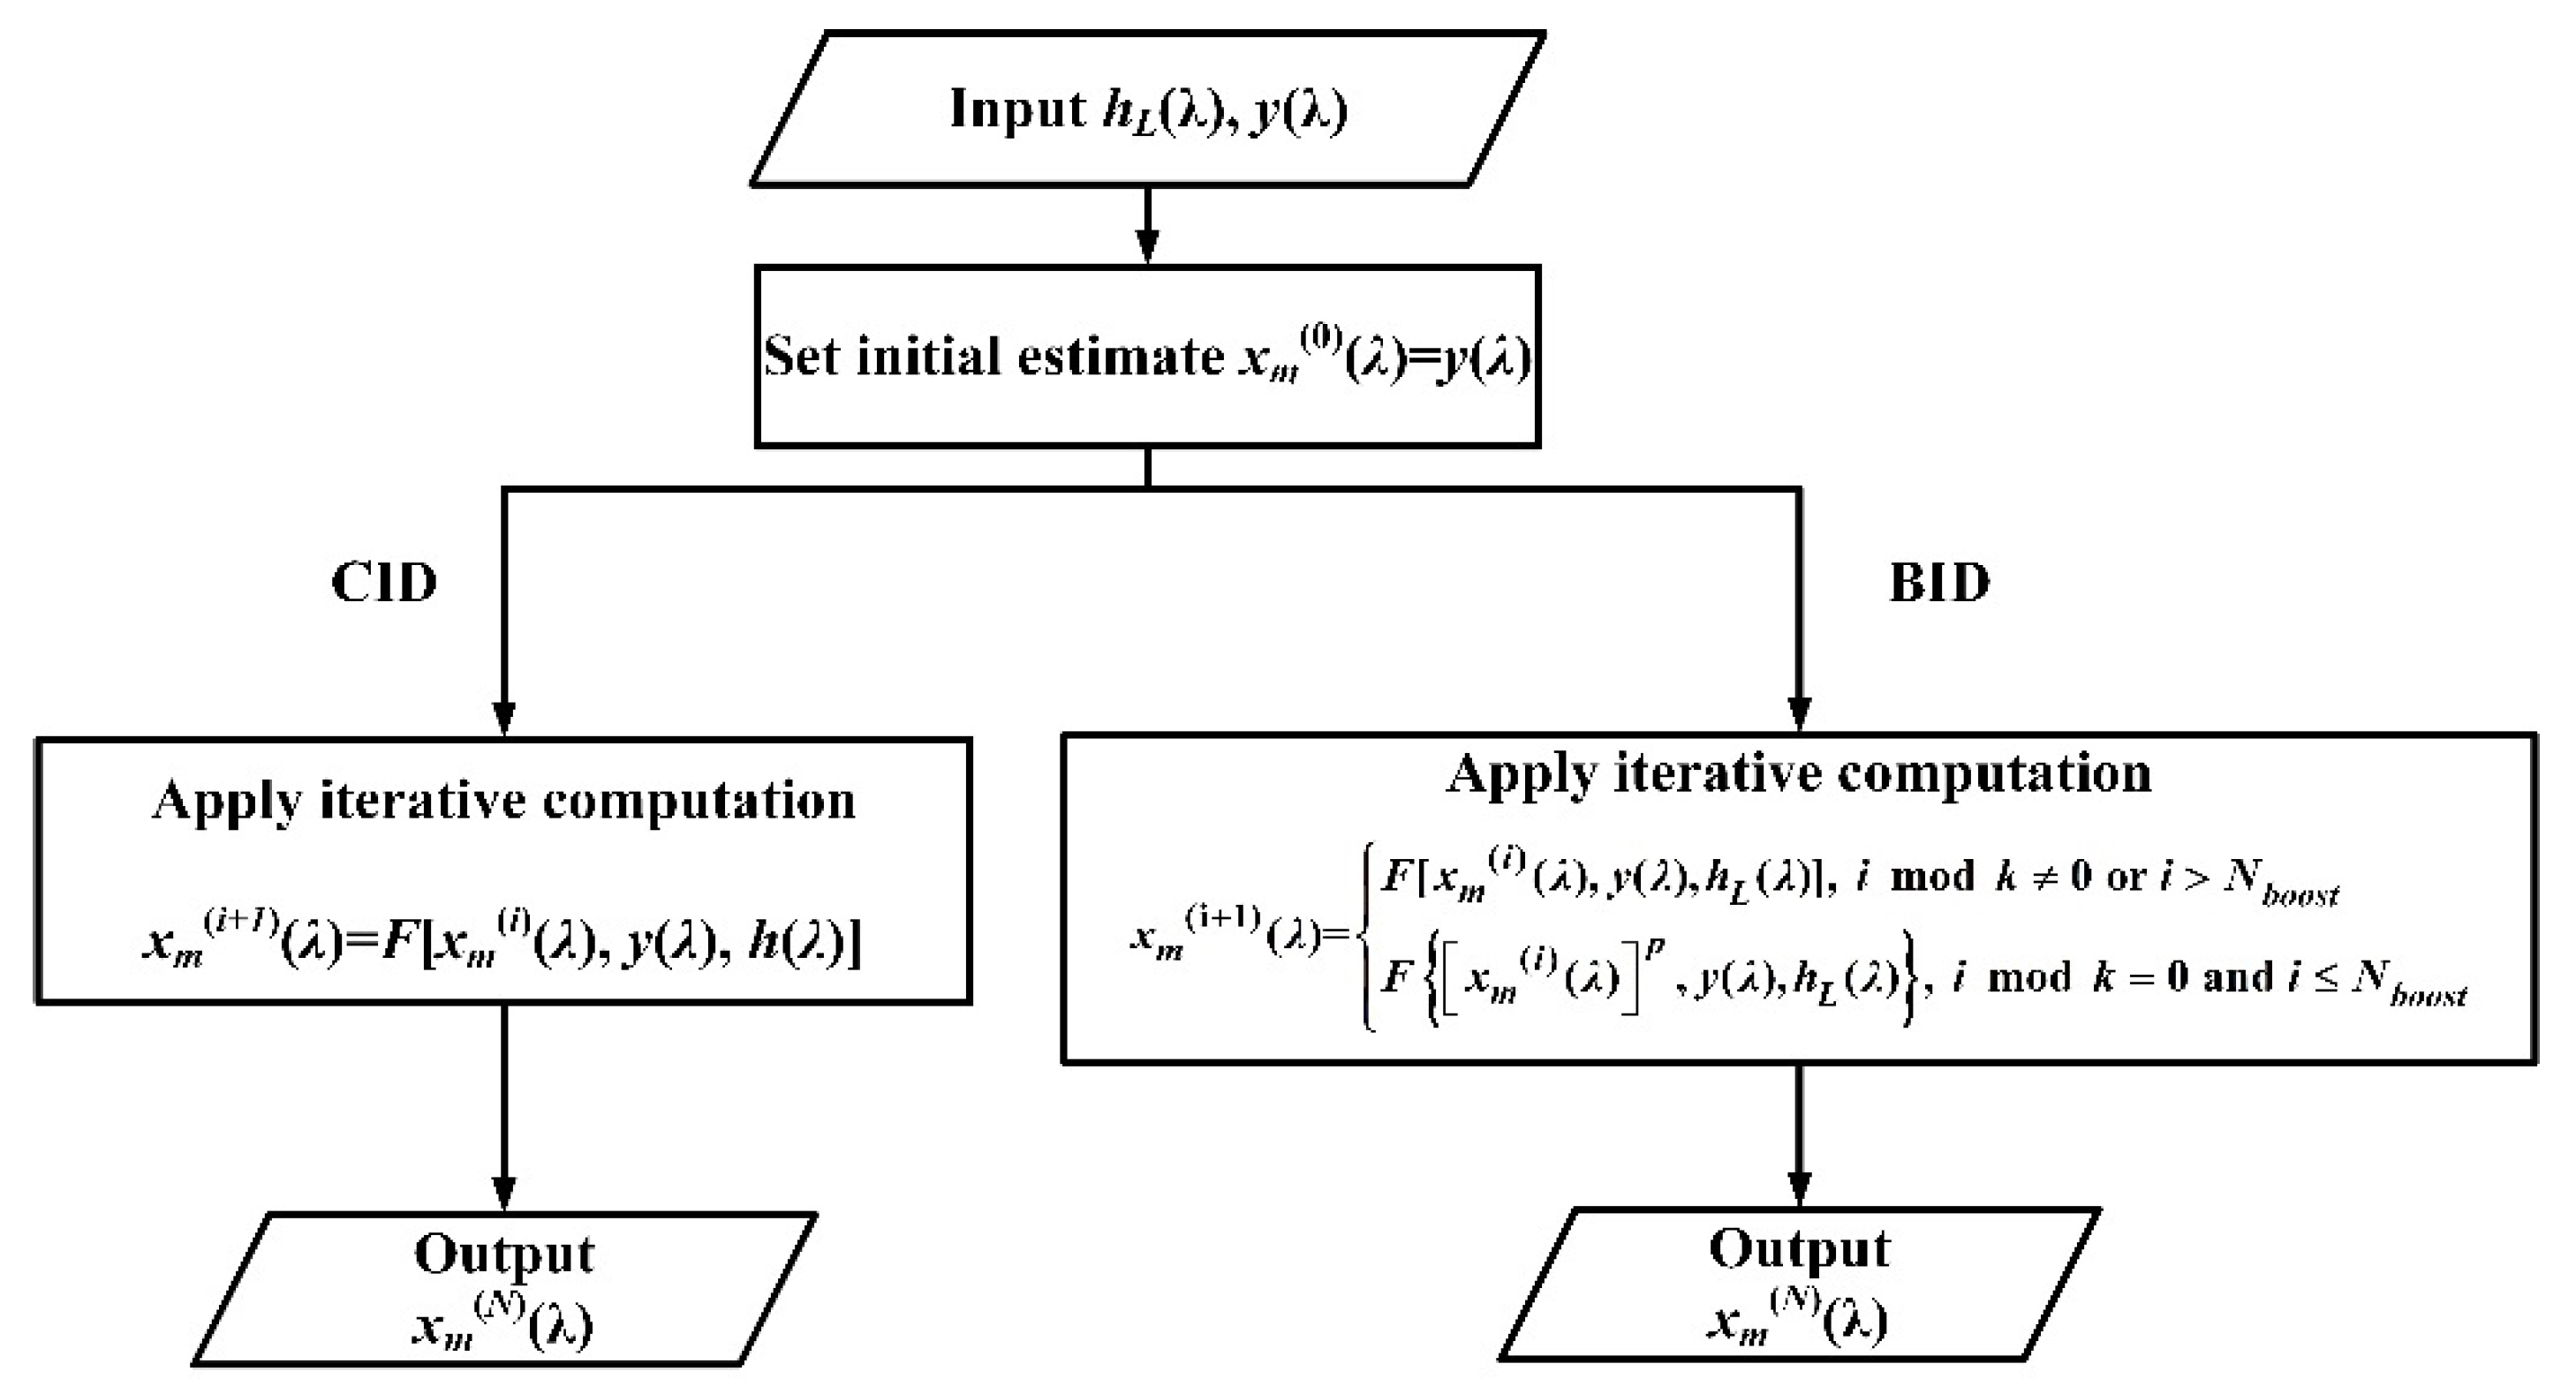
In this work, we propose a BID method to reconstruct the intrinsic
δ-function modulation spectrum.
Figure 4 shows the procedure, which can be summarized as follows. (1) We firstly obtain the measured carrier spectrum
hL(
λ) under off-modulation of MOD and the measured modulation spectrum
y(
λ) under on-modulation of MOD with an OSA. (2) The measured modulated spectrum
y(
λ) is then taken as the initial estimate of the intrinsic modulation spectrum
xm(0)(
λ) and used for iterative computation in Equation (4). (3) We then perform a boosting operation on the iteration result after every
k iterations for the next iteration, i.e., the result
xm(k)(
λ) of the
k-th iteration becomes [
xm(k)(
λ)]
p (1 <
p < 2) after a boosting operation. The initial boost factor
p0 is chosen by referring to the case of the spectral line interval being much larger than the OSA resolution. (4) The final estimate
xm(N)(
λ) after
N iterations is then taken as the recovered intrinsic modulation spectrum.
As shown in
Figure 4, the main difference between BID and CID is that BID applies a boosting operation on the iteration result after every
k iterations for the next iteration, while CID does not. The application of the boosting operation unbalances the system, which will be again balanced to the stable state during the next iterations. Therefore, there should be enough iterations (dozens of iterations) after the final boosting operation to balance the system to a stable state, which is represented by the condition
i >
Nboost in
Figure 4, where
Nboost <
N. The repeated boosting operations in the iterative computation break the slow or unchanged convergence state and guarantee the convergence to δ-functions.
3. Experimental Demonstration
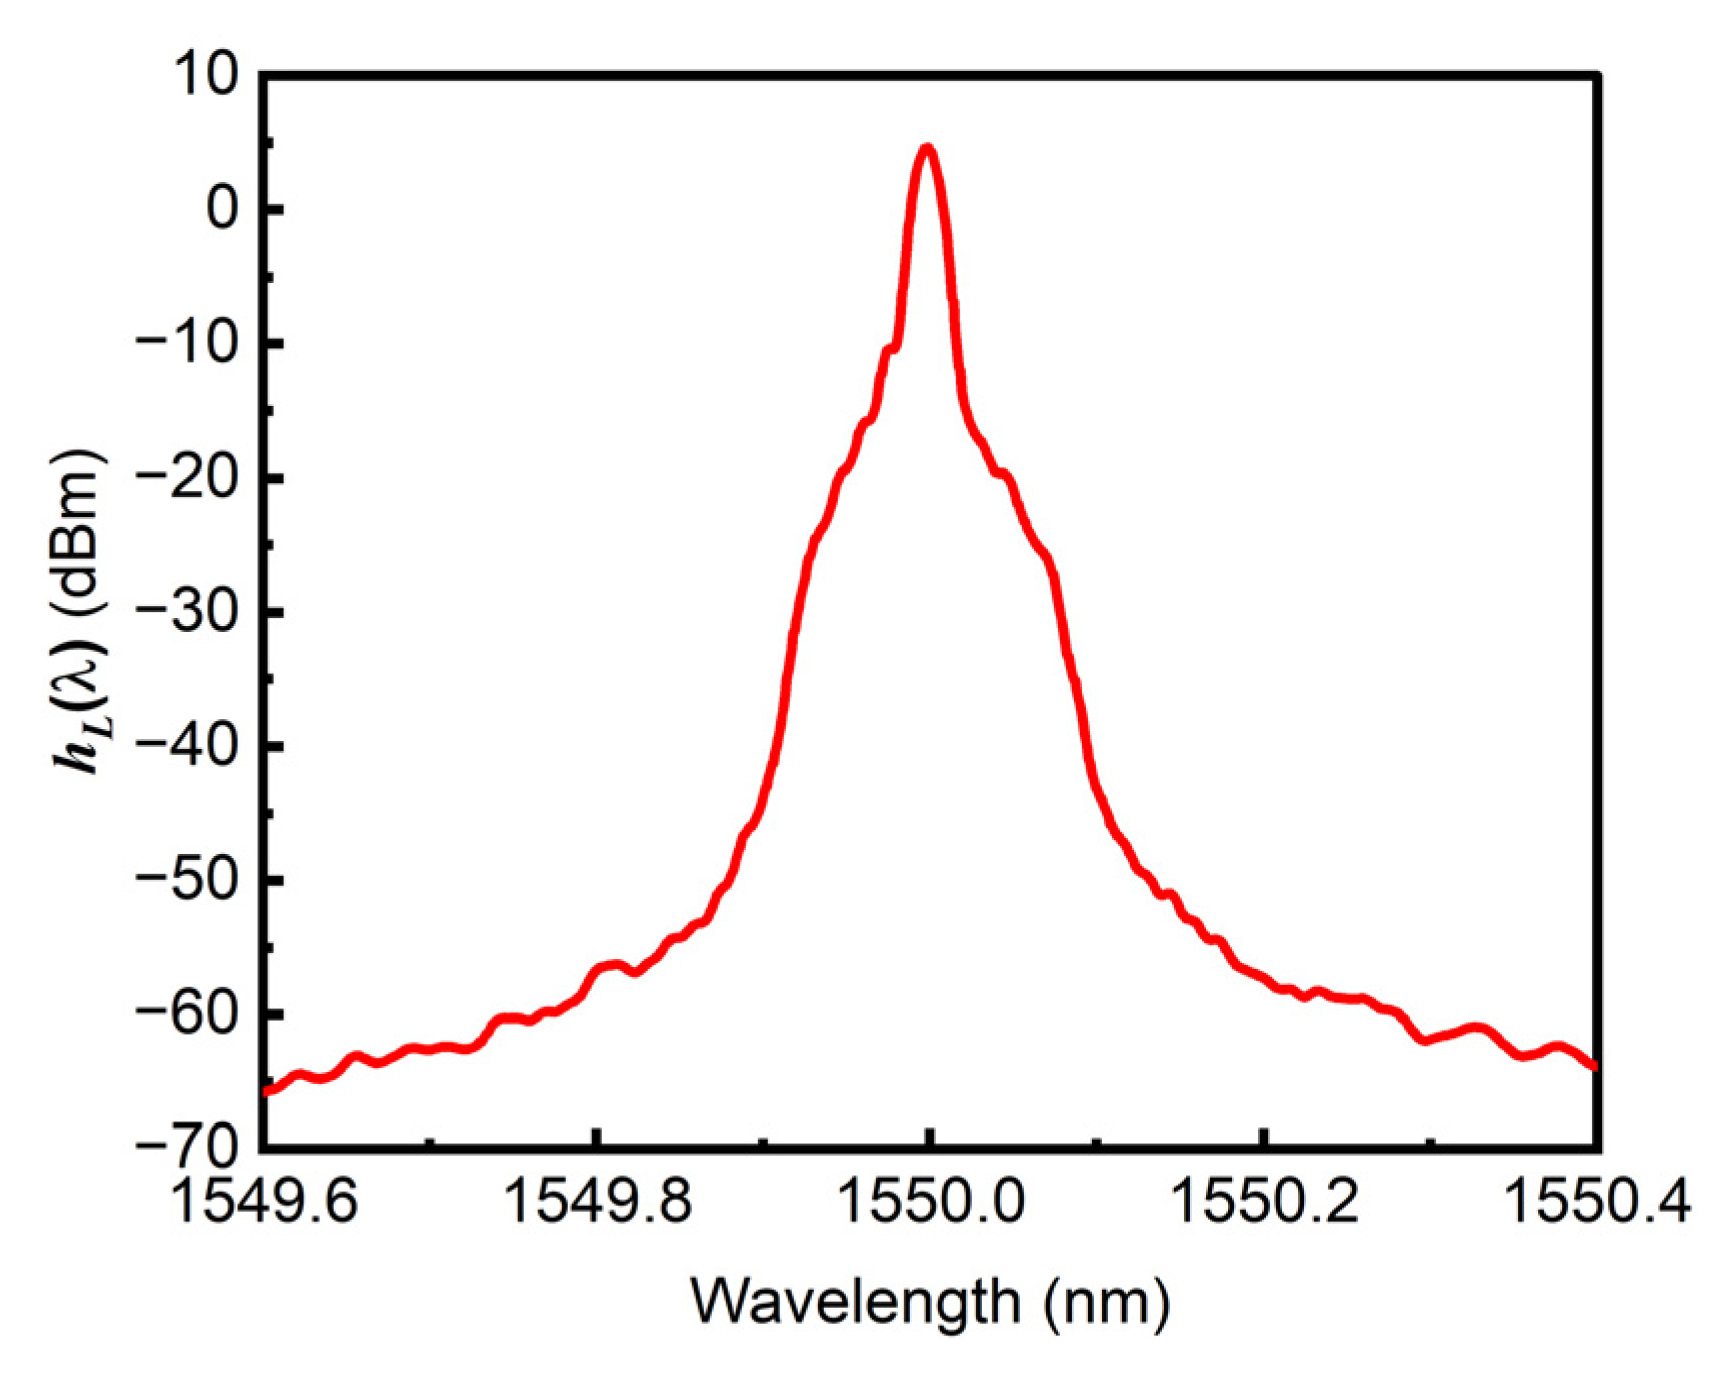
In our experiment, the optical carrier from a narrow line-width laser (Teraxion PS-TNL) with a wavelength of 1550.12 nm and a linewidth of 100 kHz is sent to an electro-optic phase modulator (PM). The carrier and modulation spectra are measured by using an OSA (YOKOGAWA AQ6370D) with a sampling resolution of 1 p.m. and a sampling number of 1001. The best resolution of the OSA is about 20 p.m. at 1550 nm corresponding to a frequency of 2.5 GHz, which is mainly limited by the PSF of Airy-disk diffraction.
Figure 5 illustrates the measured carrier spectrum
hL(
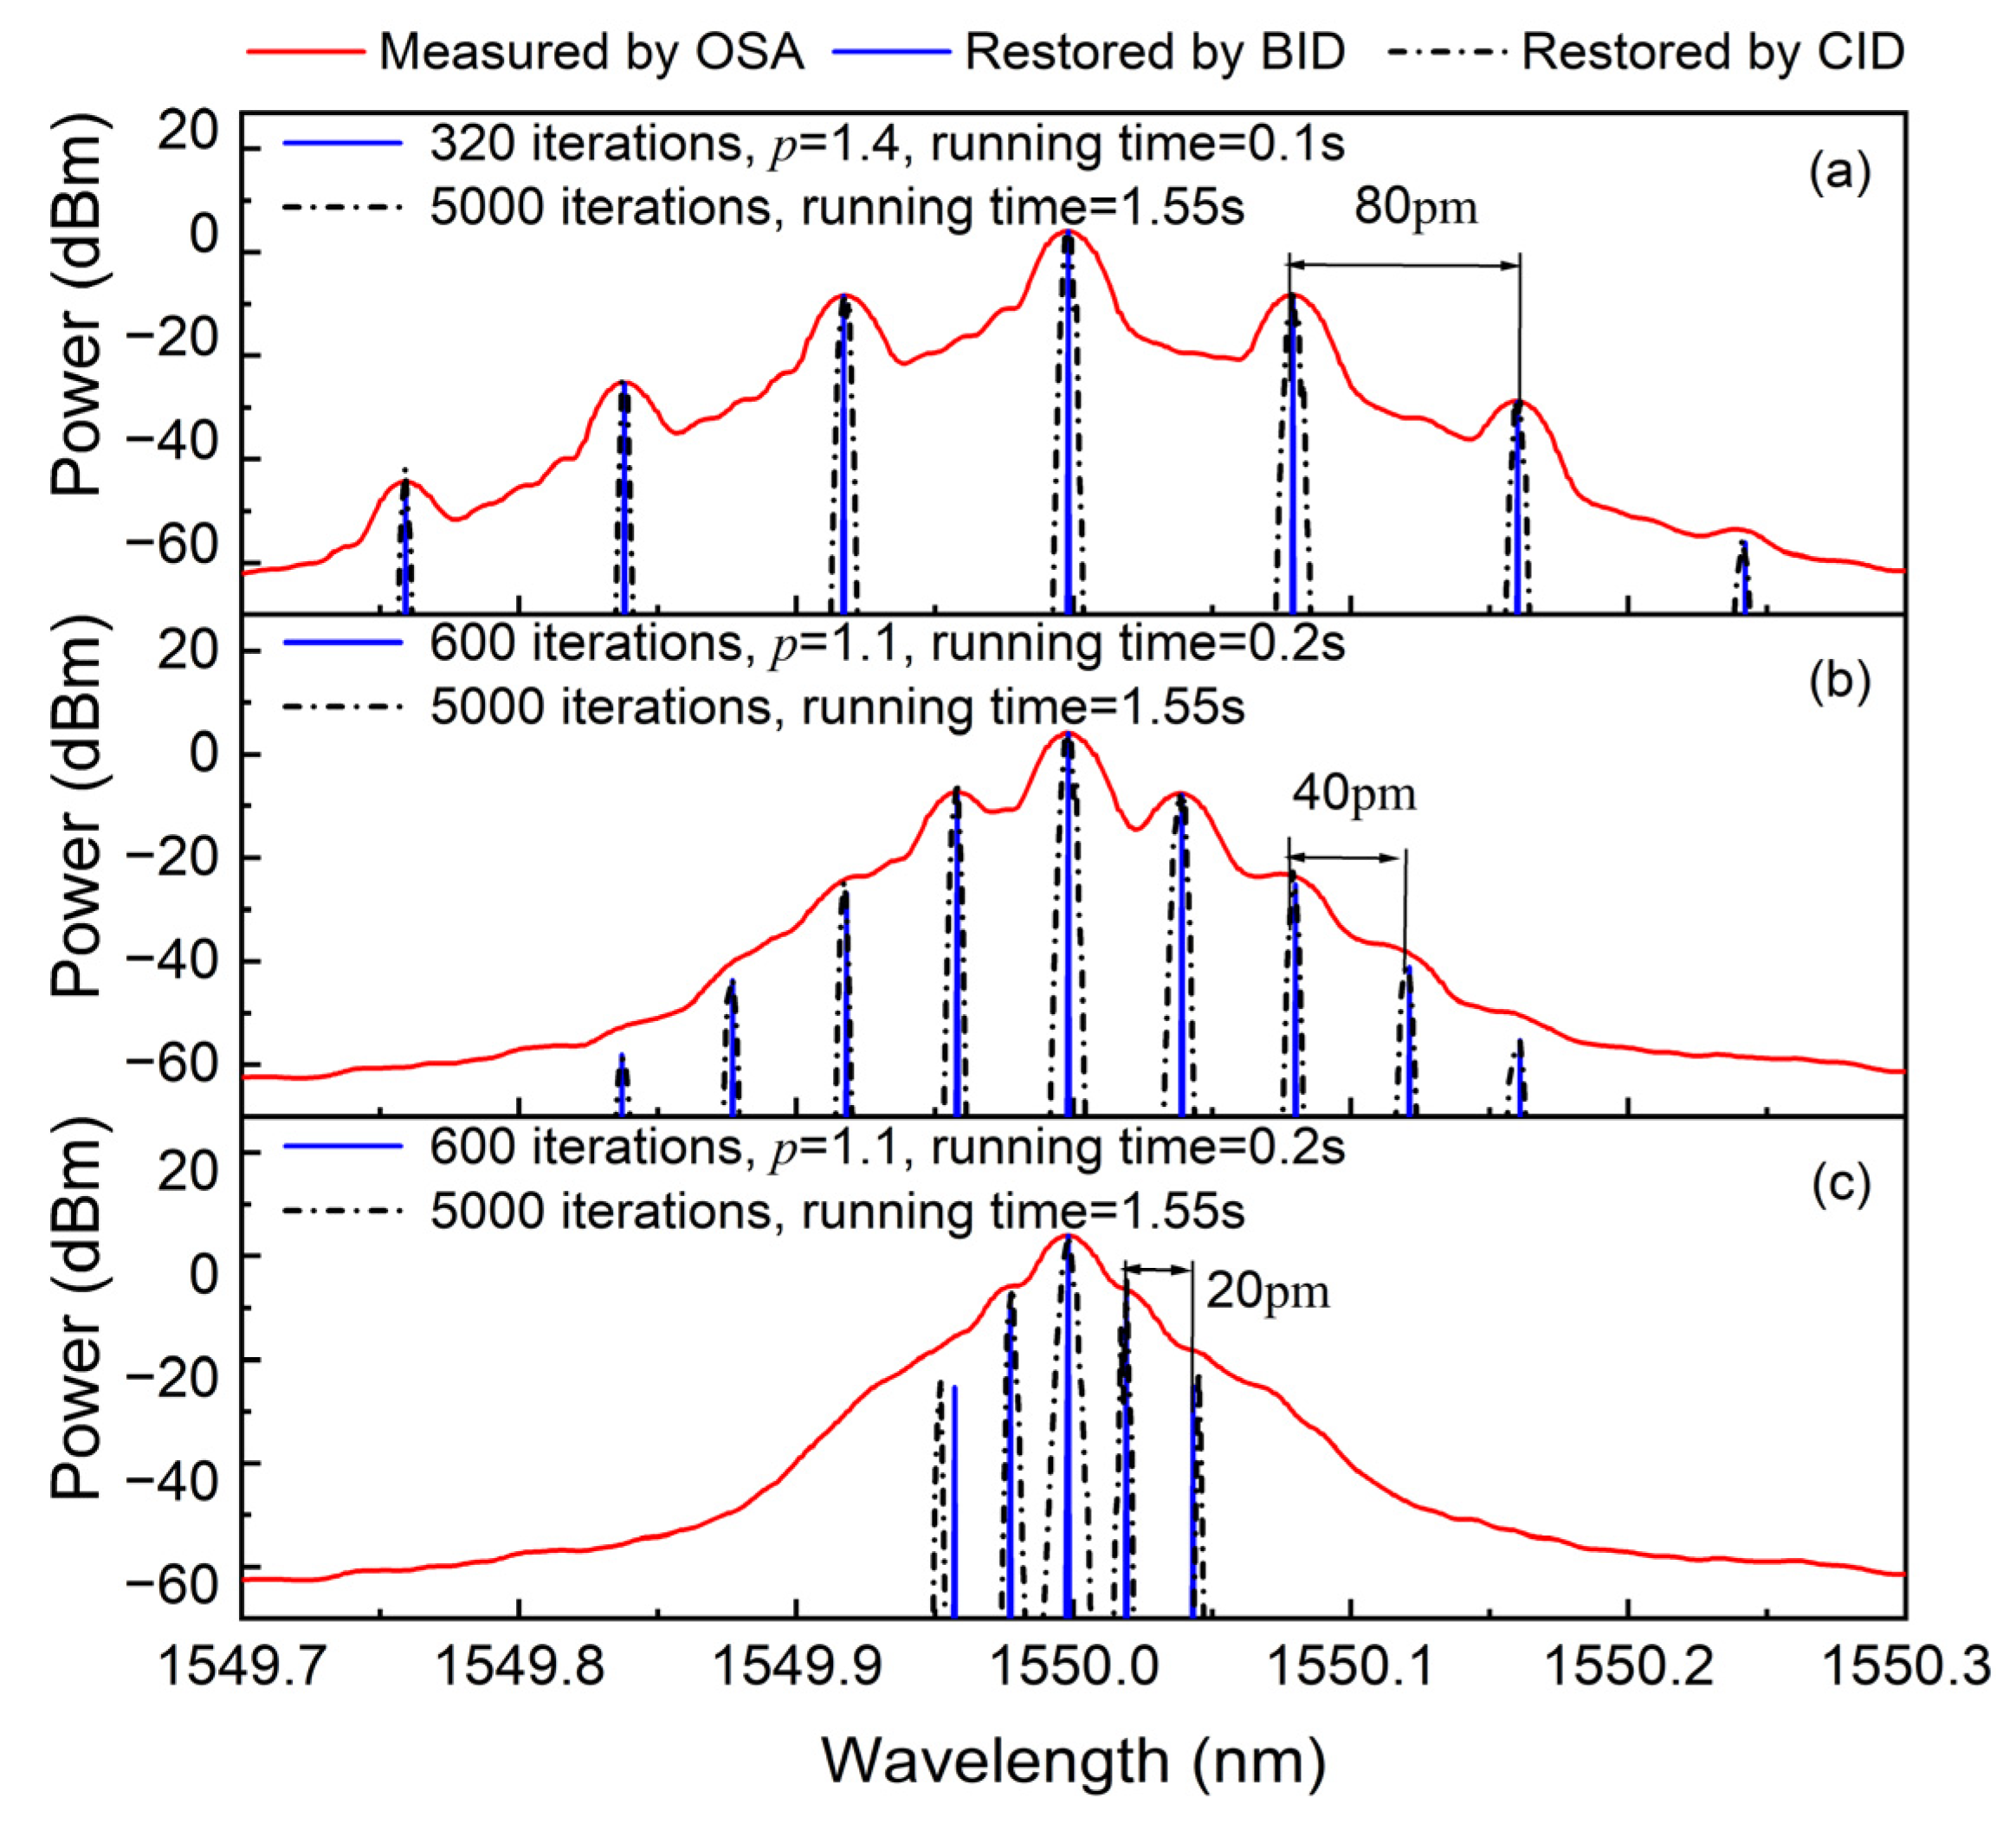
λ) corresponding to the case that the PM is under off-modulation. Then, the PM is driven by a sinusoidal-wave with an amplitude of 0.9 V. The modulation frequencies are set at 10 GHz, 5 GHz and 2.5 GHz, corresponding to the spectral line interval of 80 p.m., 40 p.m. and 20 p.m., as shown in
Figure 6a–c.
To highlight the fast and accurate convergence of the BID method, the intrinsic modulation spectrum is restored by the BID and CID methods, respectively, for comparison, as shown in
Figure 6a–c. We firstly apply the iterative deconvolution on the measured modulation spectrum with 80 p.m. interval. As shown in
Figure 6a, it is obvious that the restored intrinsic modulation spectrum
xm(
λi) with the BID method shows extremely narrow linewidth with fast convergence to the
δ-functions after only 320 iterations, while the restored spectrum with the CID method exhibits much rough linewidth with slow convergence, even after 5000 iterations. We can also observe similar phenomena when performing the iterative deconvolution for the measured modulation spectrum with a 40 p.m. interval, where the BID method requires only 600 iterations for convergence to the intrinsic
δ-function spectrum. According to the Rayleigh criterion, a modulation spectrum with spectral line interval of 20 p.m. cannot be directly resolved by the OSA, as shown in
Figure 6c, due to the non-iso-intensity. Nevertheless, the intrinsic modulation spectrum is successfully restored with the BID method after only 600 iterations. In contrast, the CID method leaves unresolved spectrum with obvious cross talk even after 5000 iterations. Therefore, our method can improve the resolution of OSA, and it is necessary to introduce the boosting operation in the conventional iterative process.
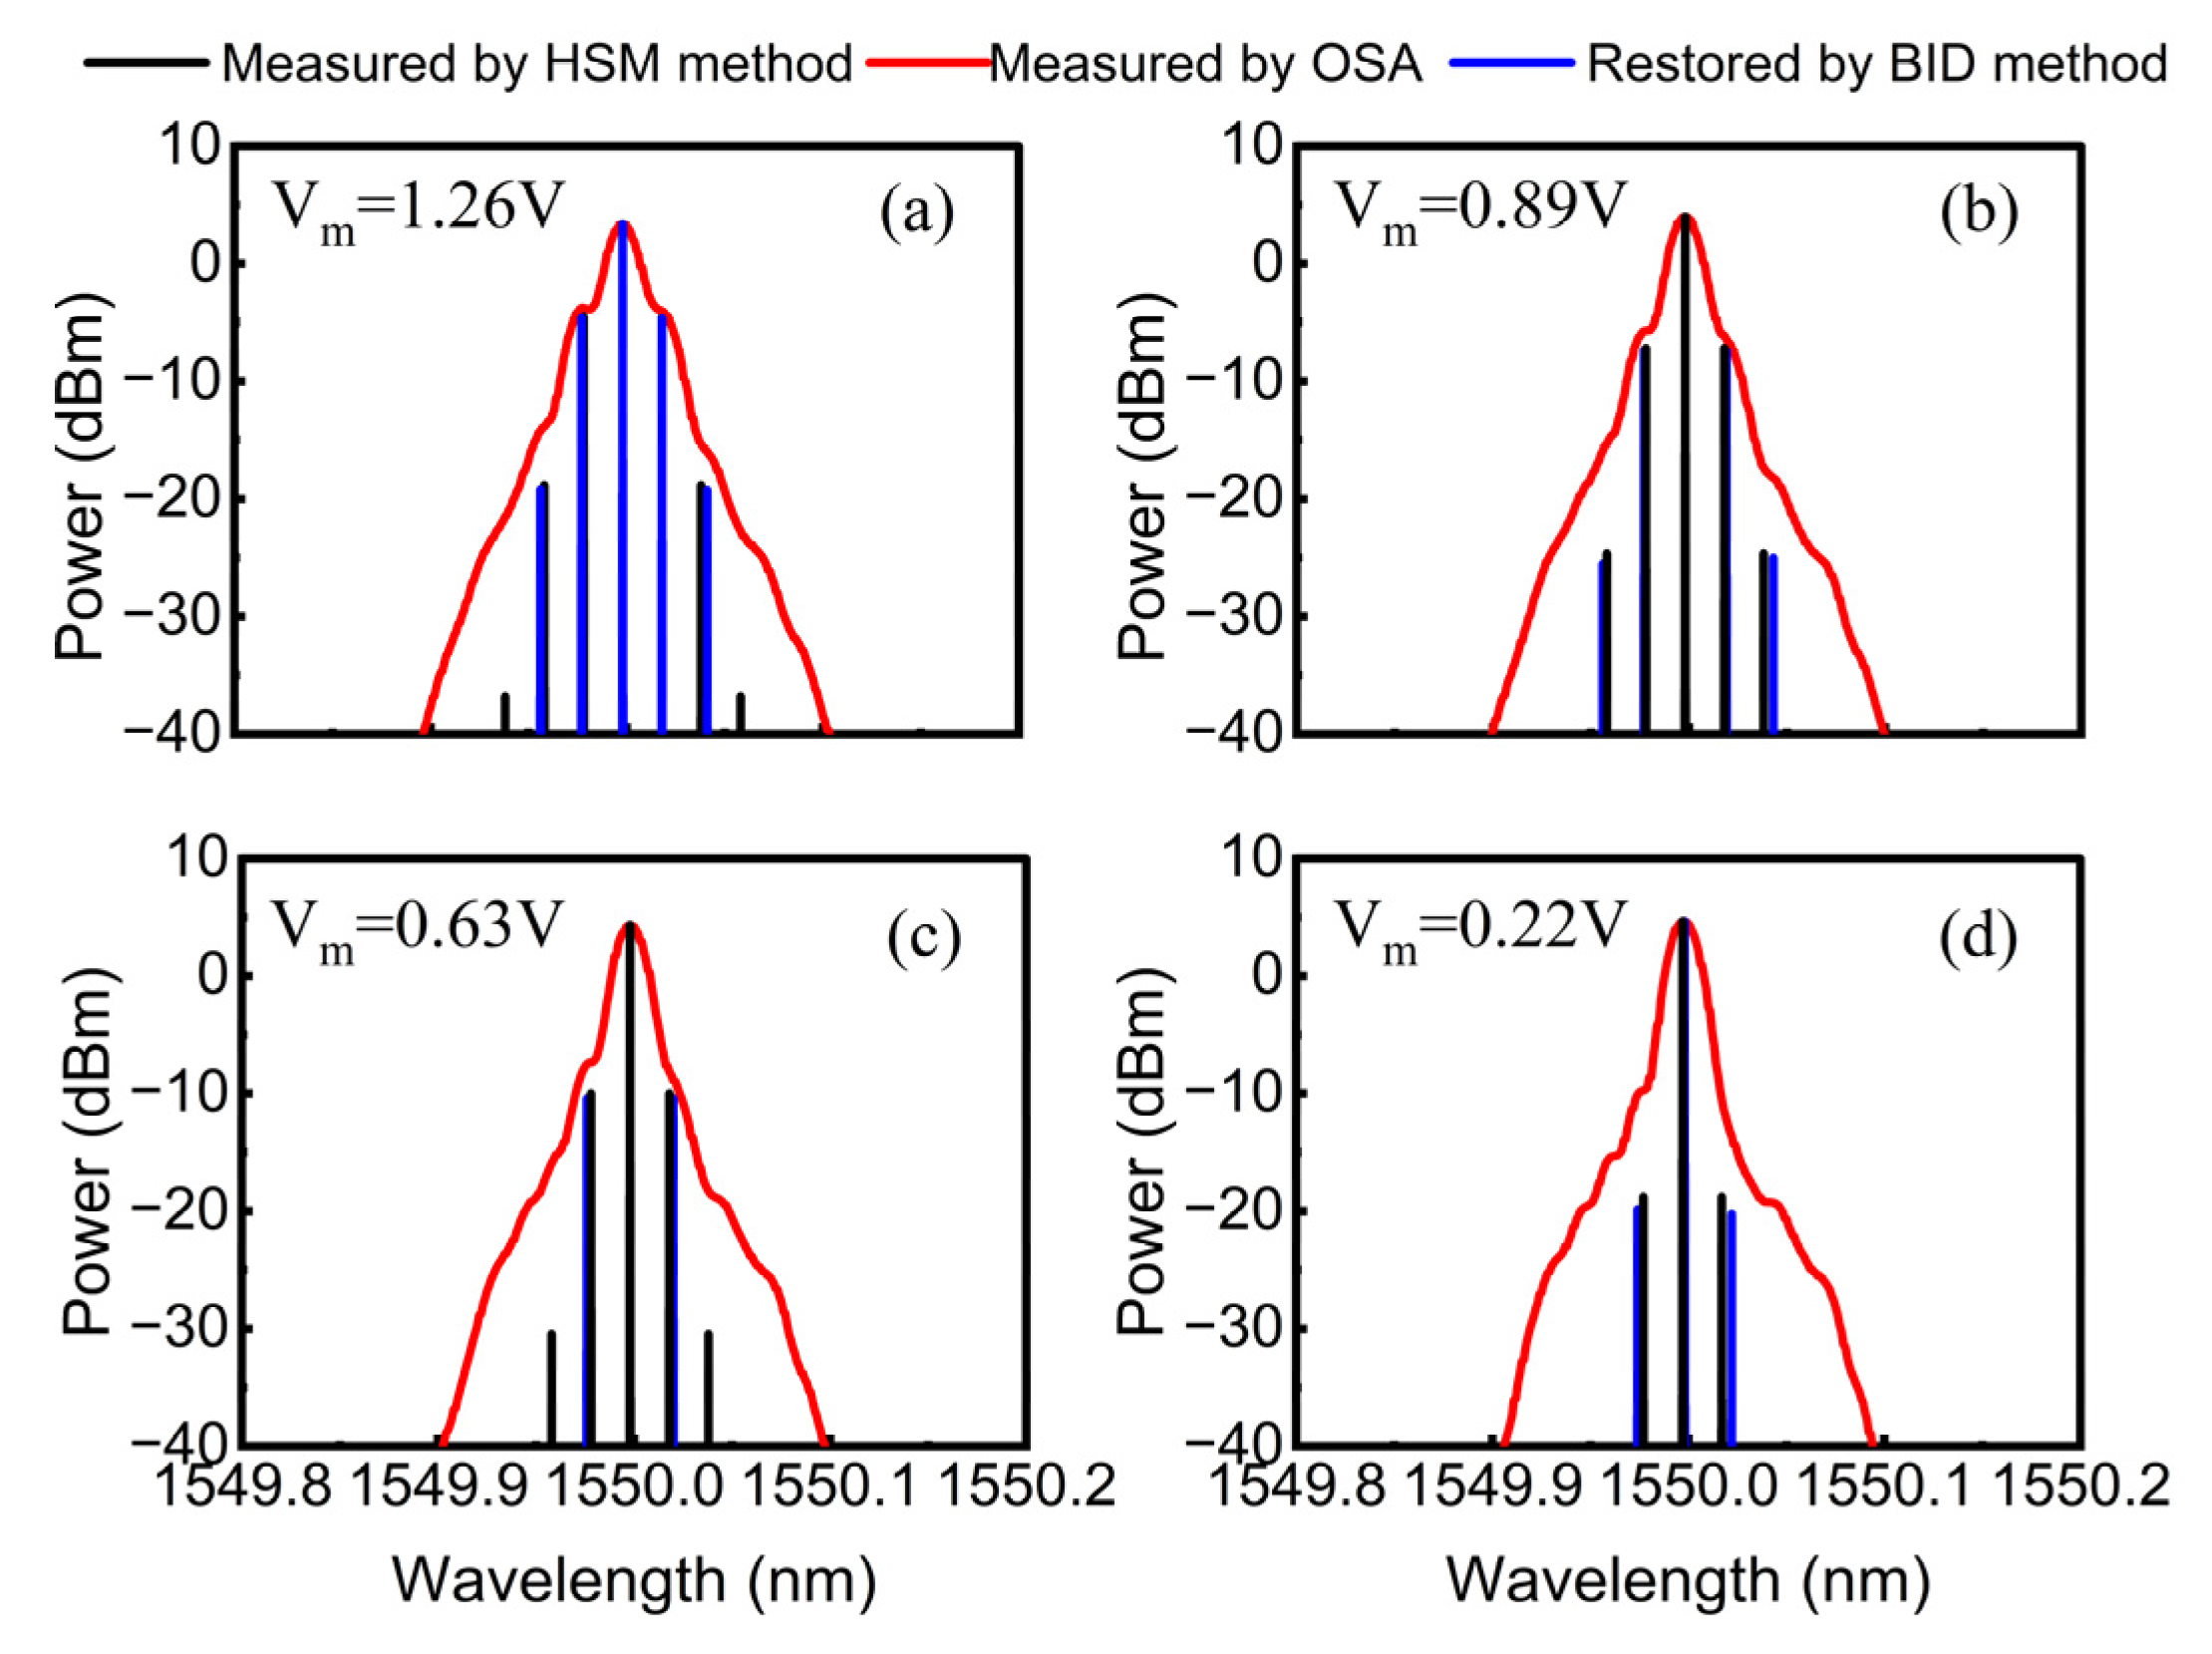
For the resolution, we investigate the BID method for resolving the measured modulation spectrum with different relative intensity, which is obtained by changing the driving amplitude of the PM.
Figure 7a–d illustrate the OSA-measured and BID-recovered modulation spectra under driving amplitudes of 1.26 V, 0.89 V, 0.63 V and 0.22 V, corresponding to the relative intensity of the first-order sideband with respect to the carrier of 0.16 (−7.86 dB), 0.076 (−11.2 dB), 0.037 (−14.3 dB) and 0.004 (−24 dB) at the modulation frequency of 2.5 GHz. For comparison, we also construct a frequency-shifted heterodyne interferometer to measure the intrinsic modulation spectra. As the heterodyne spectrum mapping (HSM) method does not require an OSA, it avoids the resolution limitation resulting from the PSF of OSA. The measured modulation spectral lines based on HSM method are also shown in
Figure 7, which can be taken as a reference. As can be observed, the smaller the driving amplitude, the lower the relative intensity of the sideband with respect to the carrier, but no matter what relative intensity is involved, the spectral lines that are hardly resolved by the OSA can still be resolved by using the BID method. For example, the resolution of OSA is reduced to 67 p.m. in the case of the driving amplitude 0.22 V, and it is worth noting that the BID method is still capable of resolving these completely submerged spectral lines. To further analyze the resolution of BID method, we investigate its resolution as a function of relative intensity and compared with that of OSA. As shown in
Figure 1, the BID method improves the resolution of OSA by 10–30 p.m. at different relative intensities, with a best resolution of 10 p.m. in the iso-intensity case. It should be noted that the resolution of BID is almost constant as the relative intensity changes from 0.1 to 10, which is mainly limited by the OSA’s sampling resolution of 1 p.m.
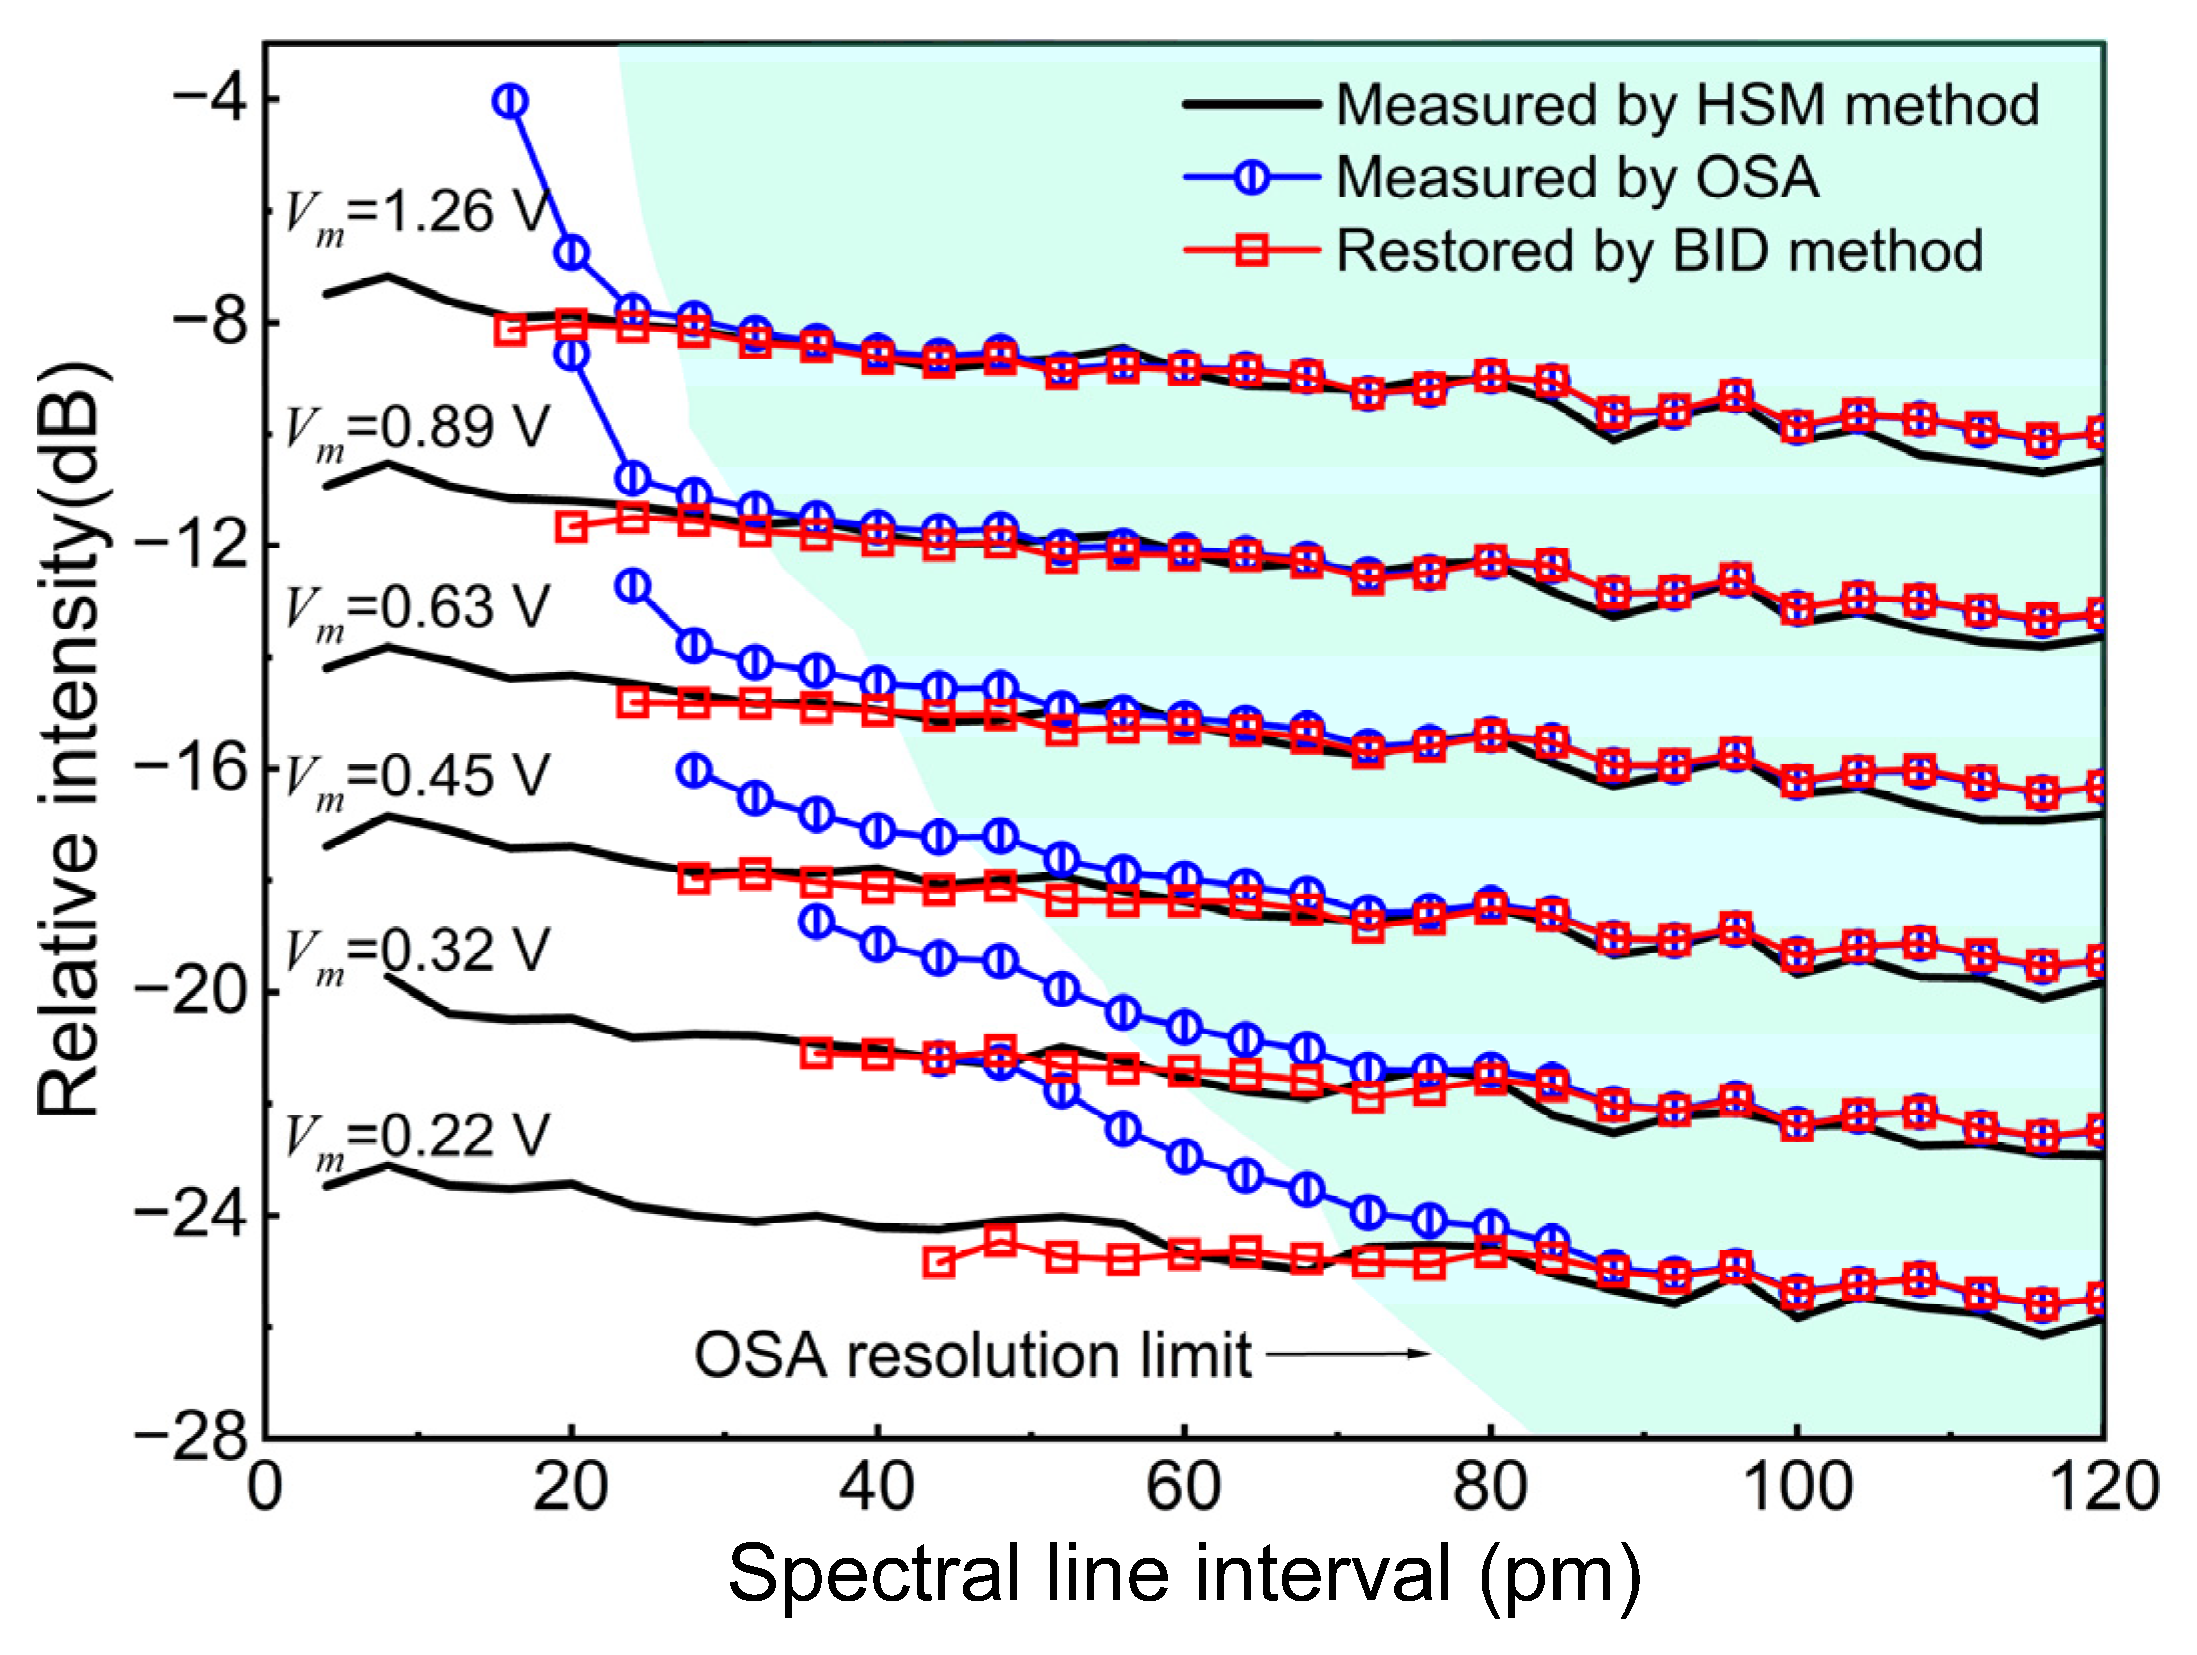
To analyze the accuracy of the intensity of the modulated sideband recovered by the BID method, we take the HSM method as a reference and make performance comparisons between the BID method and the OSA method. As illustrated in
Figure 8, the relative intensity of the first-order sideband with respect to the carrier obtained with these three methods are basically consistent when the spectral line interval is much larger than the resolution limit of the OSA. With the decrease in the spectral line interval close to the resolution limit of the OSA, large measurement error occurs by using the OSA method due to the influence of PSF broadening, and the lower the driving amplitude of the PM, the bigger the error, which is shown by the deviation from the results of the HSM method. In contrast, the results obtained with the BID method can still be in good agreement with those obtained with the HSM method. In addition, as the spectral line interval further decreases to under the resolution limit of the OSA, the OSA-indistinguishable spectral lines can still be restored by the BID method with accurate relative intensities. The above results show that the BID method can significantly improve the measurement accuracy of the relative intensity of the sidebands when the spectral line interval is close to the resolution limit of the OSA, and improve the measurement resolution of adjacent spectral lines with different relative intensity. For the wavelength accuracy, we investigate the wavelength error of the first-order sideband restored by BID method. The wavelength errors with different relative intensities and spectral line intervals are all less than 2 p.m.
4. Discussion and Conclusions
The measurement of electro-optic modulation spectra is critical to the characterization and optimization of MODs. However, the measured modulation spectrum has a limited resolution due to the PSF of OSA. In addition, the OSA method is demonstrated to introduce large errors into the intensities due to the influence of PSF broadening when the spectral line interval is close to the resolution limit of the OSA. The HSM method provides a high-resolution and high-precision measurement method. However, it needs to build an extra complex structure. The BID method we propose does not need extra complex structures but an OSA, providing a simpler choice. In terms of the iterative algorithm, the BID greatly accelerates the convergence speed of iteration and guarantees the convergence to δ-functions, providing a higher resolution than CID.
In summary, the point spread function becomes a major roadblock when a grating-based OSA is operated at around the diffraction limit, affecting the measurement resolution and accuracy. We propose a method based on boosted iterative deconvolution to eliminate the point spread function of the OSA and reconstruct the intrinsic δ-function modulation spectrum. The proof-of-concept experiment demonstrates that our method can improve the resolution of OSA by 10–30 p.m. at different relative intensities, with a best resolution of 10 p.m. in the iso-intensity case and wavelength errors of less than 2 p.m. Furthermore, our method can eliminate the errors due to the influence of PSF broadening when the spectral line interval is close to the resolution limit of the OSA.


