1. Introduction
Surface plasmon polaritons (SPPs) are unique electromagnetic waves generated by the interaction of free electrons and photons. The main characteristics of SPPs are different from other electromagnetic waves: the excitation of SPPs will generate a solid light field in the range of 0–10 nm on the metal surface. They can travel tens of nm along the intersection between metal and insulation [
1,
2,
3,
4]. Based on these characteristics, SPPs combined with new nanotechnology will further promote the nano integration of optical devices, including, for example, more mature devices, such as optical switches and beam splitters [
5,
6]. At the same time, in the plasma system, the optical phenomenon is multifarious and includes the Fano resonance phenomenon, which, due to its spectral characteristics (acute and asymmetric), attracts the widespread attention of researchers. Further research found that it is sensitive to the medium and the refractive index change. This research provides a new direction for the sensor and shows the special significance of the sensor field [
7,
8,
9].
A variety of structures can generate SPPs. Metal-insulation-metal (MIM) waveguides have the following characteristics: simple structure, strong anti-electromagnetic interference performance, and flexible coupling with various structures [
10,
11,
12]. Based on this, and combined with the outstanding advantages of Fano resonance, many scholars, in recent years, improved resonator structure by coupling it with a MIM waveguide to excite the Fano resonance curve with good effect [
13,
14,
15,
16]. For example, Qiao et al. proposed an m-shaped resonator structure coupled to a waveguide with a baffle, for which the final performance can reach 780 nm/RIU, and the system’s figure of merit (
) can reach more than 80 [
17]. Ren et al. proposed a ring resonator structure with side opening short-bar waveguide coupling. After simulation, the sensitivity of this device reached 1400 nm/RIU [
18]. Yang et al. proposed a structure composed of a MIM waveguide and a rectangular resonator with a final sensitivity of 1840 nm/RIU and a quality factor as high as 51.11 [
19].
This paper proposes a novel coupling structure consisting of a MIM waveguide with two short tubes and an internal Z-ring resonator (IZRR). Compared with most of the previous coupling structures, the above and below asymmetry of this coupling structure is the main reason for the Fano resonance splitting of the system [
20,
21]. After Fano resonance splitting, the transmission curve obtained is sharper, the system bandwidth is significantly reduced, and the figure of merit of the system is significantly improved. In addition, the influence of the remaining structural parameters in the IZRR on the Fano resonance effect and the overall performance of the sensor system was further studied and a nano-level refractive index sensor with excellent performance was finally obtained [
22,
23].
2. Materials and Methods
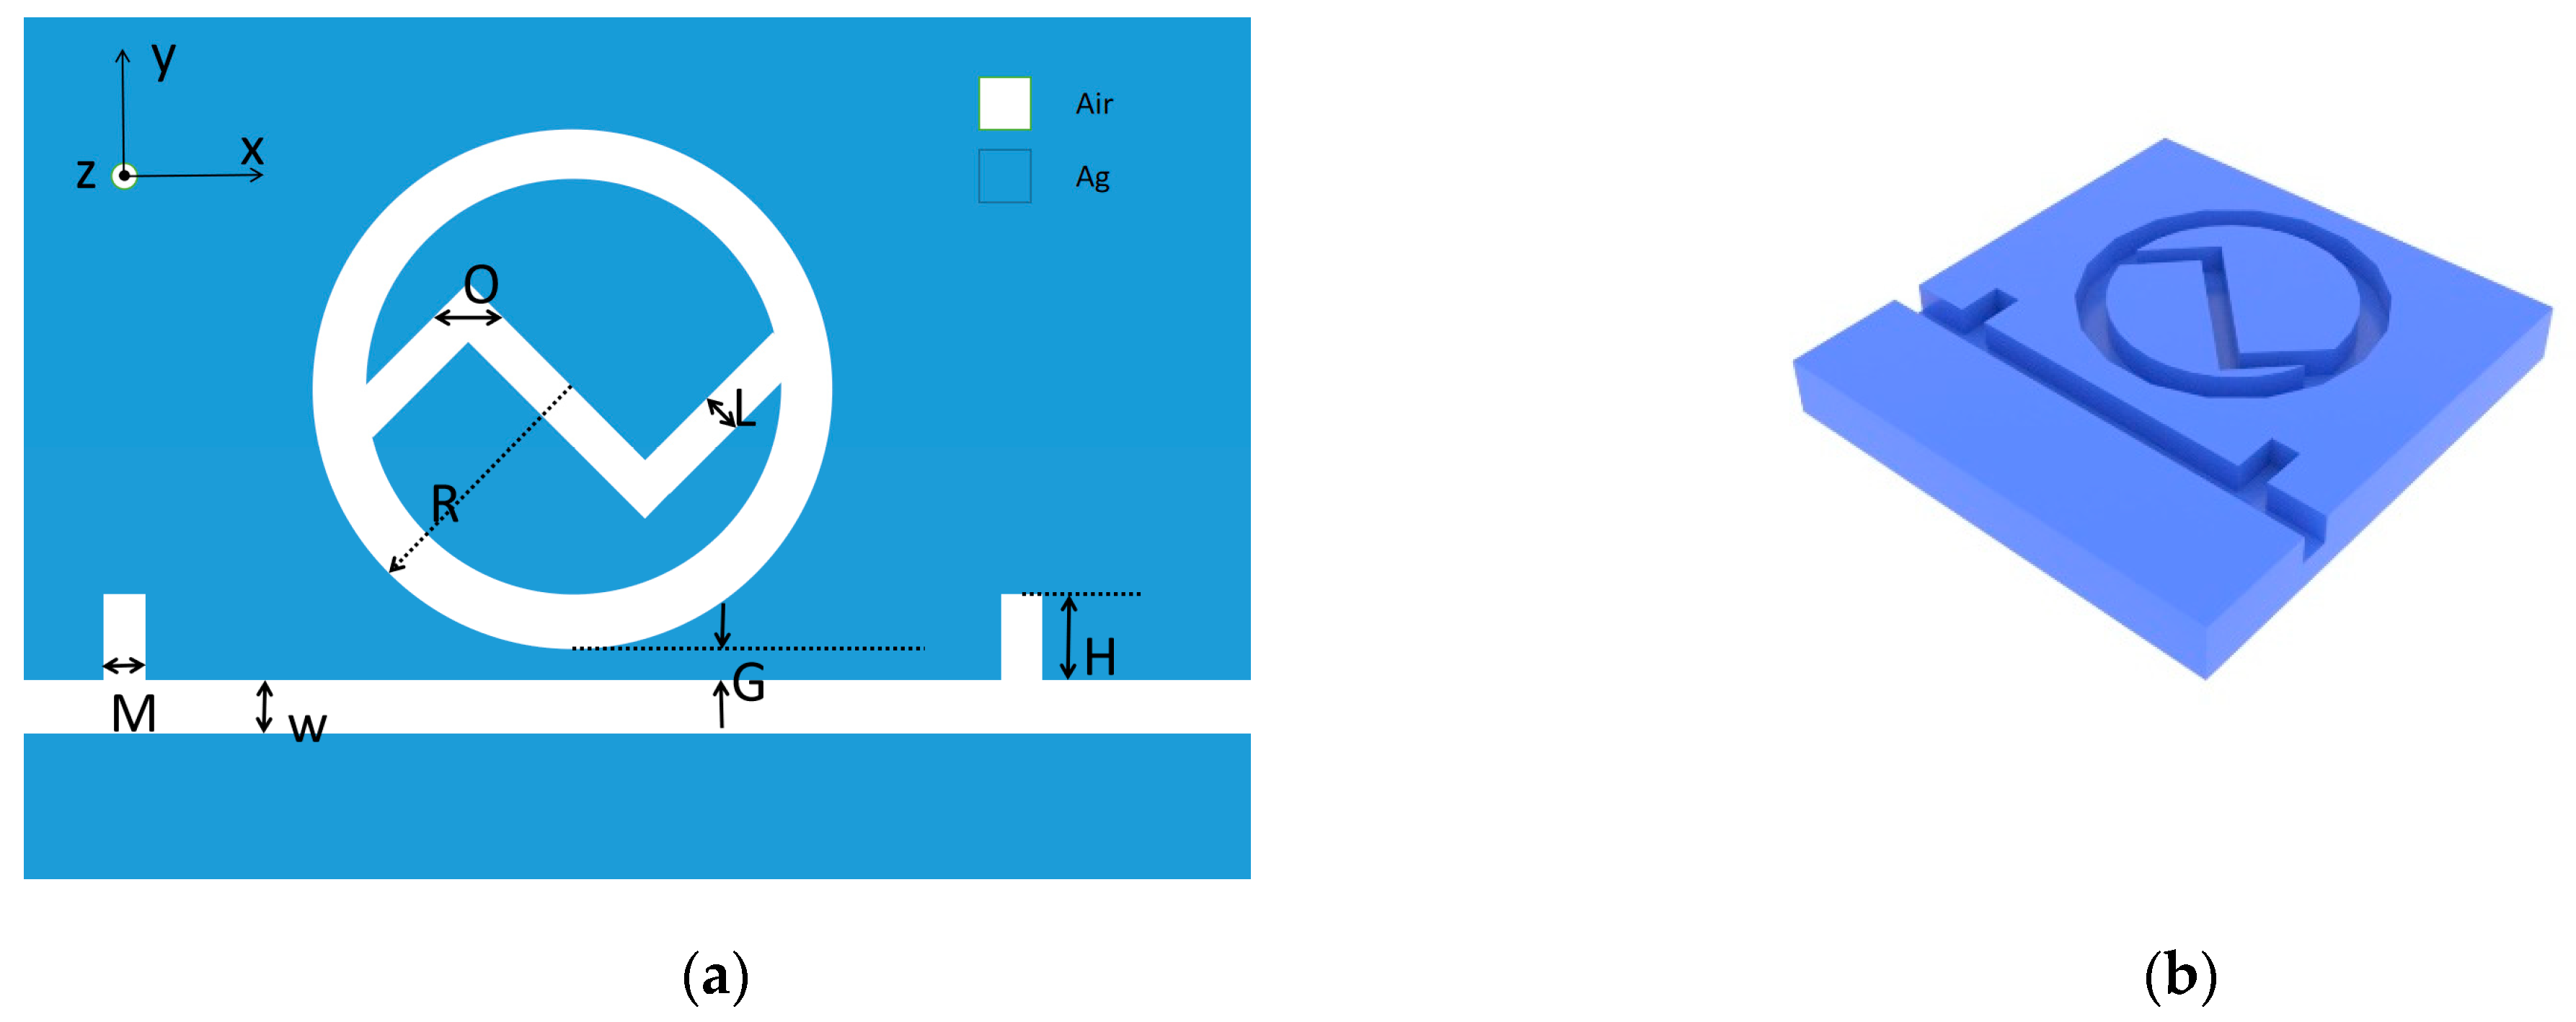
In the “COMSOL Multiphysics 5.4 Stockholm, Sweden” software, we selected the model wizard interface and built the 2D model, as shown in
Figure 1a. We constructed the 3D rendering in “3d Max Montreal, Canada”, as shown in
Figure 1b. The marks define the following parameters in the corresponding figure, where R is the radius of the outer ring of the circle, L is the distance between the upper and lower Z-structure, O is the angle of the opening of the Z-structure, G is the coupling distance between the MIM waveguide with short double tubes and the IZRR structure, M is the width of the short tube, H is the height of the short tube, and ω is the distance between the MIM waveguide. In order to ensure that the SPPs at the upper and lower interface of the waveguide could be coupled, we set
at a constant value of 50 nm in this paper [
24].
Electromagnetic waves can be characterized by two modes: transverse electric mode (TE) and transverse magnetic mode (TM), but only TM mode can excite SPPs on the surface of the metal layer. Therefore, we focused on the analysis of the TM mode and obtained the relationship between SPPs and dispersion in this mode as follows [
25]:
where
is defined as the wave vector,
is defined as the ratio of dielectric constant
to metal dielectric constant
.
. By analyzing the above equation, it can be seen that when the width of the waveguide ω is less than a particular critical value, the coupling of SPPs between the upper and lower interfaces of the waveguide can be guaranteed. In the 2D structure shown in the figure, the primary material in the blue part is Ag, and the white part is air, the dielectric constant value of which is 1. As for the dielectric constant of the metal materials, this will vary due to the frequency of the incident light. Therefore, we imported silver’s dielectric constant via Drude’s modified model. The specific formula is as follows [
26,
27]:
In the equation, the values of parameters are described as follows: relative permittivity of infinite frequency , static permittivity , relaxation time , and conductivity .
Surface plasmonic devices are typically sub-wavelength in size and require micro and nano-processing techniques. The MIM waveguide structure is easily fabricated and is created by the chemical vapor deposition of 100 nm of silver onto a silicon dioxide substrate. Other structures can be etched onto the silver layer by electron beam etching, and the remaining silver layer can be removed by chemical etching with dilute nitric acid and water.
The above relevant conditions are determined, various coupling structures are drawn in “COMSOL Multiphysics 5.4 Stockholm, Sweden”, and the coupling effect curve is obtained in the next section of this paper. It is worth noting that the MIM waveguide and IZRR parts should be precisely triangulated. The rest of the parts can be roughly divided. This paper dissects the two dimensions with some accuracy, mainly through triangular cells. In addition to the meshing, as mentioned earlier, attention needs to be paid to the specification of boundary conditions and the selection of more appropriate interpolation functions in the FEM solution. After the simulation, it is necessary to observe the curve and calculate the corresponding
and
. The sensitivity reflects the detection accuracy of the corresponding structural sensor, whereas the figure of merit reflects the overall performance of the corresponding structural sensor. The specific calculation formula is as follows [
28]:
where
represents the wavelength change,
represents the refractive index change, and FWHM represents the bandwidth [
29].
3. Results
In order to select a better coupling structure between the MIM waveguide and IZRR, the schematic diagrams and transmission curves of the complete IZRR structure, the ring structure without internal Z-structure, and the MIM waveguide with a short double tube were drawn. It is shown in
Figure 2 that the radius of the ring (R) is 240 nm, the width of the short wave (M) is 50 nm, the height of the short wave (H) is 80 nm, the spacing of the Z-structure (L) is 35 nm, and the opening angle of the Z-structure (O) is 90°. The pink dashed line in the diagram is the contour of 0.1 transmittances and 0.2 transmittances. The coupling distance between the MIM waveguide with two short tubes and the other two structures (G) is 10 nm. Observation of the red MIM waveguide curve shows that the transmittance curve is almost horizontal and has a large range of sustained bands, so we used this as the broadband mode of the Fano resonance. However, the other two structures had different inclination positions and smaller FWHMs, which can be considered to be narrowband. Therefore, both structures excite Fano resonance.
Further comparative analysis of
Figure 2: Comparing the black and blue transmission curves, it is not difficult to see that the waveform changed significantly. The number of troughs increased significantly, from a single trough to three troughs, D1, D2, and D3, and the Fano resonance split appears. That is, after the Z-structure was added, the trough curve of the system shifted to the left, as a whole, compared with that before the Z-structure was added, indicating that the sensitivity is slightly reduced. However, the bandwidth corresponding to the new trough was smaller than that of the ring structure without the Z-structure. When compared with the normalized magnetic field distribution, it is clear that the IZRR magnetic field deepens in color, i.e., the field strength increases, i.e., the IZRR has an energy aggregation effect. It can be seen that, although the sensitivity of the IZRR system described in this paper was reduced over a small range, the quality factor of the IZRR structure will be significantly improved in the end because the bandwidth value was also significantly reduced.
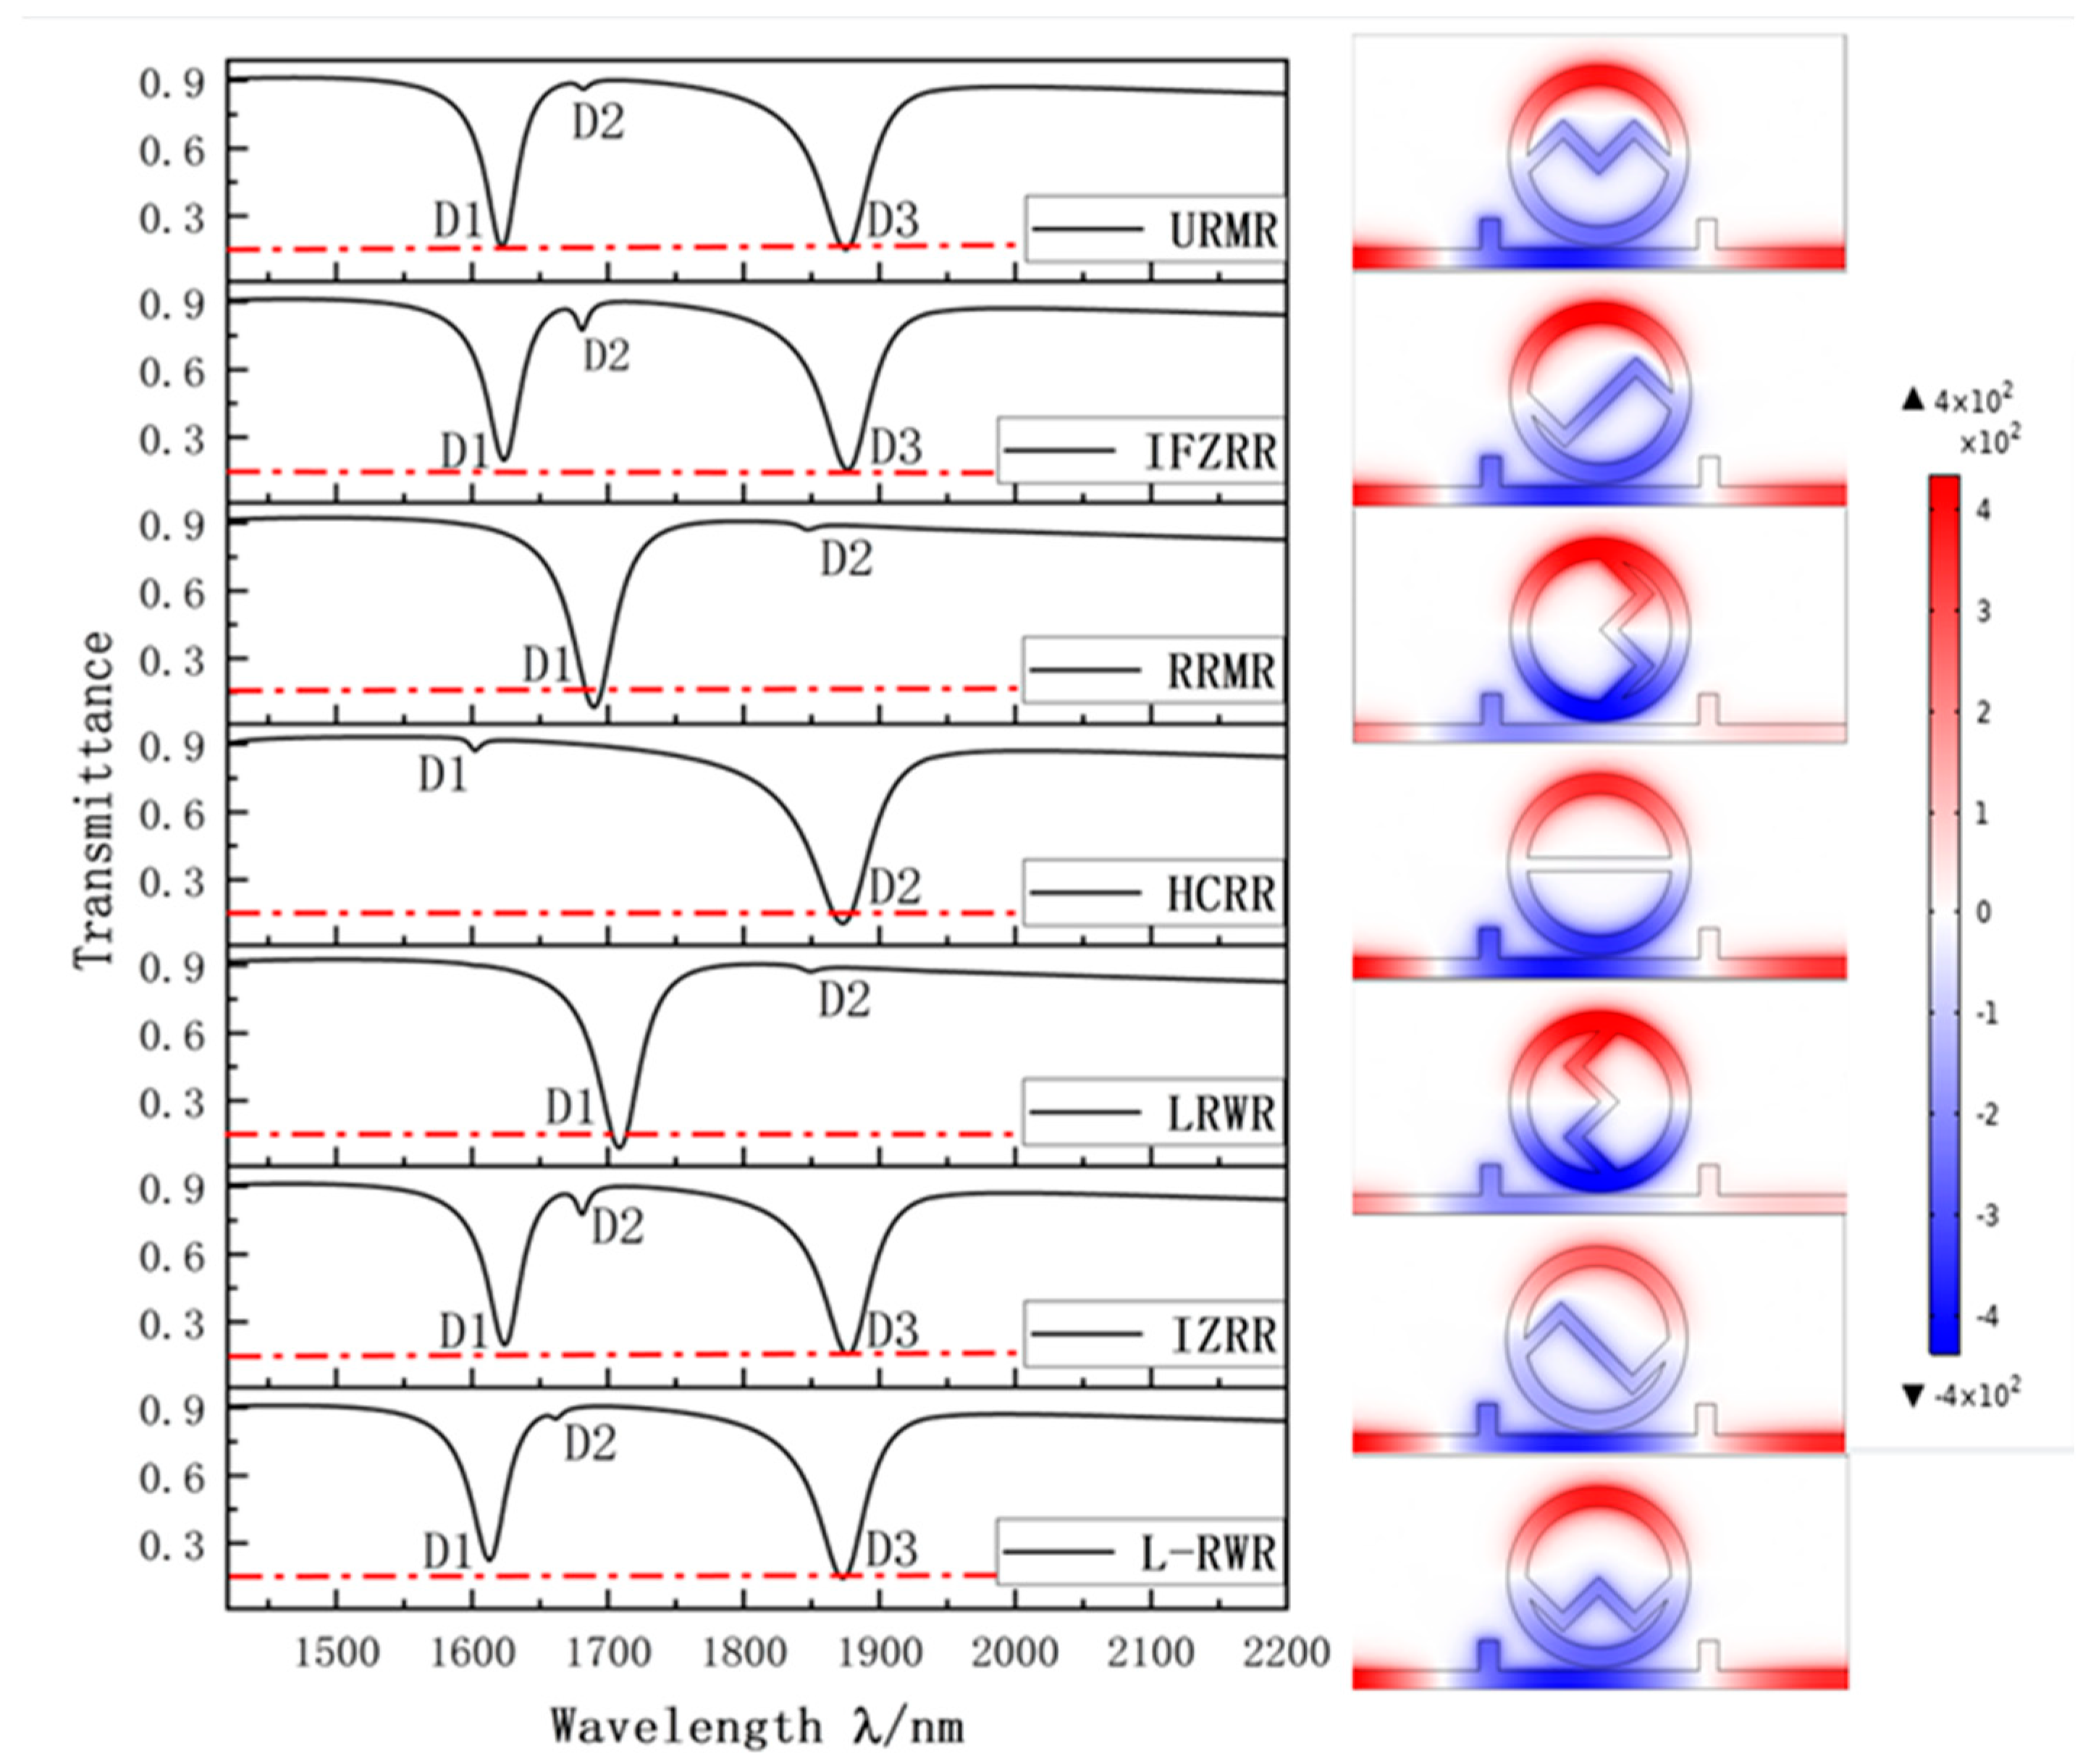
The asymmetry of the IZRR structure causes the Fano resonance splitting phenomenon. There are various types of symmetry and asymmetry that need further discussion. Is the primary influence of the systematic Fano resonance splitting phenomenon the left-right asymmetry of the structure, or the top-bottom asymmetry of the structure? Or, for IZRR structures, is the top-bottom, as well as the left-right asymmetry, the main factor? On this basis, we discuss the following derivative structures below: the upper ring with an M-shaped resonator (URMR); the lower ring connected with a W-shaped resonator (L-RWR); the internal-flipped Z-ring resonator (IFZRR); the left ring connected with a W-shaped resonator (LRWR); and the right ring connected with an M-shaped resonator (RRMR). In addition to the above, we introduce a horizontal-channel ring resonator (HCRR), with left and right, as well as upper and lower symmetry, for the convenience of comparison. Finally, the IZRR structure in this paper is combined with the above six structures to draw the transmission curve, as shown in
Figure 3 below. On the far right is a plot of the field strength distribution for D2 or D3, with the red line being the contour of the 0.15 transmittance.
The waveform curves show no Fano resonance splitting in the RMR, HCRR, and LRWR structures and no Fano resonance splitting in the HCRR because its structure is entirely symmetrical. The common denominator between the RMR and LRWR structures is that they are symmetrical from top to bottom but not from left to right. Again, comparing the URMR, HCRR, and L-RWR structures, where the analysis was not repeated with respect to HCRR, Fano resonance splitting occurs in the URMR and L-RWR structures. Finally, by comparing the three structures, IFZRR, HCRR, and IZRR, it can be observed that both IFZRR and IZRR produce Fano resonance splitting and have essentially the same graph. They have in common that they are asymmetric at the top and bottom and symmetric about the center. Based on the above, the following conclusions can be drawn: 1. Asymmetry of geometric structure will lead to Fano resonance splitting. 2. The top and bottom asymmetry of the IZRR structure is the main factor leading to the splitting of the Fano resonance. 3. When a structure is flipped from side to side, its sensing performance is not affected, which shows that its transmission curve is coincident before and after the flip.
The above is an analysis of the waveform. Next, we analyzed the Fano resonance effect in detail. It is not difficult to see that the IFZRR and IZRR have the best Fano resonance effect. In this paper, the principal analysis was of the IZRR structure. When compared with the magnetic field distribution of the other layers, it can be seen that the magnetic field strength was slightly weakened after the Fano resonance split. This was reflected in two ways: the system transmittance increased, and the color of its magnetic field distribution diminished. However, the bandwidth decreased after splitting, and the of the system improved significantly in split mode. Therefore, when the structure was not ideal, we could try to add top or bottom asymmetric structures or top and left asymmetric structures for improvement.
In order to further determine the IZRR structure with the best performance, we first changed the Z-structure angle, O, of the IZRR structure and set it to 90°, 110°, 130°, 150°, and 170°, successively. The transmission, sensitivity, and bandwidth curves were obtained, as shown in the figure. According to
Figure 4a, with the increase in angle, the first trough moved to the right, but the transmittance increased significantly. In
Figure 4b, it can be seen that the system’s overall sensitivity showed a downward trend. In
Figure 4c, it can be seen that the range of bandwidth change is small at this time, so the
value will decrease. The system always has high transmittance at the D2 trough, so the trough at D2 was not analyzed. Finally, we analyzed the D3 trough. As the angle increases, the transmission curve does not change much but, obviously, the bandwidth at 90° is smaller than the bandwidth at other angles. According to
Figure 4d, the system’s sensitivity at 90° is also at the maximum. Based on the above analysis of D1 and D3, the system’s overall performance at 90° is the best, so the angle of the Z opening in the IZRR structure is finally determined to be 90°.
In addition to the Z-structure opening angle, the ring radius, R, is also one of the critical parameters affecting the structure’s performance. We successively set the R of the IZRR structure as 200 nm, 210 nm, 220 nm, 230 nm, and 240 nm. The resulting images are shown in
Figure 5.
Obviously, with the increase in radius, the transmission curve had no noticeable shape change, but the positions of D1, D2, and D3 uniformly moved to the right. From the sensitivity curve, it can be seen that the sensitivity at D1 increased and the sensitivity at D3 also increased. When the radius changed from 230 to 240 nm, the sensitivity at D3 changed significantly, increasing by 372. In the bandwidth curve, it can be seen that the bandwidth at D1 decreased, and the transmission, seen in
Figure 5a, also decreased, but the decrease was negligible. Therefore, although the bandwidth at D1 was small, the sensing performance within the D1 interval can be used either when the transmission is not high or as a rough detection method. Compared with D1, the transmission effect of D3 was better. The
s of D3 at the corresponding radii were 45.21, 45.46, 45.32, 43.31, and 49.65, respectively. When R = 240 nm, the sensitivity reached the maximum, and the
also reached the maximum in the same group. Therefore, when selecting the radius, we should try to make R as large as possible. Consequently, based on the overall sensing performance analysis at D1 and D3, this paper selected R as 230 nm. Transmission was poor at the D2 trough and was not analyzed.
In addition to the radius, R, and the Z-structure opening angle, O, the coupling distance, G, and the distance between the upper and lower Z-structure in the IZRR structure also significantly influence the sensing performance. Firstly, the transmission conditions when G is 10 nm, 20 nm, 30 nm, 40 nm, and 50 nm were analyzed, as shown in
Figure 6a. The curve’s trough position remains unchanged as G increases. However, the curve tends to smooth out, the narrowband effect of the system continues to weaken, and the broadband effect increases significantly; this is a manifestation of the weakening of the Fano resonance. The sensing performance of the system decreases substantially. Therefore, we should choose the smaller G value so, in this paper, we selected G = 10 nm. We then set L to 35 nm, 28 nm, 21 nm, 14 nm, and 7 nm, successively, to obtain the transmission curve shown in
Figure 6b. It can be seen from the figure that, in the first four cases when L is not equal to 35 nm, the transmission performance of trough 2 is reasonable; when L = 35 nm, the transmission performance of troughs 1 and 3 is good. The sensitivity and bandwidth of the two cases were the same. In order to allow more environmental measurements, the realization of the multi-interval detection function is another outstanding advantage of the resonant splitting mode, so we finally chose L = 35 nm.
The above structural parameters have an apparent influence on the sensing performance of the system; it is the influence of the IZRR structure itself. Next, we explored the influence of a waveguide with a short double tube on the transmission performance of our structure. Varying the width and height of the short tubes, independently and in turn, gives the transmission curves shown in
Figure 7 The curves coincide and the central gap occurs in the broadband part, which has little influence on the narrowband Fano resonance. Therefore, it is possible to directly select the appropriate parameters and we consequently selected H = 80 nm and M = 50 nm.
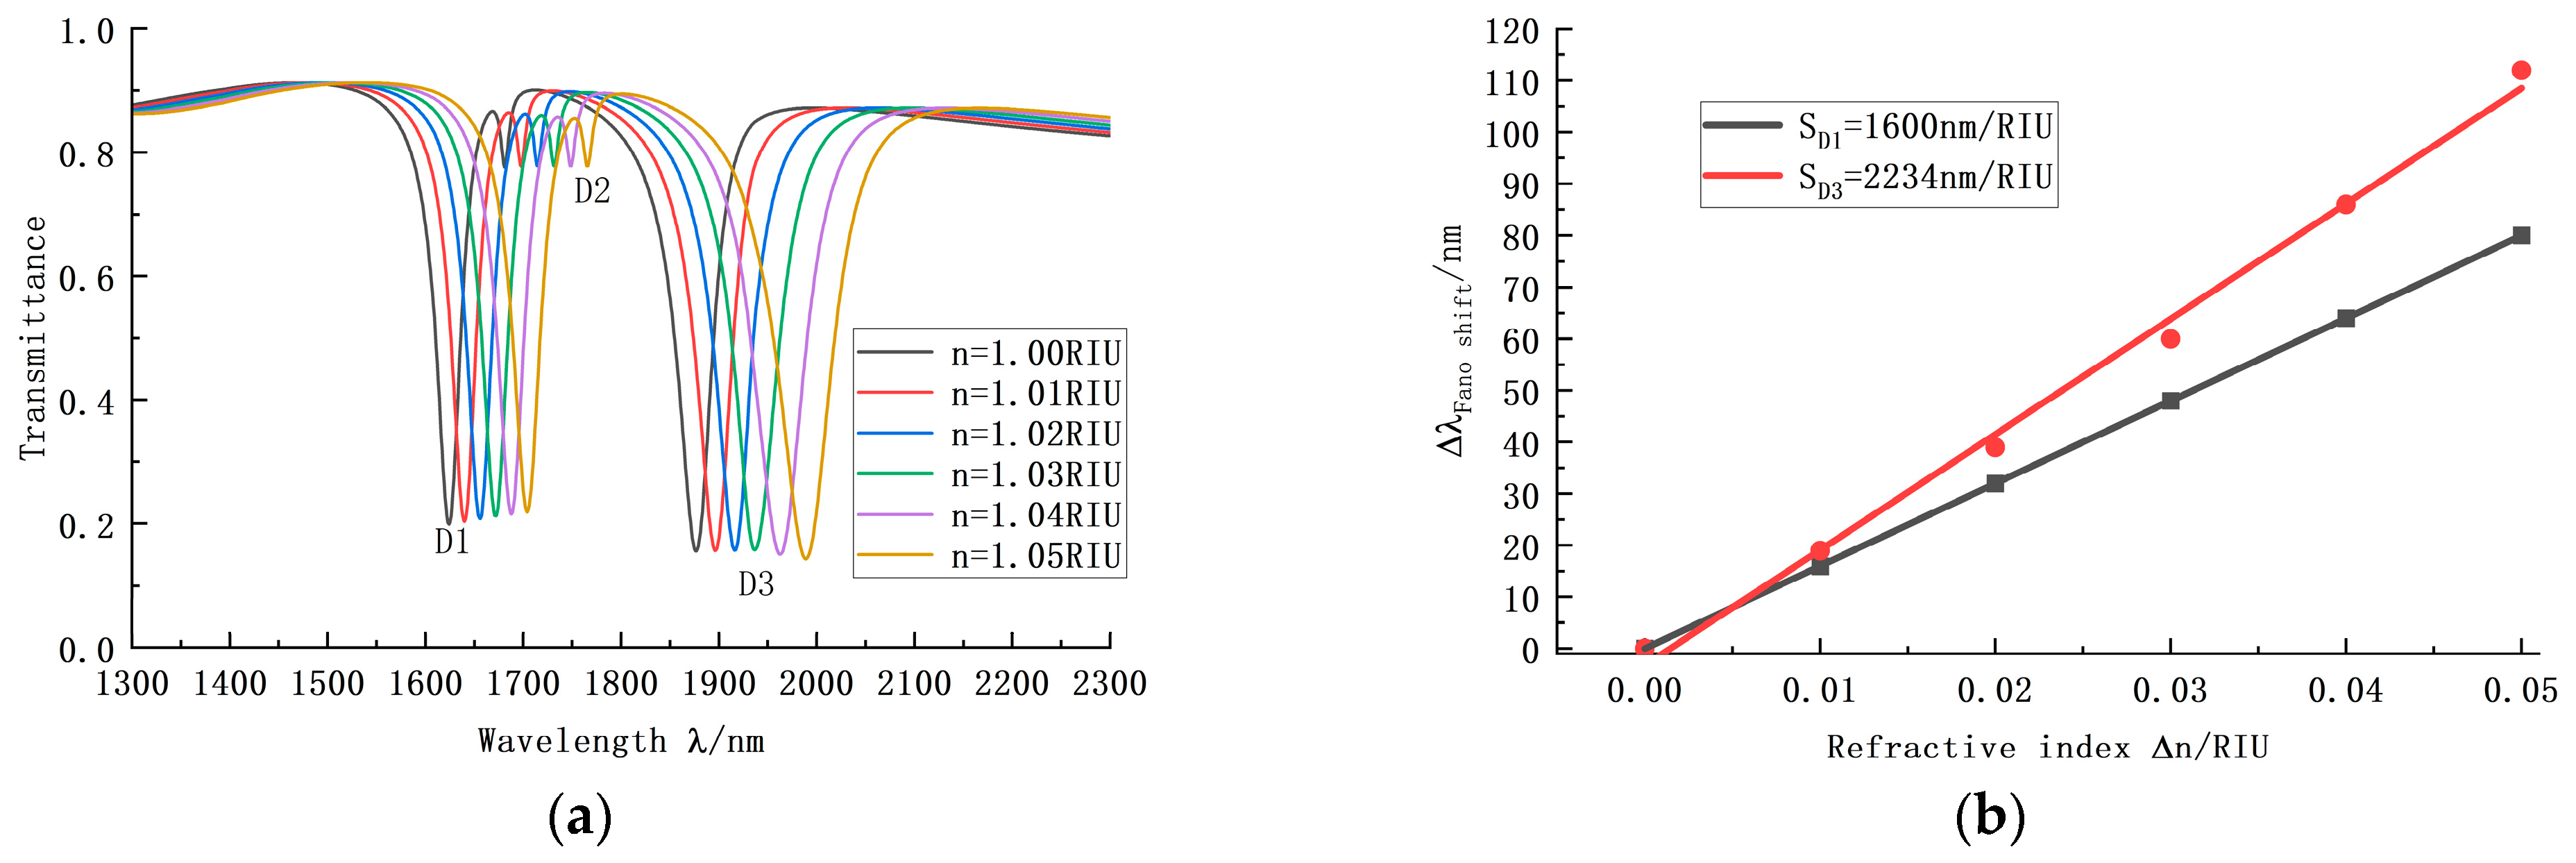
After the above process, we finally determined the IZRR structure with the best performance, which is also suitable for use in refractive index sensors. The theory of the refractive index sensor is that, as the refractive index of the system changes, the Fano resonance trough position will be red-shifted or blue-shifted.
We successively set the refractive index of the system as 1.00, 1.01, 1.02, 1.03, 1.04, and 1.05 and drew the spectral transmission lines shown in
Figure 8a,b. With an increase in refractive index, the shape of the curve was constant, but the positions of all three troughs were steadily shifted back. Among them, the D1 trough and the D3 trough had good transmission performance. Finally, at the D1 trough of the IZRR structure, the sensitivity of the refractive index sensor reached 1600 nm/RIU, the transmittance was 0.198, the bandwidth was 31, and the quality factor was 51, 61. At the D3 trough, the sensitivity of the refractive index sensor was further improved to 2234 nm/RIU, the transmittance was 0.156, the bandwidth was 45, and the quality factor was 49.65.

 ,
, 


