Article

Acquisition and Assessment of Gear Holistic Deviations Based on Laser Measurement

1
Beijing Engineering Research Center of Precision Measurement Technology and Instruments, Beijing University of Technology, Beijing 100124, China
2
Henan Key Laboratory of Mechanical Design and Transmission System, Henan University of Science and Technology, Luoyang 471003, China
3
School of Mechatronics Engineering, North China Institute of Aerospace Engineering, Langfang 065000, China
*
Authors to whom correspondence should be addressed.
Photonics 2022, 9(10), 735; https://doi.org/10.3390/photonics9100735
Submission received: 8 September 2022 / Revised: 2 October 2022 / Accepted: 5 October 2022 / Published: 8 October 2022
(This article belongs to the Special Issue Micro-Nano Optics and High-End Measurement Instruments)

Abstract

:
Line laser measurement technology is effective for obtaining the 3D point clouds of complex surfaces. Thus, a 3D gear measurement model is established in this study. All the point clouds of gear surfaces are rapidly obtained using a line laser sensor, and the holistic deviations of gear surfaces are acquired by calculating the normal errors of the gear surface. These informative and complete data include traditional gear error items and considerable valuable information that is not deconstructed. To exploit the acquired gear holistic deviations, the structured 3D model is constructed to express tooth surface errors. In this model, the control method of the statistical process is used to define highly representative assessment indicators, and a new gear accuracy assessment system is developed by selecting reasonable indicators. The measurement practice shows that this method exploits the complete information of the gear surface, including all the current accuracy assessment indicators, which can be used to expand the new assessment indicators. This method can be used to characterize the 3D topological tooth surface completely and comprehensively and realize the deep mining and extended applications of the 3D full information of gear surfaces.

1. Introduction

With the continuous advances in the application of gears, tooth surface modification has become highly complex and diverse to adapt to varied working conditions [1,2,3]. Therefore, the demand for and requirements for gear inspection are increasing. At present, the most common approach is to use the gear measurement center to inspect gears and assess the quality of tooth surfaces according to pitch, profile, and lead deviations from ISO 1328 [4]. This information provides only a few points or lines on the tooth surface and is characterized as local tooth surface information. Thus, it is not suitable to characterize and evaluate tooth surfaces with complex shapes [5,6]. It uses the aforementioned method to inspect tooth surface topology. which is not practical because of limited measuring lines and low measuring speed.
In past years, 3D measurement technologies such as line laser triangulation, laser holography, and industrial computed tomography (CT) have been rapidly developed [2]. These methods can efficiently provide all the 3D information of a gear surface. This information presents the characteristics of rich information and complete data, which include traditional gear error items and valuable information that has not been deconstructed [7,8].
Gear line laser measurement is highly efficient and suitable for the large-scale detection of gears [9,10]. It can easily be integrated with a traditional contact measurement scheme, which is convenient for measurement by switching the techniques, such as the 300 GMSL introduced by Gleason [11,12]. Hexagon [13,14] and Vantage3D [15] have developed respective gear online inspection systems with multi-line laser sensors. Multiple line laser sensors are arranged along the circumference. The complete gear profile can be quickly scanned when the position and attitude of sensors remain constant. For the gear line laser measurement, however, key factors that affect the measurement accuracy include the incidence angle control in the steep root area, occlusion of adjacent tooth surfaces, secondary reflection of light, multi-sensor fusion, and data splicing [2,16]. Gear laser holography measurement is a type of relative estimation. Constructing a virtual digital reference tooth surface is crucial [17]. Fraunhofer IPM has developed a gear measuring device based on digital multi-wavelength holographic technology [18]. It can be used to generate various synthetic wavelengths through multiple narrowband lasers, with a measurement range of submicron to millimeter and rich measurement data points. For the gear laser holography measurement, obtaining complete information on gear surfaces is difficult because of tooth occlusion. The larger the helical angle of the gear is, the more prominent the problem is. Additionally, problems, such as the gear installation position and adaptive compensation of optical systems, limit the application of this method. CT measurement presents a unique advantage for gears [2,19]. There is no blind corner and no light blocking. One measurement can provide information, including the internal size, external size, the shape of the gear, defects, and all the errors related to the gear’s accuracy. This method can also be used to solve the difficult problems of gear measurability [20], such as the measurement of small module internal gears, micro gears, new profile gears, and complex gears with unknown parameters. However, the measuring accuracy of this technique is limited to 10 μm. Low accuracy is the main limitation of gear CT measurement.
The aforementioned solutions exhibit their respective advantages and disadvantages, but they remain mainstream for the development of holistic deviation measurement for gears [2]. Complete information on gear surfaces has been obtained. How to use this information to analyze and evaluate the real topological tooth surface of gears and how to better mine and apply this information to give full play to its more useful value remains key problems [11,21,22].
In this paper, a method based on line laser measurement for the acquisition and assessment of gear holistic deviations is proposed. The gear 3D measuring model based on line laser is established. According to the coordinate transformation criterion, the complete point clouds of all the gear tooth surfaces can be spontaneously obtained. Moreover, by calculating the normal errors of the tooth surface, gear holistic deviations of the tested gears can be obtained. In the structured 3D model, new assessment indicators are defined and calculated to express tooth surface errors. The control method of the statistical process is used to analyze the whole tooth surface. This method includes traditional gear quality assessment and can be used to expand the 3D assessment indexes of gears.

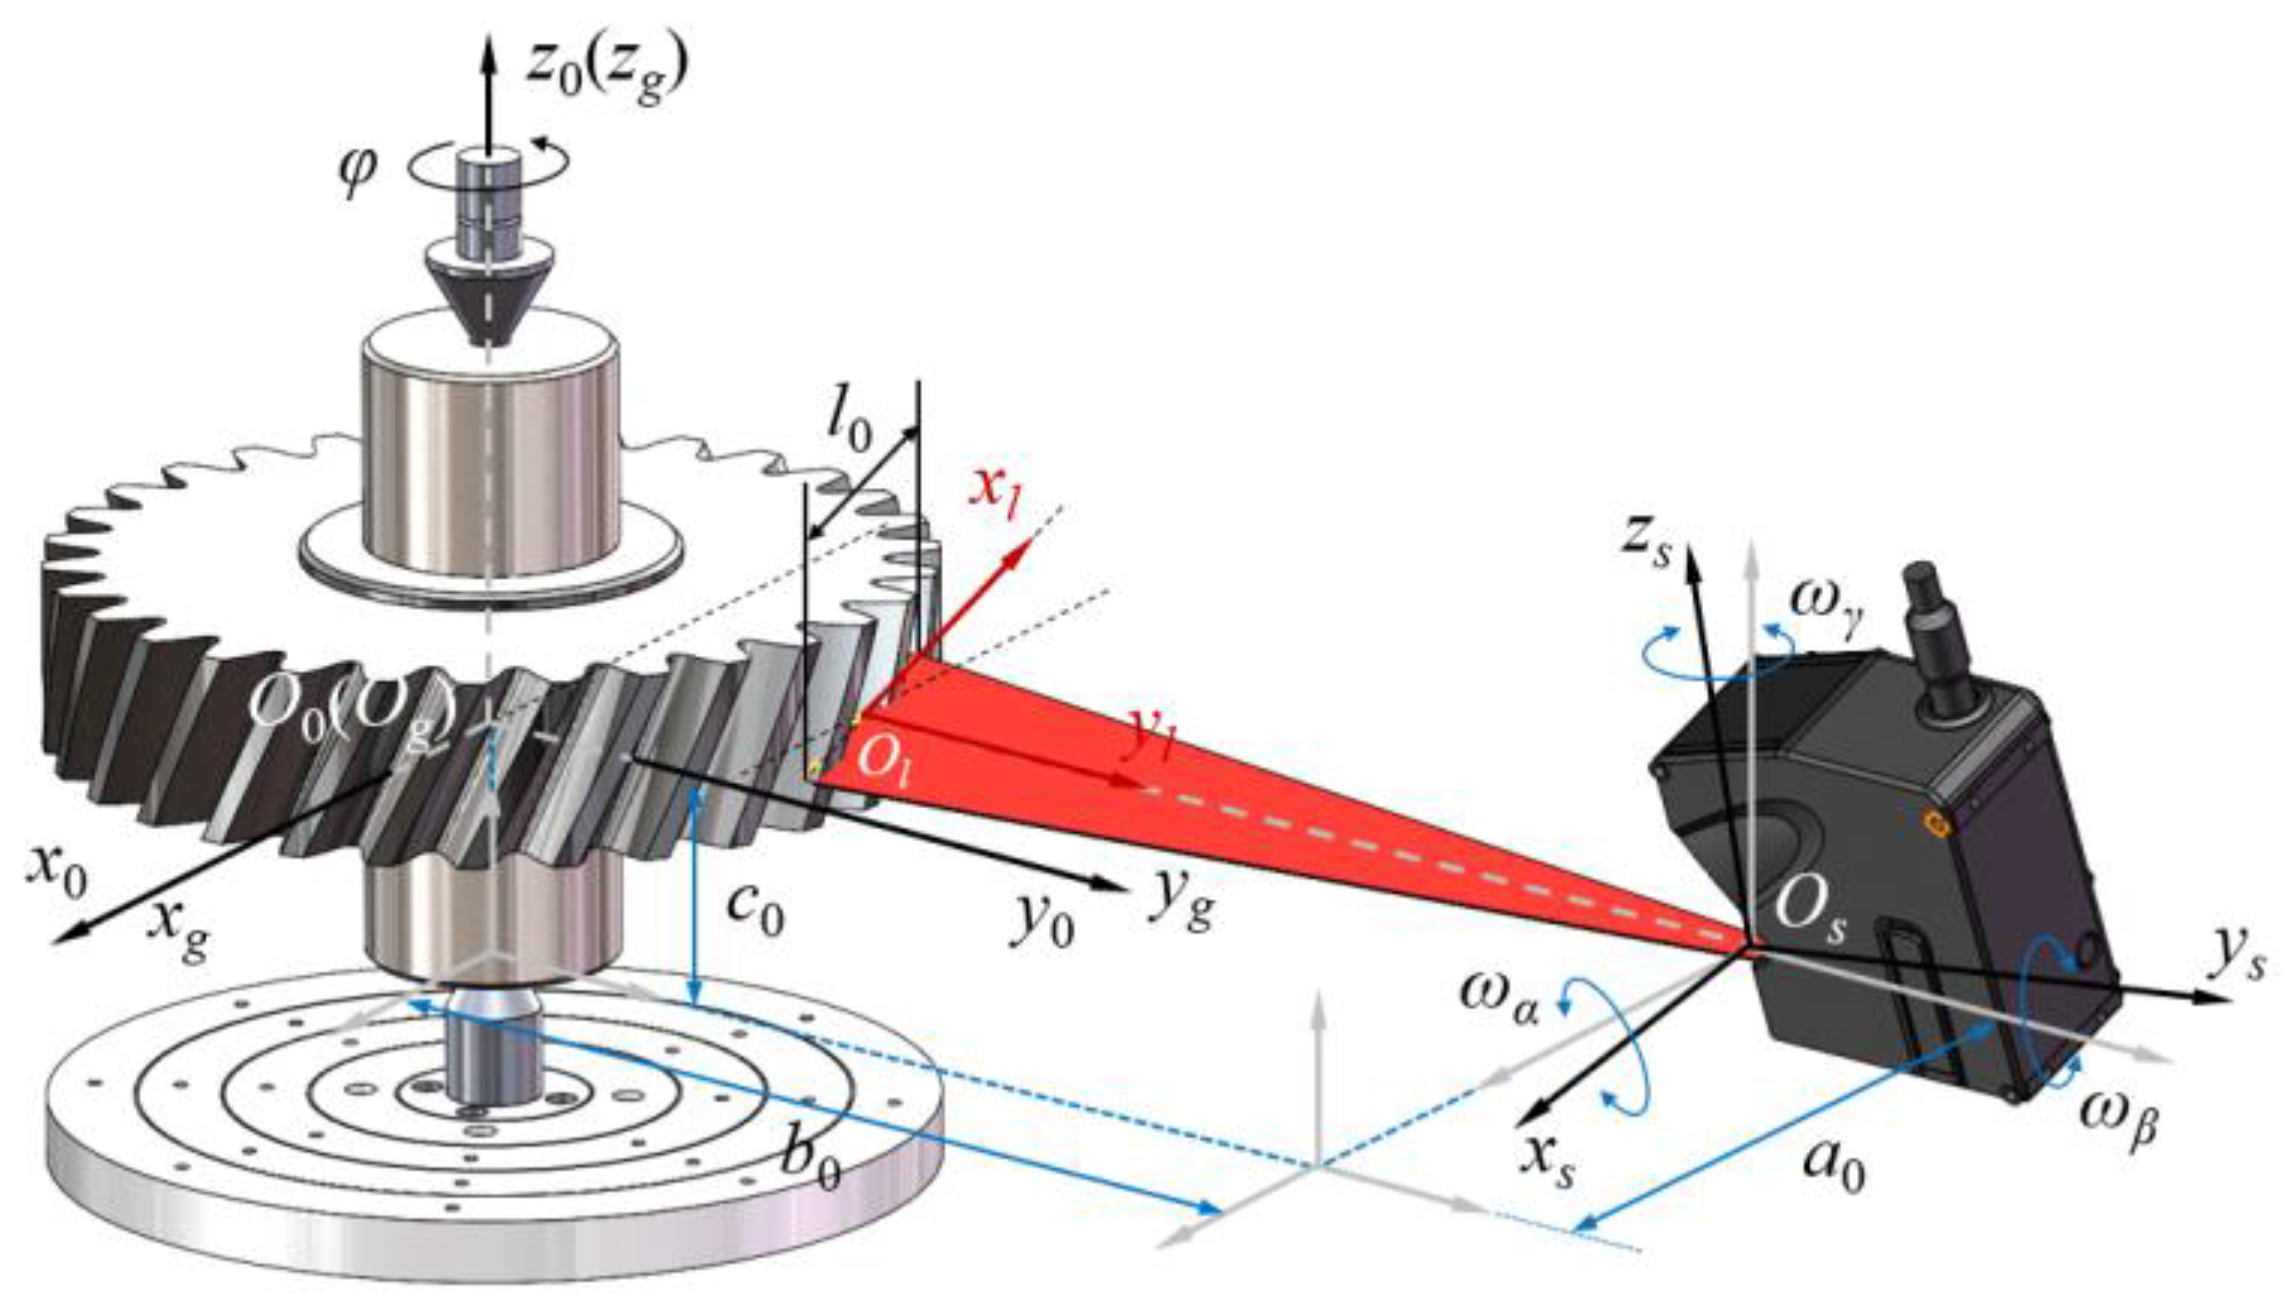
2. Gear Line Laser Measuring Model

Four established coordinate systems, namely, the machine coordinate system σ0: (O0-x0, y0, z0), sensor coordinate system σs: (Os-xs, ys, zs), measuring light coordinate system σl: (Ol-xl, yl, zl), and gear coordinate system σg: (Og-xg, yg, zg), are shown in Figure 1. Among them, the machine, sensor, and measuring light coordinate systems are fixed coordinate systems. The gear coordinate system is a dynamic coordinate system that is attached to the gear and rotates with it.
The tested gear is installed on the principal axis of the instrument and rotates around this axis. Its rotation angle signal induces the line laser sensor to provide the geometric information of the gear tooth surface in real-time. In the measuring light coordinate system, the tooth surface information Dl obtained using the sensor can be expressed as follows:
D l = ( x l , y l , 0 , 1 ) T
According to the spatial relationship among the coordinate systems, the tooth surface information Dl is transformed into the sensor coordinate system, and the tooth surface information Ds can be expressed as follows:
D s = R l s D l + T l s
where
D s = ( x s , y s , z s , 1 ) T , R l s = ( c _ s 0 0 0 0 1 0 0 0 0 1 0 0 0 0 1 ) , T l s = ( 0 , h 0 , 0 , 0 ) T
c_s is the sensor installation parameter, which is set as 1 and −1 for forward and reverse installation, respectively; h0 is the nominal distance of the sensor.
According to the spatial relationship among the coordinate systems, the tooth surface information Ds is transformed into the machine coordinate system, and the tooth surface information D0 can be expressed as follows:
D 0 = R s 0 D s + T s 0
where
D 0 = ( x 0 , y 0 , z 0 , 1 ) T , R s 0 = ( C γ C β S γ S α S β S γ C α C γ S β + S γ S α C β 0 S γ C β + C γ S α S β C γ C α S γ S β C γ S α C β 0 C α S β S α C α C β 0 0 0 0 1 ) , T s 0 = ( a 0 , b 0 , c 0 , 0 ) T
where C and S represent cos() and sin(), respectively. The subscripts α, β, and γ denote the angles ωα, ωβ, and ωγ, respectively. For example, Cα = cos(ωα). These six parameters (a, b, c, ωα, ωβ, and ωγ) are used to determine the spatial position and attitude of the line laser sensor in the 3D measurement of gears.
The tested gear rotates around the principal axis. According to the spatial relationship among the coordinate systems, the tooth surface information D0 is finally transformed into the gear coordinate system, and the tooth surface information Dg can be expressed as follows:
D g = R 0 g D 0
where
D g = ( x g , y g , z g , 1 ) T , R 0 g = ( cos φ sin φ 0 0 sin φ cos φ 0 0 0 0 1 0 0 0 0 1 )
φ is the rotation angle.
The 3D point clouds of the tested gear can be obtained.

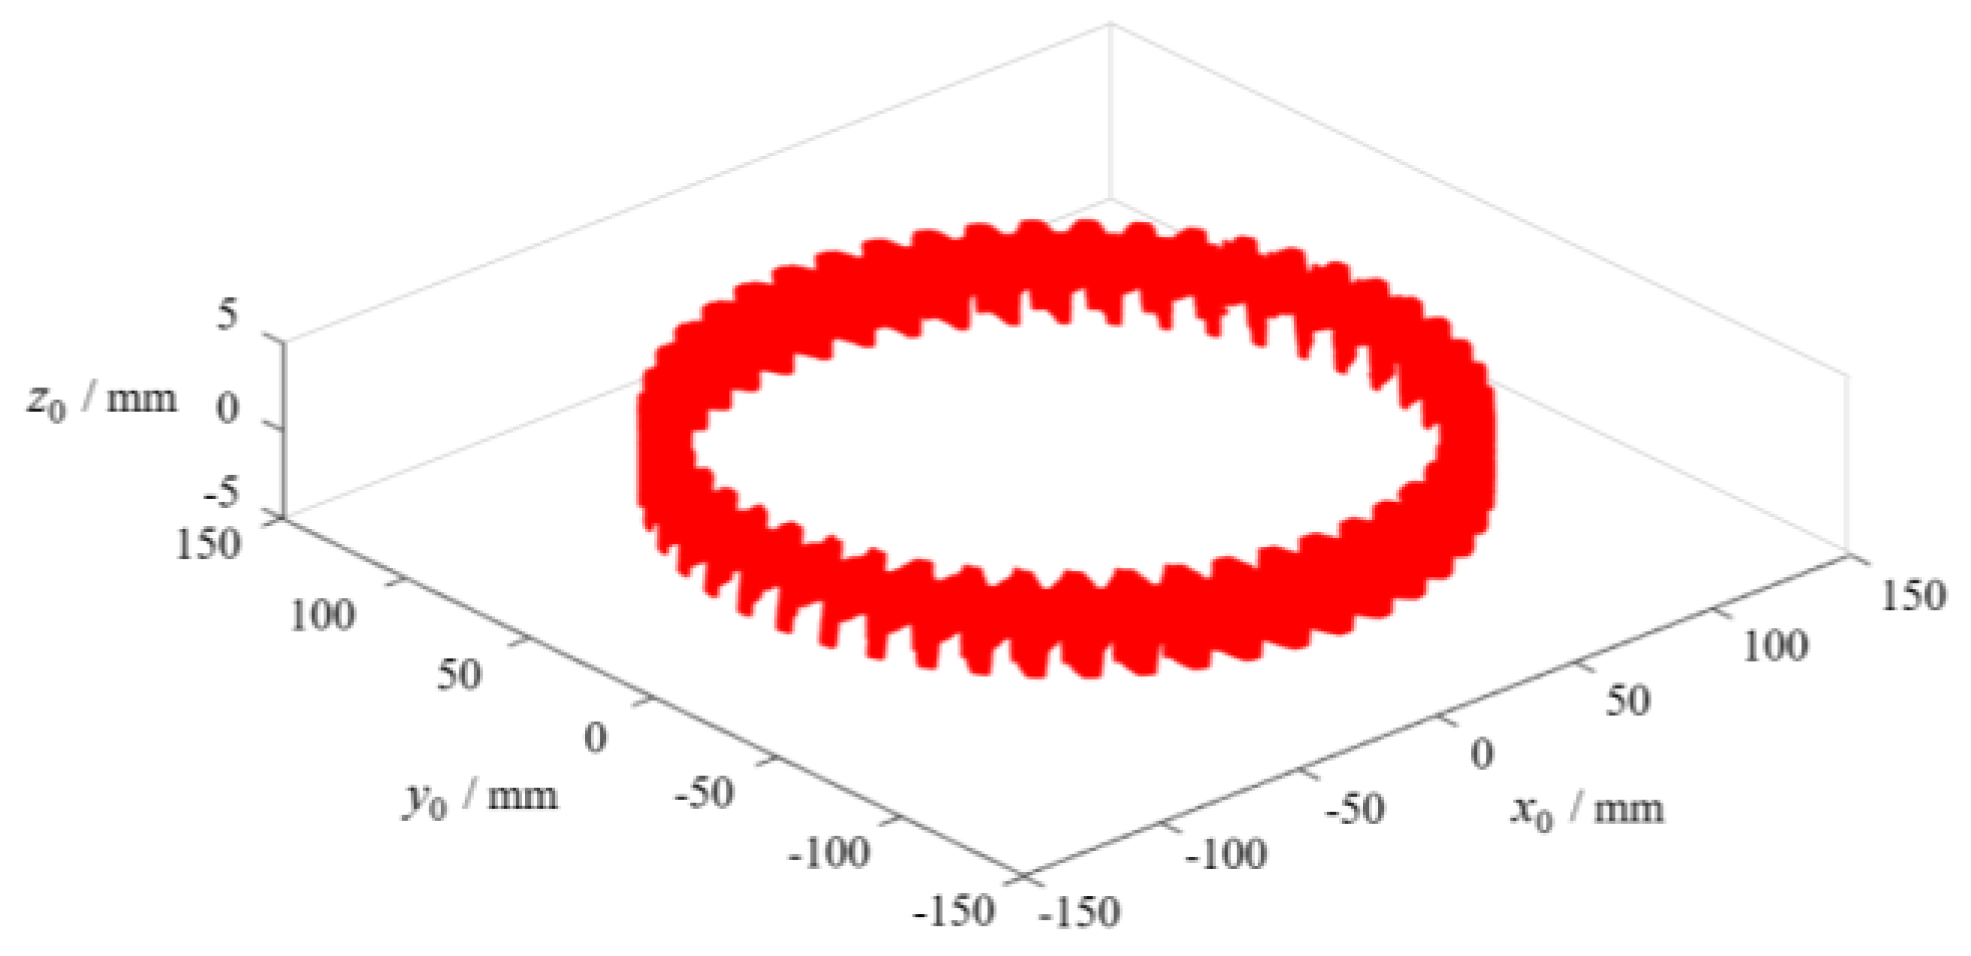
3. Acquisition of Gear Holistic Deviations

Gear transmission is realized by meshing through an action line. At each moment of gear transmission, the normal direction of the meshing area of the tooth surface overlaps with the action line. Therefore, the tooth surface characteristics can be directly assessed or calculated in the action line direction, that is, the normal direction of the tooth surface.
In Figure 2, the relationship between the gear actual measured point pactu, corresponding theoretical point p, and tooth surface deviation can be expressed as the vector sum.
p a c t u = p + d n o r m = p + | d n o r m | n
where p a c t u is the vector of the actual measured point, p is the vector of the corresponding theoretical point, d n o r m is the vector for deviation from the theoretical point to the actual measured point in the normal direction of the tooth surface, and n is the unit normal vector.
According to the tooth surface information Dg obtained using Formula (4), the normal distance at any point on the tooth surface can be expressed as follows:
| d n o r m | = r b 1 + tan 2 β b ( x g 2 + y g 2 r b 2 1 arctan ( x g 2 + y g 2 r b 2 1 ) arctan ( y g x g ) + z g tan β b r b )
According to the criterion that the direction of plus and minus materials are positive and negative, respectively, the normal error e at any point on the tooth surface can be expressed as follows:
e = type | d n o r m | { type = 1   :   plus   material type = 1   :   minus   material

4. Assessment of Gear Holistic Deviations

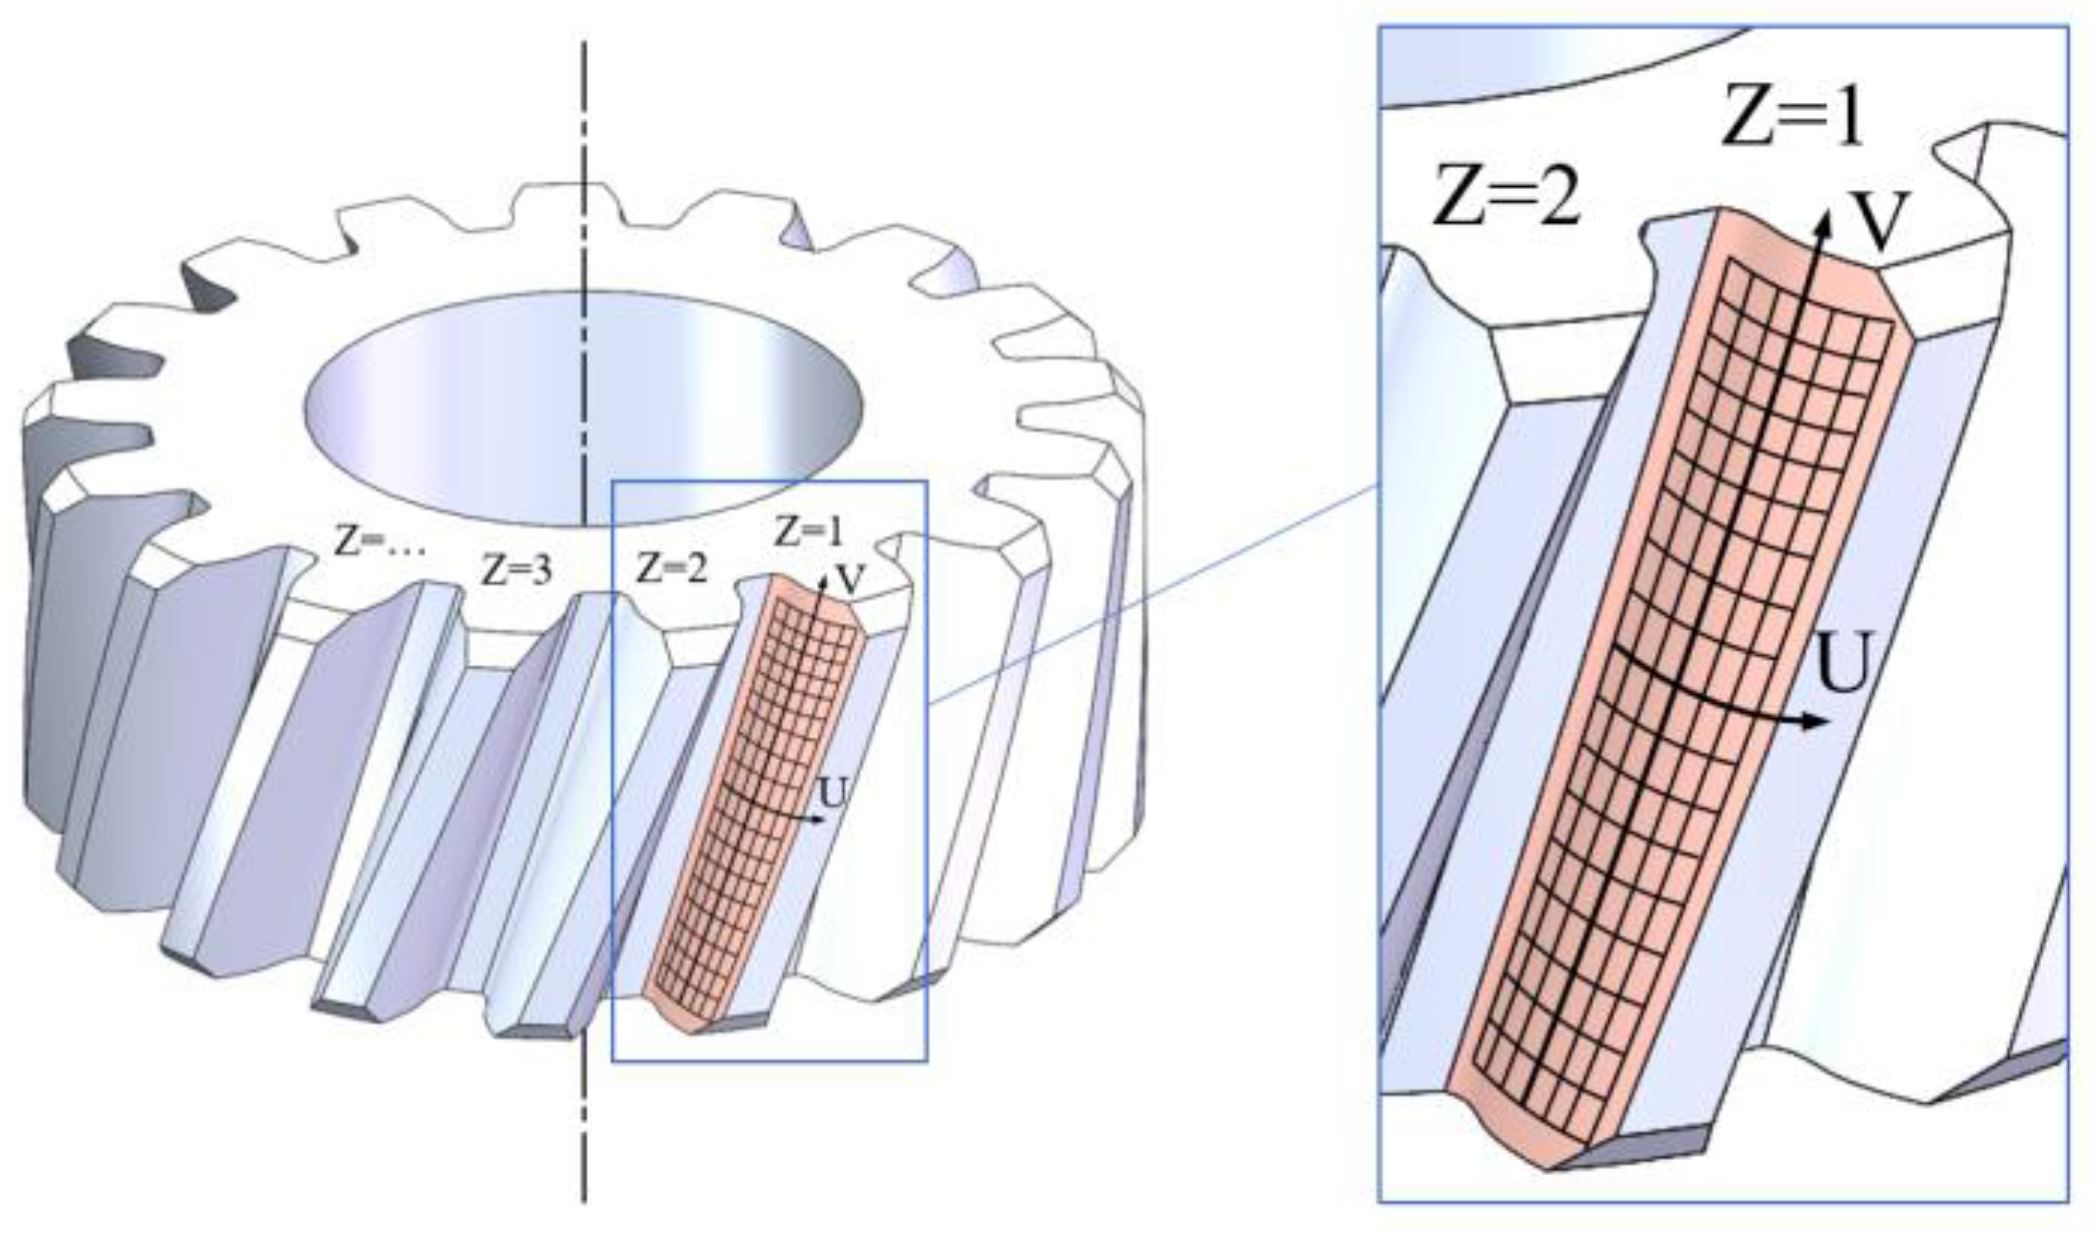
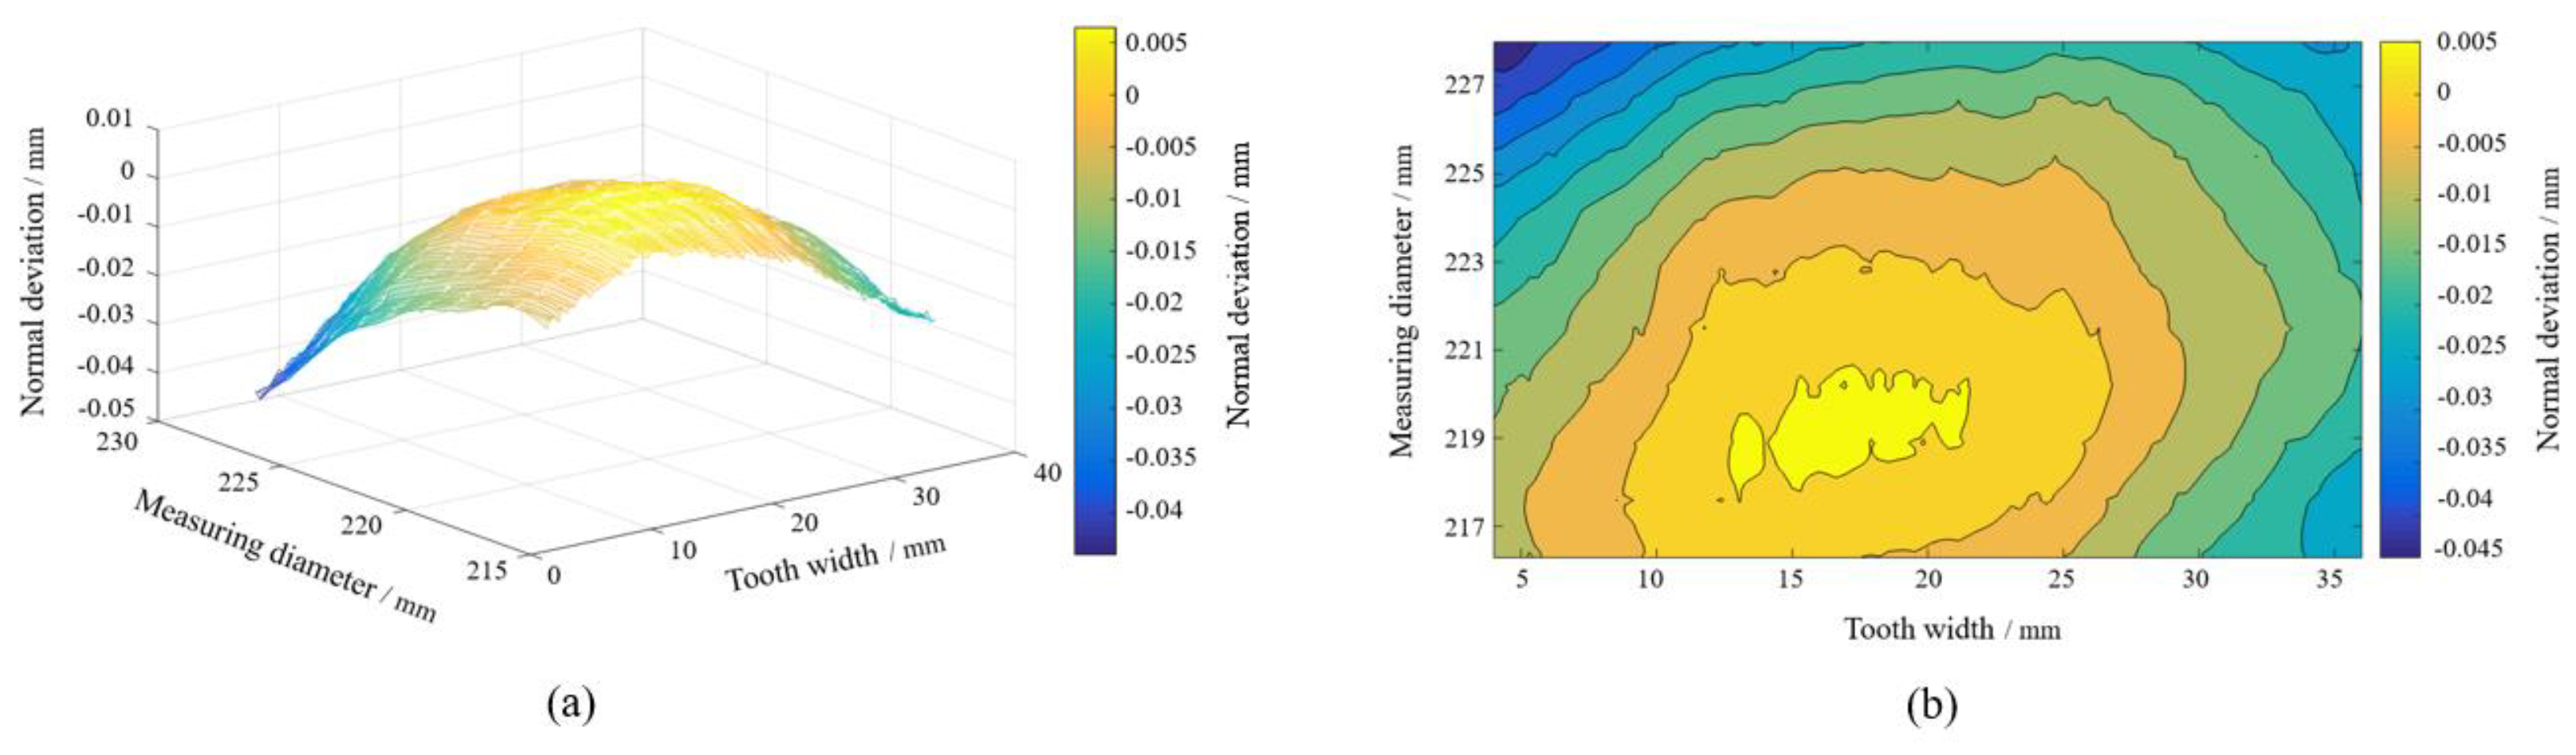
4.1. Structured 3D Model to Express Tooth Surface Errors

To exploit the obtained information on the tooth surface, the control method of a statistical process can be used to analyze the tooth surface quality statistically. First, a structured 3D model, which can be used to express the structured 3D tooth surface error in the specialized U-V-Z coordinate system, must be developed. Two spatial vertical directions, such as U and V, are selected on the tooth surface to establish a coordinate system (Figure 3). In the U direction, the pressure angle of the profile increases; V is parallel to the axis direction of the gear; Z is the serial number of gear teeth. Based on the aforementioned coordinate systems, tooth surface errors available on the same flank of all the teeth can be represented using the structured 3D model shown in Figure 4.
Therefore, the discretized tooth surface error can be recorded in the following 3D array.
E i , j , k = { { { e 1 , 1 , 1 , e 2 , 1 , 1 , , e i , 1 , 1 , , e m , 1 , 1 } , { e 1 , 2 , 1 , e 2 , 2 , 1 , , e i , 2 , 1 , , e m , 2 , 1 } , , { e 1 , j , 1 , e 2 , j , 1 , , e i , j , 1 , , e m , j , 1 } , , { e 1 , n , 1 , e 2 , n , 1 , , e i , n , 1 , , e m , n , 1 } } , { { e 1 , 1 , 2 , e 2 , 1 , 2 , , e i , 1 , 2 , , e m , 1 , 2 } , { e 1 , 2 , 2 , e 2 , 2 , 2 , , e i , 2 , 2 , , e m , 2 , 2 } , , { e 1 , j , 2 , e 2 , j , 2 , , e i , j , 2 , , e m , j , 2 } , , { e 1 , n , 2 , e 2 , n , 2 , , e i , n , 2 , , e m , n , 2 } } , , { { e 1 , 1 , k , e 2 , 1 , k , , e i , 1 , k , , e m , 1 , k } , { e 1 , 2 , k , e 2 , 2 , k , , e i , 2 , k , , e m , 2 , k } , , { e 1 , j , k , e 2 , j , k , , e i , j , k , , e m , j , k } , , { e 1 , n , k , e 2 , n , k , , e i , n , k , , e m , n , k } } , , { { e 1 , 1 , p , e 2 , 1 , p , , e i , 1 , p , , e m , 1 , p } , { e 1 , 2 , p , e 2 , 2 , p , , e i , 2 , p , , e m , 2 , p } , , { e 1 , j , p , e 2 , j , p , , e i , j , p , , e m , j , p } , , { e 1 , n , p , e 2 , n , p , , e i , n , p , , e m , n , p } } }
where ei,j,k is the error at any point (I, j, k) on the tooth surface, and the subscripts i, j, and k are the serial numbers of the discretized data points in the U, V, and Z directions, respectively. m, n, and p are the total numbers of data points in the U, V, and Z directions, respectively.
The tooth surface quality is assessed for the statistical analyses of several error data points to obtain representative statistics. For example, the first profile deviation curve on a flank of the first tooth surface can constitute discrete points as follows: {e1,1,1, e2,1,1, …, ei,1,1, …, em,1,1}. n profile deviation curves similar to this curve are present on the same tooth surface, which constitutes a random process of profile deviation curves; that is, it can be considered the result of n consecutive random tests of the same random function. Based on this, the n deviation curves can be statistically analyzed to obtain various statistics (e.g., maximum, minimum, and median), and then, representative indicators that reflect the tooth surface quality can be selected.
Using the structured 3D model to express tooth surface errors, any deviation curve, including the profile and helix involved in the current ISO1328, available on the tooth surface can be extracted. Moreover, other characteristic deviation curves, such as the profile of the path of contact and contact line, can be extracted. Considering the flank of the first tooth surface as an example, the deviation of any characteristic curve on the tooth surface can be expressed as follows:
E f i , j , 1 = { , e i , j , 1 , } if { j = f ( i ) i [ 1 , m ] j [ 1 , n ]
Any profile deviation curve and helix deviation curve present on the first tooth surface can also be included.
E α j , 1 = { e 1 , j , 1 , e 2 , j , 1 , , e i , j , 1 , , e m , j , 1 } E β i , 1 = { e i , 1 , 1 , e i , 2 , 1 , , e i , j , 1 , , e i , n , 1 }

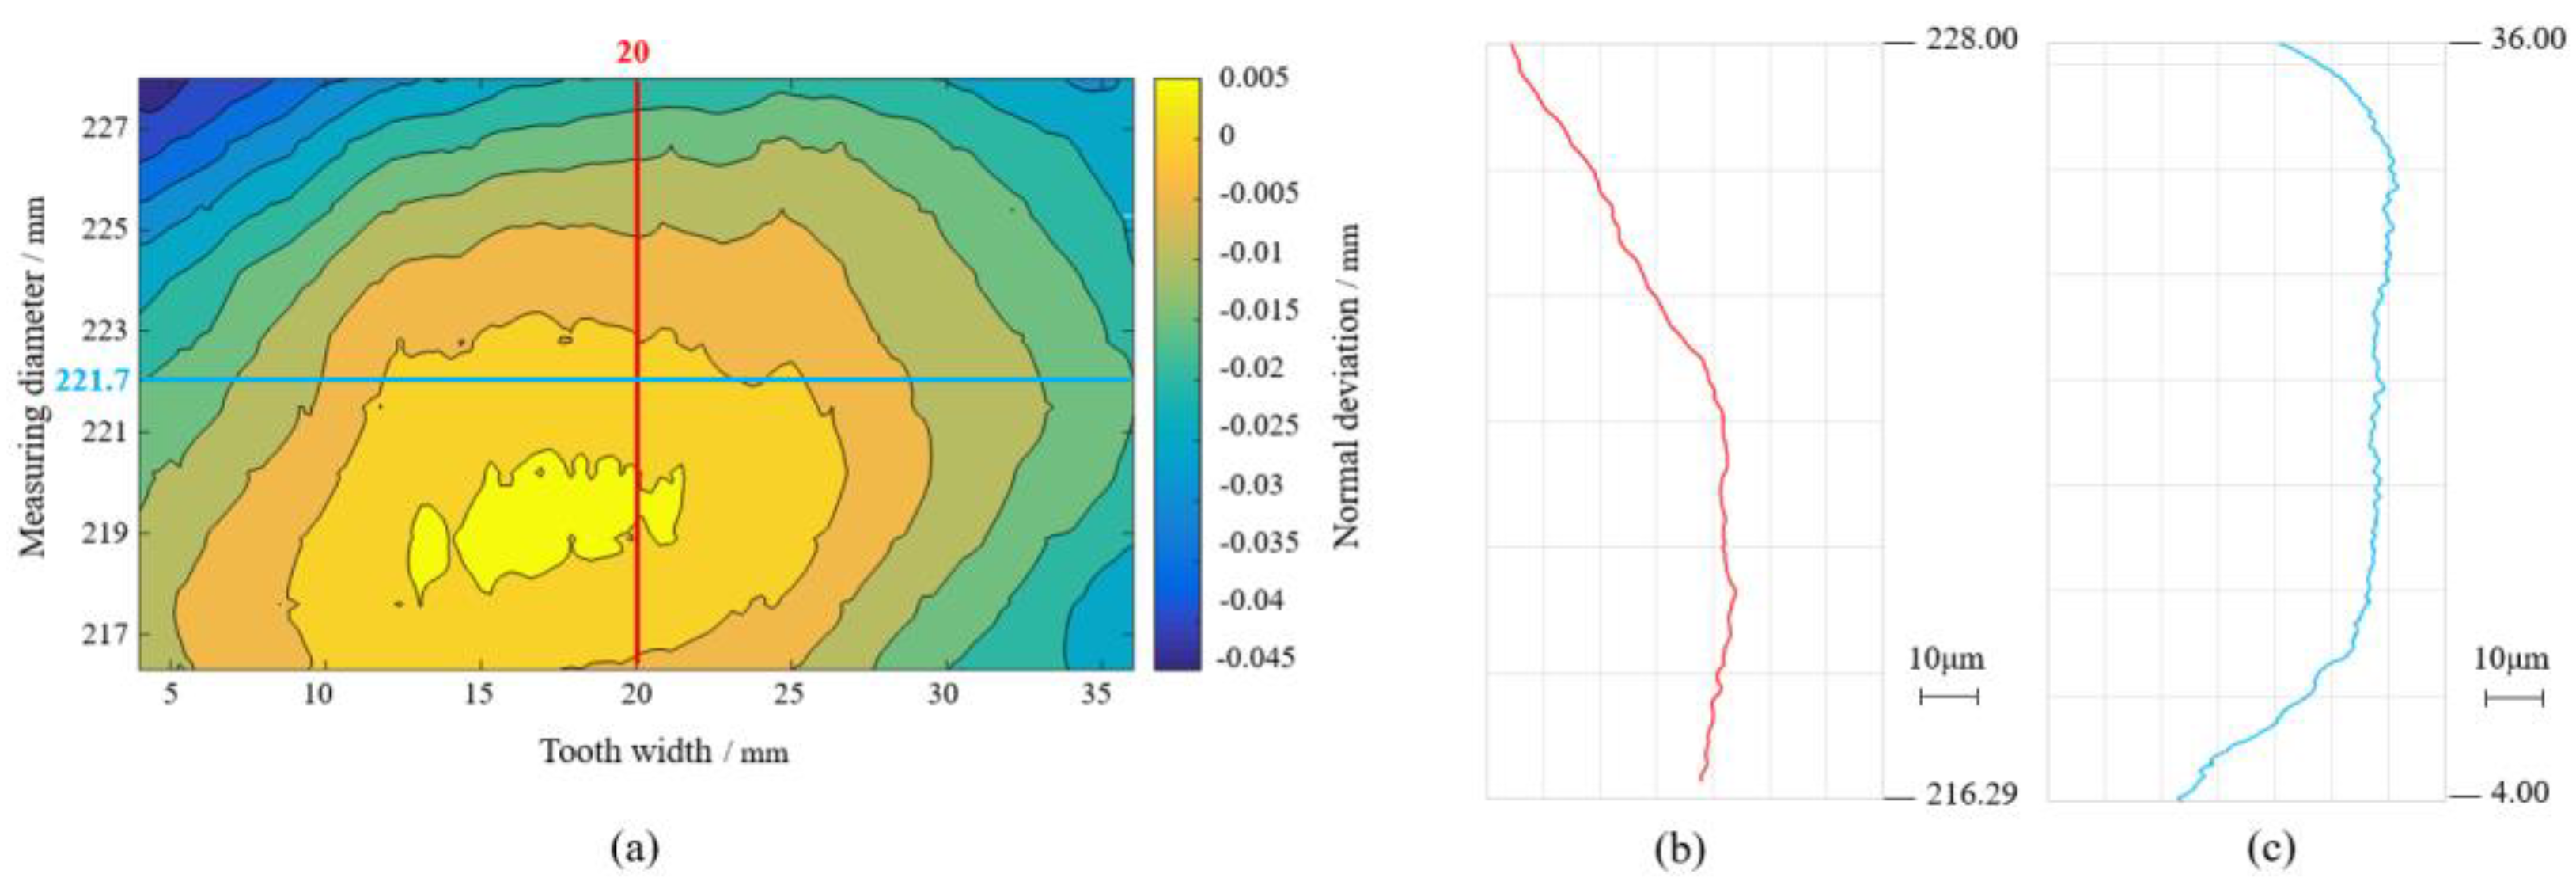
4.2. Definition and Calculation of New Assessment Indicators

Because a large amount of useful information is obtained from the structured 3D model, basic statistical analysis indicators, such as the sample mean and standard deviation, were calculated. The mean and standard deviation provided highly valuable statistical indicators of the tooth surface quality. Therefore, assuming that tooth surface errors follow a Gaussian distribution, for a series of measured values (e1, e2, …, ei, …, eq) of a measured random variable E, the mean value, standard deviation, maximum value, and minimum value can be defined as follows:
μ e = 1 q i = 1 q e i σ e = 1 q 1 i = 1 q ( e i μ e ) 2 MAX e = max i ( e 1 , e 2 , , e i , , e q ) MIN e = min i ( e 1 , e 2 , , e i , , e q )
where q is the total number of samples.
Considering the profile deviation as an example, the holistic 3D tooth surface errors can be expressed as follows:
E α = E α ( j , k ) = { { E α 1 , 1 , E α 2 , 1 , , E α j , 1 , , E α n , 1 } , { E α 1 , 2 , E α 2 , 2 , , E α j , 2 , , E α n , 2 } , , { E α 1 , k , E α 2 , k , , E α j , k , , E α n , k } , , { E α 1 , p , E α 2 , p , , E α j , p , , E α n , p } }
where Eαj,k is the j-th profile deviation curve on the k-th tooth surface.
According to Formula (11), the expected, standard deviation, and maximum curves of the profile deviation can be calculated as follows:
μ α ( i ) = 1 n 1 p j = 1 n k = 1 p E α j , k ( i ) σ α ( i ) = 1 n + p 1 j = 1 n k = 1 p ( E α j , k ( i ) E α j , k ¯ μ α ( i ) ) 2 , E α j , k ¯ = 1 m i = 1 m E α j , k ( i ) MAX α ( i ) = max j , k ( E α j , k ( i ) ) MIN α ( i ) = min j , k ( E α j , k ( i ) )
where Eαj,k(i) = ei,j,k, which is the error of the i-th point on the j-th profile deviation curve on the k-th tooth surface.
In the current standard ISO 1328-1 [10], the profile deviation is assessed according to a single tooth profile error curve, and this assessment is controlled using three indicators, namely, Fα, f, and f. In the structured 3D model used to express tooth surface errors, the tooth profile deviation is assessed according to the comprehensive curve of a cluster of tooth profile error curves, and the assessment indicators should be expanded to five items, namely, FαT, FαM, Fασ, ffαM, and fHαM. FαT is the total profile deviation, which indicates the consistency between the actual and designed profile. FαM is the average total profile deviation, which represents the accuracy of the deterministic component in the actual profile deviation. Fασ is the profile standard deviation, which indicates the dispersion degree of the actual profile deviation. ffαM is the average profile form deviation, which denotes the average form deviation of the actual profile. fHαM is the average profile slope deviation, which indicates the average slope deviation of the actual profile.
The calculation method for the assessment indicators ffαM and fHαM is the same as that for the assessment indicators f and f reported in ISO1328-1. The calculation method of the assessment indicators FαT, FαM, and Fασ can be expressed as follows:
F α T = max i ( MAX α ( i ) ) min i ( MIN α ( i ) ) F α M = max i ( μ α ( i ) ) min i ( μ α ( i ) ) F α σ = max i ( σ α ( i ) )
The definition and calculation of assessment indicators for helix and pitch deviations are similar to those of the corresponding indicators of profile deviation (Table 1).

5. Measurement Practices

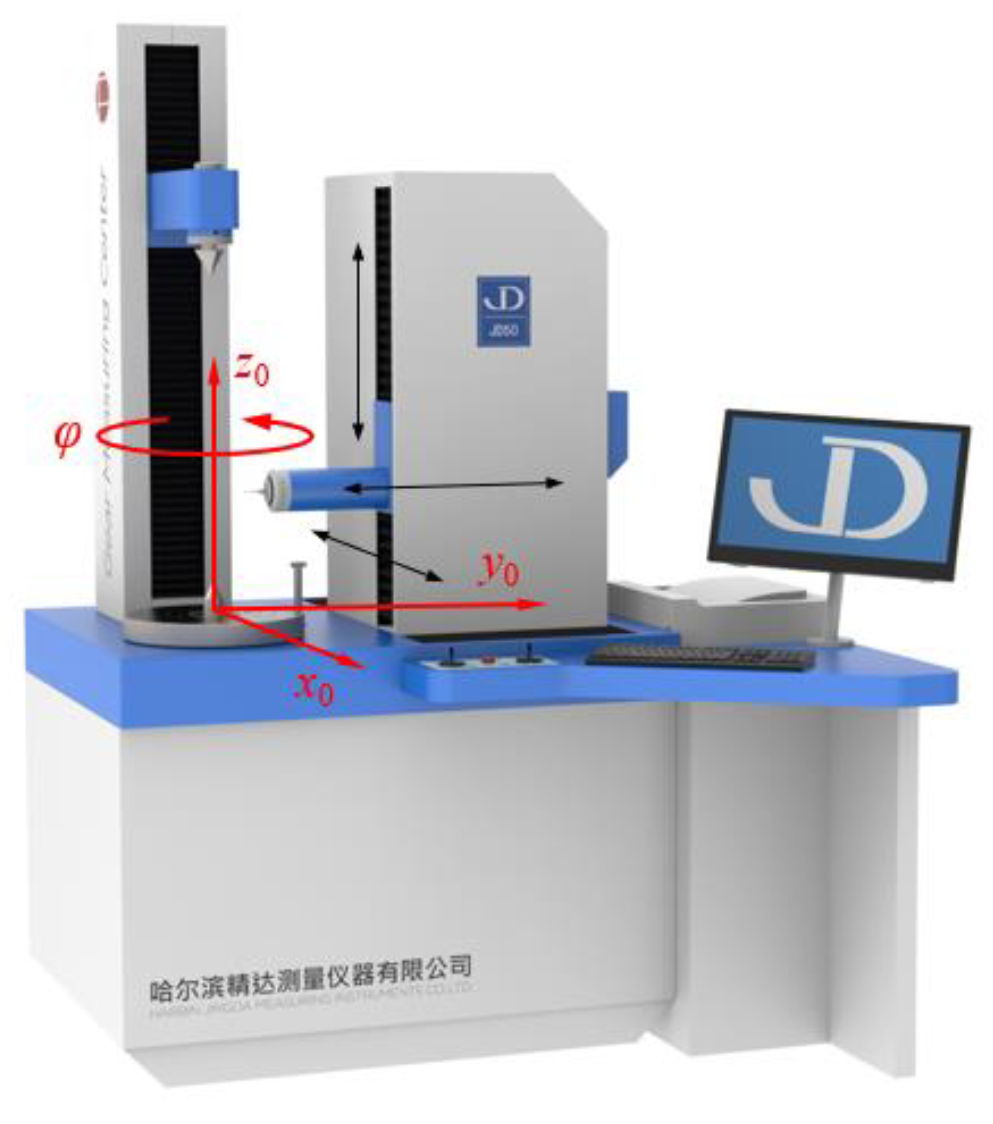
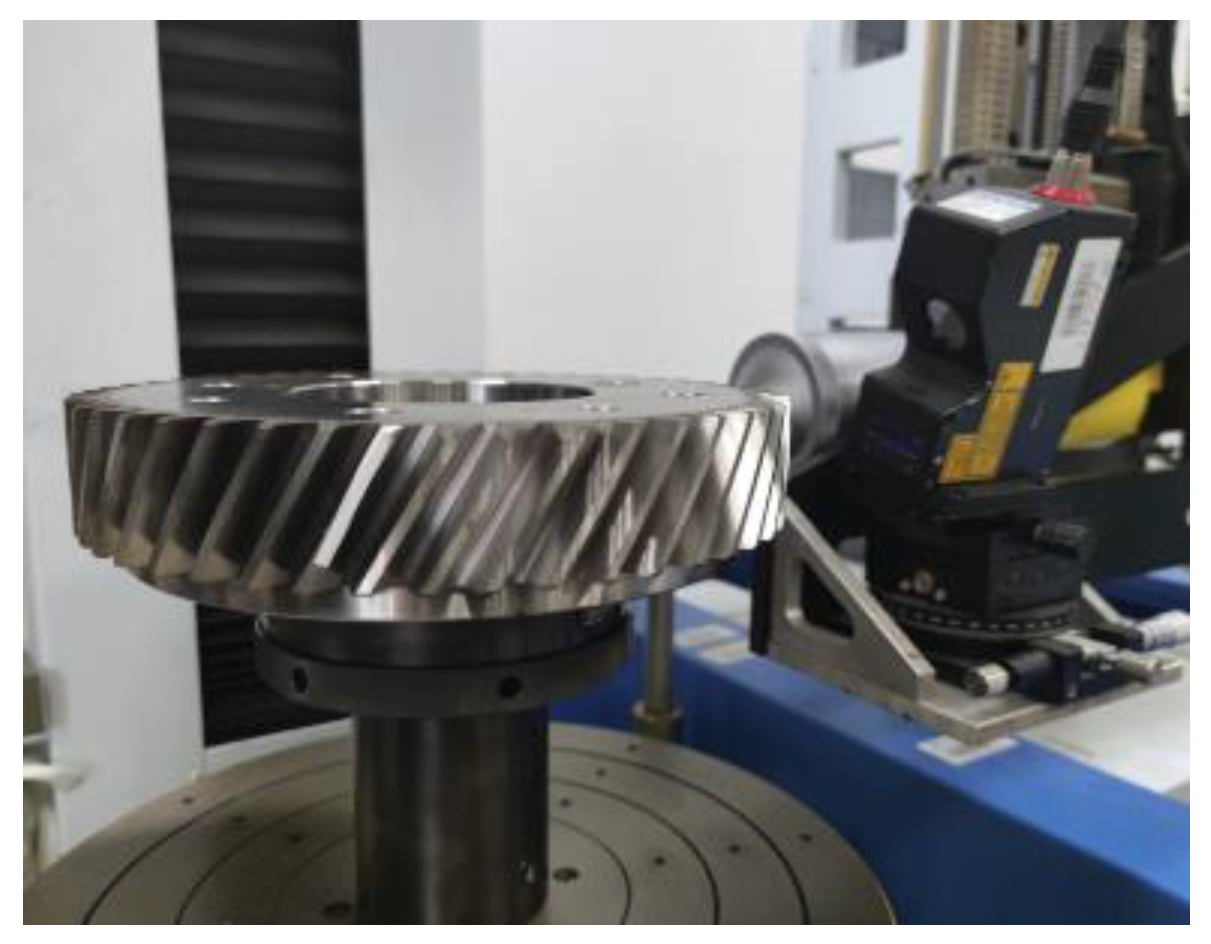
5.1. Measurement Instrument

The gear measurement center (JD32, made in Jingda Liangyi, Harbin, China) illustrated in Figure 5 is selected as the measurement instrument. It can be used to inspect gears with a diameter of <350 mm. The positioning accuracy of the three linear motion axes (x0, y0, z0) is 1 μm, and that of the rotary axis is 2’. The line laser sensor is installed on the 3D moving base of the gear measurement center with the fine-tuning platform to move the 3D linear position of the sensor space. Simultaneously, the fine-tuning platform can be used to adjust the three angles of the sensor in space. The tested gear is installed on the principal axis of the instrument and rotates around this axis at a certain speed. The angle signal is used as the external trigger source to synchronously utilize the sensor for information acquisition. The gear measurement process based on the line laser sensor is presented in Figure 6.
The selected parameters of the tested gear are as follows: The normal modulus is 4 mm, the number of teeth is 48, the pressure angle is 20°, the helix angle is 30°, the tooth width is 32 mm, and the modification is crowned. The line laser sensor is selected from the LJ-V7000 series sensor.

5.2. Data Measurement of the Tooth Surface

To achieve the smallest possible angle between the measuring light and the normal direction of the gear surface during gear measurement, the linear laser sensor is set with a certain offset in the tangential direction of the gear. Additionally, to obtain extra information regarding the tooth surface in the tooth width direction by conducting a one-rotation measurement, the sensor is set at a certain inclination angle. The angle obeys the rule that the measurement light should be perpendicular to the helix.
The tested gear rotates with the principal axis of the instrument at a certain speed, and the tooth surface information is obtained using the linear laser sensor. According to the principle of line laser measurement and coordinate transformation criterion, combined with Formulas (1) to (4), the tooth surface point cloud of the tested gear can be acquired. Figure 7 shows the point clouds of the partial tooth width direction obtained by conducting a one-rotation measurement. Figure 8 presents the complete information point clouds of the right tooth surface of the first tooth extracted after multi-section scanning.

6. Discussion

Considering the complete point clouds of the right tooth surface of the first tooth shown in Figure 8 as an example, according to Formula (5), the 3D normal deviation of the tooth surface is illustrated in Figure 9. Figure 9a shows the normal deviation distribution, especially the shape and amount of tooth surface modification. Figure 9b illustrates the position of the maximum point and change trend and the rate of normal deviation.
On the basis of the 2D tooth surface, the error basement criteria specified in ISO 1328 and the 3D tooth surface normal deviations, the deviation in different directions can be extracted and evaluated as per the requirement. The profile and helix deviations are extracted in the gear radial and gear width directions, respectively (Figure 10).
To verify the accuracy of the measurement and assessment results acquired using this method, the traditional contact measurement and assessment results are used for comparison. The gear measurement center (P26, Klingelnberg in Figure 11) is selected as the comparative measurement instrument; its measurement results are shown in Figure 12. The comparison results are presented in Table 2.
According to Table 2, the optical measurement results based on the line laser sensor differ slightly and are within an acceptable range from the traditional contact measurement results. The main reasons are as follows: (1) With contact measurement, obtaining the same curve as the profile and lead measured and extracted by the line laser sensor is difficult. (2) Different filtering algorithms are required in data processing (mechanical filtering exists in contact measurement). (3) The calibration error of the sensor leads to a certain system error. As a whole, the line laser measurement method can be used to characterize and identify the tooth surface quality of the tested gears accurately.
Similarly, the full point clouds of the right tooth surface of the first tooth shown in Figure 8 are selected as an example; that is, k is a constant, and k = 1 in the structured 3D model used to express tooth surface errors. The comprehensive curve of the tooth surface is presented in Figure 13.
Therefore, the 3D profile and 3D helix deviations of the right tooth surface of the first tooth can be expressed as follows:
E α ( j , 1 ) = { E α 1 , 1 , E α 2 , 1 , , E α j , 1 , , E α n , 1 } E β ( i , 1 ) = { E β 1 , 1 , E β 2 , 1 , , E β i , 1 , , E β m , 1 }
According to the aforementioned 3D comprehensive curve of the tooth surface deviation, the assessment results of profile deviations can be obtained as follows:
F α T = 49.9   μ m , F α M = 19.3   μ m , F α σ = 7.2   μ m , f f α M = 17.6   μ m , f H α M = 6.2   μ m
The assessment results of helix deviations can be obtained as follows:
F β T = 49.9   μ m , F β M = 19.3   μ m , F β σ = 5.4   μ m , f f β M = 18.8   μ m , f H β M = 2.2   μ m

7. Conclusions

A method based on line laser measurement for the acquisition and assessment of gear holistic deviations is proposed. This method provides an ideal solution for the 3D assessment of tooth surface errors. It not only includes all the current accuracy evaluation indexes but also expands new evaluation indexes, which represent the 3D topological tooth surface completely and comprehensively and realize the depth mining and expanded applications of complete 3D information of the tooth surface. Our evaluation results of the gear measurement based on the line laser sensor show smaller and more acceptable differences than the traditional contact measurement results. The gear line laser measurement can accurately characterize and identify the quality of the tooth surface for tested gears. There are many new evaluation indexes in the structured 3D model to express tooth surface errors, but only a few are analyzed in this study. In the future work, all indexes will be analyzed to enrich and improve the new system applicable to 3D gear assessments. In addition, based on the rich point cloud of the tooth surface, the virtual comprehensive error of gears will be researched.

Author Contributions

Conceptualization, Z.S. and Y.S.; methodology, Z.S.; software, Y.S. and X.W.; validation, Y.S., H.S. and B.Z.; formal analysis, Z.S. and Y.S.; resources, Z.S. and H.S.; data curation, Y.S.; writing—original draft preparation, Y.S. and H.S.; writing—review and editing, Y.S. and B.Z.; visualization, X.W.; supervision, Z.S.; project administration, Z.S.; funding acquisition, Z.S. and H.S. All authors have read and agreed to the published version of the manuscript.

Funding

This research was supported by National Natural Science Foundation of China (52175036), State Key Laboratory of Precision Measuring Technology and Instruments (Tianjin University) (PILAB2105) and Young Elite Scientists Sponsorship Program by CAST (2021QNRC001).

Institutional Review Board Statement

Not applicable.

Informed Consent Statement

Not applicable.

Data Availability Statement

Not applicable.

Conflicts of Interest

No conflict of interest exists in the submission of this manuscript, and the manuscript is approved by all authors for publication.

References

  1. Shi, Z.Y.; Fei, Y.T.; Xie, H.K. 100 Years of Gear Measurement Technology—Review &Prospect. Eng. Sci. 2003, 5, 13–17. [Google Scholar]
  2. Shi, Z.Y.; Yu, B.; Song, H.X.; Wang, X.Y. Development of Gear Measurement Technology during Last 20 Years. China Mech. Eng. 2022, 33, 1009–1024. [Google Scholar]
  3. Ni, K. Areal Gear Metrology with Modified Flanks; University of North Carolina at Charlotte: Charlotte, NC, USA, 2017. [Google Scholar]
  4. ISO 1328-1:2013-09; Cylindrical Gears—ISO System of Flank Tolerance Classification—Part 1: Definitions and Allowable Values of Deviations Relevant to Flanks of Gear Teeth. ISO copyright office: Geneva, Switzerland, 2013.
  5. Przyklenk, A.; Reavie, T.; Stein, M.; Frazer, R. Holistic Evaluation of Involute Gears. Power Transm. Eng. 2022, 4, 40–48. [Google Scholar]
  6. Goch, G.; Ni, K.; Peng, Y.; Guenther, A. Future gear metrology based on areal measurements and improved holistic evaluations. CIRP Ann.-Manuf. Technol. 2017, 66, 469–474. [Google Scholar] [CrossRef]
  7. Härtig, F.; Stein, M. 3D involute gear evaluation—Part I: Workpiece coordinates. Measurement 2019, 134, 569–573. [Google Scholar] [CrossRef]
  8. Stein, M.; Härtig, F. 3D involute gear evaluation—Part II: Deviations—Basic algorithms for modern software validation. Meas. Sci. Technol. 2022, 33, 125003. [Google Scholar] [CrossRef]
  9. Guo, X.Z.; Shi, Z.Y.; Yu, B.; Zhao, B.Y.; Li, K.; Sun, Y.Q. 3D measurement of gears based on a line structured light sensor. Precis. Eng. 2020, 61, 160–169. [Google Scholar] [CrossRef]
  10. Shi, Z.Y.; Sun, Y.Q.; Yin, X.; Yu, B. Gear pitch rapid measurement by a point laser sensor. Opt. Eng. 2022, 61, 061405. [Google Scholar] [CrossRef]
  11. Matthew, J. Gear Factory of the Future. Gear Technol. 2021, 1, 26–31. [Google Scholar]
  12. Prakash, W.; James, S.; Michael, T. Measurement of Toothed Articles Utilizing Multiple Sensor. U.S. Patent US2017050235W, 6 September 2017. [Google Scholar]
  13. Kerforn, N. Gear Inspection in Record Tim. Opt. Photonik 2017, 12, 56–57. [Google Scholar] [CrossRef] [Green Version]
  14. Didier, L.; Gwenael, S. Dispositif Modulaire de Mesure Sans Contact et Système de Mesure et de Controle Correspondant. Patent WO2016166035A1, 20 October 2016. [Google Scholar]
  15. Morse, E.; Jaganmohan, P. 6 DOF calibration of profile sensor locations in an inspection station. CIRP Ann. Manuf. Technol. 2020, 69, 465–468. [Google Scholar] [CrossRef]
  16. Sun, Y.Q.; Shi, Z.Y.; Yu, B.; Li, H.B. Incident angle model of measuring light in gear measurement utilizing a line laser sensor and analysis on its influence factors. Measurement 2022, 203, 111838. [Google Scholar] [CrossRef]
  17. Fujio, H.; Kubo, A.; Saitoh, S.; Suzuki, M.; Tochimoto, S.; Hanaki, H.; Honda, T. Laser holographic measurement of tooth flank form of cylindrical involute gear. J. Mech. Des. 1994, 116, 721–729. [Google Scholar] [CrossRef]
  18. Schiller, A.; Beckmann, T.; Fratz, M.; Seyler, T.; Bertz, A. Optical Gear Measurement: Holographic System for 100% Inspection. In Proceedings of the International Conference on Gears 2019, Düsseldorf, Germany, 18—20 September 2019; pp. 1545–1550. [Google Scholar]
  19. Kruth, J.P.; Bartscher, M.; Carmignato, S.; Schmitt, R.; De Chiffre, L.; Weckenmann, A. Computed tomography for dimensional metrology. CIRP Ann. Manuf. Technol. 2011, 60, 821–842. [Google Scholar] [CrossRef]
  20. Bartscher, M.; Hilpert, U.; Goebbels, J.; Weidemann, G. Enhancement and Proof of Accuracy of Industrial Computed Tomography (CT) Measurements. CIRP Ann. Manuf. Technol. 2007, 56, 495–498. [Google Scholar] [CrossRef]
  21. Lotze, W.; Haertig, F. 3D Gear Measurement by CMM. In Proceedings of the Fifth International Conference on Laser Metrology, Machine Tool, CMM and Robot Performance, Birmingham, UK, January 2001; pp. 333–344. [Google Scholar]
  22. Christof, G.; Markus, F. Hybrid Gear Metrology with Klingelnberg. Gear Technol. 2021, 4, 26–27. [Google Scholar]
Figure 1. Coordinate system.
Photonics 09 00735 g001
Figure 2. Normal deviations of the tooth surface.
Photonics 09 00735 g002
Figure 3. Specialized U-V-Z coordinate system.
Photonics 09 00735 g003
Figure 4. Structured 3D model to express tooth surface errors.
Photonics 09 00735 g004
Figure 5. Measurement instrument.
Photonics 09 00735 g005
Figure 6. Gear measurement process.
Photonics 09 00735 g006
Figure 7. Point clouds obtained with one−rotation measurement.
Photonics 09 00735 g007
Figure 8. Point clouds extracted after multi−section scanning.
Photonics 09 00735 g008
Figure 9. 3D normal deviations of the right tooth surface of the first tooth: (a) 3D topological error; (b) error contour map.
Photonics 09 00735 g009
Figure 10. Extraction of the profile and helix deviations: (a) 3D topological error, (b) profile deviations, and (c) helix deviations.
Photonics 09 00735 g010
Figure 11. Gear measurement center (P26, Klingelnberg, Ettlingen, Germany).
Photonics 09 00735 g011
Figure 12. Measurement results of P26: (a) gear profile/lead; (b) local enlarged view of gear profile, and (c) local enlarged view of gear lead.
Photonics 09 00735 g012
Figure 13. Comprehensive curves of the tooth surface: (a) profile deviation; (b) helix deviation.
Photonics 09 00735 g013
Table 1. Assessment indicators for helix and pitch deviations.
ItemSymbolIllustration
Helix deviation indicatorsFβTTotal helix deviation
FβMAverage total helix deviation
FβσHelix standard deviation
ffβMAverage helix form deviation
fHβMAverage helix slope deviation
Pitch deviation indicatorsFpTTotal cumulative pitch deviation
FpMAverage total cumulative pitch deviation
FCumulative pitch standard deviation
fpMAverage single pitch deviation
Table 2. Comparison results.
TypeItemAssessment Results/μm
Contact MeasurementLine Laser Measurement
Profilef−36.5−36.89
Fα42.242.57
f26.727.65
Leadf−46.3−31.89
Fβ50.843.83
f26.228.57
Publisher’s Note: MDPI stays neutral with regard to jurisdictional claims in published maps and institutional affiliations.

