Article

A Versatile Terahertz Chemical Microscope and Its Application for the Detection of Histamine

Graduate School of Interdisciplinary Science and Engineering in Health Systems, Okayama University, 3-1-1, Tsushimanaka, Kitaku, Okayama 700-8530, Japan
*
Author to whom correspondence should be addressed.
These authors contributed equally to this work.
Photonics 2022, 9(1), 26; https://doi.org/10.3390/photonics9010026
Submission received: 14 December 2021 / Revised: 29 December 2021 / Accepted: 29 December 2021 / Published: 3 January 2022
(This article belongs to the Special Issue Terahertz (THz) Science in Advanced Materials, Devices and Systems)

Abstract

:
Terahertz waves have gained increasingly more attention because of their unique characteristics and great potential in a variety of fields. In this study, we introduced the recent progress of our versatile terahertz chemical microscope (TCM) in the detection of small biomolecules, ions, cancer cells, and antibody–antigen immunoassaying. We highlight the advantages of our TCM for chemical sensing and biosensing, such as label-free, high-sensitivity, rapid response, non-pretreatment, and minute amount sample consumption, compared with conventional methods. Furthermore, we demonstrated its new application in detection of allergic-related histamine at low concentration in buffer solutions.

1. Introduction

Terahertz (THz) waves are a type of electromagnetic wave that located in the region between radio waves and light waves. Although THz as an electromagnetic wave that has been studied for a long time, which was mainly used for spectroscopic analysis, the milestone of the rapid development of THz waves in recent years is established by DH Auston et al. [1,2]. It is considered that THz waves are generated, and time-domain waveforms are acquired, using a photo-conducting switch. Since then, a THz time-domain spectroscopy (THz-TDS) has been proposed and developed [3,4]. At present, not only the above-mentioned generation detection method but also various THz wave generation/detection methods have been proposed, and the generation of THz waves is becoming closer to practical use in frequency bands and intensities for quantum cascade lasers and resonant tunnel diodes. Moreover, by using ultra-short laser pulses, THz-TDS, measuring the optical properties of materials, has become a promising technique in the academic field and industrial application [5,6]. It is possible to identify the material from the absorption spectrum peculiar to the molecule of the material existing in the THz wave region [7,8,9], and its application for airport security inspection and non-destructive material inspection have been proposed and put into practical use. Moreover, a biosensor using a metal mesh structure designed for steep absorption peaks in the THz wave region was demonstrated [10]. The specific binding of the antigen to the antibody immobilized on the sensor changes the permittivity of the sensor; as a result, the frequency of the absorption peak of the sensor changes. This technique uses a THz spectroscopy system to measure the shift of absorption peaks. Extremely sensitive measurement is realized with high peak Q value.
As a technology different from THz spectroscopy, a highly stable femtosecond laser-excited THz emission microscopy (LTEM) has also been developed to evaluate the dynamics of carriers or electric dipoles in materials [11,12,13,14,15]. Specifically, a semiconductor integrated circuit chip is irradiated with a femtosecond laser, and THz waves are emitted from the integrated circuit chip itself. Since the generated THz waves contain information about the electric field inside the integrated circuit chip, as well as the dynamic behavior of carriers inside the semiconductor, the distribution of THz wave radiation can be obtained by scanning the femtosecond laser on the integrated circuit chip [15]. Furthermore, this information enables failure inspection and the analysis of integrated circuit chips. In general, the spatial resolution of THz imaging has a spatial resolution of about the length of a THz wave, which is 300 μm at 1 THz, whereas the spatial resolution of LTEM is determined by the center wavelength of the femtosecond laser used for excitation (around 790 nm in the case of Ti:Sapphire laser). Recently, a spatial resolution of 20 nm is obtained by integrating LTEM with scanning near-field optical microscopy [16,17].
Our group has developed an advanced version of LTEM, named the THz chemical microscope (TCM) [12,14,18,19,20,21,22,23], which could be used for visualization of chemical reaction and bio-reaction, including small molecules and ions visualization [18,24,25,26,27,28,29,30], cancer cell detection [31,32], antibody–antigen immunoassaying [33], enzyme kinetics analysis [34], and cosmetic and lithium ion battery evaluation [35,36,37,38,39], by measuring the electrochemical potential distribution on the sensing plate. Based on reviewing the recent progress of TCM, we believe that this versatile TCM is promising in academic research and industrial applications (Figure 1).

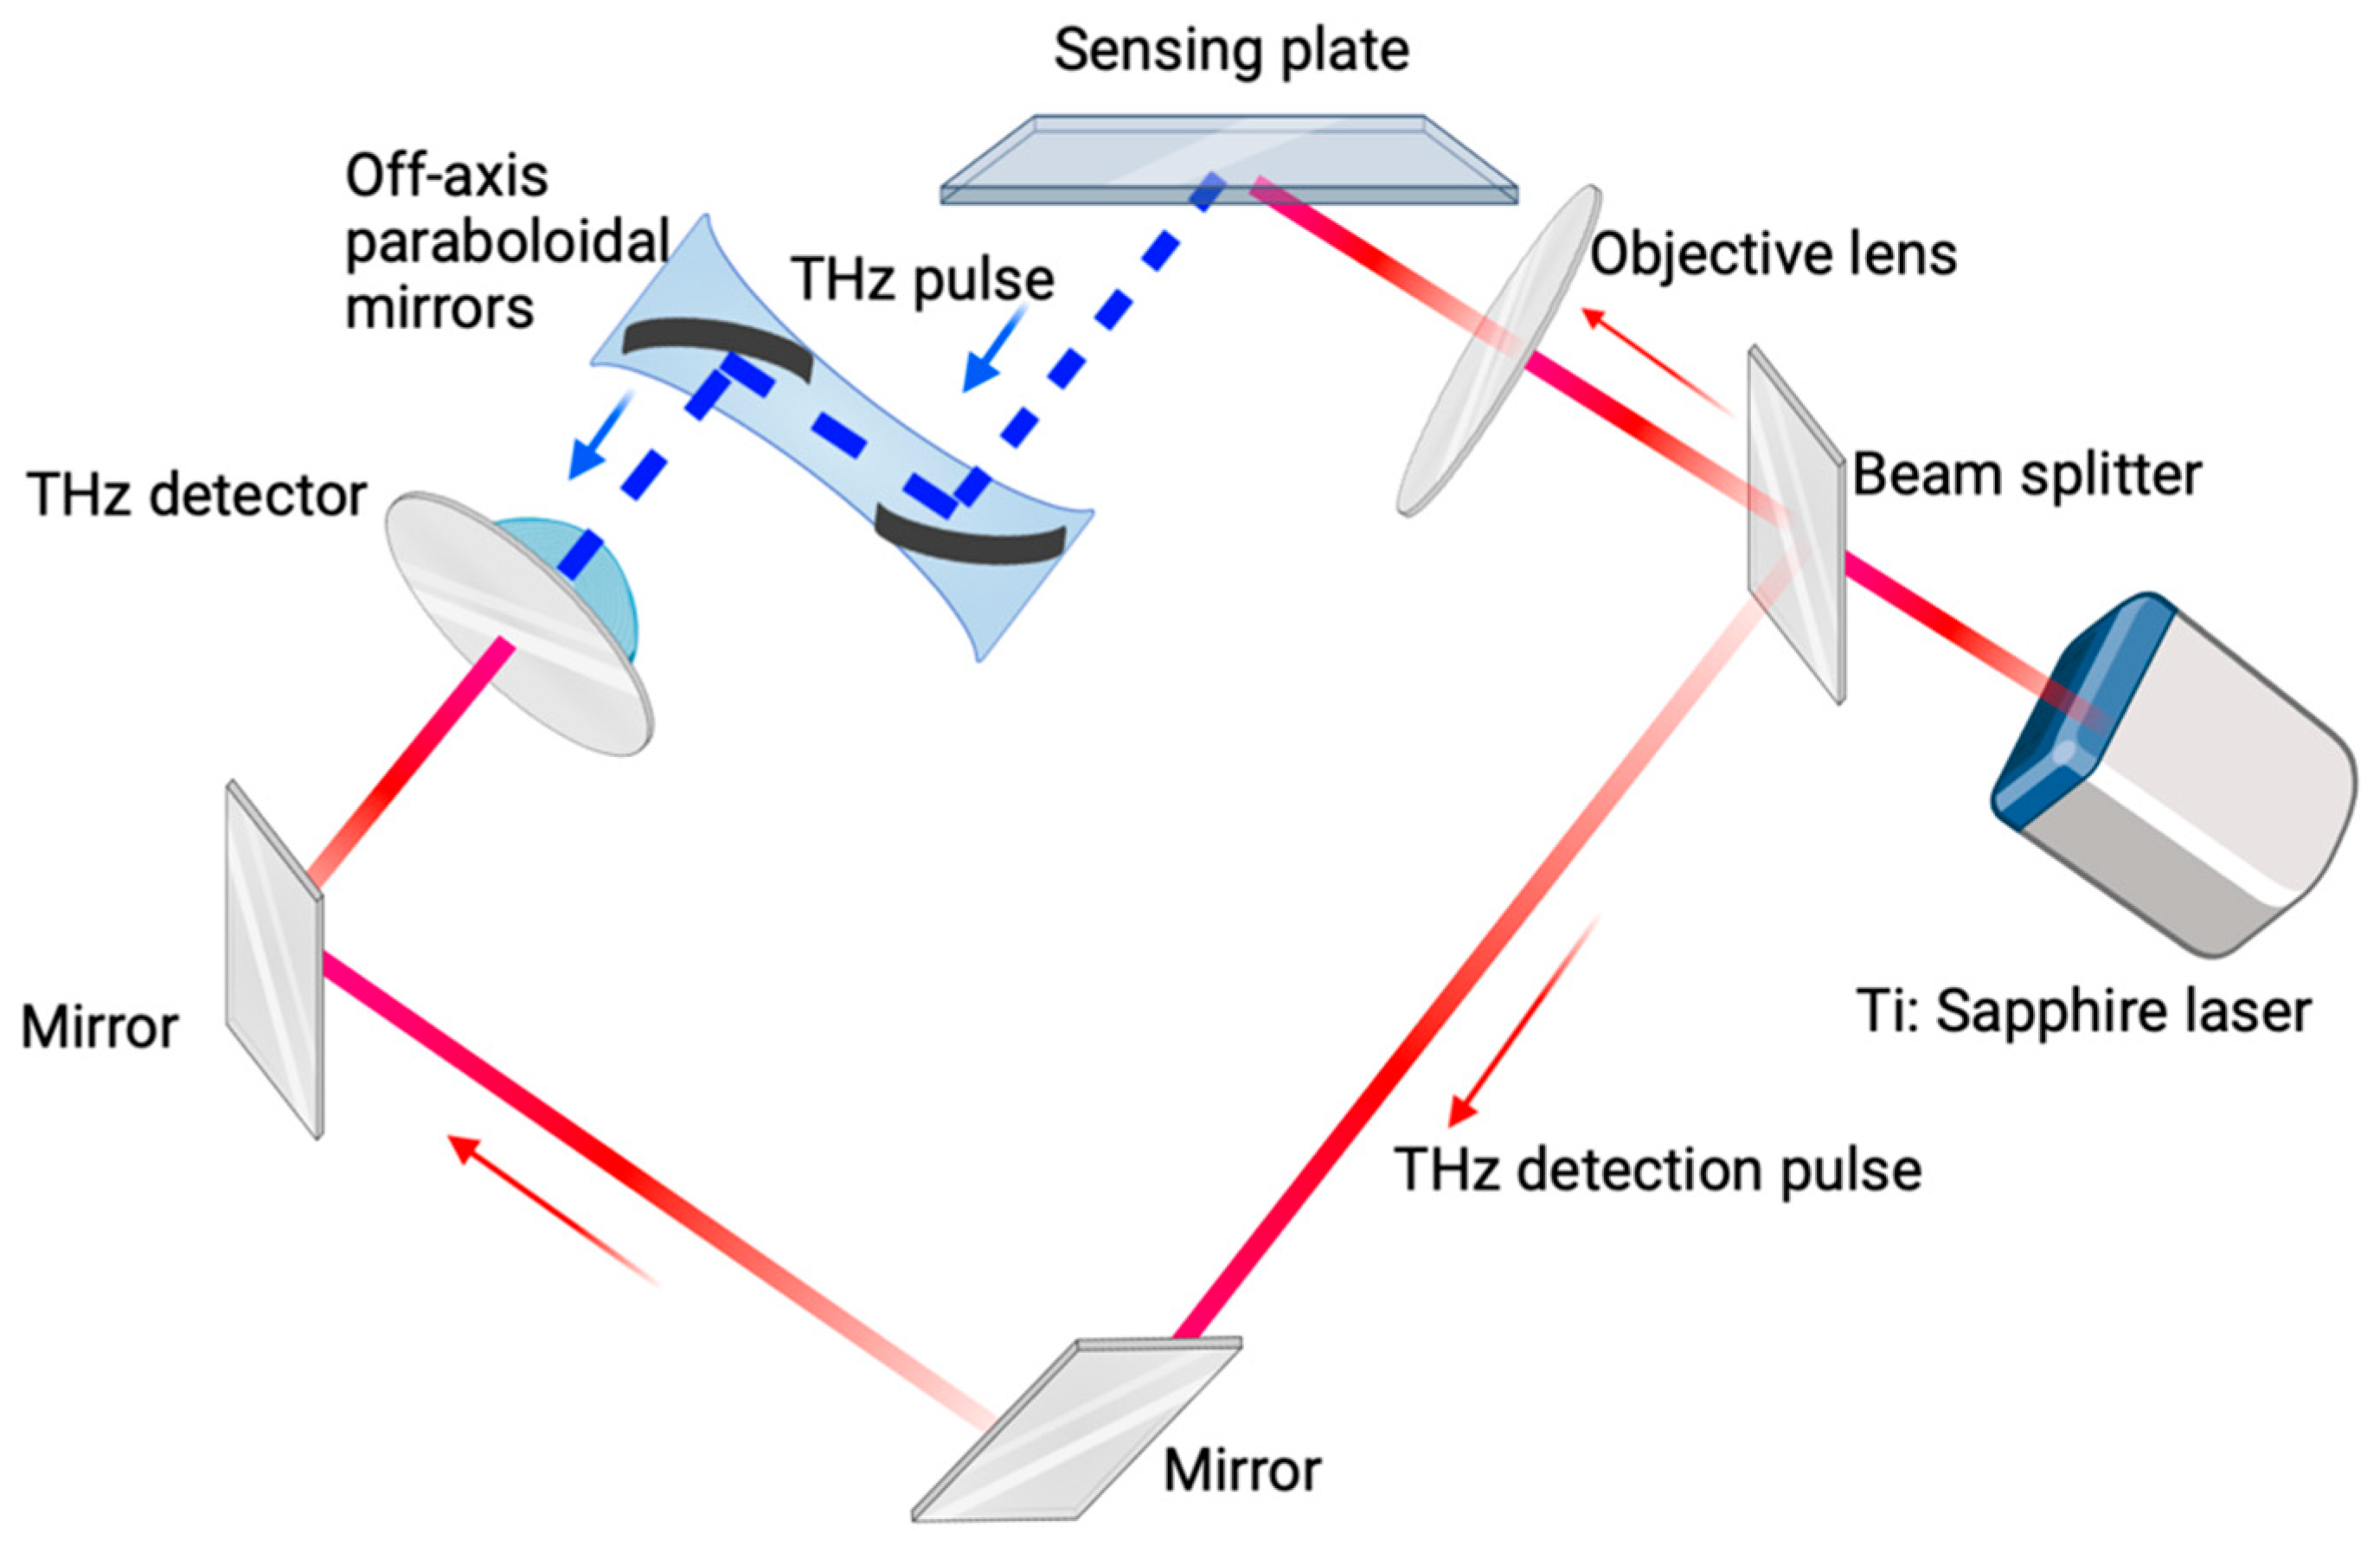
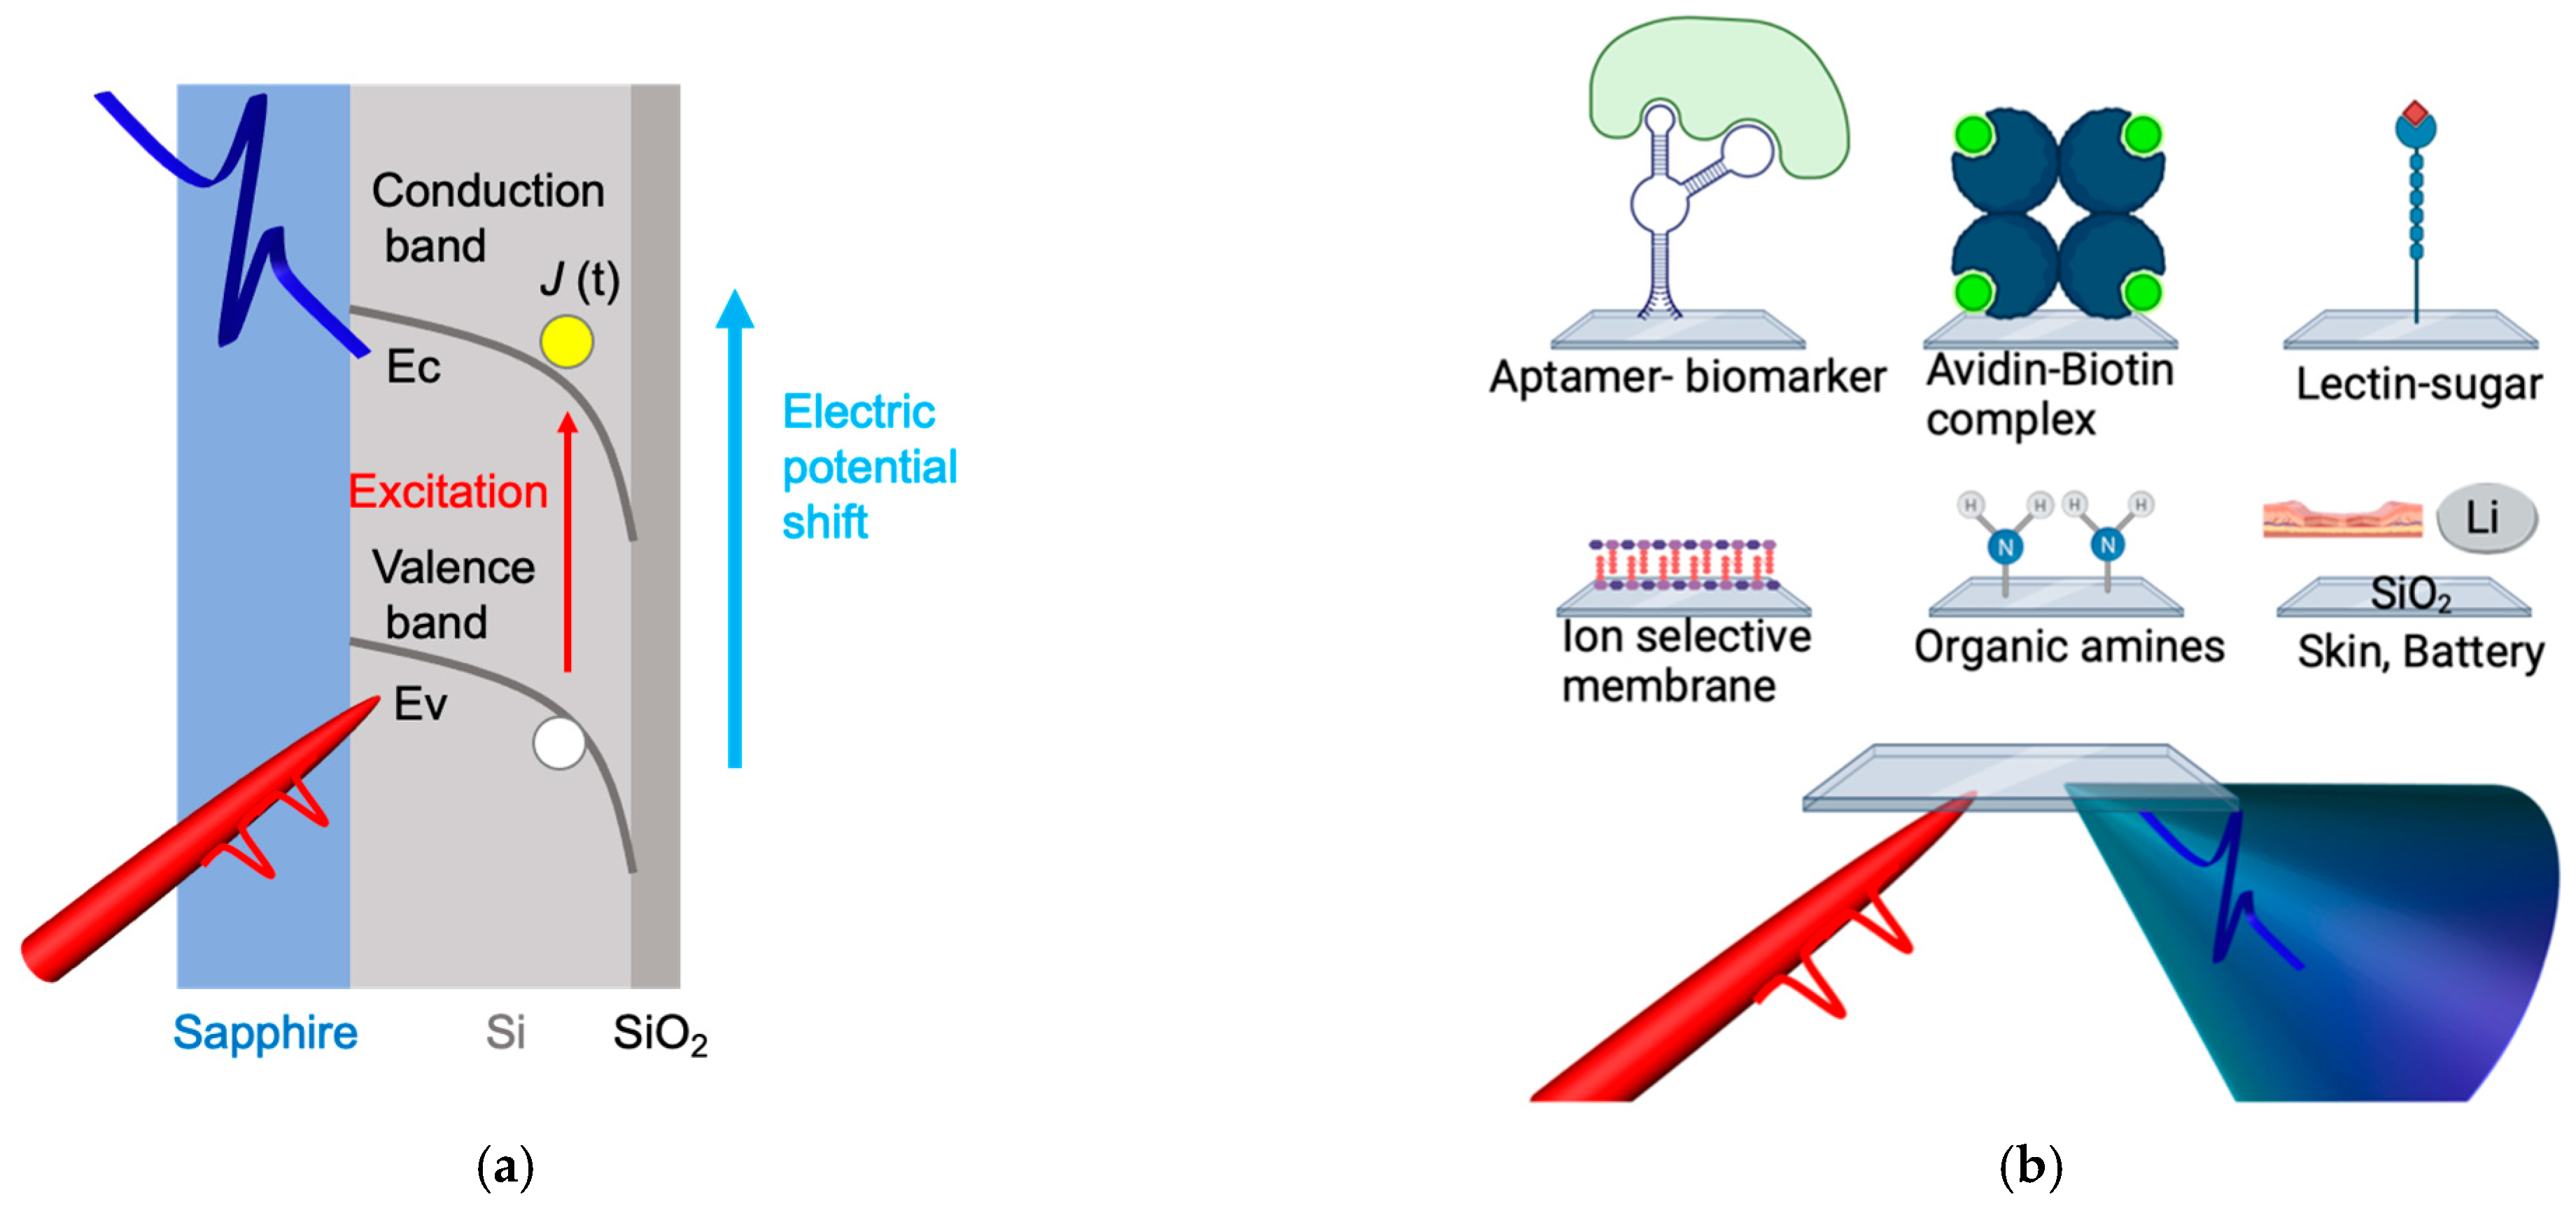
2. Terahertz Chemical Microscope

Figure 2 illustrate the schematic of the optical setup of the TCM. The femtosecond laser pulse is focused by the objective lens on the back surface of the sensing plate, at an incident angle of 45 degrees. A mode-locked Ti: sapphire laser was used as the femtosecond laser light source. The pulse width was about 100 fs, and the central wavelength was 790 nm. The THz wave emitted by the femtosecond laser irradiation is guided to the detector by an off-axis parabolic mirror pair. A low temperature growth GaAs photoconductive antenna is used for the detector. The THz wave detection optical system is almost the same as THz-TDS; however, the antenna arrival time of the trigger pulse is fixed at the point where the maximum amplitude intensity of the THz wave was obtained. The sensing plate is installed in a stepping motor-driven x–y automatic stage and can be replaced. By driving the x–y automatic stage, the THz wave radiation intensity was measured while the laser focusing position on the back surface of the sensing plate was relatively changed. This makes it possible to obtain a distribution image related to the potential of the sensing plate. The spatial resolution of the obtained TCM image is about 5 μm, and a resolution of 1 μm or less can be achieved by improving the focusing optical system [22].
In TCM, the semiconductor device named sensing plate, shown in Figure 3a, is used to measure the electrochemical potential distribution. The sensing plate was made by forming a silicon thin film (Si film) on a sapphire substrate and then forming a silicon thermal oxide film (SiO2 film). The film thicknesses of the Si film and the SiO2 film are 150 nm and several nm, respectively. The size of the sensing plate is 15 mm square for ease of handling, but it can be expanded to the wafer size, according to the area to be measured. In the sensing plate, there are defects near the boundary between the Si and SiO2 films, so the energy band bends toward the boundary surface and a depletion layer electric field is generated. The bending direction depends on the doping type of the Si film. When this sensing plate is irradiated with a femtosecond laser pulse having photon energy equal to or higher than the Si band gap from the substrate side, the carriers inside the Si film are excited and accelerated by the depletion layer electric field. The movement of this photoexcited carrier can be regarded as a high-speed current modulation. According to classical electromagnetism, an electromagnetic wave is generated by a change in current; however, since the change is on the order of femtoseconds to picoseconds, the frequency of the generated electromagnetic wave is also on the order of THz. In addition, the amplitude intensity of the generated electromagnetic wave is proportional to the electric field. In the sensing plate, when the electrochemical potential of the SiO2 film changes, the bending of the energy band changes accordingly. As a result, the depletion layer electric field changes, and the intensity of the radiated electromagnetic waves also changes. The femtosecond laser is focused and the THz wave intensity at each position is measured while scanning [22].
The amplitude of the radiated terahertz wave is expressed by the Equation (1):
E THz ( t ) J ( t ) t e n ( t ) t v + e n v ( t ) t ,
where ETHz(t) is the electric field of the terahertz wave, J(t) is the instantaneous current density, e is the elementary charge, n(t) is the carrier density, and v(t) is the velocity of the carriers accelerated in the Si layer. Because the carrier acceleration∂v/∂t is proportional to El, it indicates that ETHz(t) is proportional to the square root of electric potential.
By doing so, it is possible to obtain a THz wave intensity distribution that reflects the electrochemical potential distribution on the surface of the SiO2 film. Figure 3b shows the chemical or bio-modification methods on the sensing plate, for interest of substances measurements.
Our TCM is different from the conventional terahertz imaging and terahertz spectroscopy, regarding to the principle used. The terahertz wave intensity is changed at the boundary of Si layer when the surface potential changes, due to the chemical reaction on the semiconductor sensing plate. Furthermore, the spatial resolution of TCM (~5 μm) is independent of the wavelength of the generated terahertz, determined by the wavelength of the femtosecond laser (~790 nm), and can be improved by using better condensing optics.

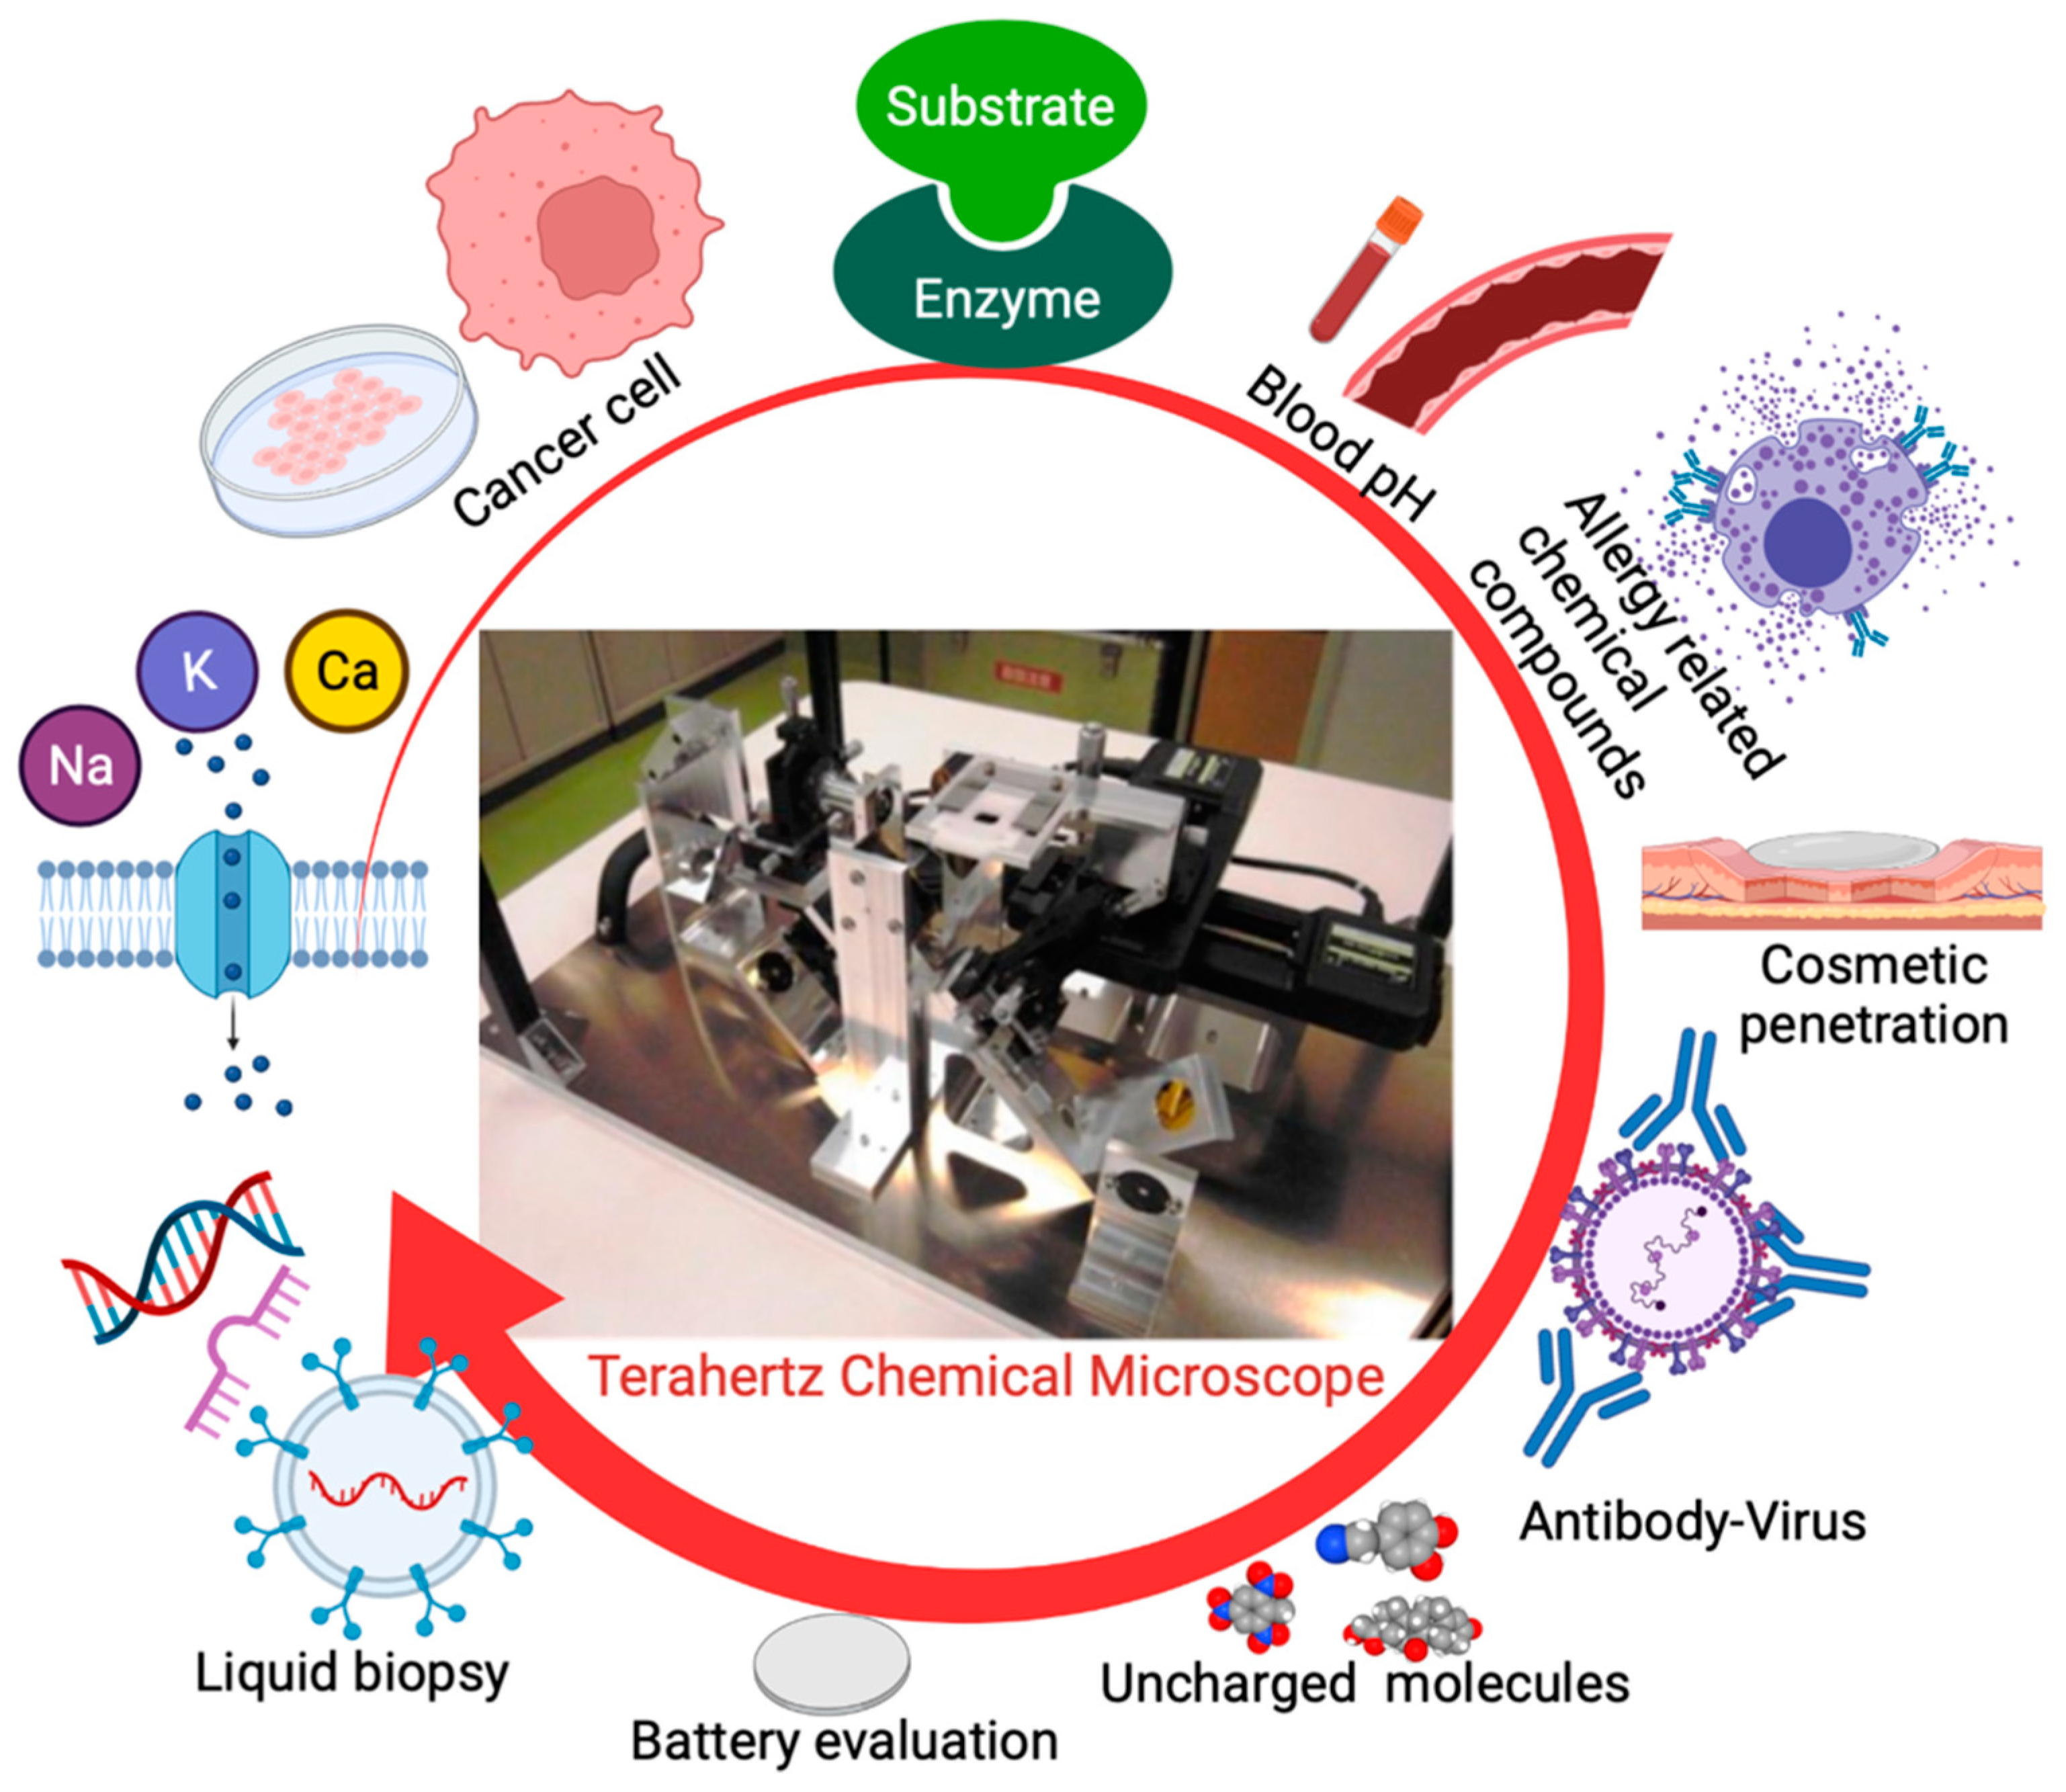
3. A versatile TCM for Biological Substances Detection

TCM has shown great potential in the detection of biological substances, based on recent progress, which is summarized in Figure 4. Specifically, the detection of those biological substances, including ions, small biomolecules, large antibodies, and cancer cells, by TCM is elucidated. Furthermore, its new application in detection of histamine was demonstrated.

3.1. pH and Ion Measurement

Measuring pH and ion concentrations is an effective way to evaluate health condition in medical applications or environmental analysis. Electrochemical sensors or ion-sensitive field effect sensors (ISFETs) are often utilized for specific ions measurement. Basically, pH sensitive materials such as IrO2 [41], ZnO [42], and popular polymer polyaniline (PAN1) [43,44] are developed for pH sensing to be cost-effective and highly sensitive. These materials could accumulate the H+ and OH- ions and are coated to form the electrode. Moreover, nanostructures have been designed for better pH measurements, due to higher surface-to-volume ratio. Different from electrochemical or FET sensors [45,46], in TCM system, the Si–OH groups titrate with the protons in the solution and exist as either uncharged Si–OH or negatively charged SiO (Equations (2) and (3)) [22,28]. An electric double layer is, thus, formed at the SiO2 surface. The electric potential ψ at the surface is determined by the Nernst Equation, which depends on the proton concentration.
SiOH 2 + SiOH + H +
SiOH SiO + H +
Based on this detection mechanism, as shown in Figure 4a, an extremely small volume of 16 nL buffer solutions were successfully measured through array-based microwells [28].
Ion measurements play a very important role in evaluating the biological activity. In ion measurement by TCM, a sensitive membrane, on which the electrical potential changes depending on a specific ion concentration, is immobilized on the surface of the sensing plate. In the presence of ions with a certain concentration C0, the chemical potential (μ0) on the surface of the sensitive membrane is expressed as follows:
μ0 = Gi0 + ziFΨ0 + RT lnC0,
Here, Gi0 represents the standard generated Gibbs free energy, and zi, F, R, and T represent the valence, Faraday constant, gas constant, and temperature, respectively. Also, Ψ0 is an electrical potential. This equation indicates that the surface electrical potential of the membrane changes as the ion concentration in the liquid changes, so it can be measured by TCM.
For Na+ ions, ETH2120 as an ionophore was used. Dioctyl adipate (DOA) was used as the plasticizer and sodium tetraphenylboron (NaTPB) was used as an additive to stabilize the potential. For K+ ions, valinomycin as an ionophore was used, and as an additive, potassium tetraphenylboron (KTPB) was used. They are mixed with resins chloride (PVC), which is the base material of the membrane, and dissolved in tetrahydrofuran (THF), respectively. Then the liquid membrane solution was dropped onto the sensing plate overnight to volatilize THF at room temperature [22,25].
Figure 4a showed the mapping terahertz images obtained with sodium (Na+) and potassium (K+) sensitive membranes, immobilized on the sensing plate. It visualized the distribution of changes in THz wave intensity, when the Na+ ion concentration changes from 10−4 mol/L to 10−1 mol/L [18,25]. In the future, we are considering developing a plate with laminated multi-sensitive membranes and applying it to multi-ion screening.

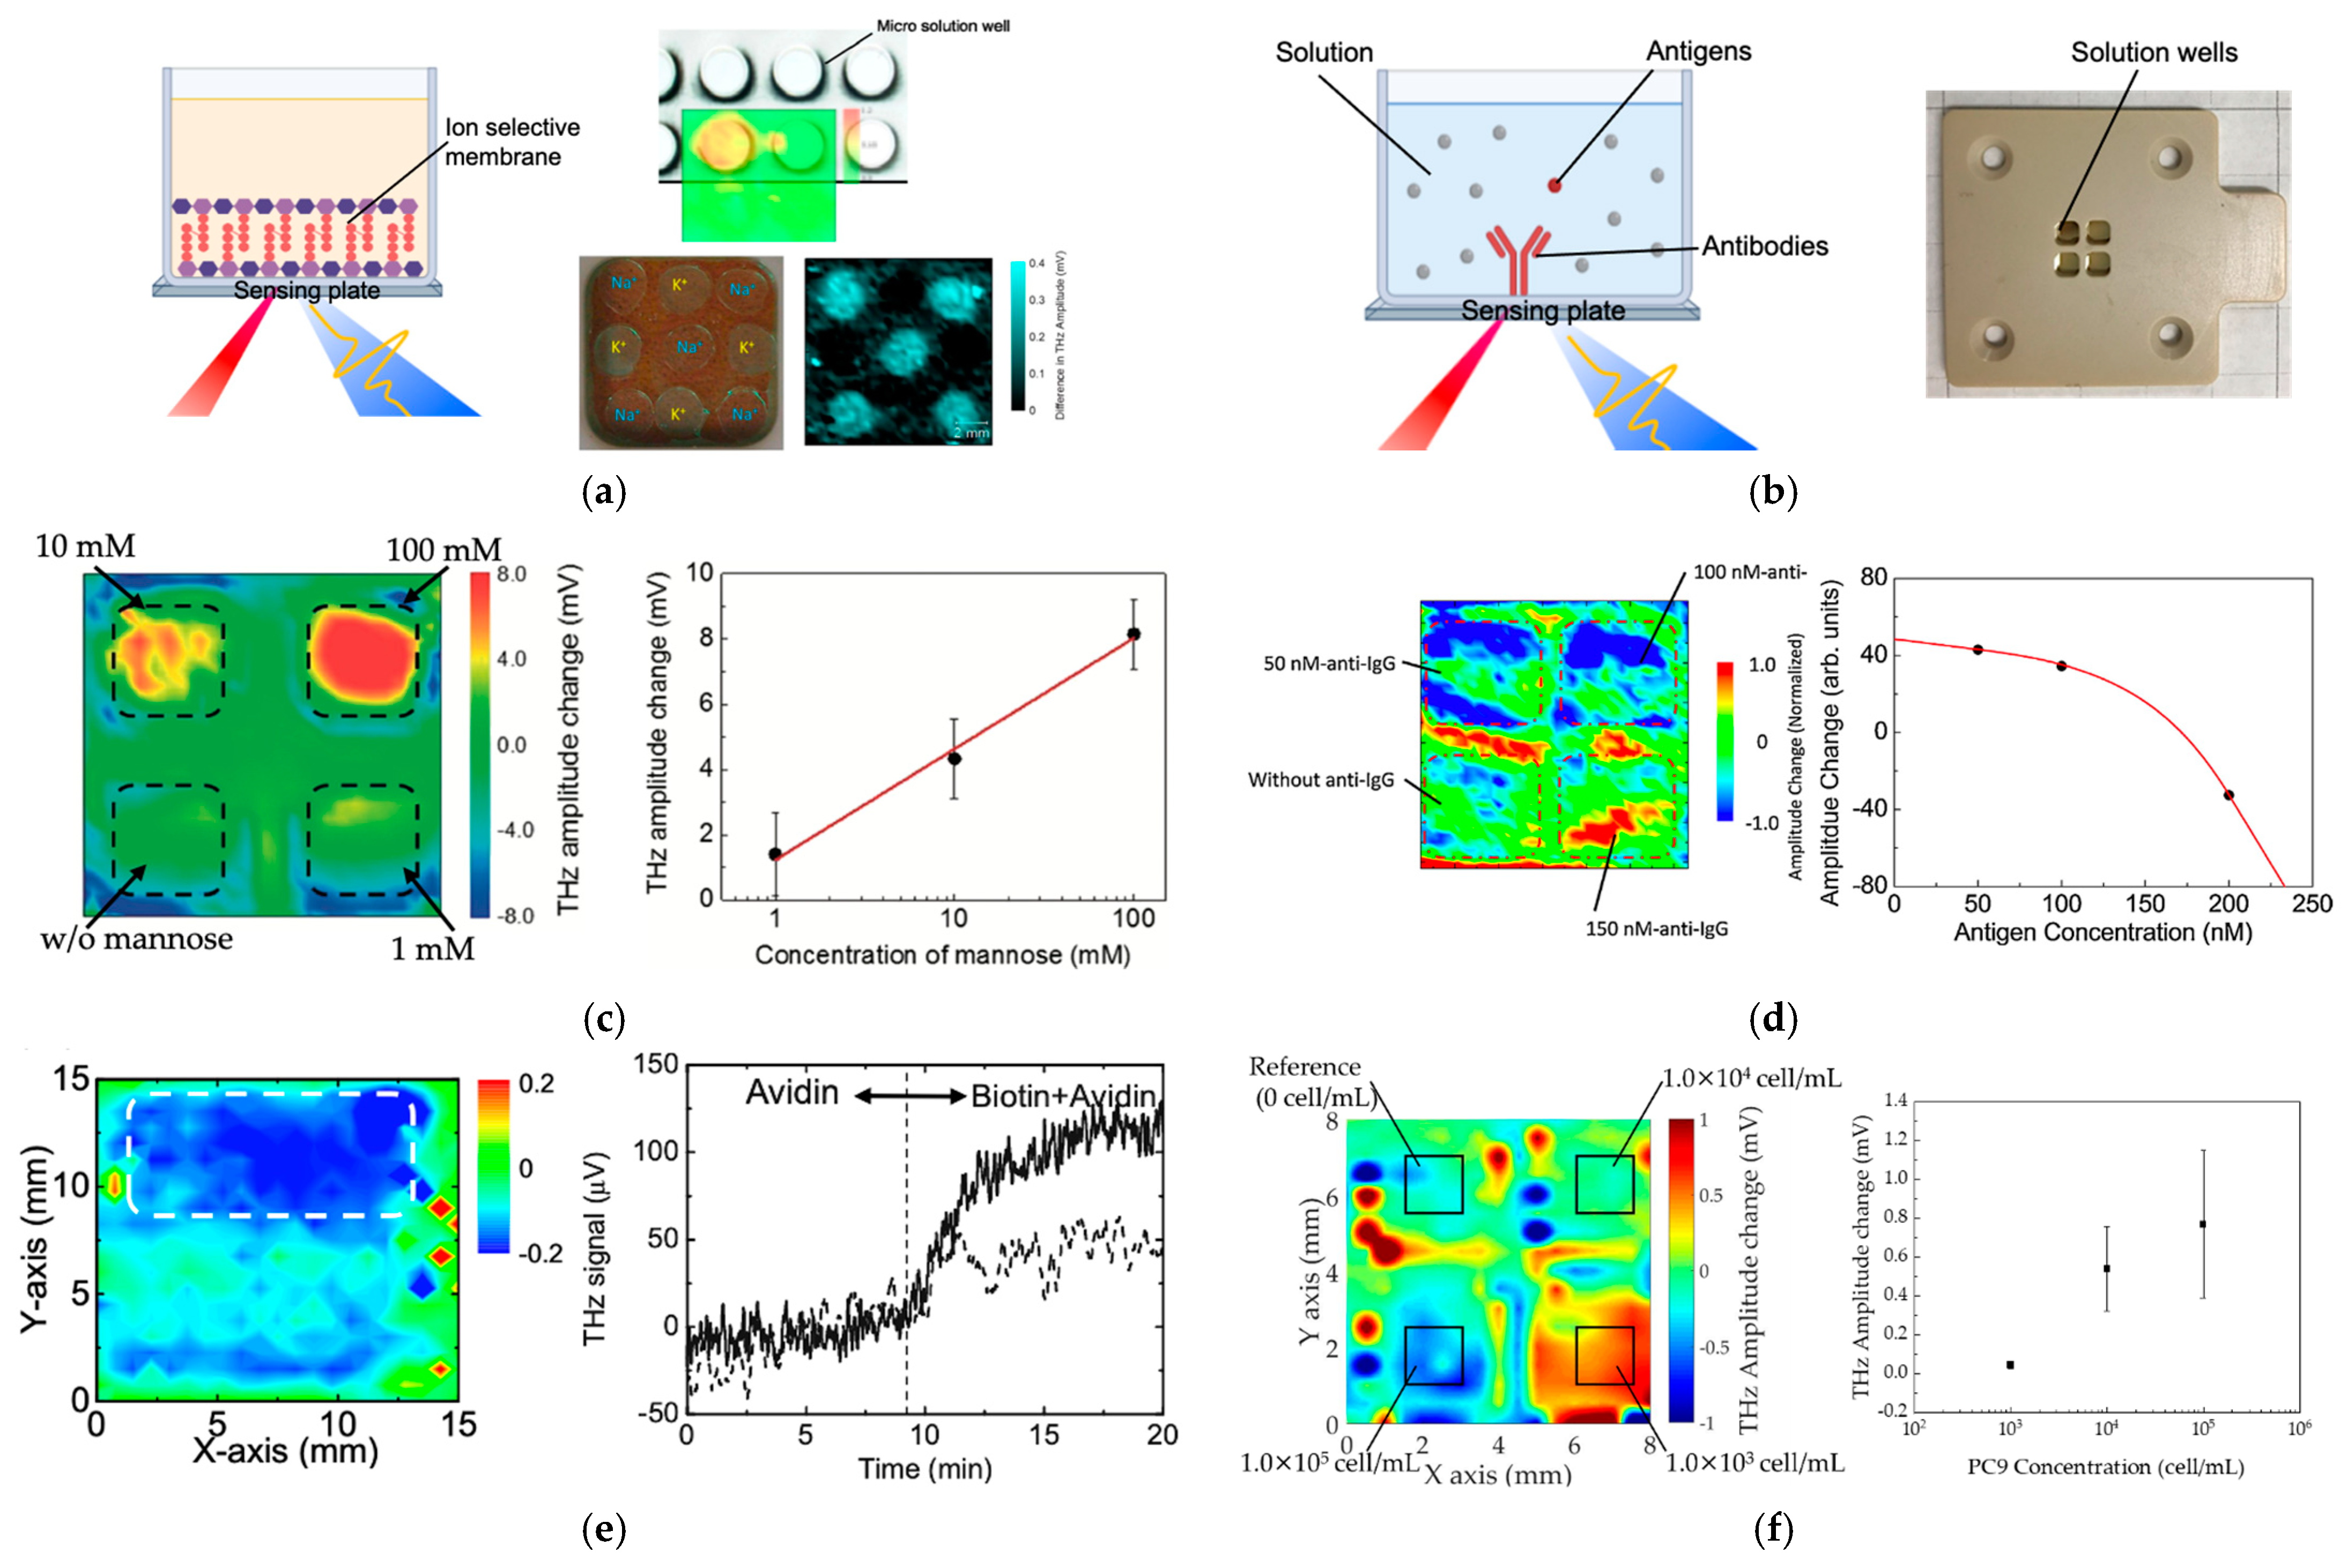
3.2. Lectin–Sugar/Sugar Chain Interactions and Antibody–Antigen Immunoassay

Small molecules, with or without charge, could also be measured by TCM. Figure 4b shows a cross-sectional schematic of the sensing plate with antibodies on the surface of the sensing plate and a photograph of the four solution wells formed through an engineering plastic on the sensing plate. Each well was 3 × 3 mm2 in area and 3 mm deep. The antibodies were immobilized on the surface of the sensing plate by a covalent binding method. Different concentrations of the small antigen molecules (about 30 μL in each well) were introduced, and the surface potential was changed because of the charged molecules capture. Meanwhile, the change in THz amplitudes were monitored.
Lectin–sugar/sugar chain interactions take an important part in various bioactivities, such as cell recognition, adhesion, blood typing, and ligand–receptor recognition. Accurate and efficient techniques for the screening of lectin–sugar/sugar chain interactions are important to understand and elucidate the mechanisms of complicated bio-reactions and improve to discovery novel drugs. Figure 4c showed the amplitude was changed in the THz pulses before and after adding the D-(+)-Mannose (MW: 180), reacting with Con A immobilized on the sensing plate and plotted the amplitude changes against three different mannose concentrations. As shown, the amplitude change increased by increasing the mannose concentration in the dashed line region. The sensitivity calculated as the slope of the linear fitting was 3.3 mV/dec. The sensitivity could be enhanced by increasing the signal-to-noise of the THz detectors. The limit of detection (LOD) was calculated as 0.3 mM at the background THz amplitude 0.3 mV [24].
Antigen-antibody immunoassay plays an important role in a wide range of biotechnology fields, such as pathological examination, drug discovery, and life science research. The enzyme-linked immuno-sorbent assay (ELISA) method as gold standard is widely used for immunoassays. There are several methods, such as the direct, indirect, sandwich, and competitive methods, for optimized measurement, depending on the antigen-antibody combination. In which, it requires an enzyme labeled antigen or antibody or secondary antibody to trigger the coloration reaction. Procedures including labeling secondary antibody and washing of the unbound label are required, and it often takes several hours or more. Several label-free techniques have been developed for high sensitivity and high performances of immunoassays. Surface plasmon resonance (SPR) sensor is a promising approach to detect interaction especially between large biomolecules without labeling in real-time measurement [47,48,49,50]. SPR measures the changes of refractive index occurred at the gold or silver surface, on which antibody is usually immobilized. When the target substances bond to the sensor surface, the resonance angle shifted, which is proportional to the biomolecule concentration near the surface. However, it is still difficult to detect antigens with a small mass (1000 Da or less). FET is another promising label-free approach for immunoassays [51,52,53]. Basically, the gate electrode of FET was functionalized with specific antibody to react with the antigen. The change in the distribution of electrons during the reaction can be measured as a change in the threshold voltage, which could provide higher sensitivity. Dealing with Debye length issue is still a great challenge for high-throughput measurement.
On the other hand, in the measurement using the TCM system, the potential change on the surface of the sensing plate, due to the binding of the protein itself or the adsorption reaction, is measured [33]. Therefore, unlabeled antigen-antibody reaction measurement can be realized without depending on the mass of the measurement sample. Here, an example of measuring the binding reaction of mouse IgG (Ig: immunoglobulin, antibody) was shown. Mouse IgG was immobilized on the sensing plate by covalent bonding. Then, sheep anti-mouse IgG was applied to the surface of the sensing plate to which IgG was bound. Figure 4d showed the difference between the TCM images measured before and after binding the sheep anti-mouse IgG, that was the change in the terahertz wave intensity distribution. In this way, TCM can capture the antigen-antibody reaction distribution as an image. In the future, we aim to measure the distribution of several proteins with the aim of increasing sensitivity and resolution. Moreover, visualization of a biotin-avidin protein complex was demonstrated by using TCM as shown in Figure 4e. A half area of the sensing plate was immobilized with avidin through amine-coupling. Real-time recording of the THz amplitude changes during biotin introduced in a flow channel was obtained. A low concentration 10−12 mol/L of biotin was detected as an initial demonstration [26]. By analyzing the results, we believe that our TCM could provide rapid, real-time, high sensitivity, and label-free immunoassays.

3.3. Detection of Cancer Cells

THz technology has showed great potential in biomedical diagnosis due to its non-invasive and label-free property. Significant progress has been made to accelerate the THz imaging in this field. Son et al. have developed THz-TDS imaging coupled with magnetic resonance (MR) imaging for cancer cells by modifying cancer cells with superparamagnetic iron oxide nanoparticles both in vivo and in vitro [54]. Seo et al. developed a mouse brain tissue THz imaging using large-area array-based terahertz metamaterials with real-time historical analysis. Ultrasensitive imaging of real bio-samples was realized [55]. Serita et al. developed a terahertz near-field microscopy for label-free observation of human breast cancer cell density [56,57,58,59]. Their results may further explore the application of terahertz imaging for cancer tissue biopsy.
Conventional evaluation the ratio of cancer cells includes several steps: the specimen tissue should be first fixed to make formalin-fixed paraffin-embedded (FFPE) by replacing water with formalin degreased with alcohol, followed by paraffin embedding; tissue sliced and stained, then visually observed using an optical microscope by pathologists. The sophisticated progress required more than two days and skilled pathologist [60,61,62].
Different from the THz imaging system mentioned above, the TCM exhibits unique detection advantage. In recent investigation, Ozaki et al. demonstrated the high-sensitivity detection of metastatic breast cancer cells using TCM. In their study, single stranded (ss) DNA aptamer named mammaglobin B1 (MAMB1) and mammaglobin A2 (MAMA2) were immobilized on the sensing plate. These aptamers could specific bound to mammaglobin B and mammaglobin A proteins, which were overexpressed on the surface of MCF7 and MDA-MB-415 breast cancer cells. By measuring the THz amplitude change, one breast cancer cell in a 100 μL of sample was detected [31]. Furthermore, biotin-labeled cytokeratin conjugated with avidin immobilized on a sensing plate surface was developed for human lung adenocarcinoma cells (PC9) detection. Figure 4f showed the THz amplitude for different concentrations of lung cancer cells and the response curve. After each measurement, the THz amplitude was normalized by pH measurement, which aims to compensate for the variability of the sensitivity of the sensing plate [40]. There results indicated that the TCM could be a novel tool to detect cancer cells rapidly, label-free, and with high sensitivity.

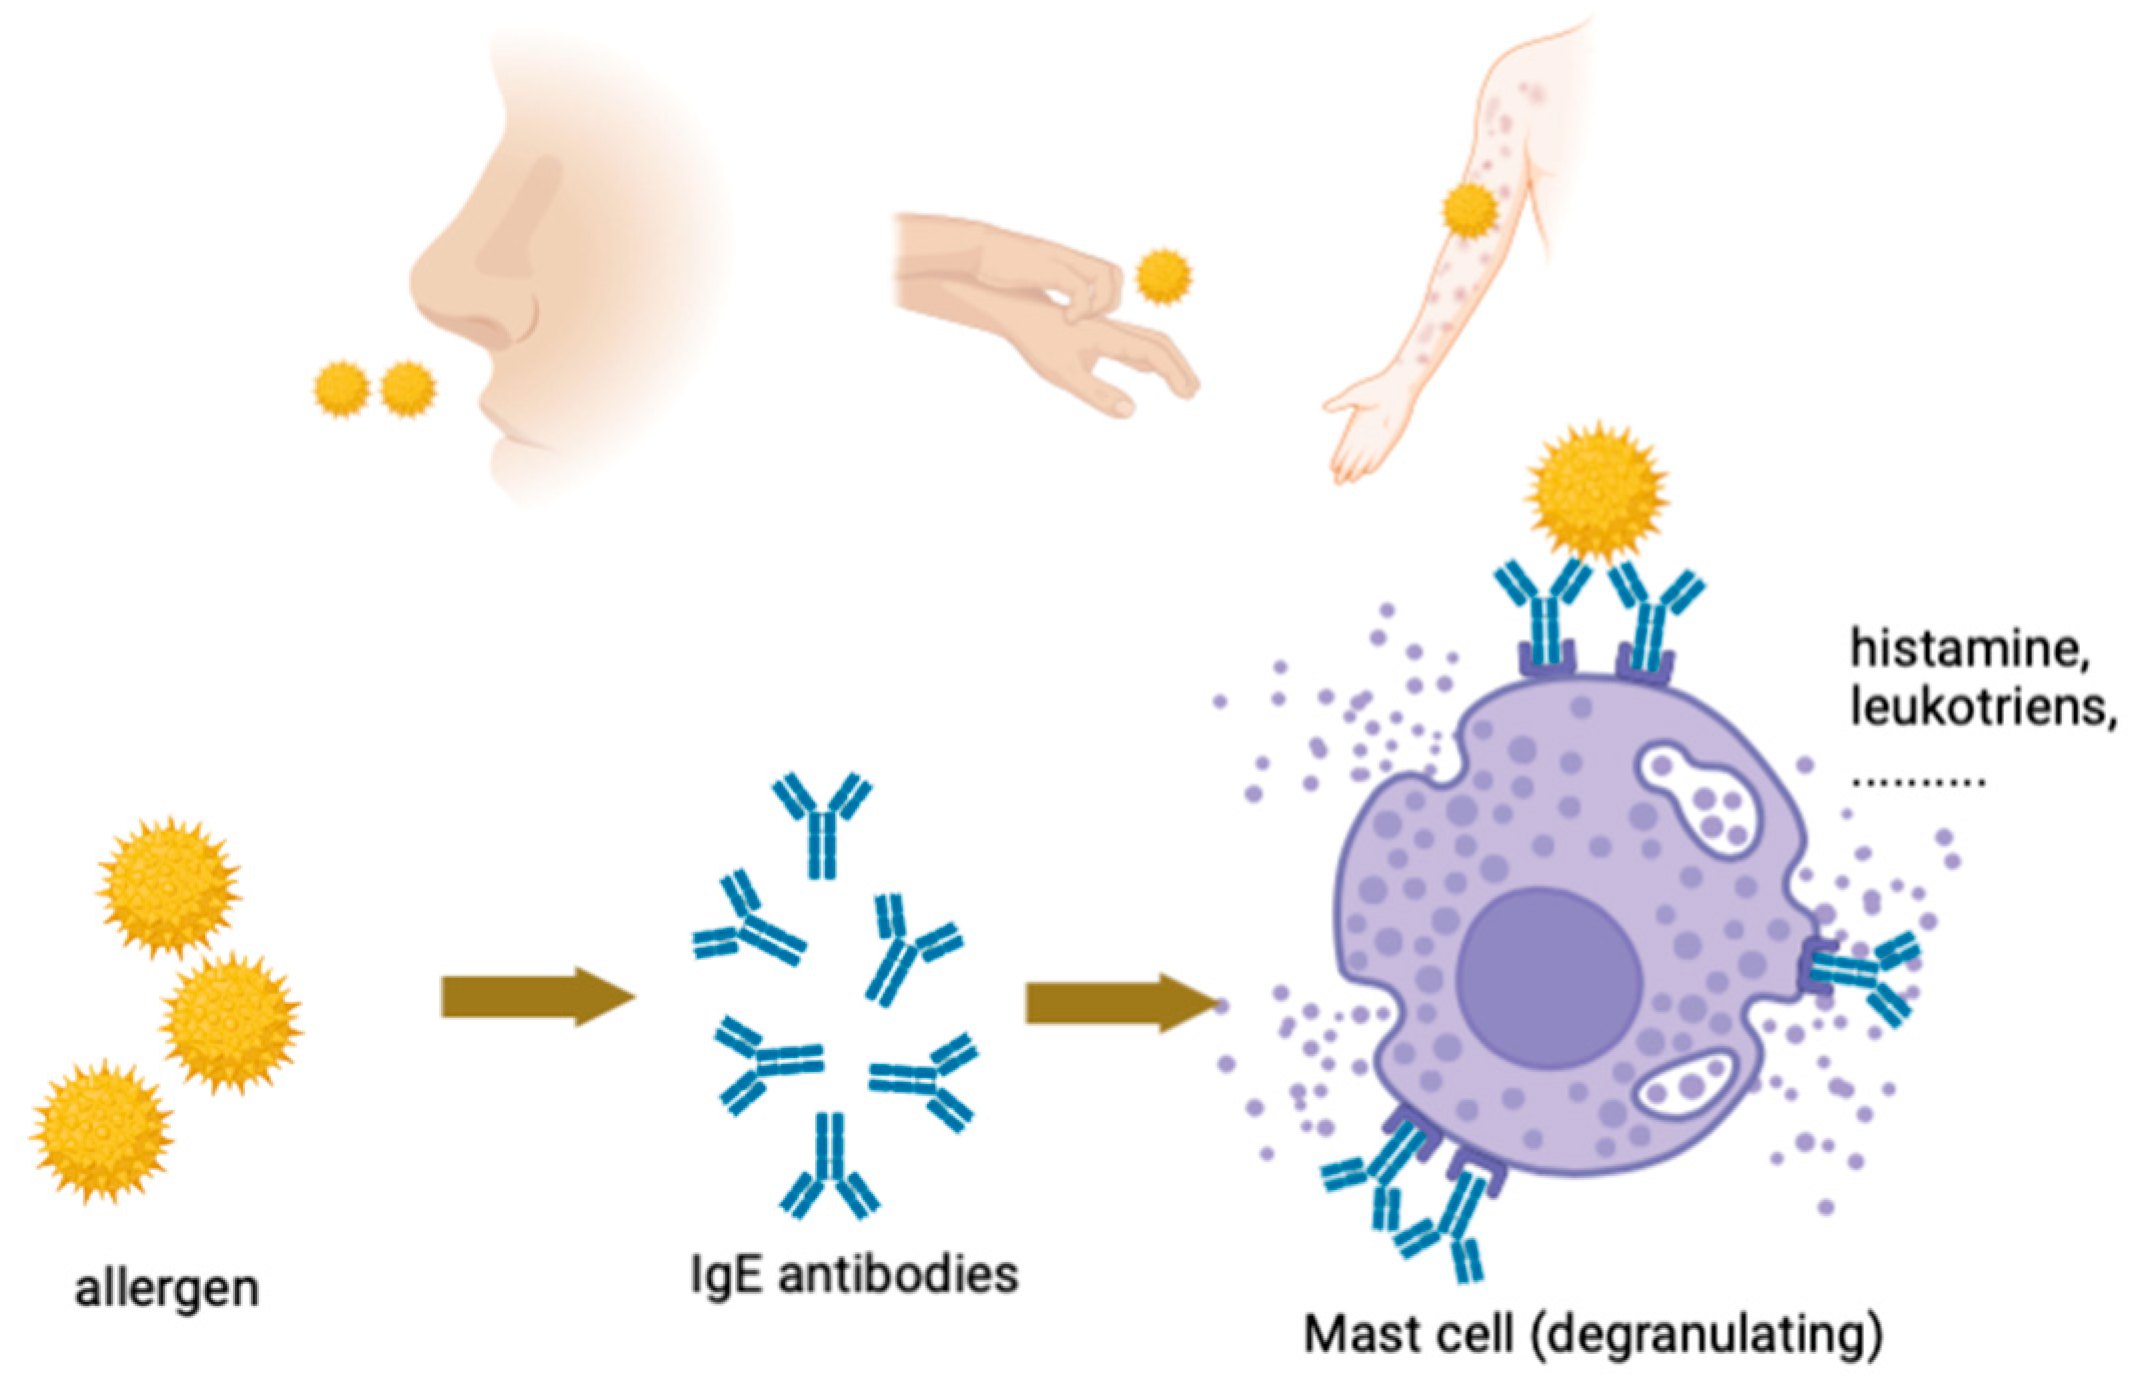
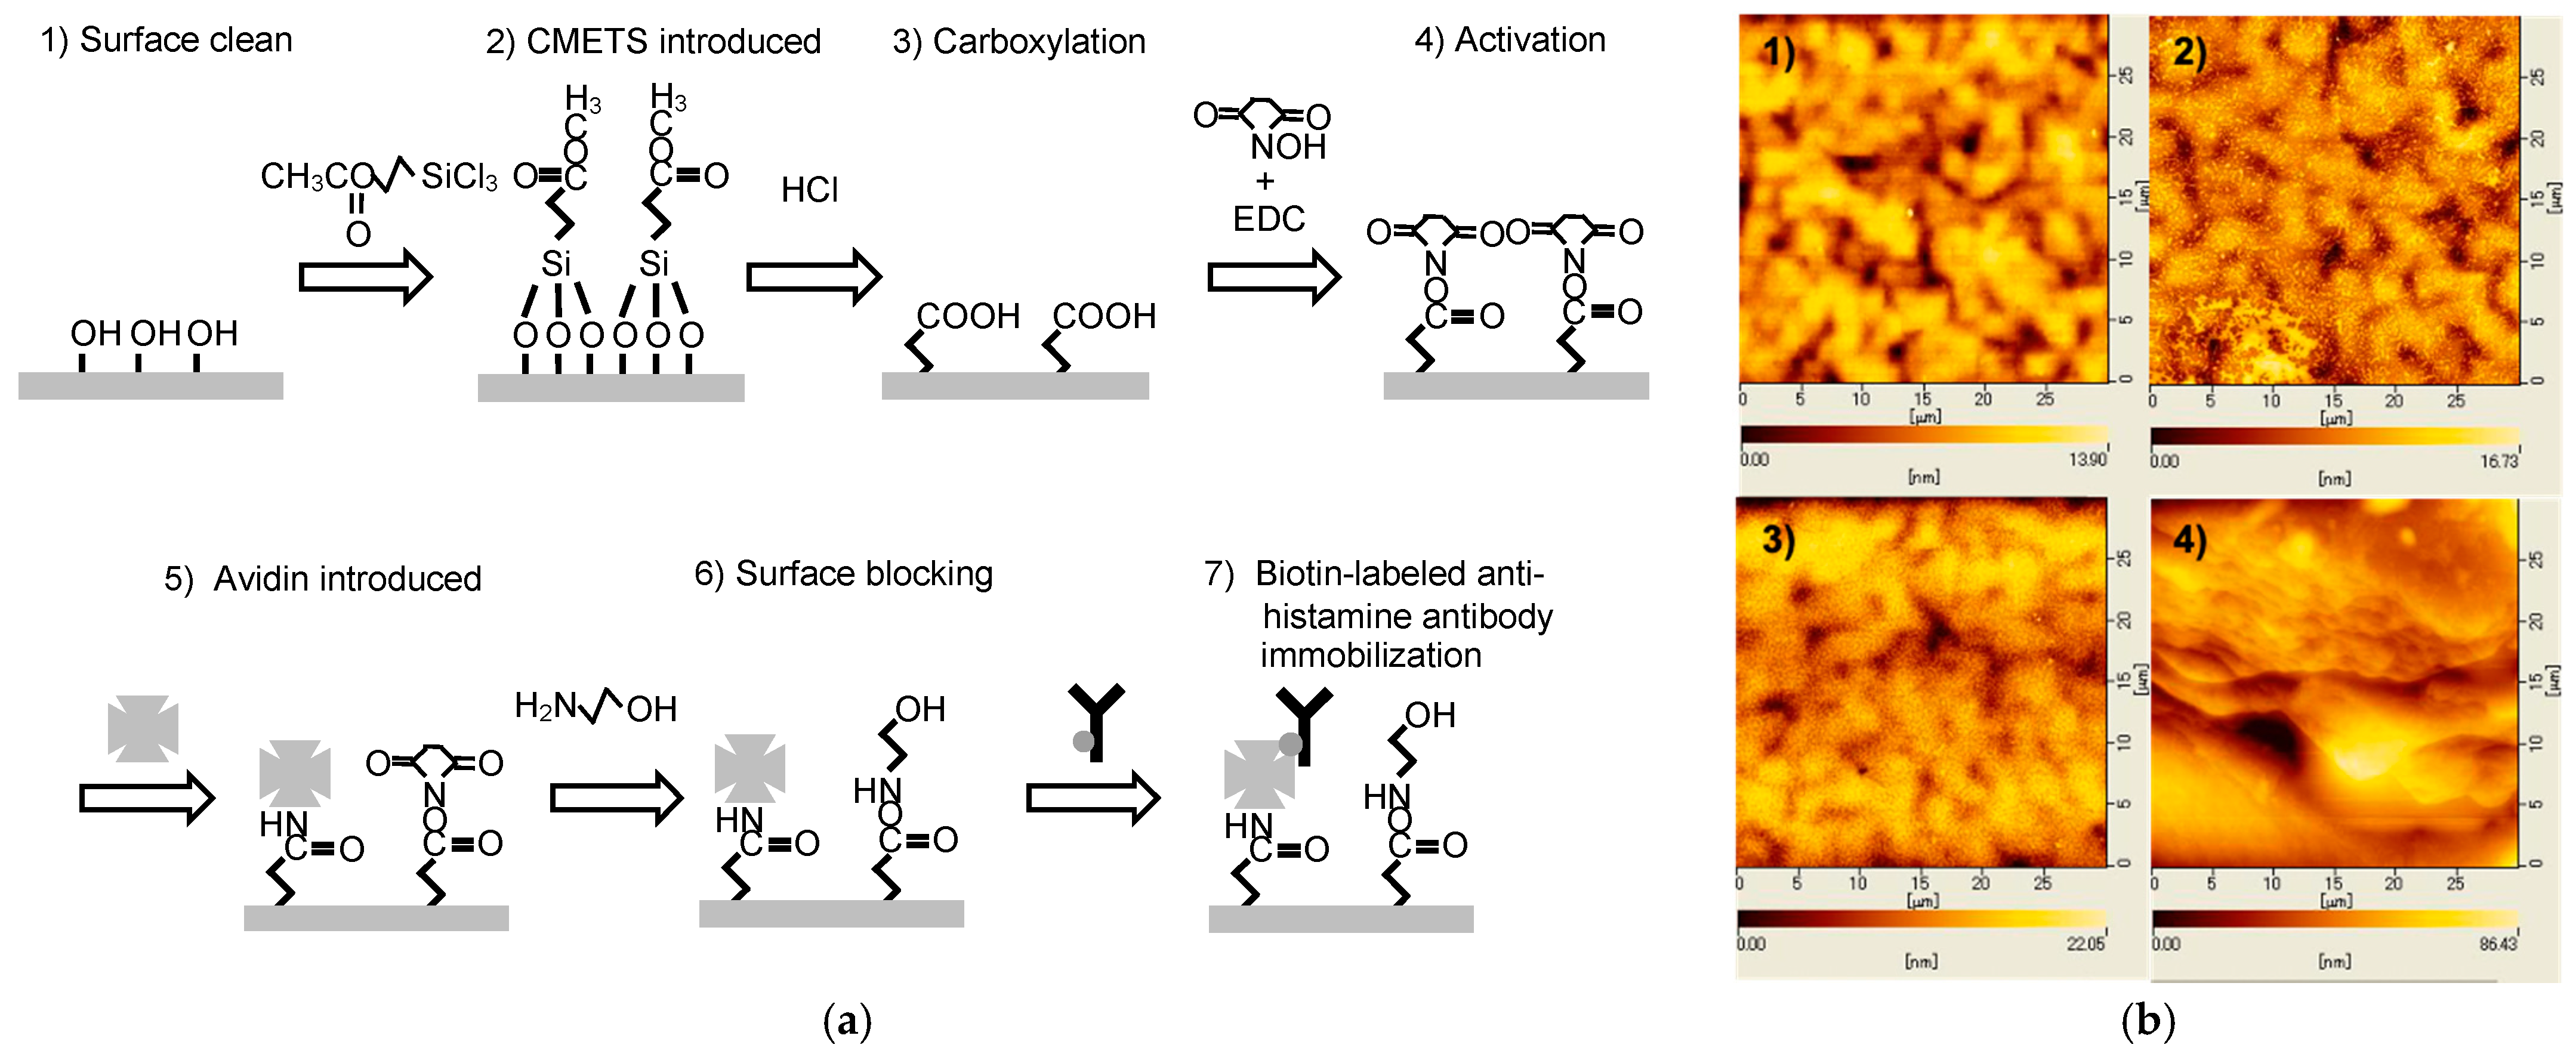
3.4. Detection of Histamine Released from Allergic Response

A histamine is a vital biomarker during allergic march which it is released from the cells after allergens contact (Figure 5). It could cause edema, bronchial asthma, and lead to different diseases. Current in-vivo and in-vitro inspections, including prick test, oral food challenge, and specific IgE tests, as well as a histamine release test (HRT), are recognized as the most reliable methods and, thus, widely used [63,64,65,66]. However, these kinds of inspections most require injection of allergen into the body at a risk of causing anaphylactic shock, delicate supervision by a physician, or large amount of blood sample consumption and difficult to discriminate specific allergen among many types of candidates. For novel diagnosis of allergic march at the early stage, the TCM was utilized to detect the histamine level in buffer solution for the fast screening of allergens.
Figure 6a shows the procedure of surface modification on the sensing plate. First, the sensing plate was ultrasonically cleaned with acetone and ethanol. Second, the surface was soaked in a 0.5 mM 2-carbomethoxy ethyltrichlorosilane (CMETS) (Fujifilm Wako, Osaka, Japan) solution of CMETS in toluene (99.5%, Fujifilm Wako, Osaka, Japan) at −15 °C for 1 h. The ester group was produced. By immersing the sensing plate in 35% HCl (35–37%, Fujifilm Wako, Osaka, Japan) at room temperature for 24 h, the carboxylation reaction was realized. After that, 3 mM N-hydroxysuccinimide (NHS) (98.0 ~ 102.0%, Fujifilm Wako, Osaka, Japan) and 1 mM 1-ethyl-3-(3-dimethrlaminopropyl)-carbodimide hydrochloride (EDC) (Over 98.0%, Fujifilm Wako, Osaka, Japan) in phosphate-buffered saline (PBS) (pH 7.4, Thermo Fisher Scientific, Waltham, MA, USA) were prepared, and the carboxyl group was activated by immersing the sensing plate in an NHS & EDC solution at pH 7.4 for 30 min at room temperature. The sensing plate was glued to a measuring substrate with four wells, and avidin (affinity purified, Vector Laboratories, Burlingame, CA, USA), diluted to 0.147 μM with PBS and 30 μL, was pipetted into each well for immobilization at 4 °C for 24 h. Then, the surface was blocked by 1 mM 2-Aminoethanol (Over 99.0%, Tokyo Chemical Industry, Tokyo, Japan) at room temperature for 15 min. Finally, biotin-labeled anti-histamine (Monoclonal Mouse Histamine Antibody, Protein A, Protein G affinity chromatography, LifeSpan BioSciences, Inc., Seattle, WA, USA) antibody was diluted with PBS to a final concentration 0.33 μM, incubated at room temperature shaking at 45 rpm for 30 min. Atomic Force Microscope (AFM) (Hitachi High-Tech Science Corporation.) was performed for surface morphology observation during the modification procedure. As shown in Figure 6b, the surface modification was confirmed by surface morphology and height profile observation. The average height was 1.80 nm, 1.97 nm, 2.69 nm and 10.4 nm for before avidin immobilization, after avidin immobilization, after surface blocking, after biotin-labeled anti-histamine antibody immobilization, respectively.
The measurement procedure was described as follows. First, reference solution and three different concentrations of histamine 3 nM, 30 nM, and 300 nM were pipetted into four wells to interact with biotin-labeled anti-histamine antibody modified sensing plate shaking at 45 rpm for 1 h. After reaction, the wells were washed with PBS buffer for 10 times to remove the unbound histamine. Figure 7a showed the THz amplitude changes before and after histamine reaction with antibody. The terahertz amplitude was automatedly calculated by lab-developed program with MATLAB software (R2017a, The MathWorks, Inc., Japan) in the 1.5 square mm area excluding the singularities, which was marked with black line in Figure 7a. Figure 7b showed that a linear relationship was observed by plotting the THz amplitude against the histamine concentrations in logarithmic scale, in which the THz amplitude was offset by 3 nM. Large variation in the THz amplitude was obtained at concentration of 30 nM because of the variation using different sensing plates. However, the variation among the sensing plates can be compensated by pH measurement for more accurate detection [40]. By using TCM, trace level down to nM concentration of histamine could be detected, and high correlation coefficient (R2 = 0.995) was obtained. The total measurement time was about 20 min, which was significantly shorter than current wildly used methods. The results demonstrated that TCM could be a novel approach for many small biomolecules monitoring.

4. Conclusions

TCM has been proposed and developed not only for small molecular weight molecules such as ions, proton, chemical substances with/without charge, but also large molecular weight biomolecules including cancer marker, proteins, antibodies, enzymes. Various types of surface functionalization method can be achieved on the sensing plate for interest of substances. The new application in detection of histamine that released from allergic response for fast screening of allergen was also explored. Very low concentration of histamine (nM level) could be measured. By using TCM, label-free, rapid, and highly sensitivity, accurate measurements could be achieved. These features demonstrate that TCM has a great potential in future chemical sensing and biosensing. More impressive progress is that TCM is now being developed and applied to detect SARS-CoV-2, liquid biopsy, and neurotransmitters, as well as other biological substances, which aims to provide an effective and accurate method to fight against diseases and environmental threats around us.

Author Contributions

Conceptualization, J.W., K.S. (Kosuke Sato) and T.K.; methodology, J.W., K.S. (Kosuke Sato) and T.K.; software, K.S. (Kosuke Sato); validation, K.S. (Kosuke Sato), Y.Y. and T.K.; formal analysis, K.S. (Kosuke Sato); investigation, K.S. (Kosuke Sato) and Y.Y.; resources, T.K.; data curation, K.S. (Kosuke Sato); writing—original draft preparation, J.W. and K.S. (Kosuke Sato); writing—review and editing, Y.Y., K.S. (Kenji Sakai) and T.K.; supervision, T.K.; project administration, T.K. All authors have read and agreed to the published version of the manuscript.

Funding

This research received no external funding.

Institutional Review Board Statement

Not applicable.

Informed Consent Statement

Not applicable.

Data Availability Statement

Raw data that support the findings of this study are available from the corresponding author, upon reasonable request.

Conflicts of Interest

The authors declare no conflict of interest.

References

  1. Auston, D.H.; Cheung, K.P.; Smith, P.R. Picosecond photoconducting Hertzian dipoles. Appl. Phys. Lett. 1984, 45, 284–286. [Google Scholar] [CrossRef]
  2. Auston, D.H.; Glass, A.M. Optical Generation of Intense Picosecond Electrical Pulses. IEEE J. Quantum Electron. 1972, 8, 541. [Google Scholar] [CrossRef]
  3. van Exter, M.; Fattinger, C.; Grischkowsky, D. Terahertz time-domain spectroscopy of water vapor. Opt. Lett. 1989, 14, 1128–1130. [Google Scholar] [CrossRef]
  4. Tonouchi, M. Cutting-edge terahertz technology. Nat. Photonics 2007, 1, 97–105. [Google Scholar] [CrossRef]
  5. Jepsen, P.U.; Cooke, D.G.; Koch, M. Terahertz spectroscopy and imaging—Modern techniques and applications. Laser Photonics Rev. 2011, 5, 124–166. [Google Scholar] [CrossRef]
  6. Fischer, B.M.; Walther, M.; Jepsen, P.U. Far-infrared vibrational modes of DNA components studied by terahertz time-domain spectroscopy. Phys. Med. Biol. 2002, 47, 3807–3814. [Google Scholar] [CrossRef] [PubMed]
  7. Rønne, C.; Åstrand, P.O.; Keiding, S.R. THz spectroscopy of liquid H2O and D2O. Phys. Rev. Lett. 1999, 82, 2888–2891. [Google Scholar] [CrossRef]
  8. Globus, T.R.; Woolard, D.L.; Khromova, T.; Crowe, T.W.; Bykhovskaia, M.; Gelmont, B.L.; Hesler, J.; Samuels, A.C. THz-spectroscopy of biological molecules. J. Biol. Phys. 2003, 29, 89–100. [Google Scholar] [CrossRef]
  9. Baxter, J.B.; Guglietta, G.W. Terahertz spectroscopy. Anal. Chem. 2011, 83, 4342–4368. [Google Scholar] [CrossRef]
  10. Yoshida, H.; Ogawa, Y.; Kawai, Y.; Hayashi, S.; Hayashi, A.; Otani, C.; Kato, E.; Miyamaru, F.; Kawase, K. Terahertz sensing method for protein detection using a thin metallic mesh. Appl. Phys. Lett. 2007, 91, 1–4. [Google Scholar] [CrossRef]
  11. Murakami, H.; Uchida, N.; Inoue, R.; Kim, S.; Kiwa, T.; Tonouchi, M. Laser Terahertz Emission Microscope. Proc. IEEE 2007, 95, 1646–1657. [Google Scholar] [CrossRef]
  12. Kiwa, T.; Oka, S.; Kondo, J.; Kawayama, I.; Yamada, H.; Tonouchi, M.; Tsukada, K. A terahertz chemical microscope to visualize chemical concentrations in microfluidic chips. Jpn. J. Appl. Phys. Part 2 Lett. 2007, 46, 8–11. [Google Scholar] [CrossRef]
  13. Tonouchi, M.; Kim, S.; Kawayama, I.; Murakami, H. Laser terahertz emission microscope. Terahertz Phys. Devices Syst. V: Adv. Appl. Ind. Def. 2011, 80230Q. [Google Scholar] [CrossRef]
  14. Kiwa, T.; Tsukada, K.; Suzuki, M.; Tonouchi, M.; Migitaka, S.; Yokosawa, K. Laser terahertz emission system to investigate hydrogen gas sensors. Appl. Phys. Lett. 2005, 86, 1–3. [Google Scholar] [CrossRef]
  15. Yamashita, M.; Kawase, K.; Otani, C.; Kiwa, T.; Tonouchi, M. Imaging of large-scale integrated circuits using laser terahertz emission microscopy. Opt. Express 2005, 13, 115–120. [Google Scholar] [CrossRef]
  16. Klarskov, P.; Kim, H.; Colvin, V.L.; Mittleman, D.M. Nanoscale Laser Terahertz Emission Microscopy. ACS Photonics 2017, 4, 2676–2680. [Google Scholar] [CrossRef]
  17. Pizzuto, A.; Mittleman, D.M.; Klarskov, P. Nanoscale Laser Terahertz Emission Microscopy and THz Nanoscopy. In Proceedings of the 2020 Conference on Lasers and Electro-Optics (Optical Society of America), San Jose, CA, USA, 10–15 May 2020; pp. 1–2. [Google Scholar]
  18. Kiwa, T.; Sakai, K.; Tsukada, K. Imaging chemical reactions. SPIE Newsroom 2013, 2–5. [Google Scholar] [CrossRef]
  19. Kiwa, T.; Sakai, K.; Tsukada, K. Stabilization method for signal drifts in terahertz chemical microscopy. Opt. Express 2014, 22, 1330. [Google Scholar] [CrossRef] [PubMed]
  20. Kiwa, T.; Kondo, J.; Oka, S.; Kawayama, I.; Yamada, H.; Tonouchi, M.; Tsukada, K. Chemical sensing plate with a laser-terahertz monitoring system. Appl. Opt. 2008, 47, 3324–3327. [Google Scholar] [CrossRef]
  21. Kiwa, T.; Kamiya, T.; Iida, M.; Inoue, H.; Sakai, K.; Toyooka, S.; Tsukada, K. Evaluation of Bio-materials Using a Laser-excited Terahertz Wave. Nippon Laser Igakkaishi 2019, 39, 341–346. [Google Scholar] [CrossRef]
  22. Kiwa, T.; Kamiya, T.; Morimoto, T.; Fujiwara, K.; Maeno, Y.; Akiwa, Y.; Iida, M.; Kuroda, T.; Sakai, K.; Nose, H.; et al. Imaging of chemical reactions using a terahertz chemical microscope. Photonics 2019, 6, 10. [Google Scholar] [CrossRef] [Green Version]
  23. Kiwa, T.; Hagiwara, T.; Shinomiya, M.; Sakai, K.; Tsukada, K. Work function shifts of catalytic metals under hydrogen gas visualized by terahertz chemical microscopy. Opt. Express 2012, 20, 11637. [Google Scholar] [CrossRef]
  24. Kuwana, T.; Ogawa, M.; Sakai, K.; Kiwa, T.; Tsukada, K. Label-free detection of low-molecular-weight samples using a terahertz chemical microscope. Appl. Phys. Express 2016, 9, 042401. [Google Scholar] [CrossRef] [Green Version]
  25. Akimune, K.; Okawa, Y.; Sakai, K.; Kiwa, T.; Tsukada, K. Multi-ion sensing of buffer solutions using terahertz chemical microscopy. Appl. Phys. Express 2014, 7, 122401. [Google Scholar] [CrossRef]
  26. Kiwa, T.; Kondo, Y.; Minami, Y.; Kawayama, I.; Tonouchi, M.; Tsukada, K. Terahertz chemical microscope for label-free detection of protein complex. Appl. Phys. Lett. 2010, 96, 1–4. [Google Scholar] [CrossRef]
  27. Taniizumi, K.; Nagata, H.; Ando, M.; Mahana, A.; Wang, J.; Sakai, K.; Kiwa, T. Development of Ion Concentration Measurement Method for Minute Volume of Blood Using Terahertz Chemical Microscope. In Proceedings of the 2021 46th International Conference on Infrared, Millimeter and Terahertz Waves (IRMMW-THz), Chengdu, China, 29 August–3 September 2021; pp. 1–2. [Google Scholar]
  28. Kiwa, T.; Kamiya, T.; Morimoto, T.; Sakai, K.; Tsukada, K. pH measurements in 16-nL-volume solutions using terahertz chemical microscopy. Opt. Express 2018, 26, 8232. [Google Scholar] [CrossRef]
  29. Ahmed, F.; Mahana, A.; Taniizumi, K.; Wang, J.; Sakai, K.; Kiwa, T. Terahertz imaging technique for monitoring the flow of buffer solutions at different pH values through a microfluidic chip. Jpn. J. Appl. Phys. 2021, 60, 027003. [Google Scholar] [CrossRef]
  30. Wang, J.; Nagata, H.; Ando, M.; Yoshida, Y.; Sakai, K.; Kiwa, T. Visualization of Charge-Transfer Complex for the Detection of 2, 4, 6-Trinitrotoluene Using Terahertz Chemical Microscope. J. Electrochem. Soc. 2021, 168, 11. [Google Scholar] [CrossRef]
  31. Hassan, E.M.; Mohamed, A.; DeRosa, M.C.; Willmore, W.G.; Hanaoka, Y.; Kiwa, T.; Ozaki, T. High-sensitivity detection of metastatic breast cancer cells via terahertz chemical microscopy using aptamers. Sens. Actuators B Chem. 2019, 287, 595–601. [Google Scholar] [CrossRef]
  32. Yoshida, Y.; Ding, X.; Iwatsuki, K.; Inoue, H.; Wang, J.; Sakai, K.; Kiwa, T. Detection of cancer cells using immune reaction with a terahertz chemical microscope. In Proceedings of the 2021 46th International Conference on Infrared, Millimeter and Terahertz Waves (IRMMW-THz), Chengdu, China, 29 August–3 September 2021; pp. 1–2. [Google Scholar]
  33. Kiwa, T.; Tenma, A.; Takahashi, S.; Sakai, K.; Tsukada, K. Label free immune assay using terahertz chemical microscope. Sens. Actuators B Chem. 2013, 187, 8–11. [Google Scholar] [CrossRef]
  34. Nahar, S.; Mohamed, A.; Ropagnol, X.; Hassanpour, A.; Kiwa, T.; Ozaki, T.; Gauthier, M.A. Noninvasive, label-free, and quantitative monitoring of lipase kinetics using terahertz emission technology. Biotechnol. Bioeng. 2021, 118, 4246–4254. [Google Scholar] [CrossRef]
  35. Sueda, S.; Niki, T.; Sakai, K.; Kiwa, T. Evaluation of penetration speed of liquids into skin using a terahertz time-of-flight method. Jpn. J. Appl. Phys. 2021, 60, 032002. [Google Scholar] [CrossRef]
  36. Niki, T.; Kotani, T.; Wang, J.; Sakai, K.; Kiwa, T. Evaluation of Cosmetic Liquid Penetration Using Terahertz Time-of-Flight Method. In Proceedings of the 2021 46th International Conference on Infrared, Millimeter and Terahertz Waves (IRMMW-THz), Chengdu, China, 29 August–3 September 2021; pp. 1–2. [Google Scholar]
  37. Shimizu, M.; Tomie, R.; Hamada, K.; Teranishi, T.; Wang, J.; Sakai, K.; Kiwa, T. Investigation of Cross-Section Measurement Method for All-Solid-State Batteries Using Terahertz Chemical Microscopy. In Proceedings of the 2021 46th International Conference on Infrared, Millimeter and Terahertz Waves (IRMMW-THz), Chengdu, China, 29 August–3 September 2021; pp. 1–2. [Google Scholar]
  38. Shimizu, M.; Yamanaka, R.; Teranishi, T.; Wang, J.; Sakai, K.; Tsukada, K.; Kiwa, T. Development of impedance measurement of lithium ion batteries electrode using terahertz chemical microscope. IEEJ Trans. Sens. Micromach. 2021, 141, 273–278. [Google Scholar] [CrossRef]
  39. Kiwa, T.; Akiwa, Y.; Fujita, H.; Teranishi, T.; Sakai, K.; Nose, H.; Kobayashi, M.; Tsukada, K. Electric Potential Distribution on Lithium Ion Battery Cathodes Measured Using Terahertz Chemical Microscopy. J. Infrared Millim. Terahertz Waves 2020, 41, 430–437. [Google Scholar] [CrossRef]
  40. Yoshida, Y.; Ding, X.; Iwatsuki, K.; Taniizumi, K.; Inoue, H.; Wang, J.; Sakai, K.; Kiwa, T. Detection of Lung Cancer Cells in Solutions Using a Terahertz Chemical Microscope. Sensors 2021, 21, 7631. [Google Scholar] [CrossRef] [PubMed]
  41. Wang, J.; Yokokawa, M.; Satake, T.; Suzuki, H. A micro IrOx potentiometric sensor for direct determination of organophosphate pesticides. Sens. Actuators B Chem. 2015, 220, 859–863. [Google Scholar] [CrossRef]
  42. Al-Hilli, S.; Willander, M. The pH response and sensing mechanism of n-type ZnO/electrolyte interfaces. Sensors 2009, 9, 7445–7480. [Google Scholar] [CrossRef] [PubMed] [Green Version]
  43. Oh, S.Y.; Hong, S.Y.; Jeong, Y.R.; Yun, J.; Park, H.; Jin, S.W.; Lee, G.; Oh, J.H.; Lee, H.; Lee, S.S.; et al. Skin-Attachable, Stretchable Electrochemical Sweat Sensor for Glucose and pH Detection. ACS Appl. Mater. Interfaces 2018, 10, 13729–13740. [Google Scholar] [CrossRef] [PubMed]
  44. Ghoneim, M.T.; Nguyen, A.; Dereje, N.; Huang, J.; Moore, G.C.; Murzynowski, P.J.; Dagdeviren, C. Recent Progress in Electrochemical pH-Sensing Materials and Configurations for Biomedical Applications. Chem. Rev. 2019, 119, 5248–5297. [Google Scholar] [CrossRef]
  45. Lowe, B.M.; Sun, K.; Zeimpekis, I.; Skylaris, C.K.; Green, N.G. Field-effect sensors-from pH sensing to biosensing: Sensitivity enhancement using streptavidin-biotin as a model system. Analyst 2017, 142, 4173–4200. [Google Scholar] [CrossRef] [Green Version]
  46. Tsukada, K.; Sebata, M.; Miyahara, Y.; Miyagi, H. Long-life multiple-ISFETS with polymeric gates. Sens. Actuators 1989, 18, 329–336. [Google Scholar] [CrossRef]
  47. Ertürk, G.; Uzun, L.; Tümer, M.A.; Say, R.; Denizli, A. Fab fragments imprinted SPR biosensor for real-time human immunoglobulin G detection. Biosens. Bioelectron. 2011, 28, 97–104. [Google Scholar] [CrossRef] [PubMed]
  48. Yurugi, K.; Kimura, S.; Ashihara, E.; Tsuji, H.; Kawata, A.; Kamitsuji, Y.; Hishida, R.; Takegawa, M.; Egawa, H.; Maekawa, T. Rapid and accurate measurement of anti-A/B IgG antibody in ABO-unmatched living donor liver transplantation by surface plasmon resonance. Transfus. Med. 2007, 17, 97–106. [Google Scholar] [CrossRef]
  49. Wu, Q.; Song, D.; Zhang, D.; Sun, Y. An enhanced SPR immunosensing platform for human IgG based on the use of silver nanocubes and carboxy-functionalized graphene oxide. Microchim. Acta 2016, 183, 2177–2184. [Google Scholar] [CrossRef]
  50. Zhang, D.; Sun, Y.; Wu, Q.; Ma, P.; Zhang, H.; Wang, Y.; Song, D. Enhancing sensitivity of surface plasmon resonance biosensor by Ag nanocubes/chitosan composite for the detection of mouse IgG. Talanta 2016, 146, 364–368. [Google Scholar] [CrossRef] [PubMed]
  51. Yang, W.; Hamers, R.J. Fabrication and characterization of a biologically sensitive field-effect transistor using a nanocrystalline diamond thin film. Appl. Phys. Lett. 2004, 85, 3626–3628. [Google Scholar] [CrossRef]
  52. Kim, J.P.; Lee, B.Y.; Hong, S.; Sim, S.J. Ultrasensitive carbon nanotube-based biosensors using antibody-binding fragments. Anal. Biochem. 2008, 381, 193–198. [Google Scholar] [CrossRef] [PubMed]
  53. Mao, S.; Yu, K.; Lu, G.; Chen, J. Highly sensitive protein sensor based on thermally-reduced graphene oxide field-effect transistor. Nano Res. 2011, 4, 921–930. [Google Scholar] [CrossRef]
  54. Park, J.Y.; Choi, H.J.; Nam, G.; Cho, K.; Son, J. In Vivo Dual-Modality Terahertz/Magnetic Resonance Imaging Using Superparamagnetic Iron Oxide Nanoparticles as a Dual Contrast Agent. IEEE Trans. Terahertz Sci. Technol. 2012, 2, 93–98. [Google Scholar] [CrossRef]
  55. Lee, S.-H.; Shin, S.; Roh, Y.; Oh, S.J.; Lee, S.H.; Song, H.S.; Ryu, Y.-S.; Kim, Y.K.; Seo, M. Label-free brain tissue imaging using large-area terahertz metamaterials. Biosens. Bioelectron. 2020, 170, 112663. [Google Scholar] [CrossRef]
  56. Okada, K.; Cassar, Q.; Murakami, H.; Macgrogan, G.; Guillet, J.P.; Mounaix, P.; Tonouchi, M.; Serita, K. Label-free observation of micrometric inhomogeneity of human breast cancer cell density using terahertz near-field microscopy. Photonics 2021, 8, 151. [Google Scholar] [CrossRef]
  57. Okada, K.; Serita, K.; Cassar, Q.; Murakami, H.; MacGrogan, G.; Guillet, J.P.; Mounaix, P.; Tonouchi, M. Terahertz near-field microscopy of ductal carcinoma in situ (DCIS) of the breast. J. Phys. Photonics 2020, 2, 044008. [Google Scholar] [CrossRef]
  58. Serita, K.; Matsuda, E.; Okada, K.; Murakami, H.; Kawayama, I.; Tonouchi, M. Invited Article: Terahertz microfluidic chips sensitivity-enhanced with a few arrays of meta-atoms. APL Photonics 2018, 3, 051603. [Google Scholar] [CrossRef] [Green Version]
  59. Serita, K.; Tonouchi, M. A Terahertz Microfluidic Chip for Ultra-trace Biosensing. Nippon Laser Igakkaishi 2019, 39, 329–334. [Google Scholar] [CrossRef] [Green Version]
  60. Gaffney, E.F.; Riegman, P.H.; Grizzle, W.E.; Watson, P.H. Factors that drive the increasing use of FFPE tissue in basic and translational cancer research. Biotech. Histochem. 2018, 93, 373–386. [Google Scholar] [CrossRef] [PubMed] [Green Version]
  61. Corless, C.L.; Spellman, P.T. Tackling formalin-fixed, paraffin-embedded tumor tissue with next-generation sequencing. Cancer Discov. 2012, 2, 23–24. [Google Scholar] [CrossRef] [Green Version]
  62. Bolognesi, C.; Forcato, C.; Buson, G.; Fontana, F.; Mangano, C.; Doffini, A.; Sero, V.; Lanzellotto, R.; Signorini, G.; Calanca, A.; et al. Digital Sorting of Pure Cell Populations Enables Unambiguous Genetic Analysis of Heterogeneous Formalin-Fixed Paraffin-Embedded Tumors by Next Generation Sequencing. Sci. Rep. 2016, 6, 1–14. [Google Scholar] [CrossRef]
  63. Sampson, H.A.; Muñoz-Furlong, A.; Campbell, R.L.; Adkinson, N.F.; Bock, S.A.; Branum, A.; Brown, S.G.A.; Camargo, C.A.; Cydulka, R.; Galli, S.J.; et al. Second symposium on the definition and management of anaphylaxis: Summary report—Second National Institute of Allergy and Infectious Disease/Food Allergy and Anaphylaxis Network symposium. J. Allergy Clin. Immunol. 2006, 117, 391–397. [Google Scholar] [CrossRef]
  64. Plebani, M. Clinical value and measurement of specific IgE. Clin. Biochem. 2003, 36, 453–469. [Google Scholar] [CrossRef]
  65. Nishi, H.; Nishimura, S.; Higashiura, M.; Ikeya, N.; Ohta, H.; Tsuji, T.; Nishimura, M.; Ohnishi, S.; Higashi, H. A new method for histamine release from purified peripheral blood basophils using monoclonal antibody-coated magnetic beads. J. Immunol. Methods 2000, 240, 39–46. [Google Scholar] [CrossRef]
  66. Kim, K.-Y.; Kwon, H.-J.; Cho, S.-H.; Nam, M.; Kim, C.-W. Development and validation of a highly sensitive LC–MS/MS method for in vitro measurement of histamine concentration. J. Pharm. Biomed. Anal. 2019, 172, 33–41. [Google Scholar] [CrossRef] [PubMed]
Figure 1. A promising versatile terahertz chemical microscope in academic research and industrial applications. Created with BioRender.com.
Photonics 09 00026 g001
Figure 2. Schematic of the optical setup of the terahertz chemical microscope (TCM). Created with BioRender.com.
Photonics 09 00026 g002
Figure 3. (a) Energy band diagram of the sensing plate. The sensing plate was made by forming a silicon thin film (Si film) on a sapphire substrate and then forming a silicon thermal oxide film (SiO2 film). The film thicknesses of the Si film and the SiO2 film are 150 nm and several nm, respectively. In the sensing plate, there are defects near the boundary between the Si and SiO2 films, so the energy band bends toward the boundary surface and a depletion layer electric field is generated. The electrical or chemical reaction on the sensing plate surface could shift the electric potential, it simultaneously changes the magnitude of the depletion field. (b) Chemical modification and bio-modification on the sensing plate are applied for chemical or bio-related substances detection and evaluation. Created with BioRender.com.
Photonics 09 00026 g003
Figure 4. (a) Cross-sectional schematic of the ion selective membrane immobilized on the sensing plate and the photograph of the pH [28] and ions distribution and THz visualization results through array-based microwells [18]. Reprinted with permission from [18,28]. Copyright 2018 Optical Society of America and SPIE. (b) Cross-sectional schematic of the sensing plate with specific antibody immobilized. (c) THz amplitude change before and after the reaction of mannose and THz amplitude change versus three different concentrations of mannose [24]. Reprinted with permission from [24]. Copyright 2016 The Japan Society of Applied Physics. (d) THz images of three different concentrations of anti-IgG on four regions of the sensing plate and a plot of THz amplitude corresponding to different anti-IgG concentrations [33]. Reprinted with permission from [33]. Copyright 2012 Elsevier B.V. (e) THz amplitude mapping of with/without adding avidin and real-time THz signal of forming the biotin-avidin protein complex [26]. Reprinted with permission from [26]. Copyright 2010 American Institute of Physics. (f) The differential THz amplitude distribution between before and after reaction on the sensing plate and THz amplitude changes as a function of PC9 concentration [40]. Copyright 2021 MDPI (Basel, Switzerland).
Photonics 09 00026 g004
Figure 5. Mechanism of allergy. When allergens invade the body for the first time, specific antibody immunoglobulin E. (IgE) is produced in the body. Then, the IgE binds to mast cells, resulting in releasing chemical mediators such as histamine, leukotrienes, after exposure to the allergens for the second time. Created with BioRender.com.
Photonics 09 00026 g005
Figure 6. (a) procedure of surface modification on the sensing plate. (1) Suefce clean with acetone and ethanol. (2) The sensing plate was incubaed in a 0.5 mM 2-carbomethoxy ethyltrichlorosilane (CMETS) solution of CMETS in toluene at −15 °C for 1 h to procude the ester group. (3) The ester group was carboxylated by immersing the sensing plate in 35% HCl at room temperature for 24 h. (4) N-hydroxysuccinimide (NHS) and 1-ethyl-3-(3-dimethrlaminopropyl)-carbodimide hydrochloride (EDC) in phosphate-buffered saline (PBS) were dissolved in 3 mM and 1 mM, respectively, and the carboxyl group was activated by immersing the sensing plate in an NHS & EDC solution prepared at pH 7.4 for 30 min at room temperature. (5) The sensing plate was anchored on a measuring substrate. Avidin was diluted to 0.147 μM with PBS and 30 μL was poured into each well for immobilization at 4 °C for 24 h. (6) The surface was blocked by 1mM 2-Aminoethanol at room temperature for 15 min. (7) Biotin-labeled anti-histamine antibody was diluted with PBS to a final concentration 0.33 μM, incubated at room temperature shaking at 45 rpm for 30 min; (b) Surface morphology observation by AFM. (1) Before avidin immobilization. (2) After avidin immobilization. (3) After surface blocking. (4) After Biotin-labeled anti-histamine antibody immobilization.
Photonics 09 00026 g006
Figure 7. (a) Distribution of THz amplitude changes before and after histamine reaction. (b) THz amplitude changes versus three different concentrations of histamine.
Photonics 09 00026 g007
Publisher’s Note: MDPI stays neutral with regard to jurisdictional claims in published maps and institutional affiliations.

