Water Resistant Cellulose Acetate Based Photopolymer for Recording of Volume Phase Holograms


Abstract
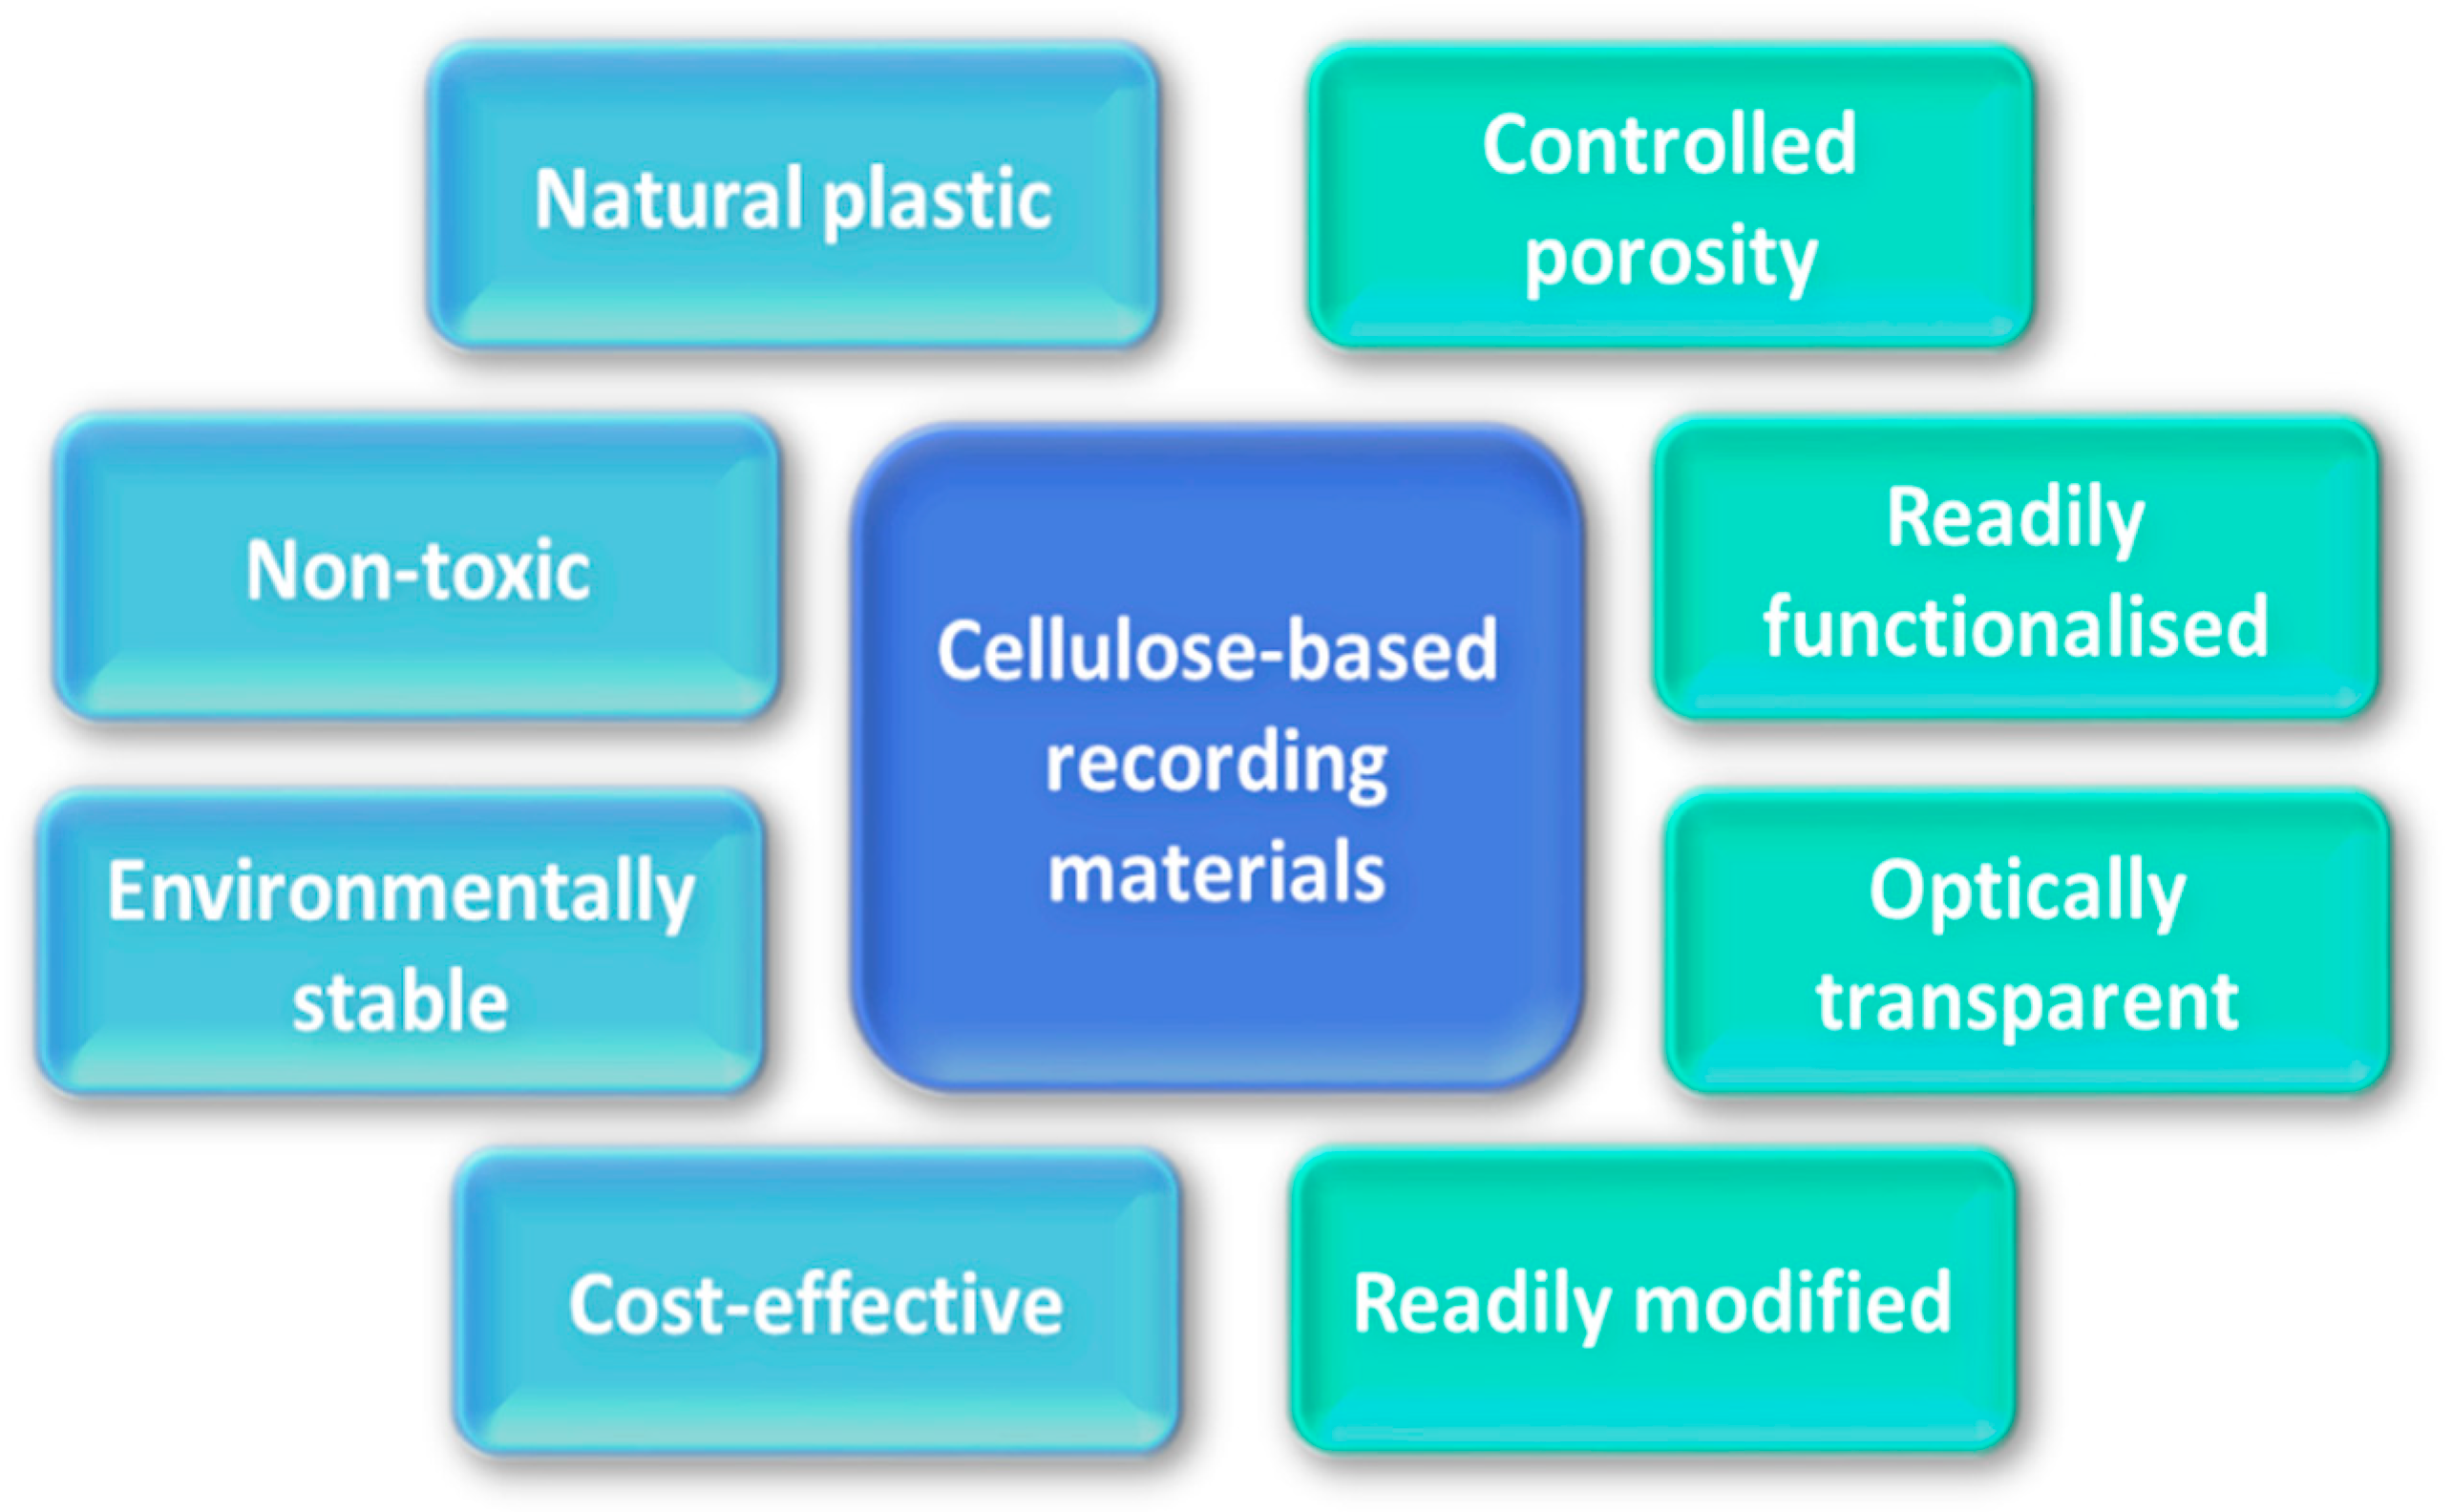
:1. Introduction
2. Theoretical Background
2.1. Evaluation of the Holographic Recording Material Properties
2.1.1. Diffraction Efficiency of Volume Phase Gratings
2.1.2. Bragg Selectivity Curve
2.1.3. Sensitivity of the Recording Material
3. Material and Methods
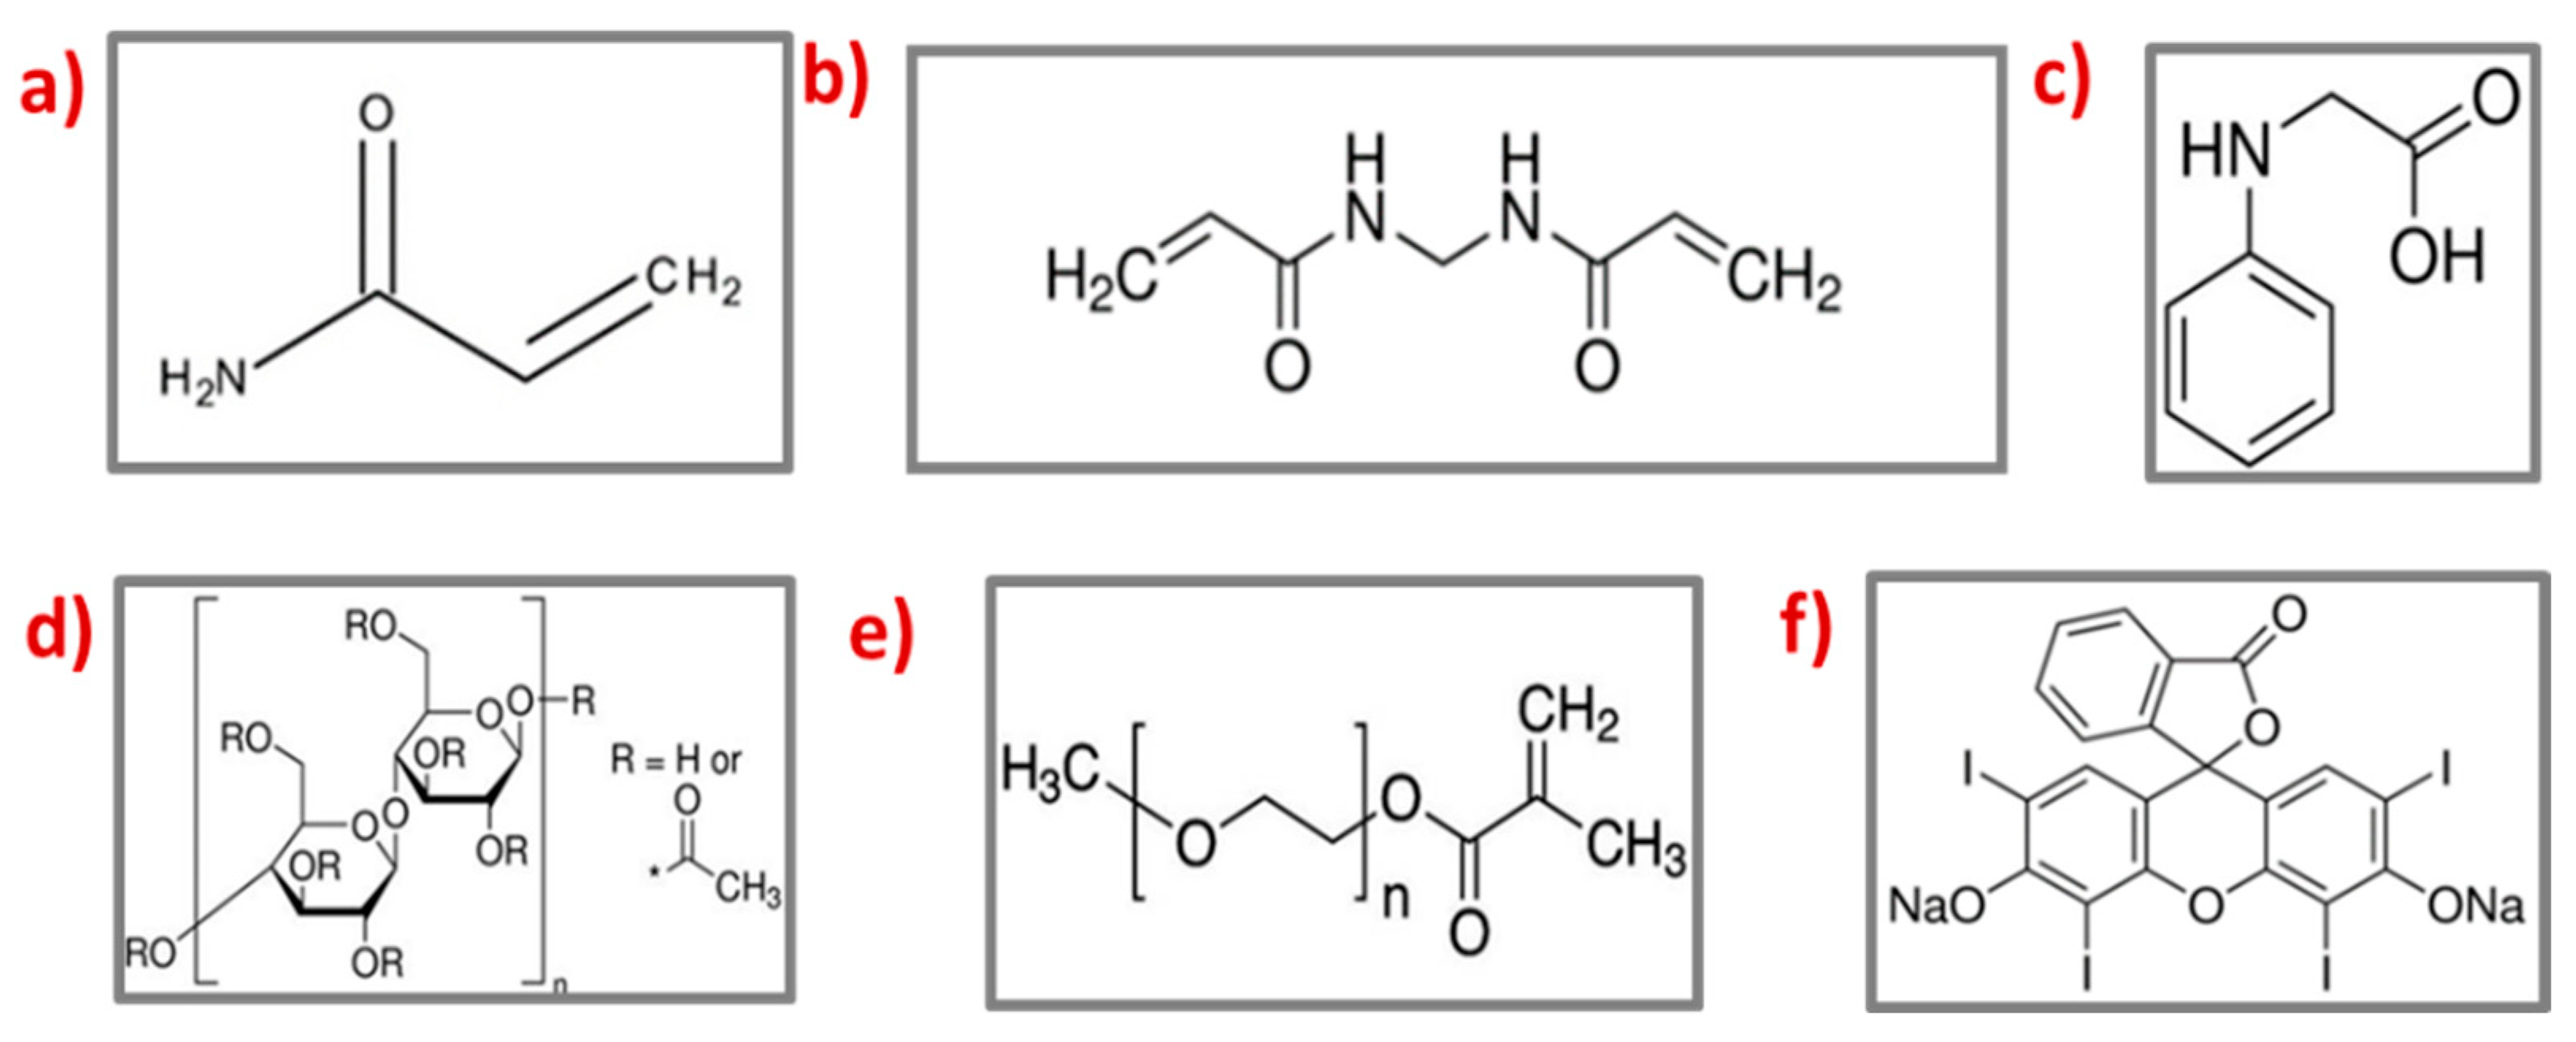
3.1. Materials
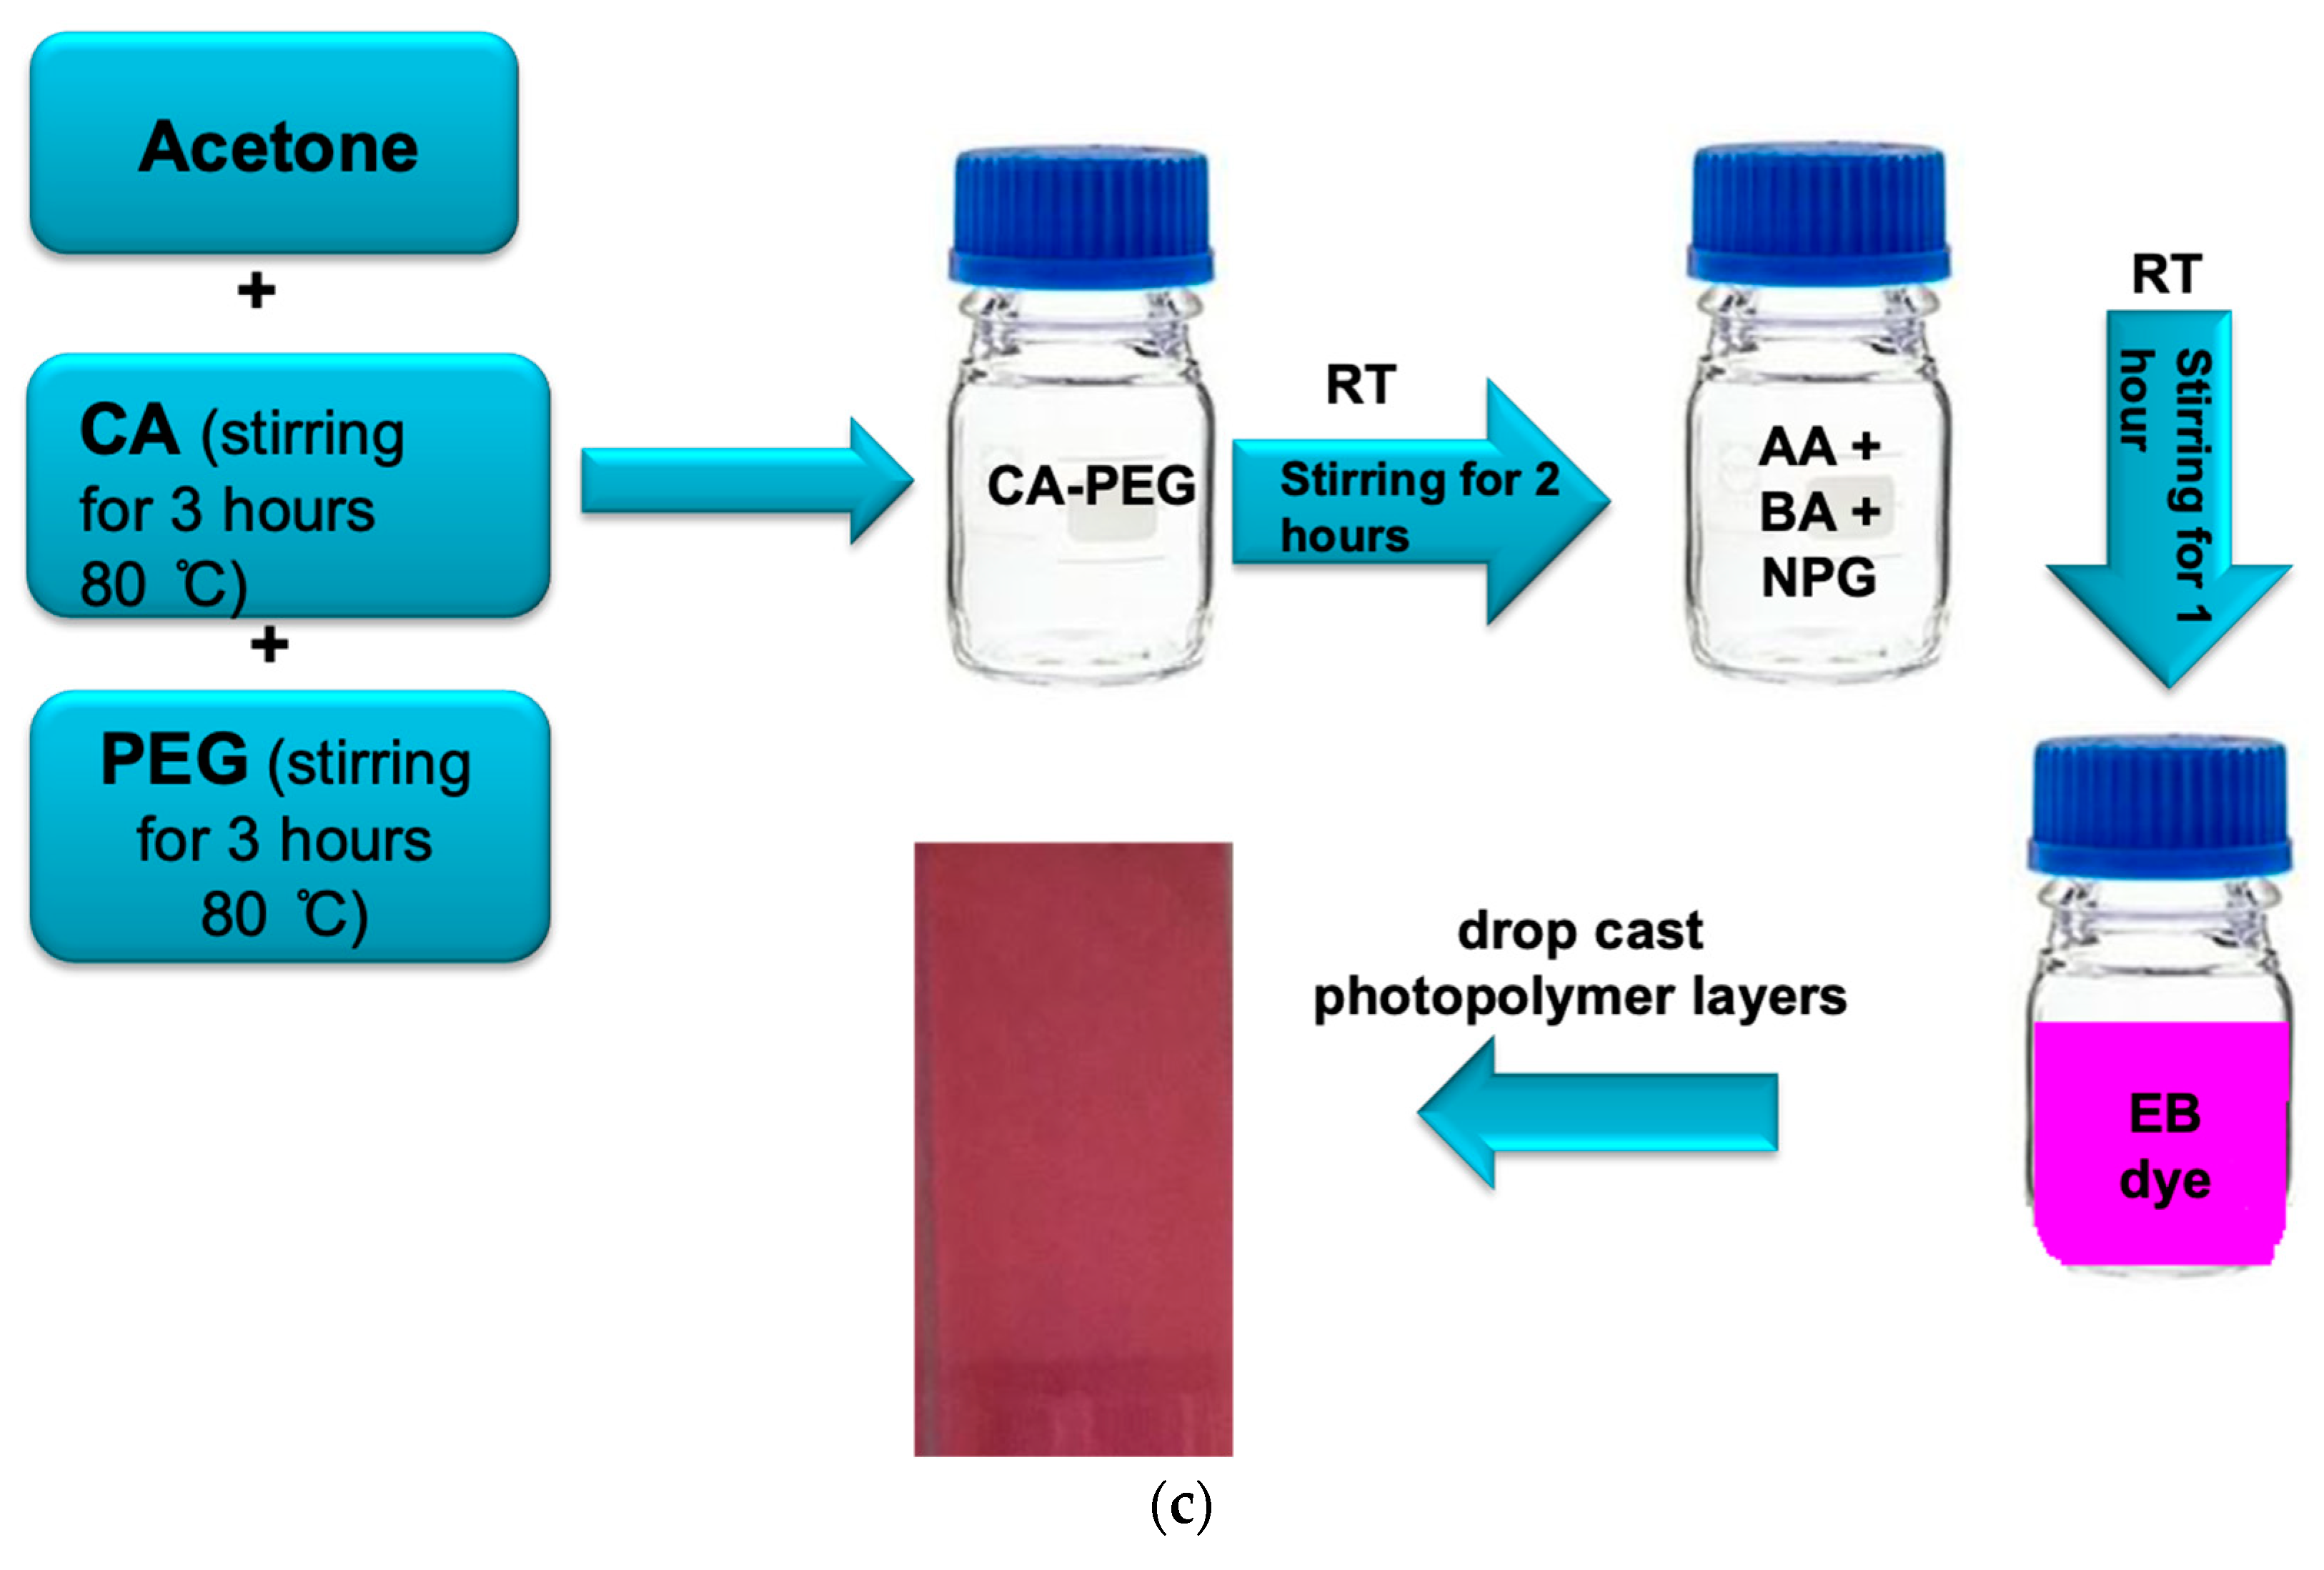
3.1.1. Photopolymer Composition
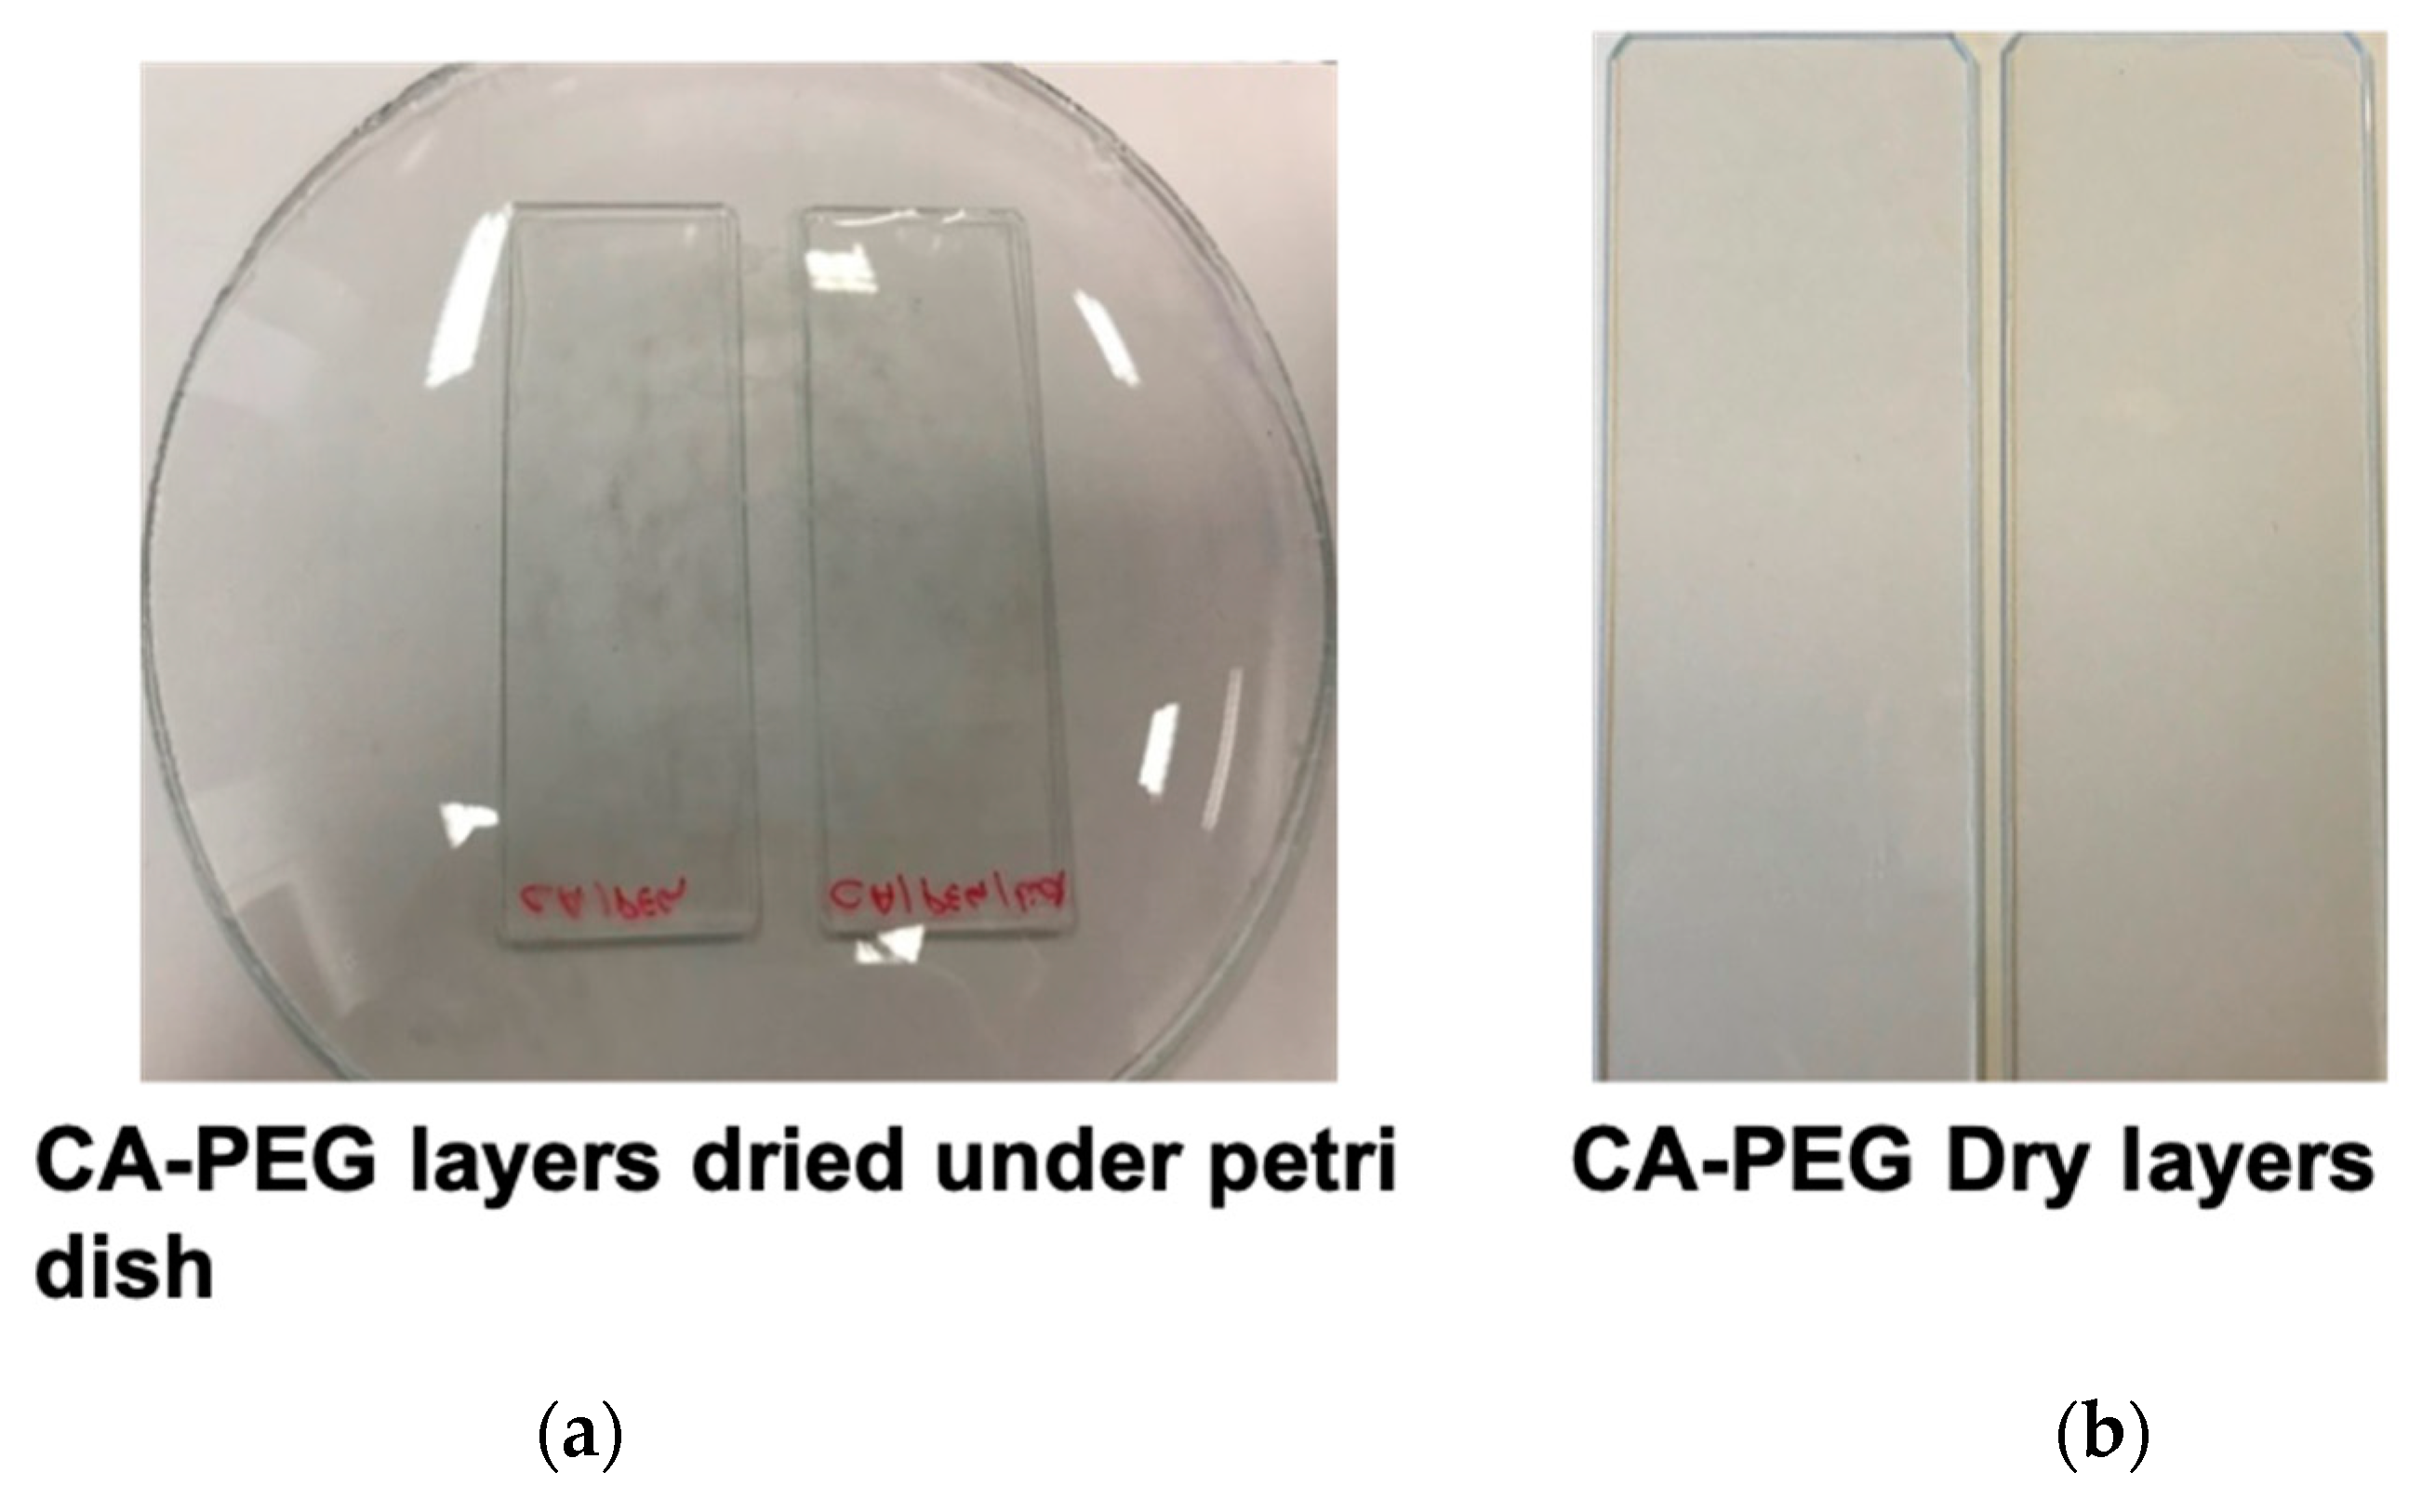
3.1.2. Photopolymer Solution Preparation and Layer Coating
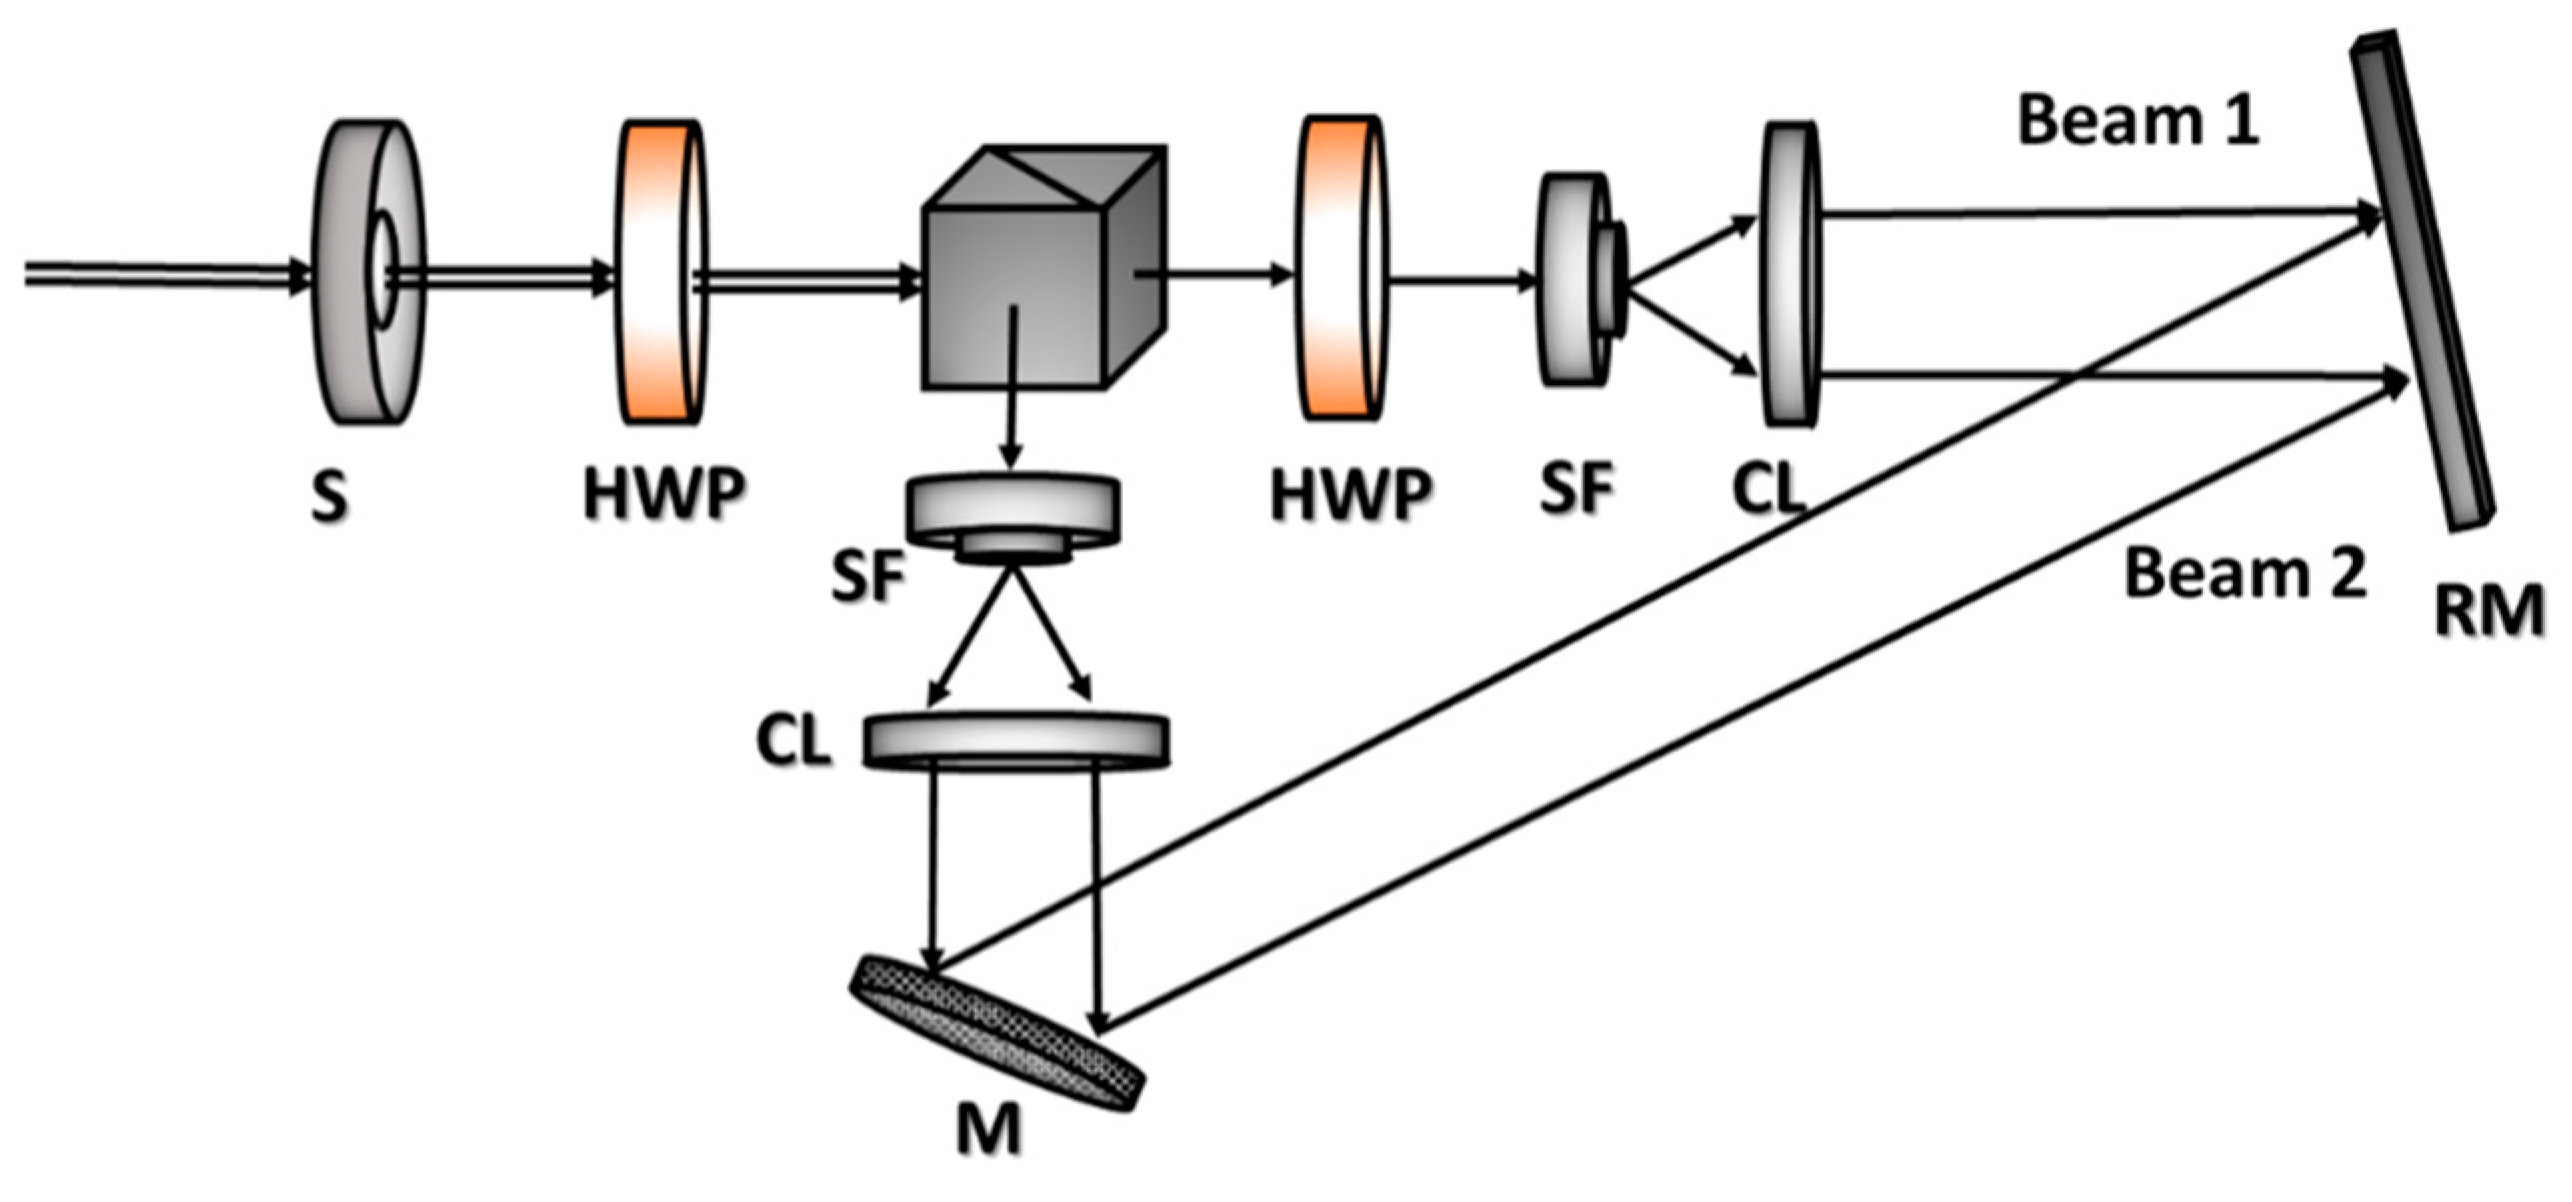
3.2. Recording and Testing of the Holograms
3.3. Data Analysis
3.4. Characterisation of Materials Hardness
4. Results
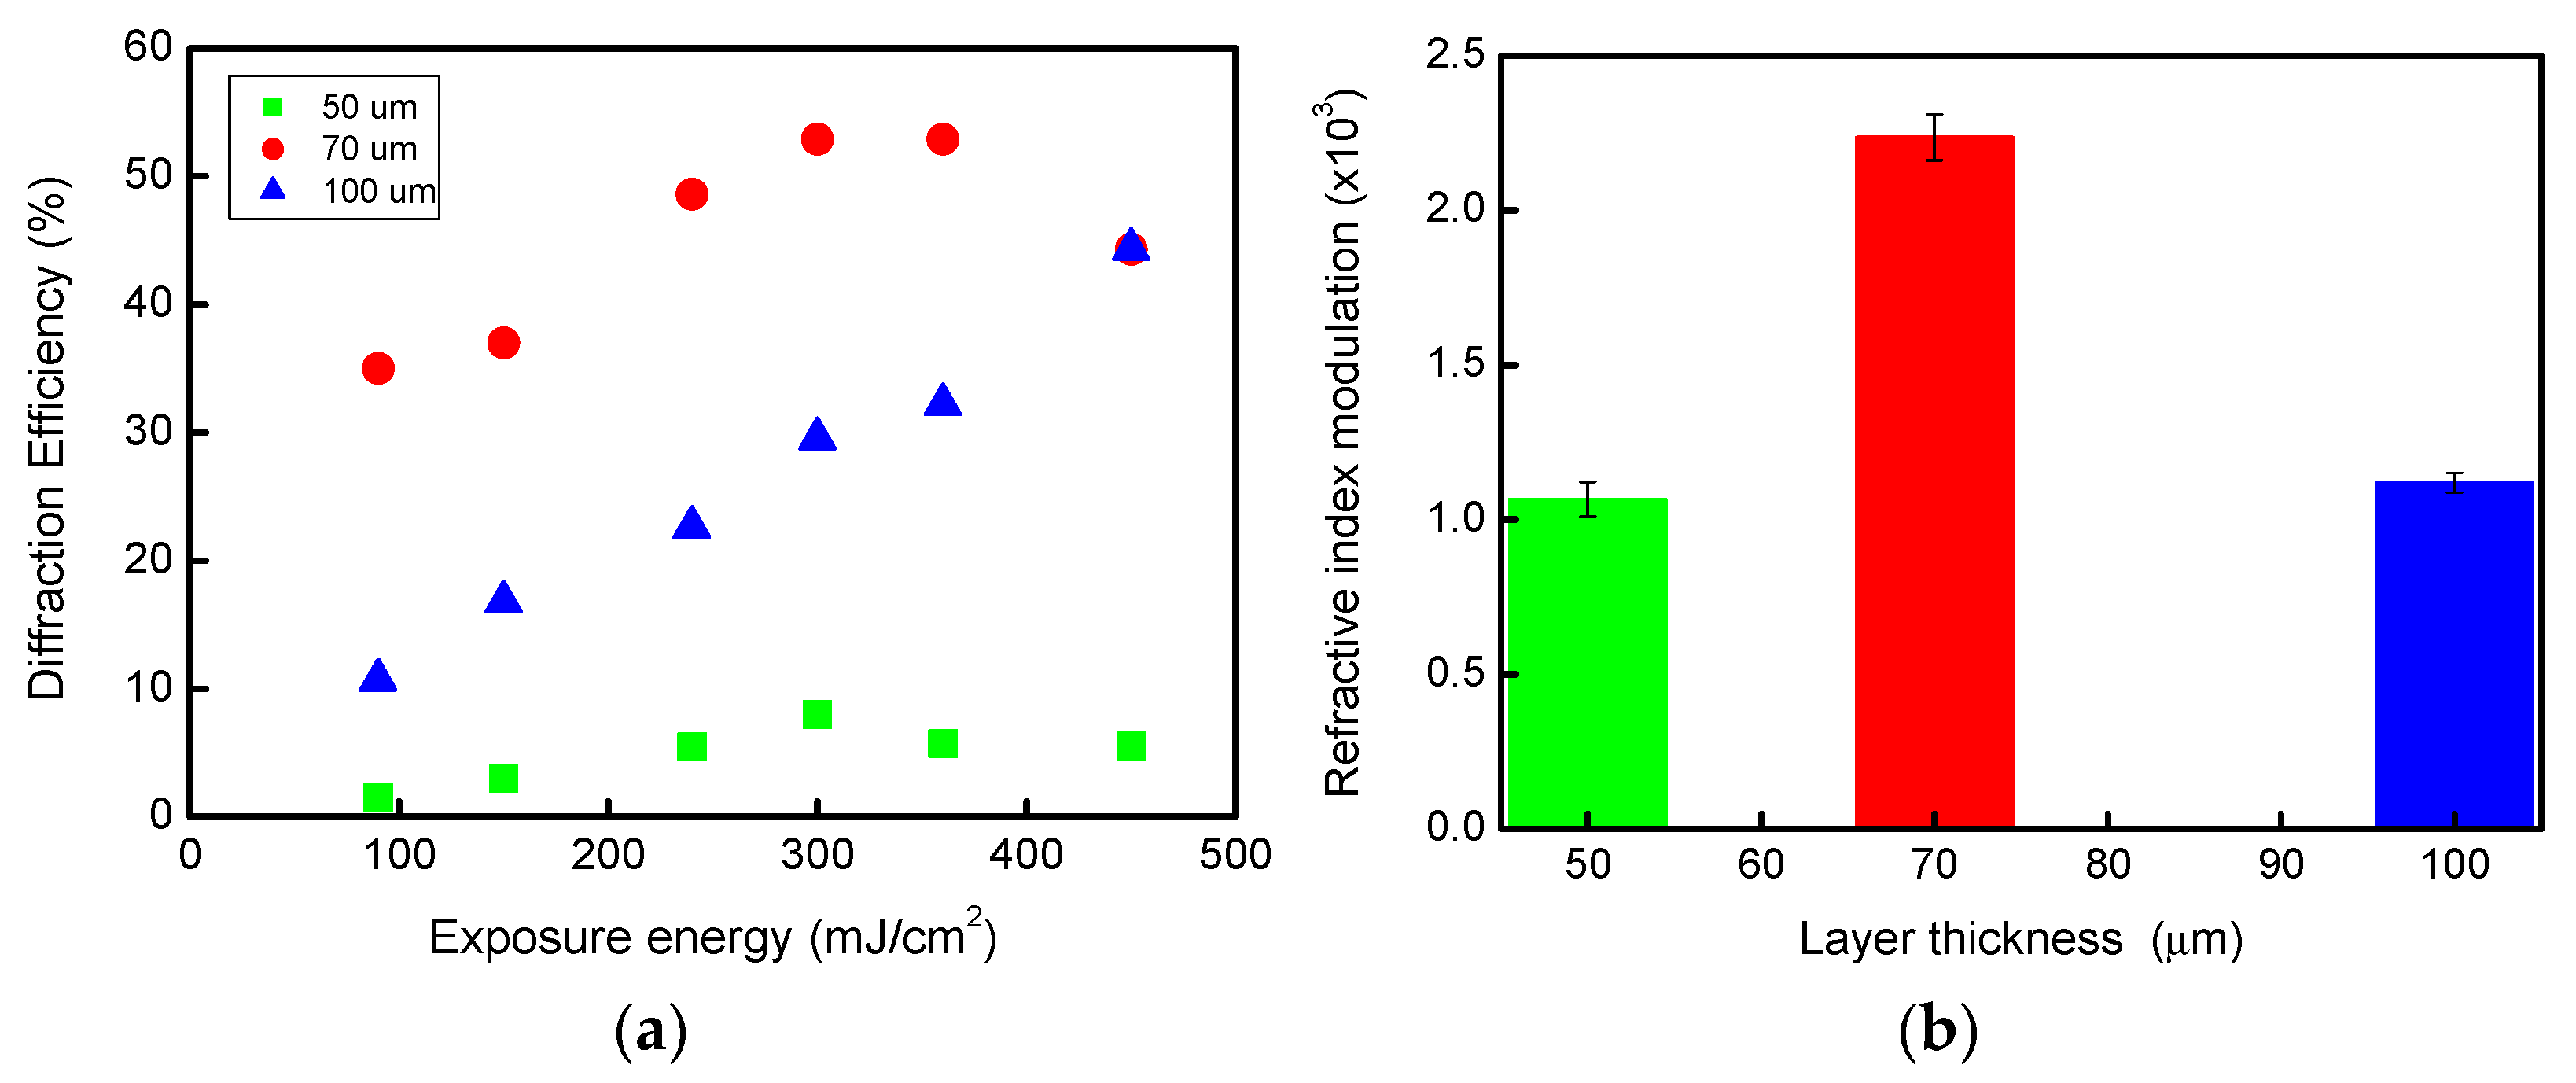
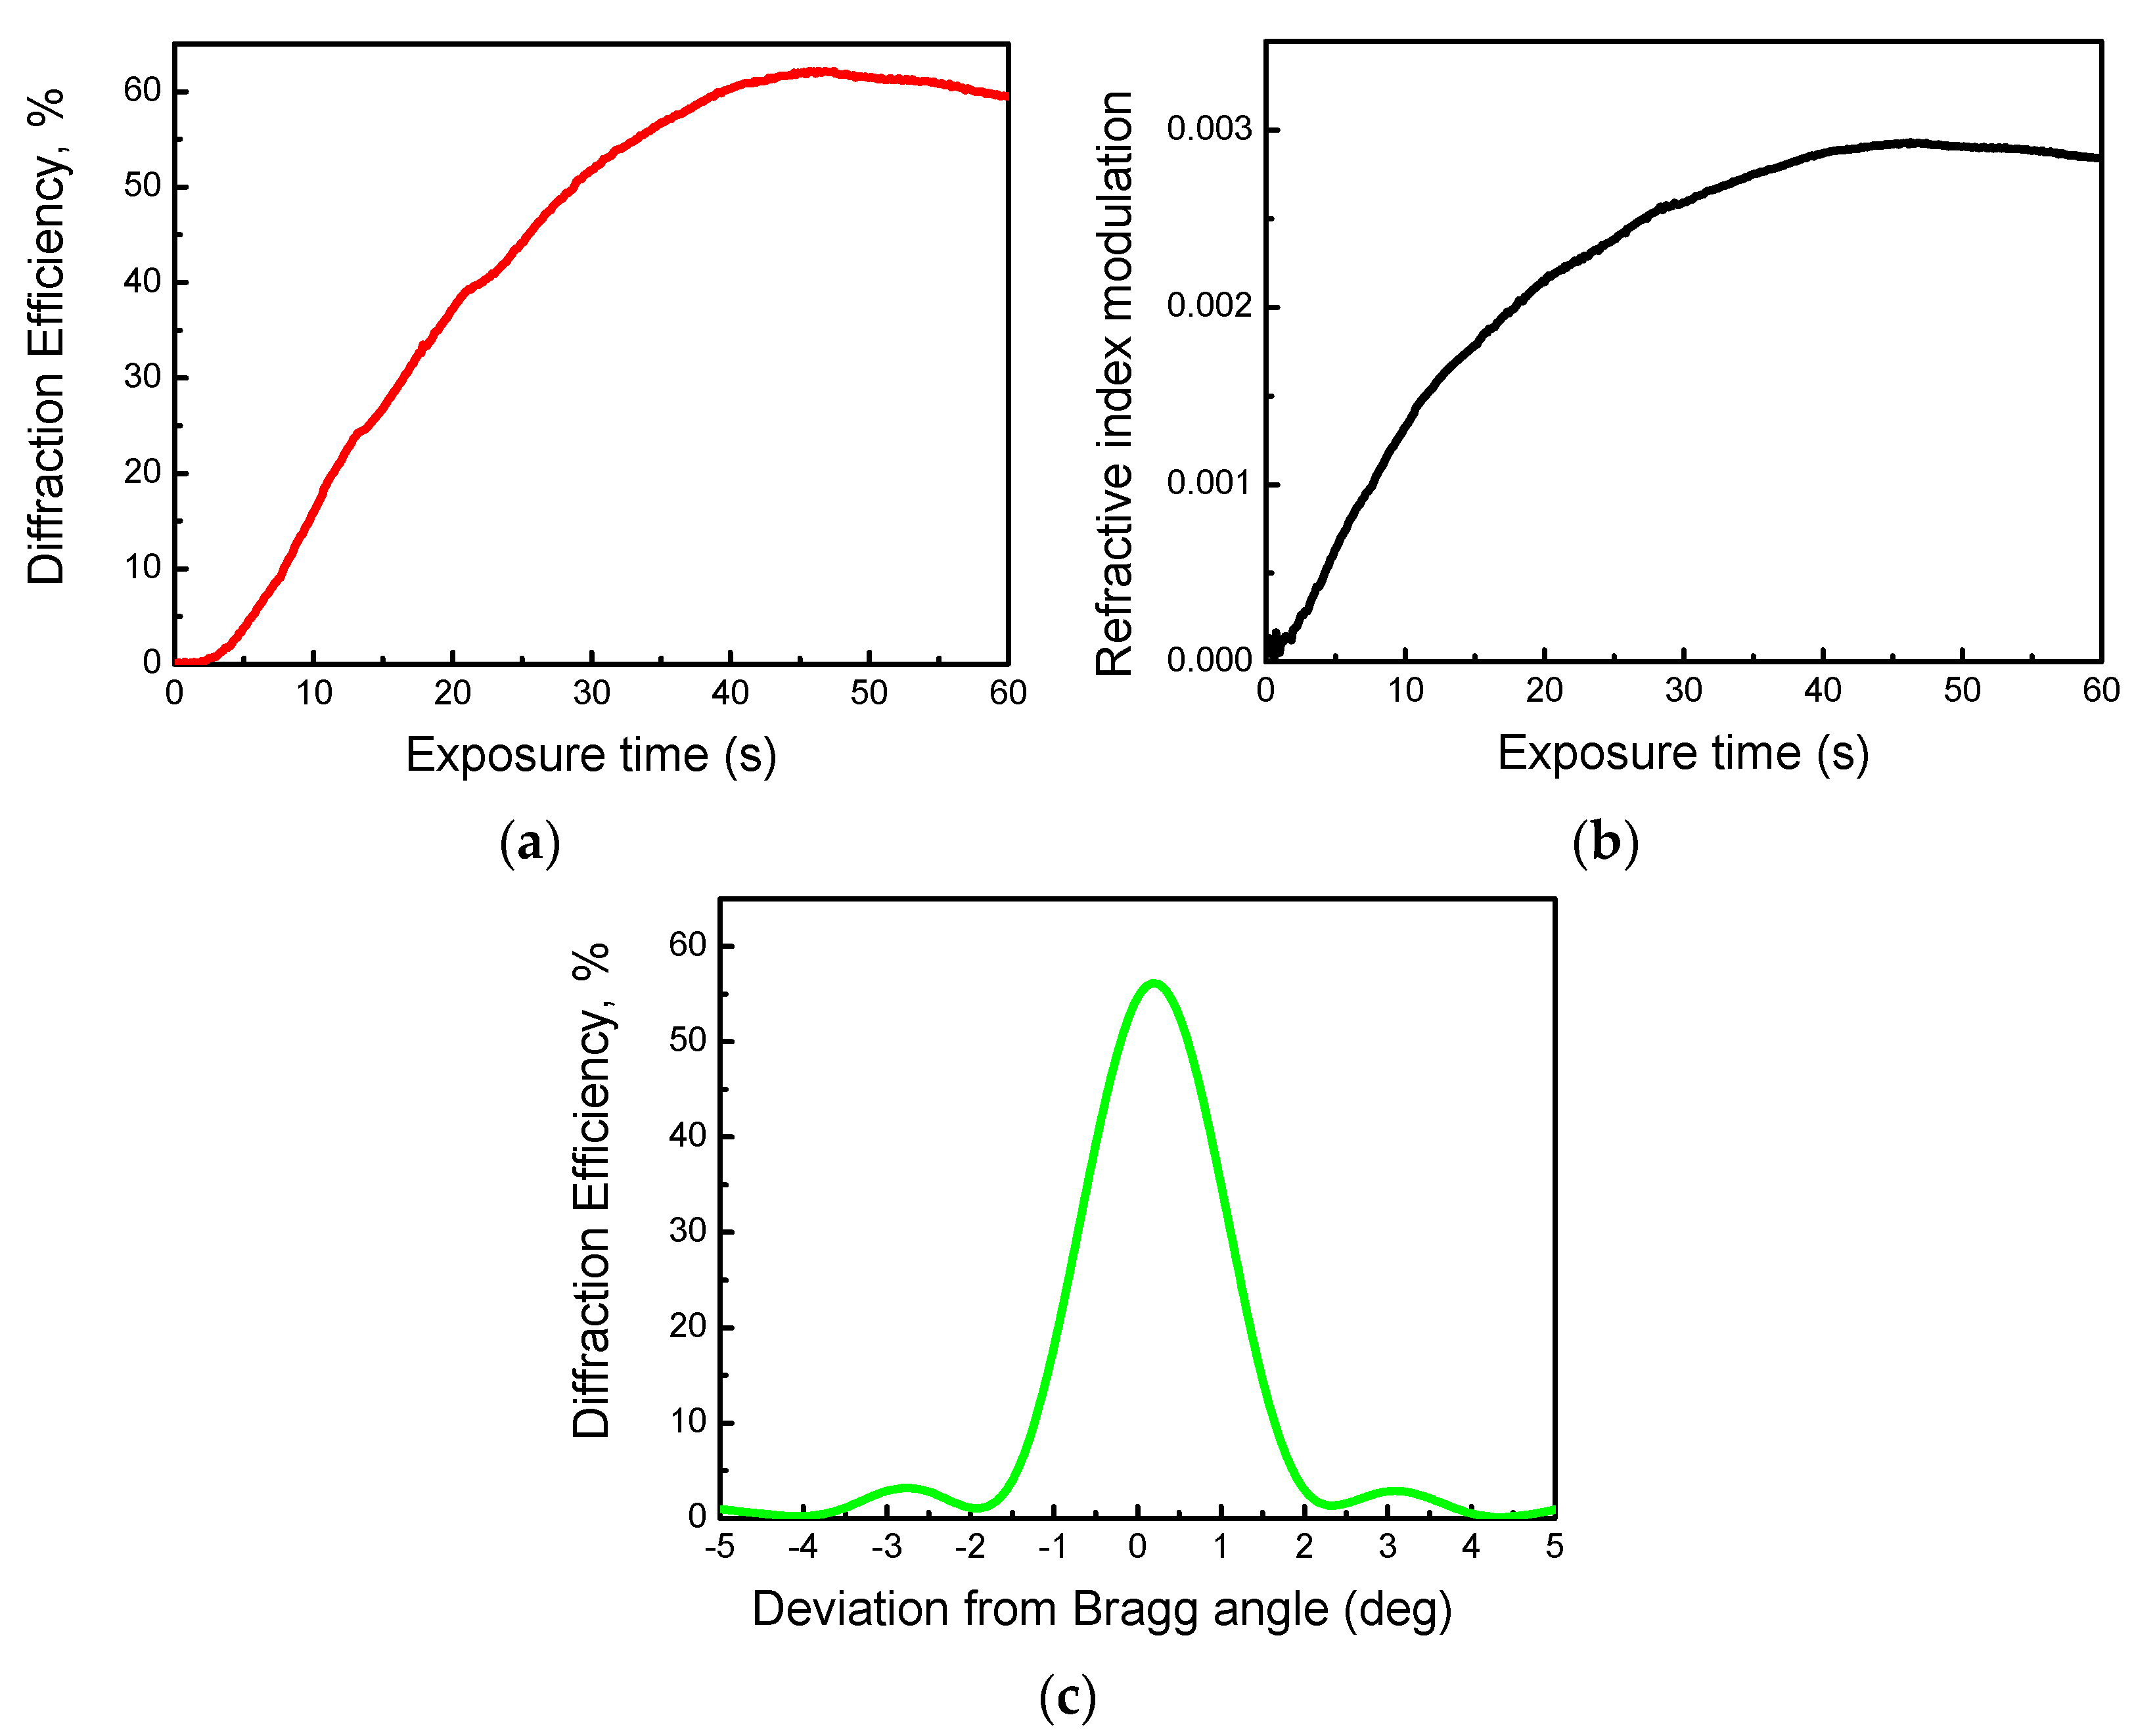
4.1. Preliminary Screening of Layers of Different Thickness
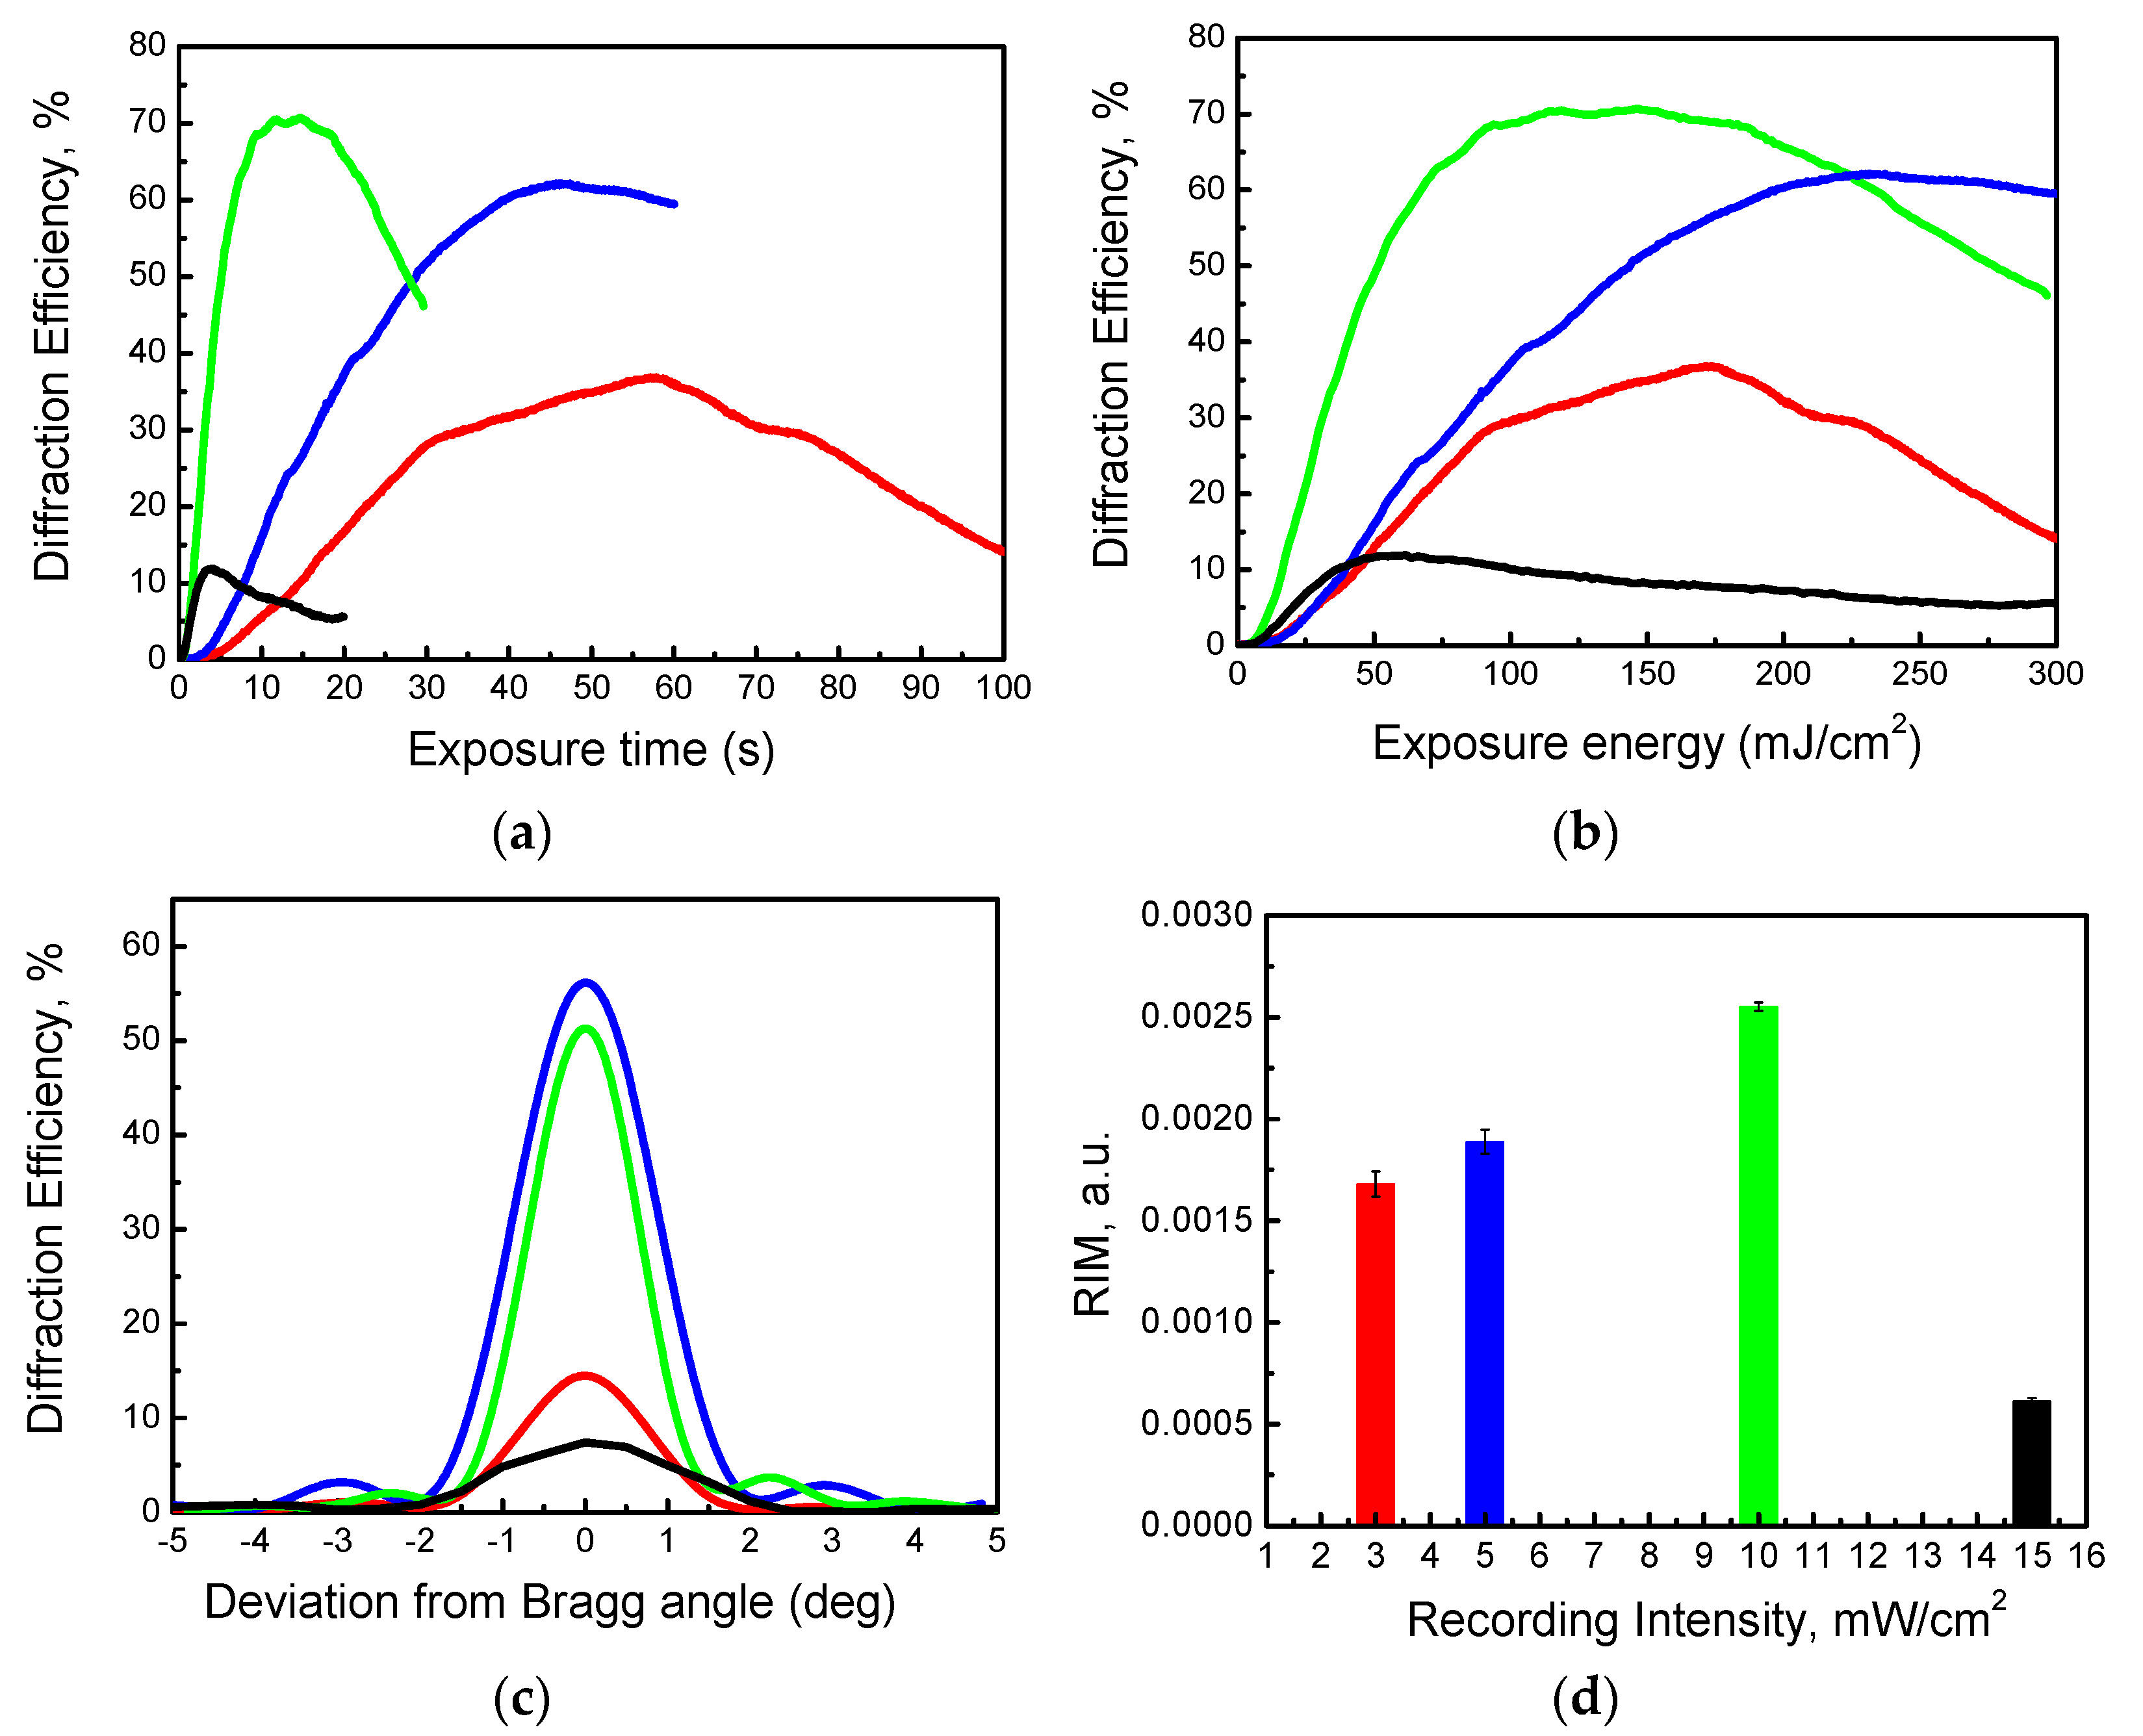
4.2. Intensity Dependence of the Holographic Recording
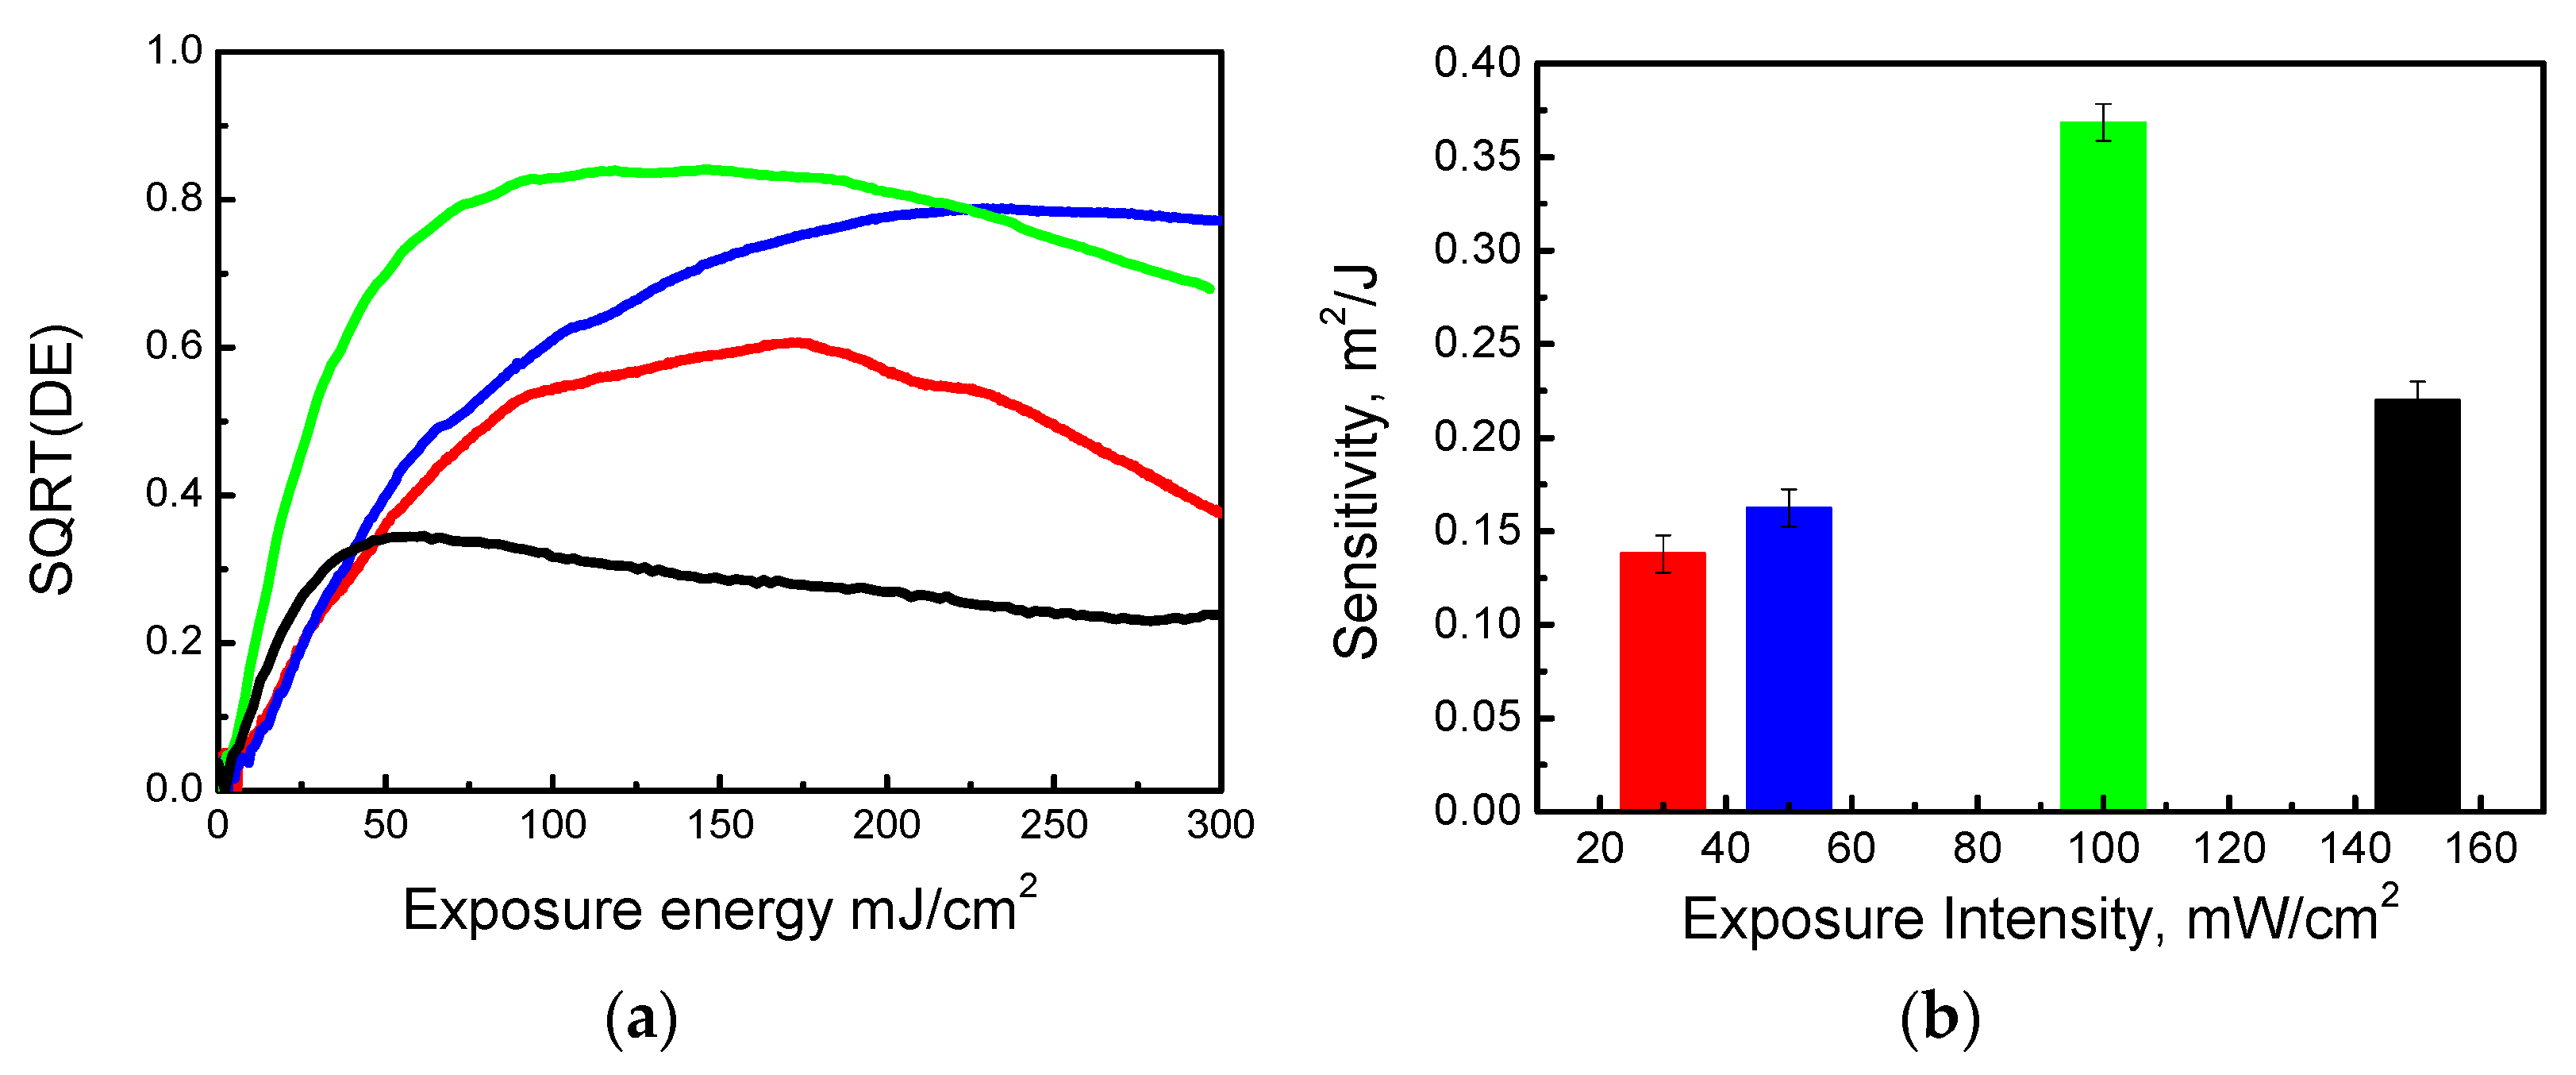
4.3. Sensitivity of the Layers
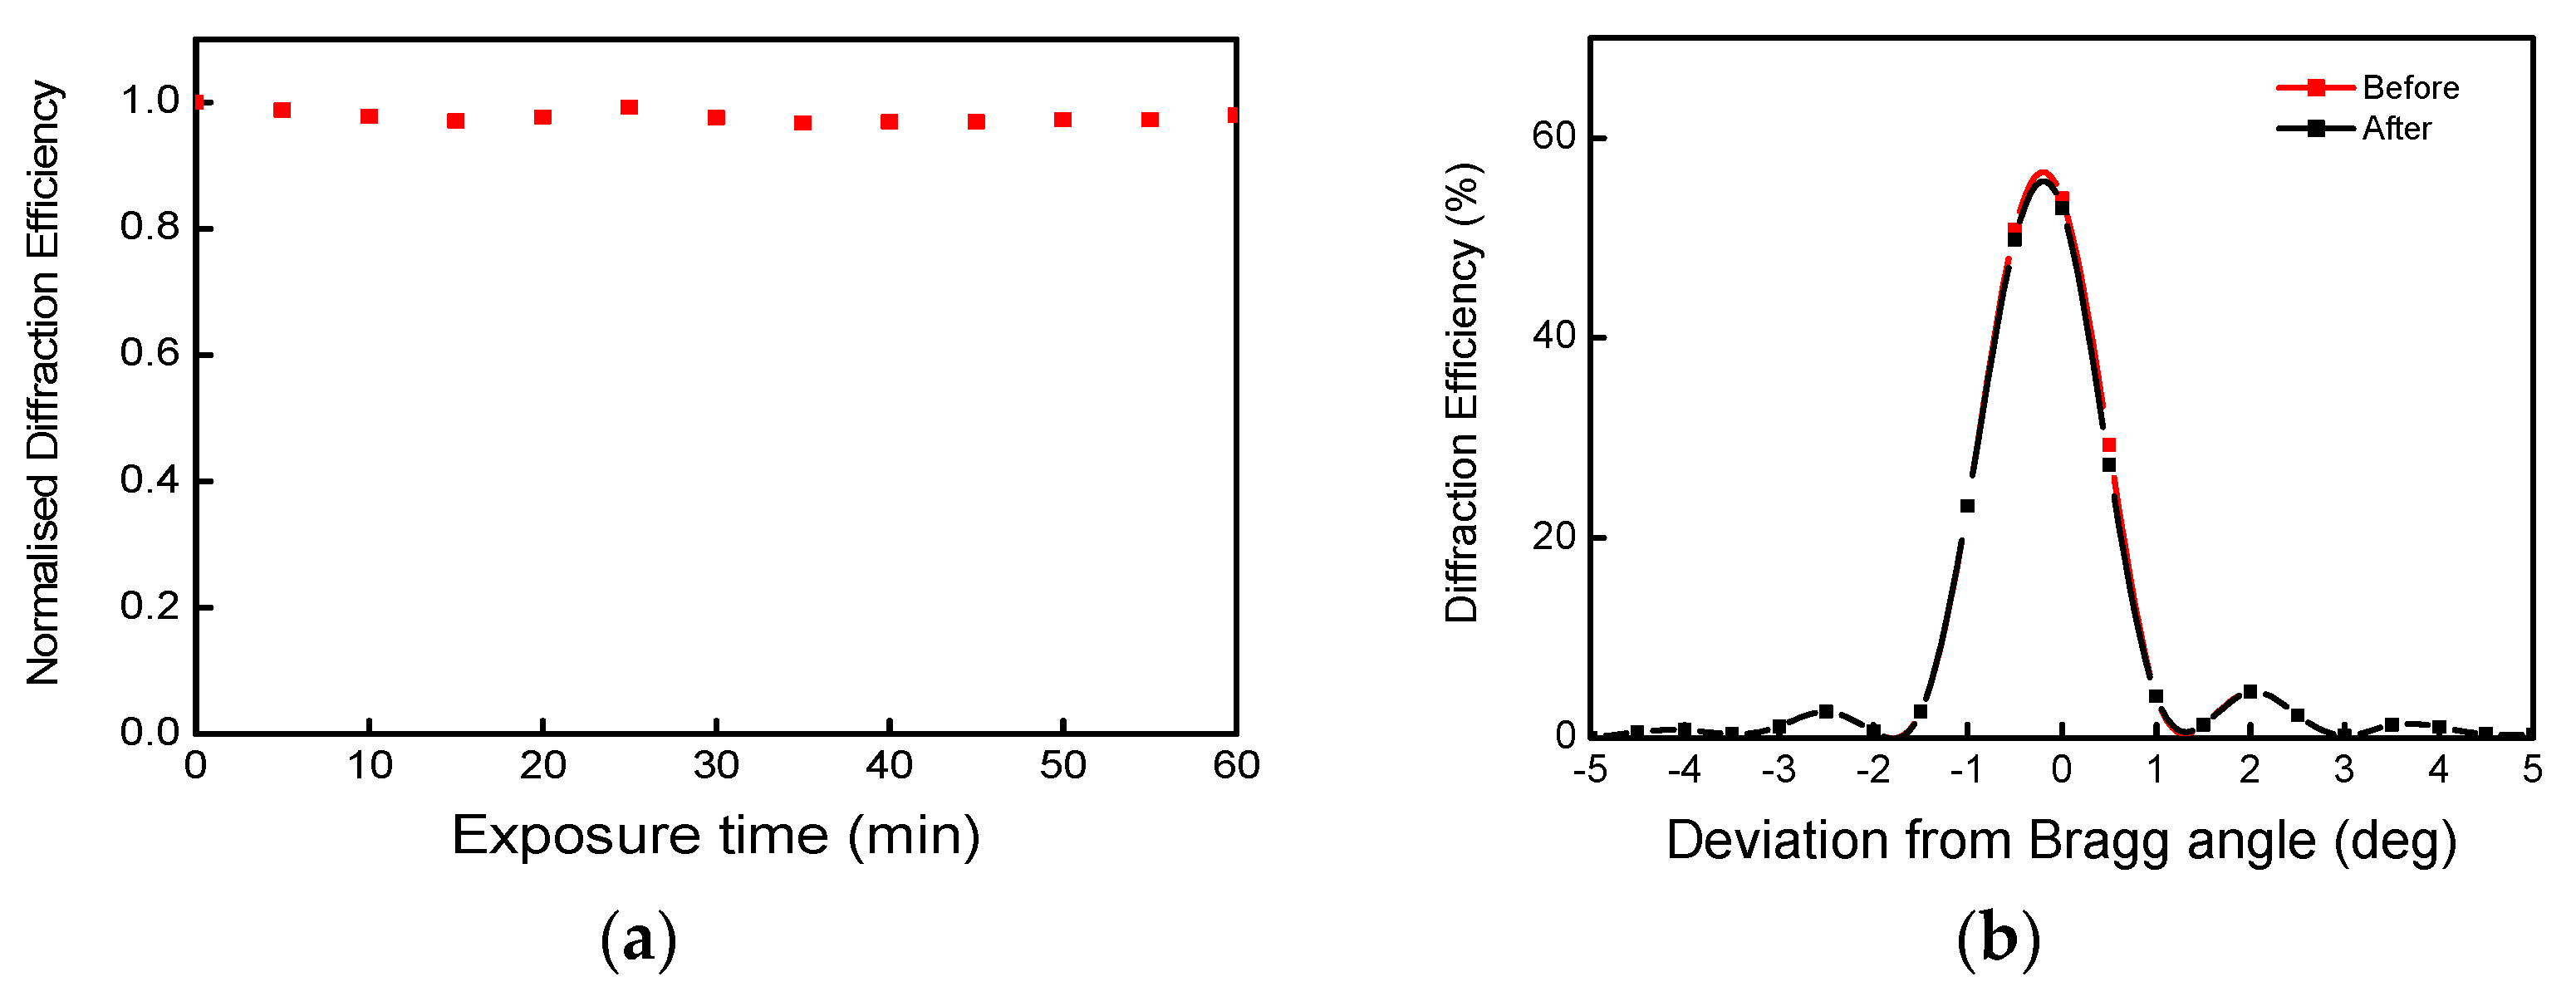
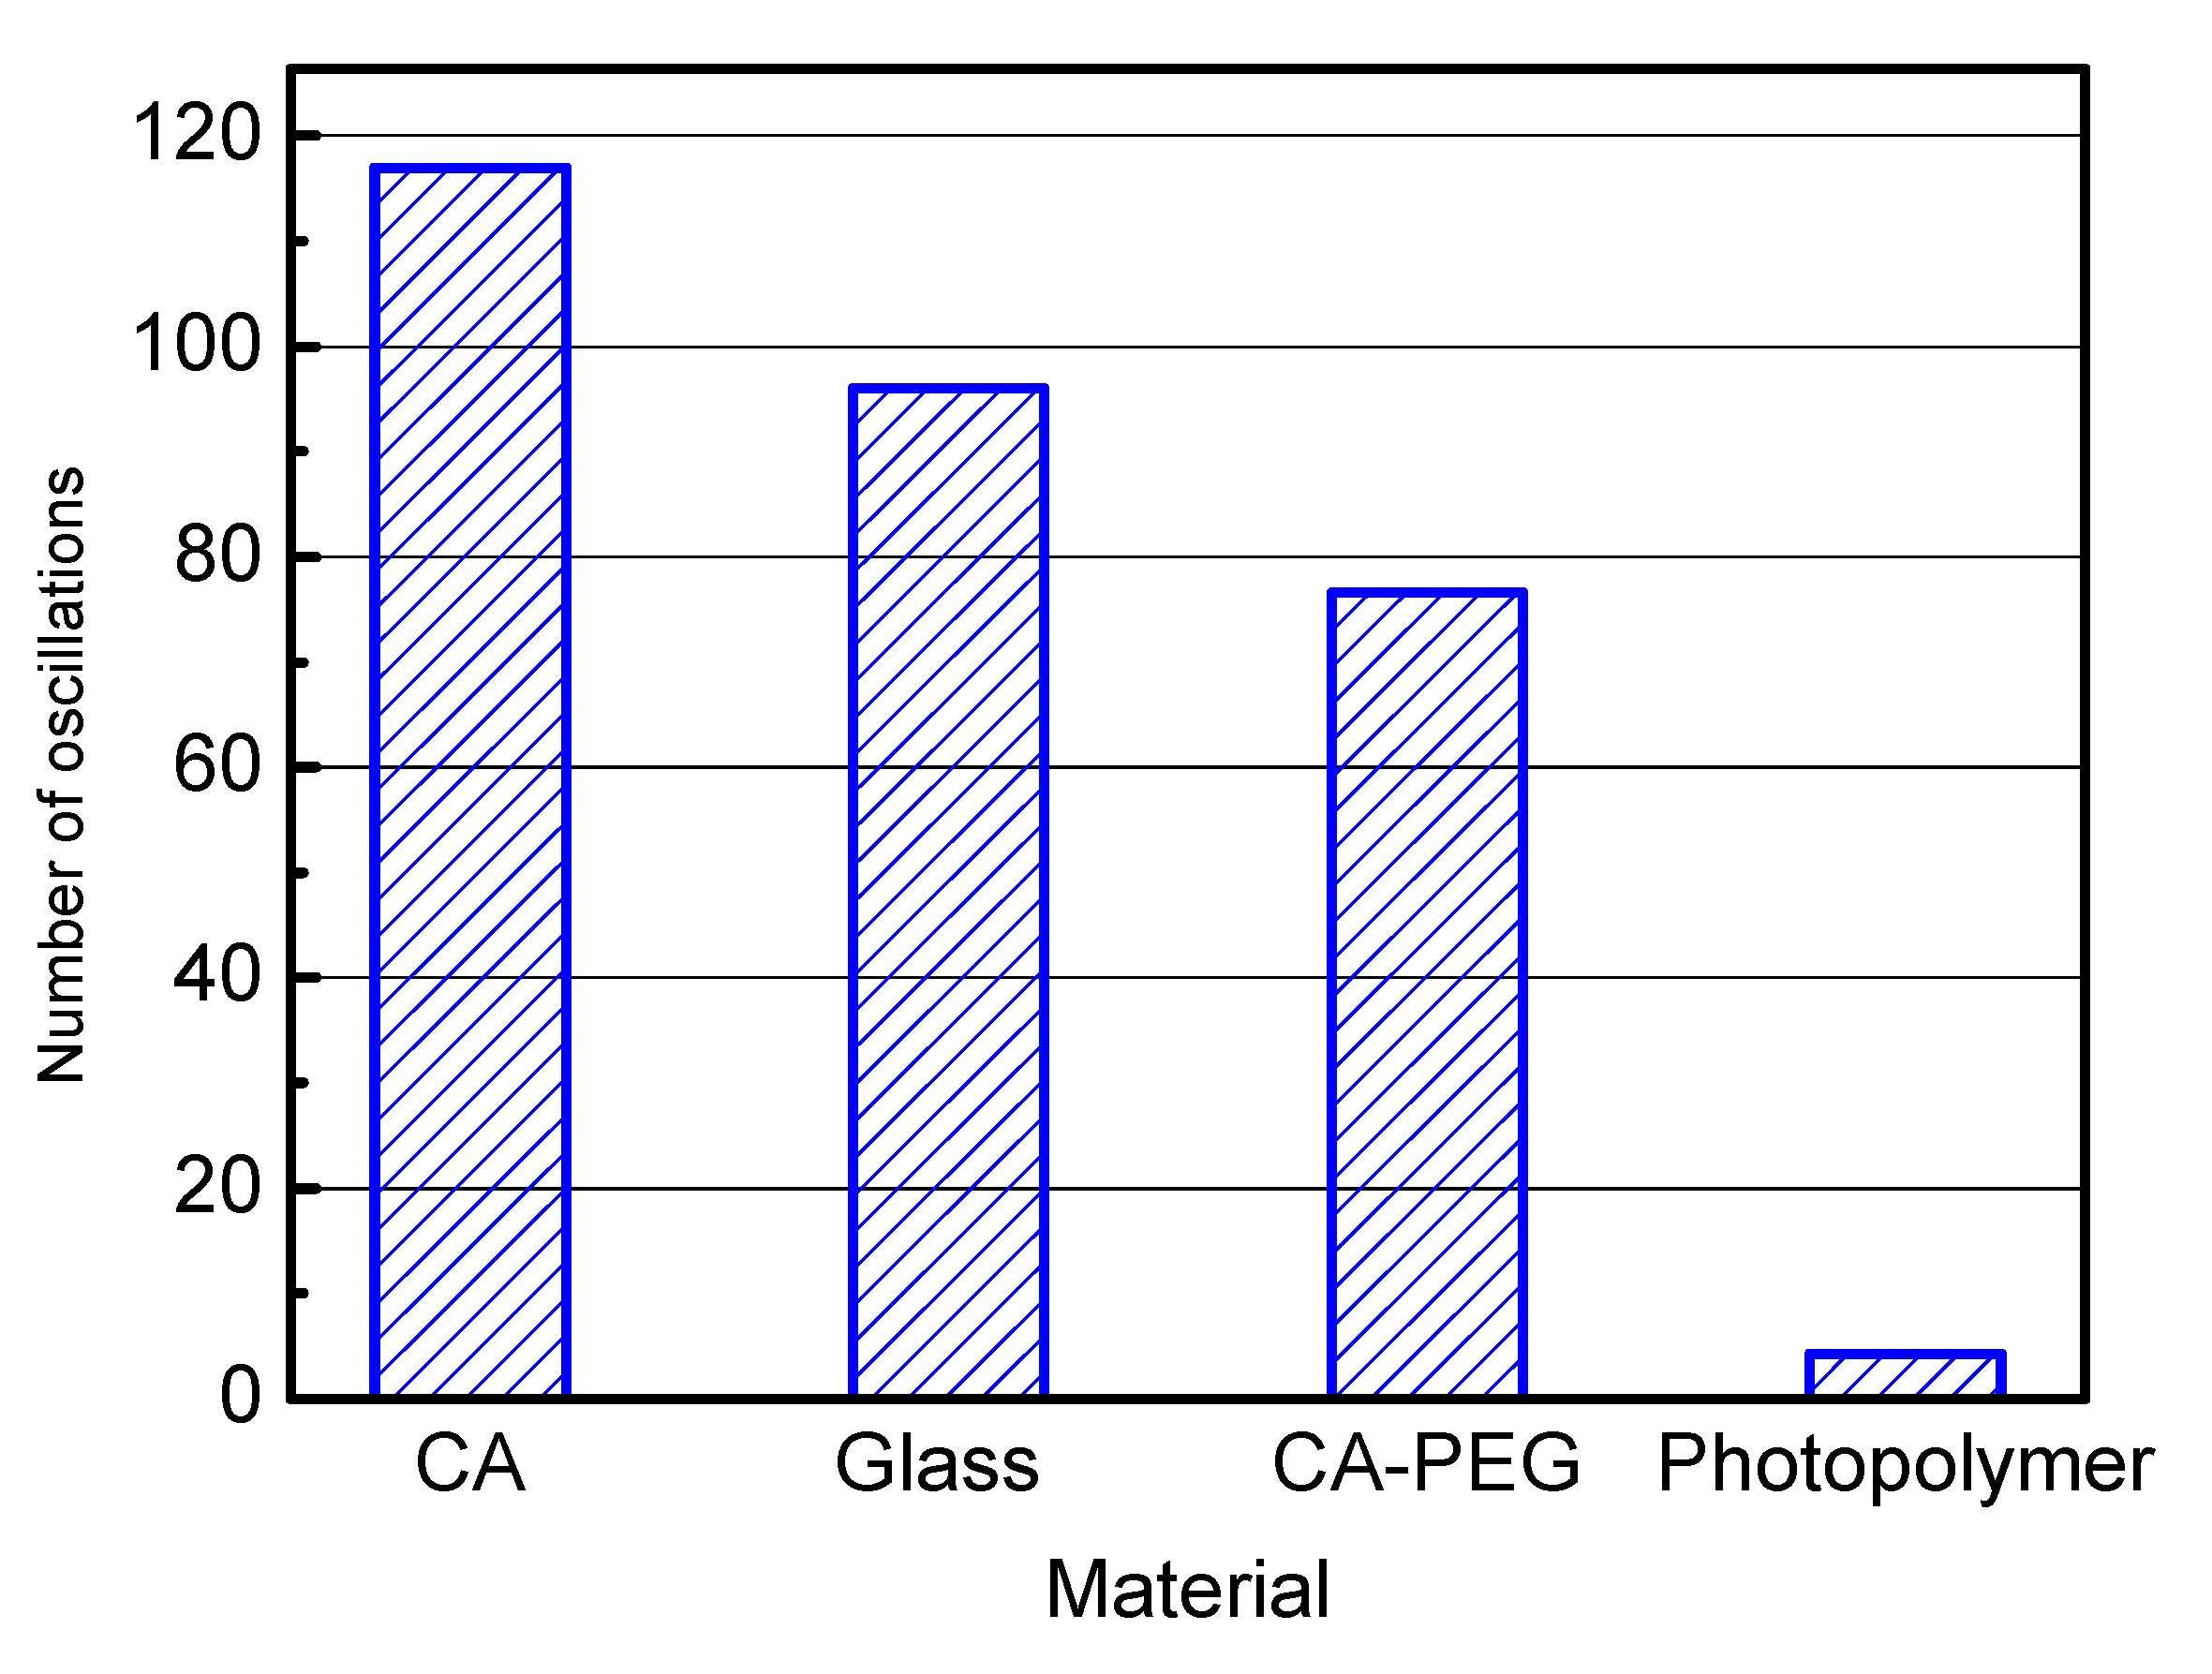
4.4. Durability of the Recorded Grating in Water
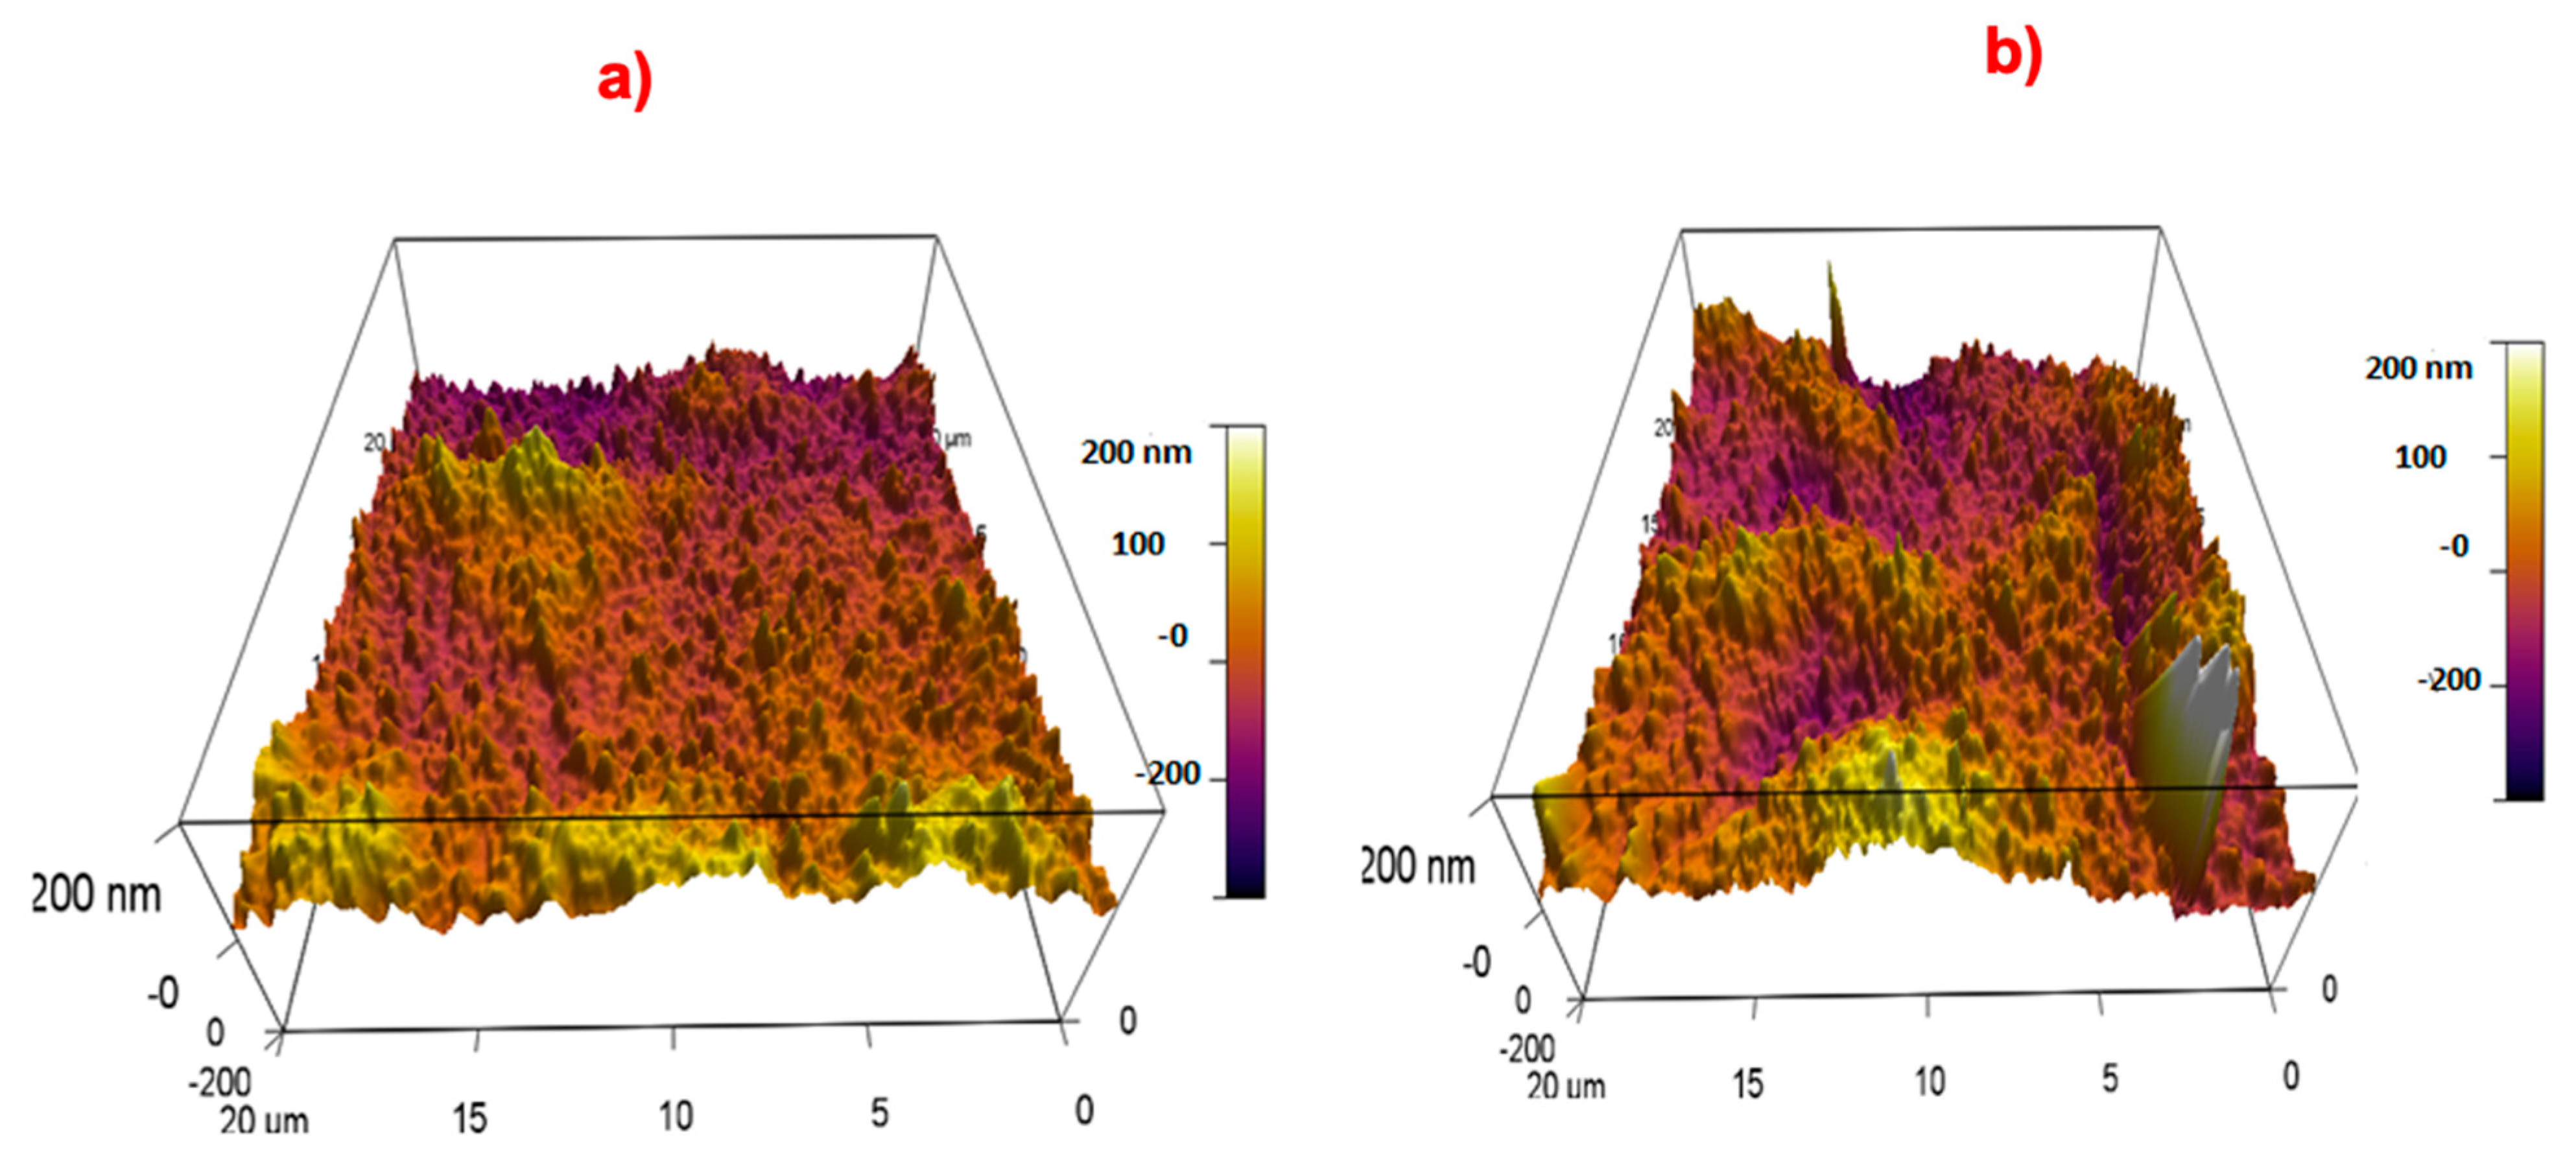
4.5. Characterisation of the Hardness of the Layer Surface
5. Discussion
6. Conclusions
Author Contributions
Funding
Conflicts of Interest
References
- Naydenova, I.; Akbari, H.; Dalton, C.; Mohamed Ilyas, M.Y.; Tee Wei, C.P.; Toal, V.; Marti, S. Photopolymer Holographic Optical Elements for Application in Solar Energy Concentrators. In Holography—Basic Principles and Contemporary Applications; Mihaylova, E., Ed.; InTech: London, UK, 2013. [Google Scholar]
- Ashley, J.; Bernal, M.-P.; Burr, G.W.; Coufal, H.; Guenther, H.; Hoffnagle, J.A.; Jefferson, C.M.; Marcus, B.; Macfarlane, R.M.; Shelby, R.M.; et al. Holographic data storage technology. IBM J. Res. Dev. 2000, 44, 341–368. [Google Scholar] [CrossRef]
- Vather, D.; Naydenova, I.; Cody, D.; Zawadzka, M.; Martin, S.; Mihaylova, E.; Curran, S.; Duffy, P.; Portillo, J.; Connell, D.; et al. Serialized holography for brand protection and authentication. Appl. Opt. 2018, 57, E131–E137. [Google Scholar] [CrossRef]
- Shakher, C.; Rao, G.V. Use of holographic optical elements in speckle metrology: Part 2. Appl. Opt. 1987, 26, 654–657. [Google Scholar] [CrossRef]
- Cody, D.; Gul, S.-E.; Mikulchyk, T.; Irfan, M.; Kharchenko, A.; Goldyn, K.; Martin, S.; Mintova, S.; Cassidy, J.; Naydenova, I. Self-processing photopolymer materials for versatile design and fabrication of holographic sensors and interactive holograms. Appl. Opt. 2018, 57, E173–E183. [Google Scholar] [CrossRef]
- Yetisen, A.K.; Naydenova, I.; Vasconcellos, F.D.C.; Blyth, J.; Lowe, C.R. Holographic Sensors: Three-Dimensional Analyte-Sensitive Nanostructures and Their Applications. Chem. Rev. 2014, 114, 10654–10696. [Google Scholar] [CrossRef] [PubMed] [Green Version]
- Fuchs, Y.; Kunath, S.; Soppera, O.; Haupt, K.; Mayes, A.G. Molecularly Imprinted Silver-Halide Reflection Holograms for Label-Free Opto-Chemical Sensing. Adv. Funct. Mater. 2013, 24, 688–694. [Google Scholar] [CrossRef]
- Kowalski, B.A.; McLeod, R.R. Design concepts for diffusive holographic photopolymers. J. Polym. Sci. Part B Polym. Phys. 2016, 54, 1021–1035. [Google Scholar] [CrossRef] [Green Version]
- Lin, Y.; Harb, A.; Lozano, K.; Xu, D.; Chen, K.P. Five beam holographic lithography for simultaneous fabrication of three dimensional photonic crystal templates and line defects using phase tunable diffractive optical element. Opt. Express 2009, 17, 16625–16631. [Google Scholar] [CrossRef]
- Lynn, B.; Blanche, P.-A.; Peyghambarian, N. Photorefractive polymers for holography. J. Polym. Sci. Part B Polym. Phys. 2013, 52, 193–231. [Google Scholar] [CrossRef]
- Rahmouni, A.; Bougdid, Y.; Moujdi, S.; Nesterenko, D.V.; Sekkat, Z. Photoassisted Holography in Azo Dye Doped Polymer Films. J. Phys. Chem. B 2016, 120, 11317–11322. [Google Scholar] [CrossRef]
- Bianco, A.; Bertarelli, C.; Castagna, R.; Pariani, G.; Zanutta, A. Photo-chromic materials for holography: Issues and constraints. In Proceedings of the Practical Holography XXVI: Materials and Applications, San Francisco, CA, USA, 21–26 January 2012; Volume 8281, p. 3. [Google Scholar]
- Cheben, P.; Belenguer, T.; Núñez, A.; Del Monte, F.; Levy, D. Holographic diffraction gratings recording in organically modified silica gels: Erratum. Opt. Lett. 1997, 22, 193. [Google Scholar] [CrossRef]
- Carretero, L.; Murciano, A.; Blaya, S.; Ulibarrena, M.; Fimia, A. Acrylamide-N,N′-methylenebisacrylamide silica glass holographic recording material. Opt. Express 2004, 12, 1780–1787. [Google Scholar] [CrossRef] [PubMed]
- Ramos, G.; Alvarez-Herrero, A.; Belenguer, T.; Del Monte, F.; Levy, D. Shrinkage control in a photopolymerizable hybrid solgel material for holographic recording. Appl. Opt. 2004, 43, 4018–4024. [Google Scholar] [CrossRef] [PubMed]
- Schnoes, M.G.; Dhar, L.; Schilling, M.L.; Patel, S.S.; Wiltzius, P. Photopolymer-filled nanoporous glass as a dimensionally stable holographic recording medium. Opt. Lett. 1999, 24, 658–660. [Google Scholar] [CrossRef]
- Velasco, A.V.; Hernández-Garay, M.P.; Calvo, M.L.; Cheben, P.; Del Monte, F. Photopolymerizable glasses incorporating high refractive index species and ionic liquid: A comparative study. J. Appl. Phys. 2011, 109, 53106. [Google Scholar] [CrossRef] [Green Version]
- Del Monte, F.; Martínez, O.; Rodrigo, J.A.; Calvo, M.L.; Cheben, P. A Volume Holographic Sol-Gel Material with Large Enhancement of Dynamic Range by Incorporation of High Refractive Index Species. Adv. Mater. 2006, 18, 2014–2017. [Google Scholar] [CrossRef]
- Cheben, P.; Calvo, M.L. A photopolymerizable glass with diffraction efficiency near 100% for holographic storage. Appl. Phys. Lett. 2001, 78, 1490–1492. [Google Scholar] [CrossRef] [Green Version]
- Murciano, A.; Blaya, S.; Carretero, L.; Madrigal, R.F.; Fimia, A. Holographic reflection gratings in photopolymerizable solgel materials. Opt. Lett. 2006, 31, 2317–2319. [Google Scholar] [CrossRef]
- Kuo, C.-Y.; Hsu, T.-C.; Su, W.-H. A facile sol–gel synthesis of crack-free photopolymerizable silica for holographic recording. J. Non Cryst. Solids 2012, 358, 735–740. [Google Scholar] [CrossRef]
- Chang, Y.M.; Yoon, S.C.; Han, M. Photopolymerization of aromatic acrylate containing phosphine oxide backbone and its application to holographic recording. Opt. Mater. 2007, 30, 662–668. [Google Scholar] [CrossRef]
- Su, Z.; Huang, S.; Wang, Y.; Ling, H.; Yang, X.; Jin, Y.; Wang, X.; Zhang, W. Robust, high-barrier, and fully recyclable cellulose-based plastic replacement enabled by a dynamic imine polymer. J. Mater. Chem. A 2020, 8, 14082–14090. [Google Scholar] [CrossRef]
- Tan, X.; Rodrigue, D. A Review on Porous Polymeric Membrane Preparation. Part I: Production Techniques with Polysulfone and Poly (Vinylidene Fluoride). Polymers 2019, 11, 1160. [Google Scholar] [CrossRef] [Green Version]
- Smirnova, T.; Sakhno, O. A mechanism of the relief-phase structure formation in self-developing photopolymers. Opt. Spectr. 2001, 3, 126–131. [Google Scholar] [CrossRef]
- Gul, S.-E.; O’Neill, L.; Cassidy, J.; Naydenova, I. Modified Surface Relief Layer Created by Holographic Lithography: Application to Selective Sodium and Potassium Sensing. Sensors 2019, 19, 1026. [Google Scholar] [CrossRef] [PubMed] [Green Version]
- Birabassov, R.; Galstian, T.V.; Dechamplain, F.; Ritcey, A.-M.R. Azo-dye-doped cellulose acetate for optical data storage and processing. Proc. SPIE 1998, 3491, 704–709. [Google Scholar]
- Wang, K.; Guo, L.; Zhou, L.; Zhu, J. Imaging mechanism of the holographic recording material dichromated cellulose triacetate. Appl. Opt. 1996, 35, 6369–6374. [Google Scholar] [CrossRef]
- Mikulchyk, T.; Walshe, J.; Cody, D.; Martin, S.; Naydenova, I. Humidity and temperature induced changes in the diffraction efficiency and the Bragg angle of slanted photopolymer-based holographic gratings. Sens. Actuators B Chem. 2017, 239, 776–785. [Google Scholar] [CrossRef] [Green Version]
- Kaiser, A.; Stark, W.J.; Grass, R.N. Rapid Production of a Porous Cellulose Acetate Membrane for Water Filtration using Readily Available Chemicals. J. Chem. Educ. 2016, 94, 483–487. [Google Scholar] [CrossRef]
- Rezaei, A.; Nasirpour, A.; Fathi, M. Application of Cellulosic Nanofibers in Food Science Using Electrospinning and Its Potential Risk. Compr. Rev. Food Sci. Food Saf. 2015, 14, 269–284. [Google Scholar] [CrossRef]
- Hariharan, P. Optical Holography: Cambridge Studies in Modern Optics 2; Cambridge University Press: Cambridge, UK, 1986; p. 319. [Google Scholar]
- Kogelnik, H. Coupled Wave Theory for Thick Hologram Gratings. Bell Syst. Tech. J. 1969, 48, 2909–2947. [Google Scholar] [CrossRef]
- Mikulchyk, T.; Martin, S.; Naydenova, I. N-isopropylacrylamide-based photopolymer for holographic recording of thermosensitive transmission and reflection gratings. Appl. Opt. 2017, 56, 6348–6356. [Google Scholar] [CrossRef] [PubMed]
- Leite, E.; Naydenova, I.; Mintova, S.; Leclercq, L.; Toal, V. Photopolymerizable nanocomposites for holographic recording and sensor application. Appl. Opt. 2010, 49, 3652–3660. [Google Scholar] [CrossRef] [PubMed] [Green Version]
- Yetisen, A.K.; Butt, H.; Volpatti, L.; Pavlichenko, I.; Humar, M.; Kwok, S.J.; Koo, H.; Kim, K.S.; Naydenova, I.; Khademhosseini, A.; et al. Photonic hydrogel sensors. Biotechnol. Adv. 2015, 34, 250–271. [Google Scholar] [CrossRef] [PubMed] [Green Version]
- Jiang, N.; Butt, H.; Montelongo, Y.; Liu, F.; Afewerki, S.; Ying, G.; Dai, Q.; Yun, S.-H.; Yetisen, A.K. Laser Interference Lithography for the Nanofabrication of Stimuli-Responsive Bragg Stacks. Adv. Funct. Mater. 2017, 28, 1702715. [Google Scholar] [CrossRef]


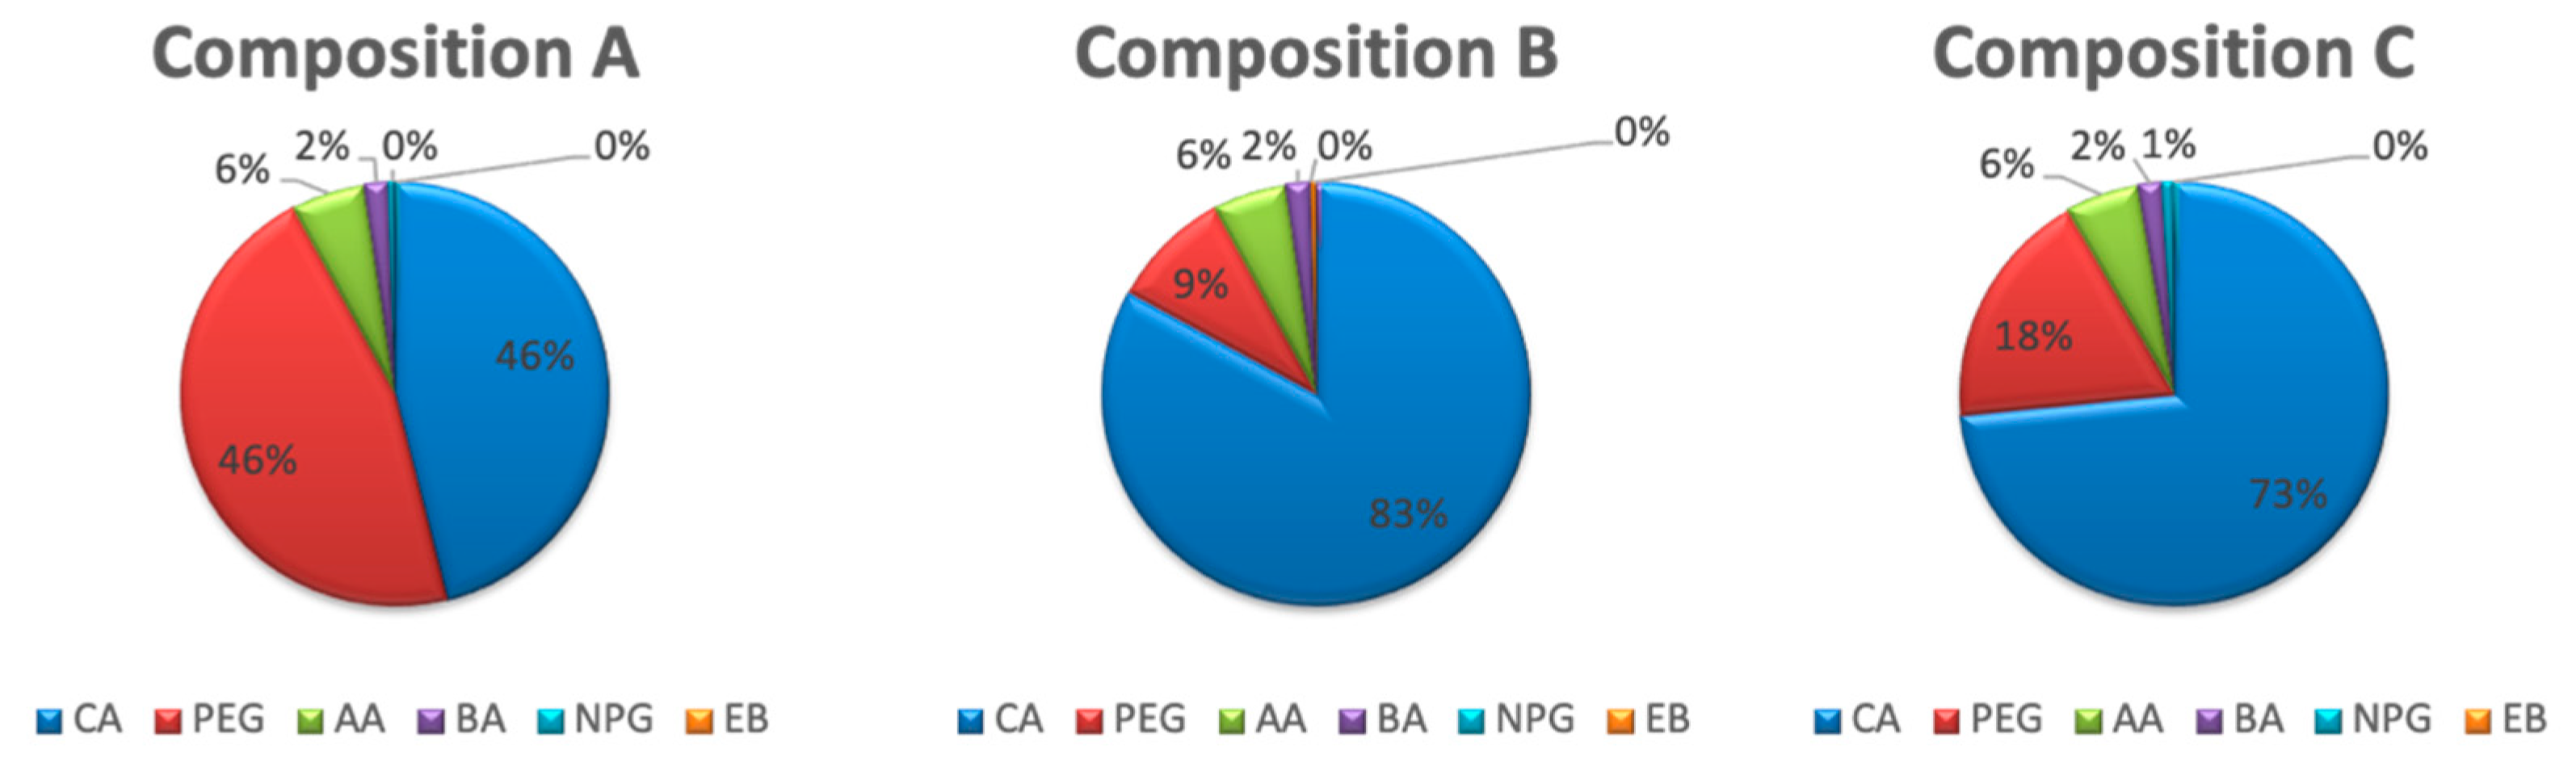
| Components | (A) Amount (g) | (B) Amount (g) | (C) Amount (g) |
|---|---|---|---|
| Cellulose acetate (CA) (g) | 5.0 | 9.0 | 8.0 |
| Polyethylene glycol (PEG) (g) | 5.0 | 1.0 | 2.0 |
| Acrylamide (AA) (g) | 0.6 | 0.6 | 0.6 |
| N,N′methylenbisacrylamide (BA) (g) | 0.2 | 0.2 | 0.2 |
| N-phenyl glycine (NPG) (g) | 0.05 | 0.05 | 0.09 |
| Erthrosine B dye (EB) (g) | 0.0044 | 0.0044 | 0.0044 |
| Total weight | 10.854 | 10.854 | 10.894 |
Publisher’s Note: MDPI stays neutral with regard to jurisdictional claims in published maps and institutional affiliations. |
© 2021 by the authors. Licensee MDPI, Basel, Switzerland. This article is an open access article distributed under the terms and conditions of the Creative Commons Attribution (CC BY) license (https://creativecommons.org/licenses/by/4.0/).
Share and Cite
Gul, S.-e.-; Cassidy, J.; Naydenova, I. Water Resistant Cellulose Acetate Based Photopolymer for Recording of Volume Phase Holograms. Photonics 2021, 8, 329. https://doi.org/10.3390/photonics8080329
Gul S-e-, Cassidy J, Naydenova I. Water Resistant Cellulose Acetate Based Photopolymer for Recording of Volume Phase Holograms. Photonics. 2021; 8(8):329. https://doi.org/10.3390/photonics8080329
Chicago/Turabian StyleGul, Sabad-e-, John Cassidy, and Izabela Naydenova. 2021. "Water Resistant Cellulose Acetate Based Photopolymer for Recording of Volume Phase Holograms" Photonics 8, no. 8: 329. https://doi.org/10.3390/photonics8080329