1. Introduction
Phase-only liquid crystal on silicon (LCOS) devices [
1,
2,
3,
4] are a versatile and efficient tool to modulate the light field. This technology has a wide range of applications including information display [
5,
6], optical switches [
7,
8], optical tweezers [
9,
10], laser pulse shaping systems [
11], etc.
Key performance parameters for the LCOS devices include resolutions, pixel sizes, reflectivity, diffraction efficiency, etc. Recently, phase flicker, i.e., temporal fluctuation of phase response, has also become a critical parameter. It has been demonstrated that the reduction of the phase flicker in the LCOS devices was able to improve the image quality in the holographic display systems [
12,
13]. The crosstalk in the optical switches based on the LCOS technology can also be suppressed by using LCOS devices with lower phase flicker [
14].
A variety of techniques have been proposed for the phase flicker minimisation. Increasing the field inversion frequency [
15,
16] of the driving waveforms minimises the impact of the residual DC unbalance and therefore proves to be an effective way to suppress the phase flicker. LCOS devices with slower responses are also associated with low phase flicker. This can be achieved by reducing the operation temperature of the device, using liquid crystal material with higher viscosity [
17,
18], or increasing the liquid crystal cell gap [
19]. However, it might not be desirable to sacrifice the response speed of the LCOS device for some applications. In the digital LCOS devices, where pulse width modulation (PWM) scheme is used to drive the LC material, the optimisation of the pulse sequences [
20,
21] is also an effective way to reduce the flicker. This makes the digital LCOS devices suitable for the phase-only applications.
The phase flicker in the LCOS devices can be measured by polarimetric systems [
22,
23], diffractive systems [
24] or interferometric systems [
25]. Polarimetric and diffractive setups uses photodiode as the detector instead of the CCD or CMOS camera used in the interferometric systems. Therefore, polarimetric and diffractive systems are easier to setup and able to deliver more accurate characterisation. As the phase of the light cannot be measured directly, the temporal phase response of the LCOS devices is derived from the temporal intensity of the modulated light beam in both setups. As the phase flicker in the LCOS devices continues to decrease, the noise within the characterisation systems may start to influence the level of phase flicker derived.
In this paper, we analyse the uncertainty in the phase flicker measurement. The impact of the laser source instability and the noises of the photo detector were evaluated through simulation and experiments. Subsequently, we proposed a strategy to reduce the measurement uncertainty.
2. Phase Flicker Characterisation System
In this work, we used a polarimetric system to characterise the phase response and flicker of the LCOS device.
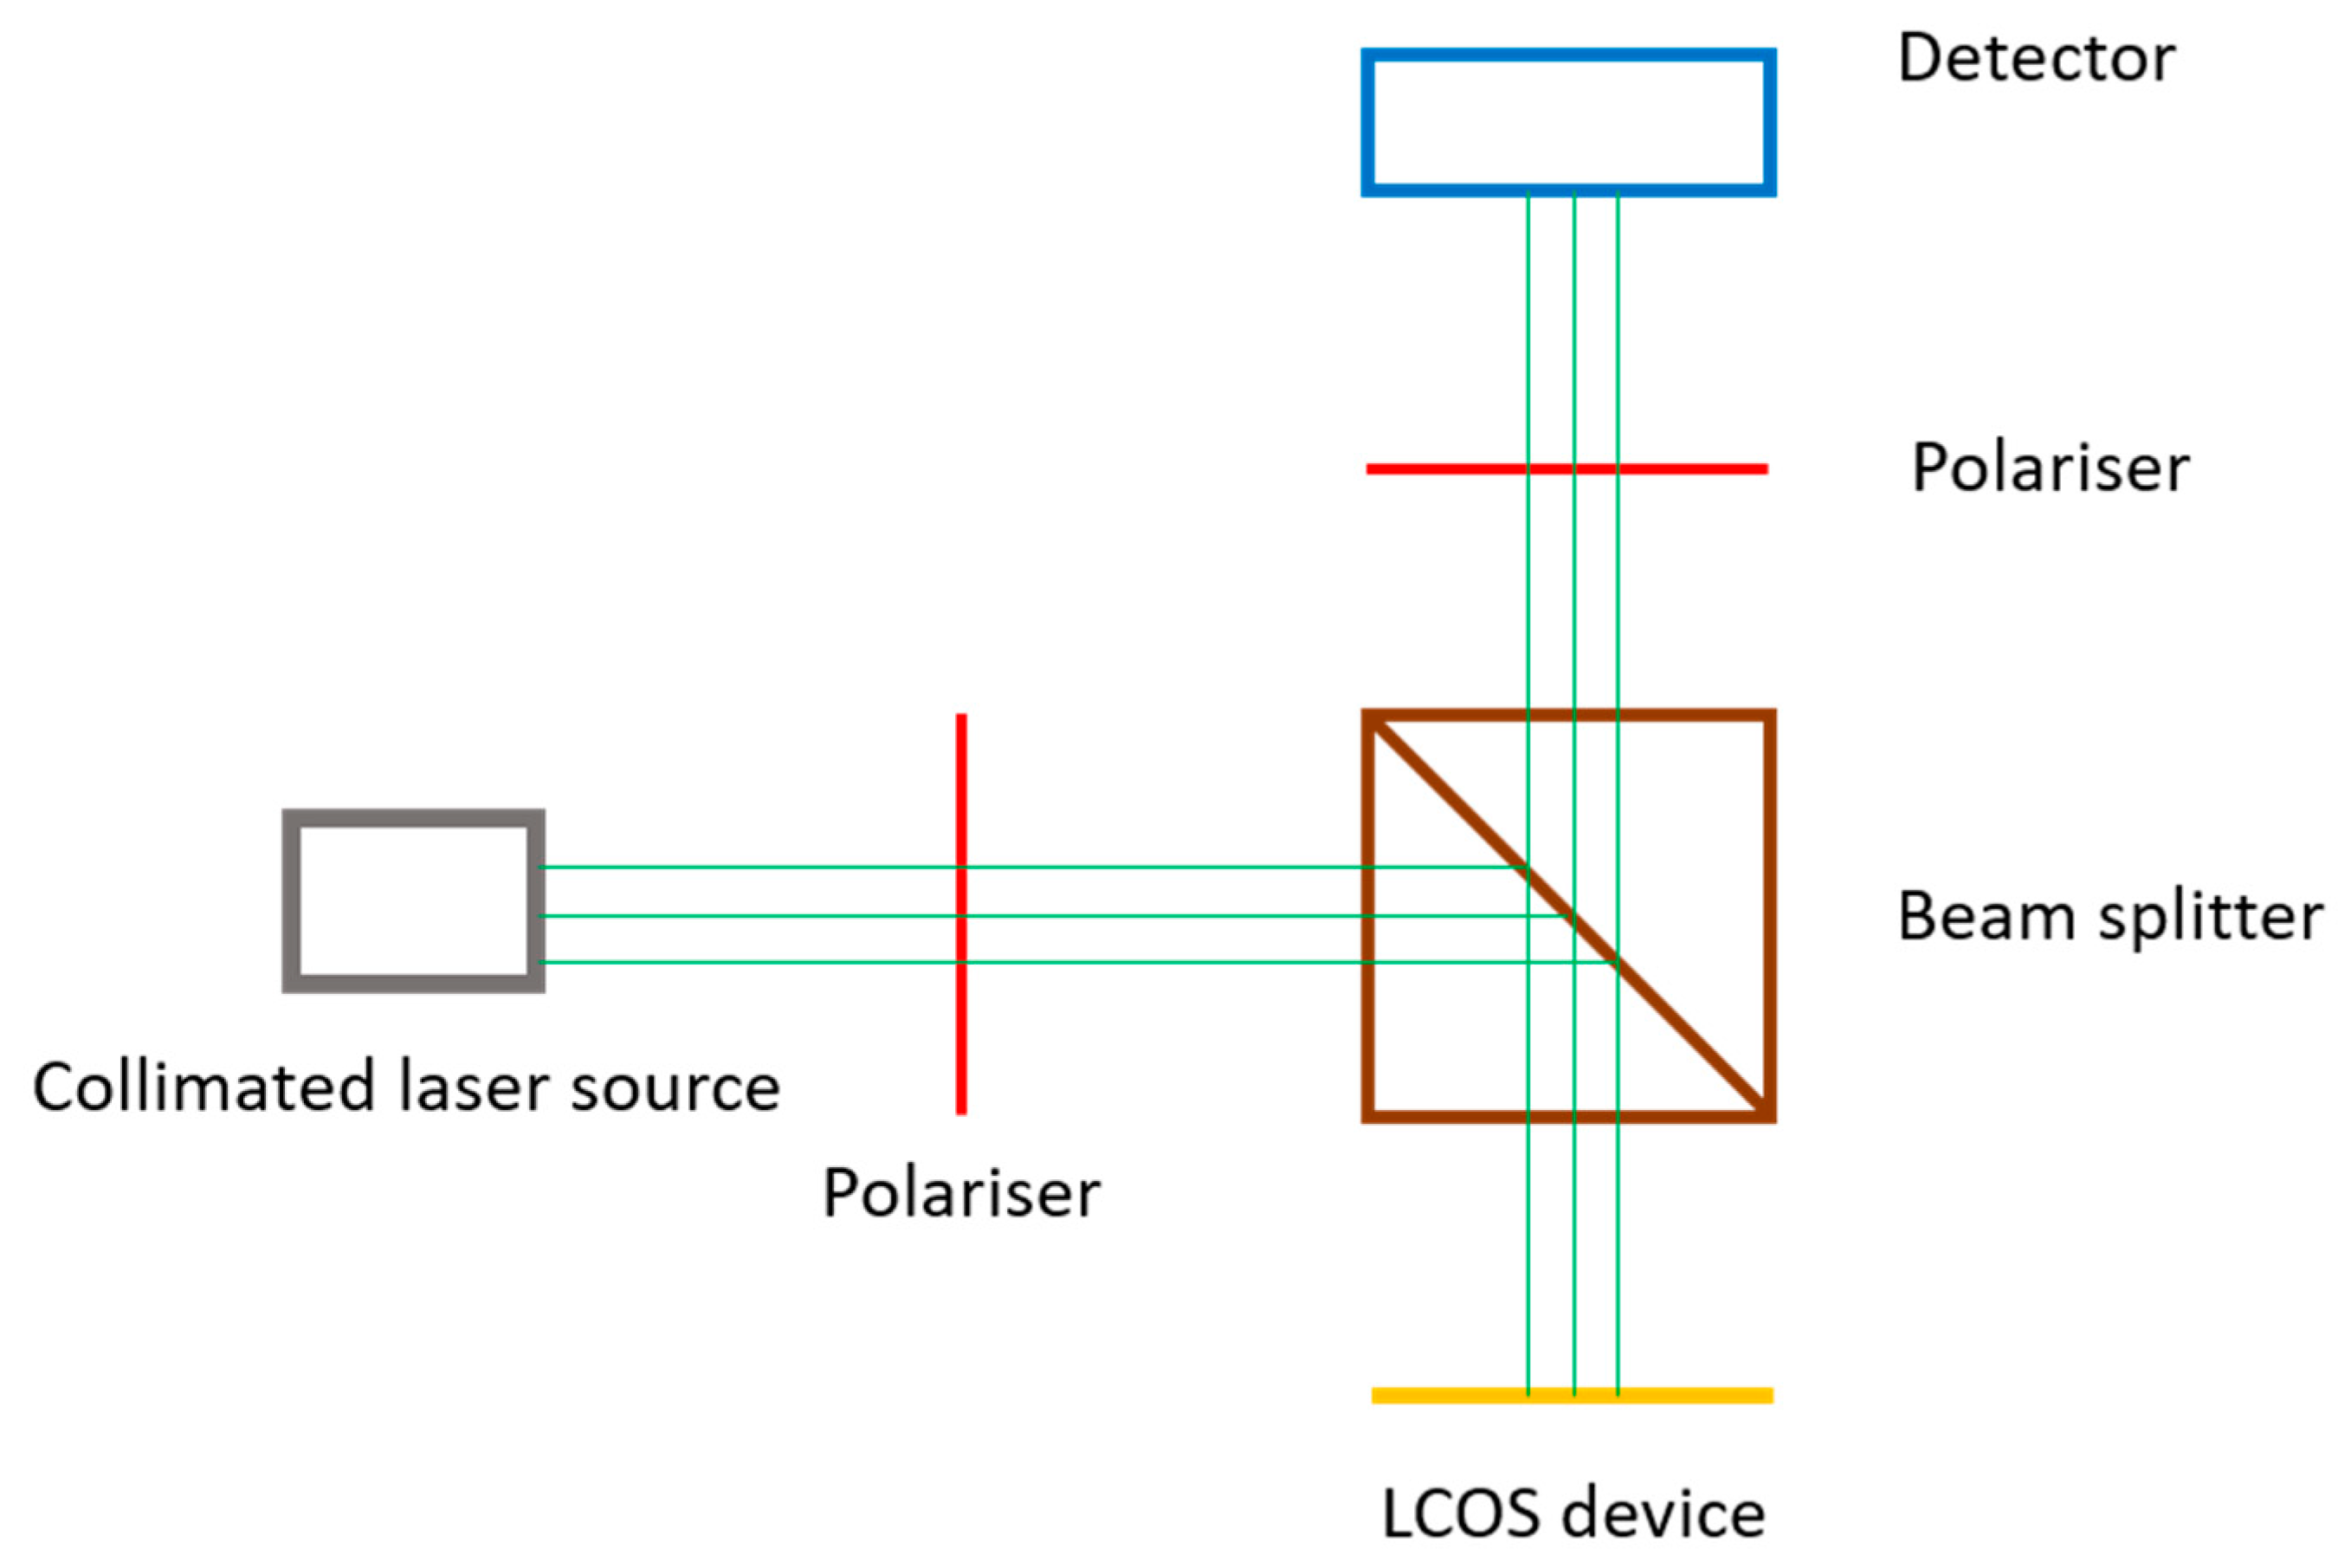
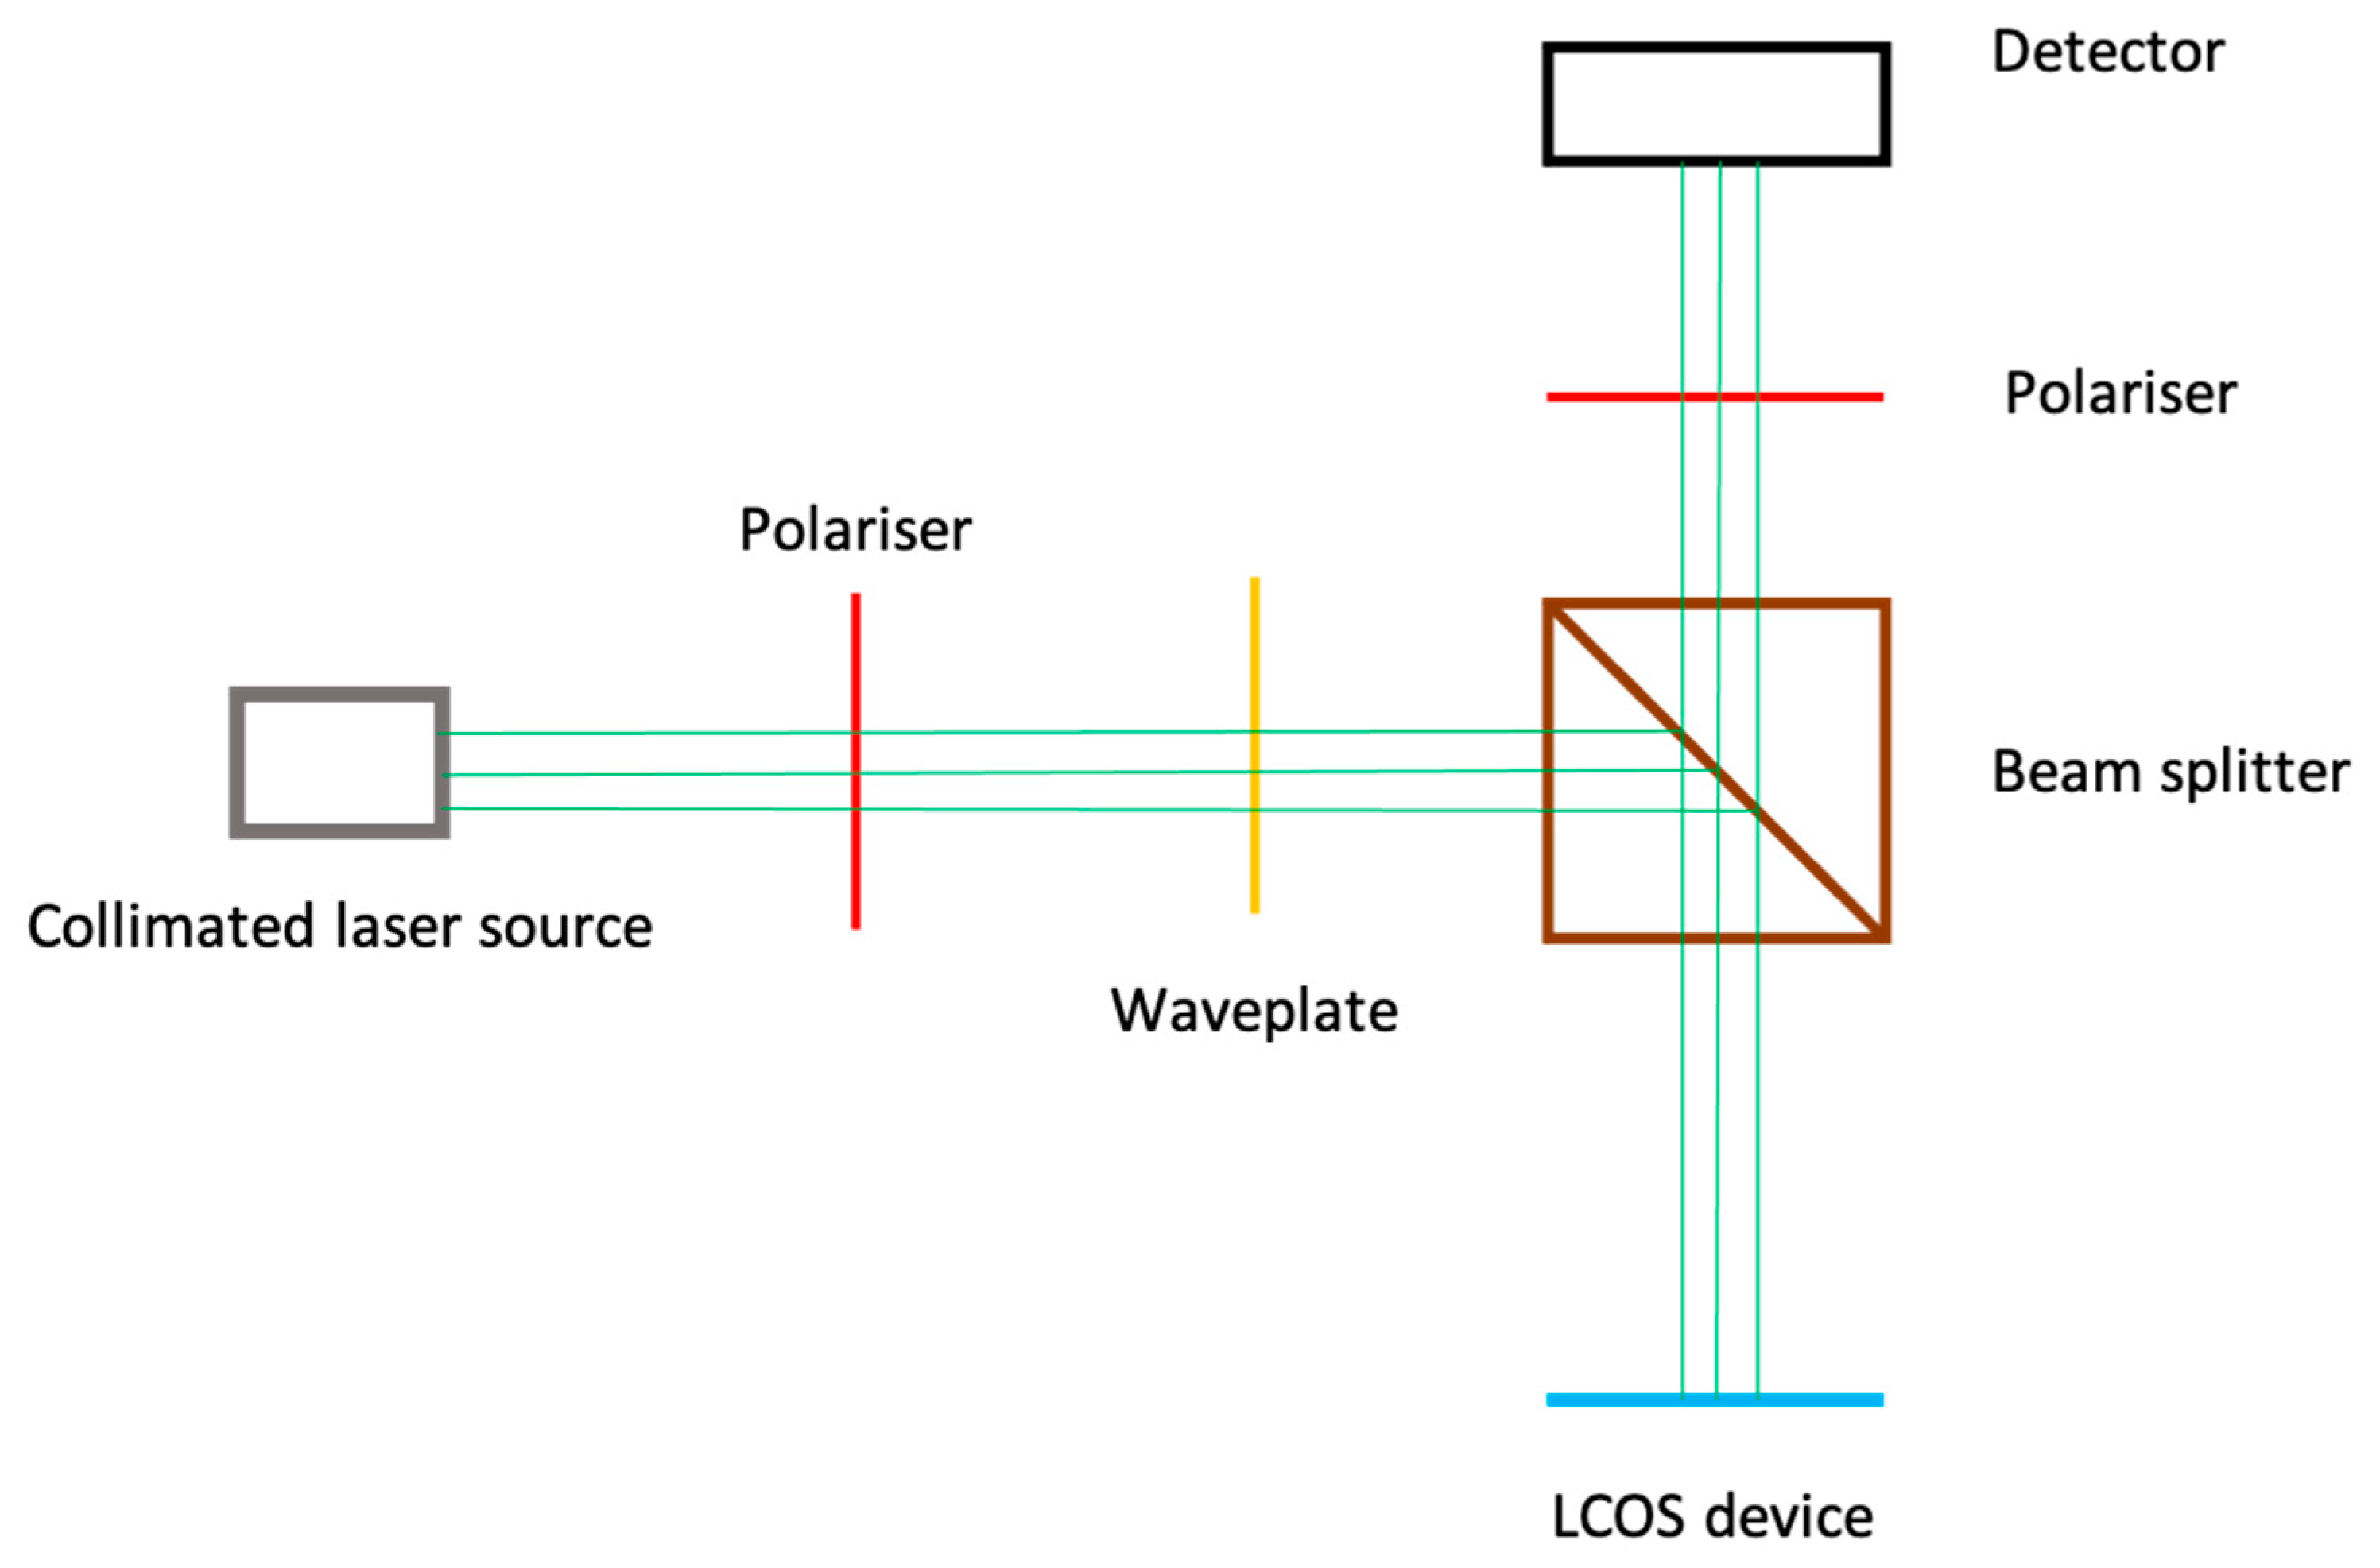
Figure 1 shows the general architecture of this polarimetric system. A collimated laser source at 1550 nm was fed into this characterisation system. The LCOS device was placed between a pair of linear polarisers. The directions of these two linear polarisers were orthogonal to each other. The polarisation direction of the LCOS device was aligned 45° with respect to these polarisers. In this setup, the intensity of optical beam at the detector plane can be modulated by the phase depth of the LCOS device. In order to characterise the phase flicker, a high-speed amplified photodiode circuit was used.
The relationship between the light intensity (
I) at the detector plane and the phase depth (
) of the LCOS device can be described by:
where
I0 is the maximum power detected by the photodiode circuit,
is a constant that is related to liquid crystal cell gap of the LCOS device.
One of the key advantages of this polarimetric system is that the LCOS device displays uniform phase patterns during the characterisation. This avoids the impact of the fringing field effect [
26]. However, the value of the constant
is unknown. This could complicate the phase response and flicker calculation. It should be noted that the diffractive characterisation system is able to eliminate this issue although it would also introduce the fringing field effect. However, the mechanism of the measurement uncertainty is similar in both configurations. Therefore, the analysis will be based on the polarimetric system.
3. Origin of the Measurement Uncertainty
The following analysis will illustrate how the noise within the characterisation system could affect the calculated phase flicker level. The primary sources of noise within the characterisation system are the laser instability and the white noise of the amplified photodiode circuit. This paper will not differentiate these two types of noises since both of them ultimately lead to fluctuation of the detected light intensity over the time even in the absence of the phase flicker in the LCOS device. Therefore, this paper will only focus on how such fluctuation would affect the phase flicker derivation.
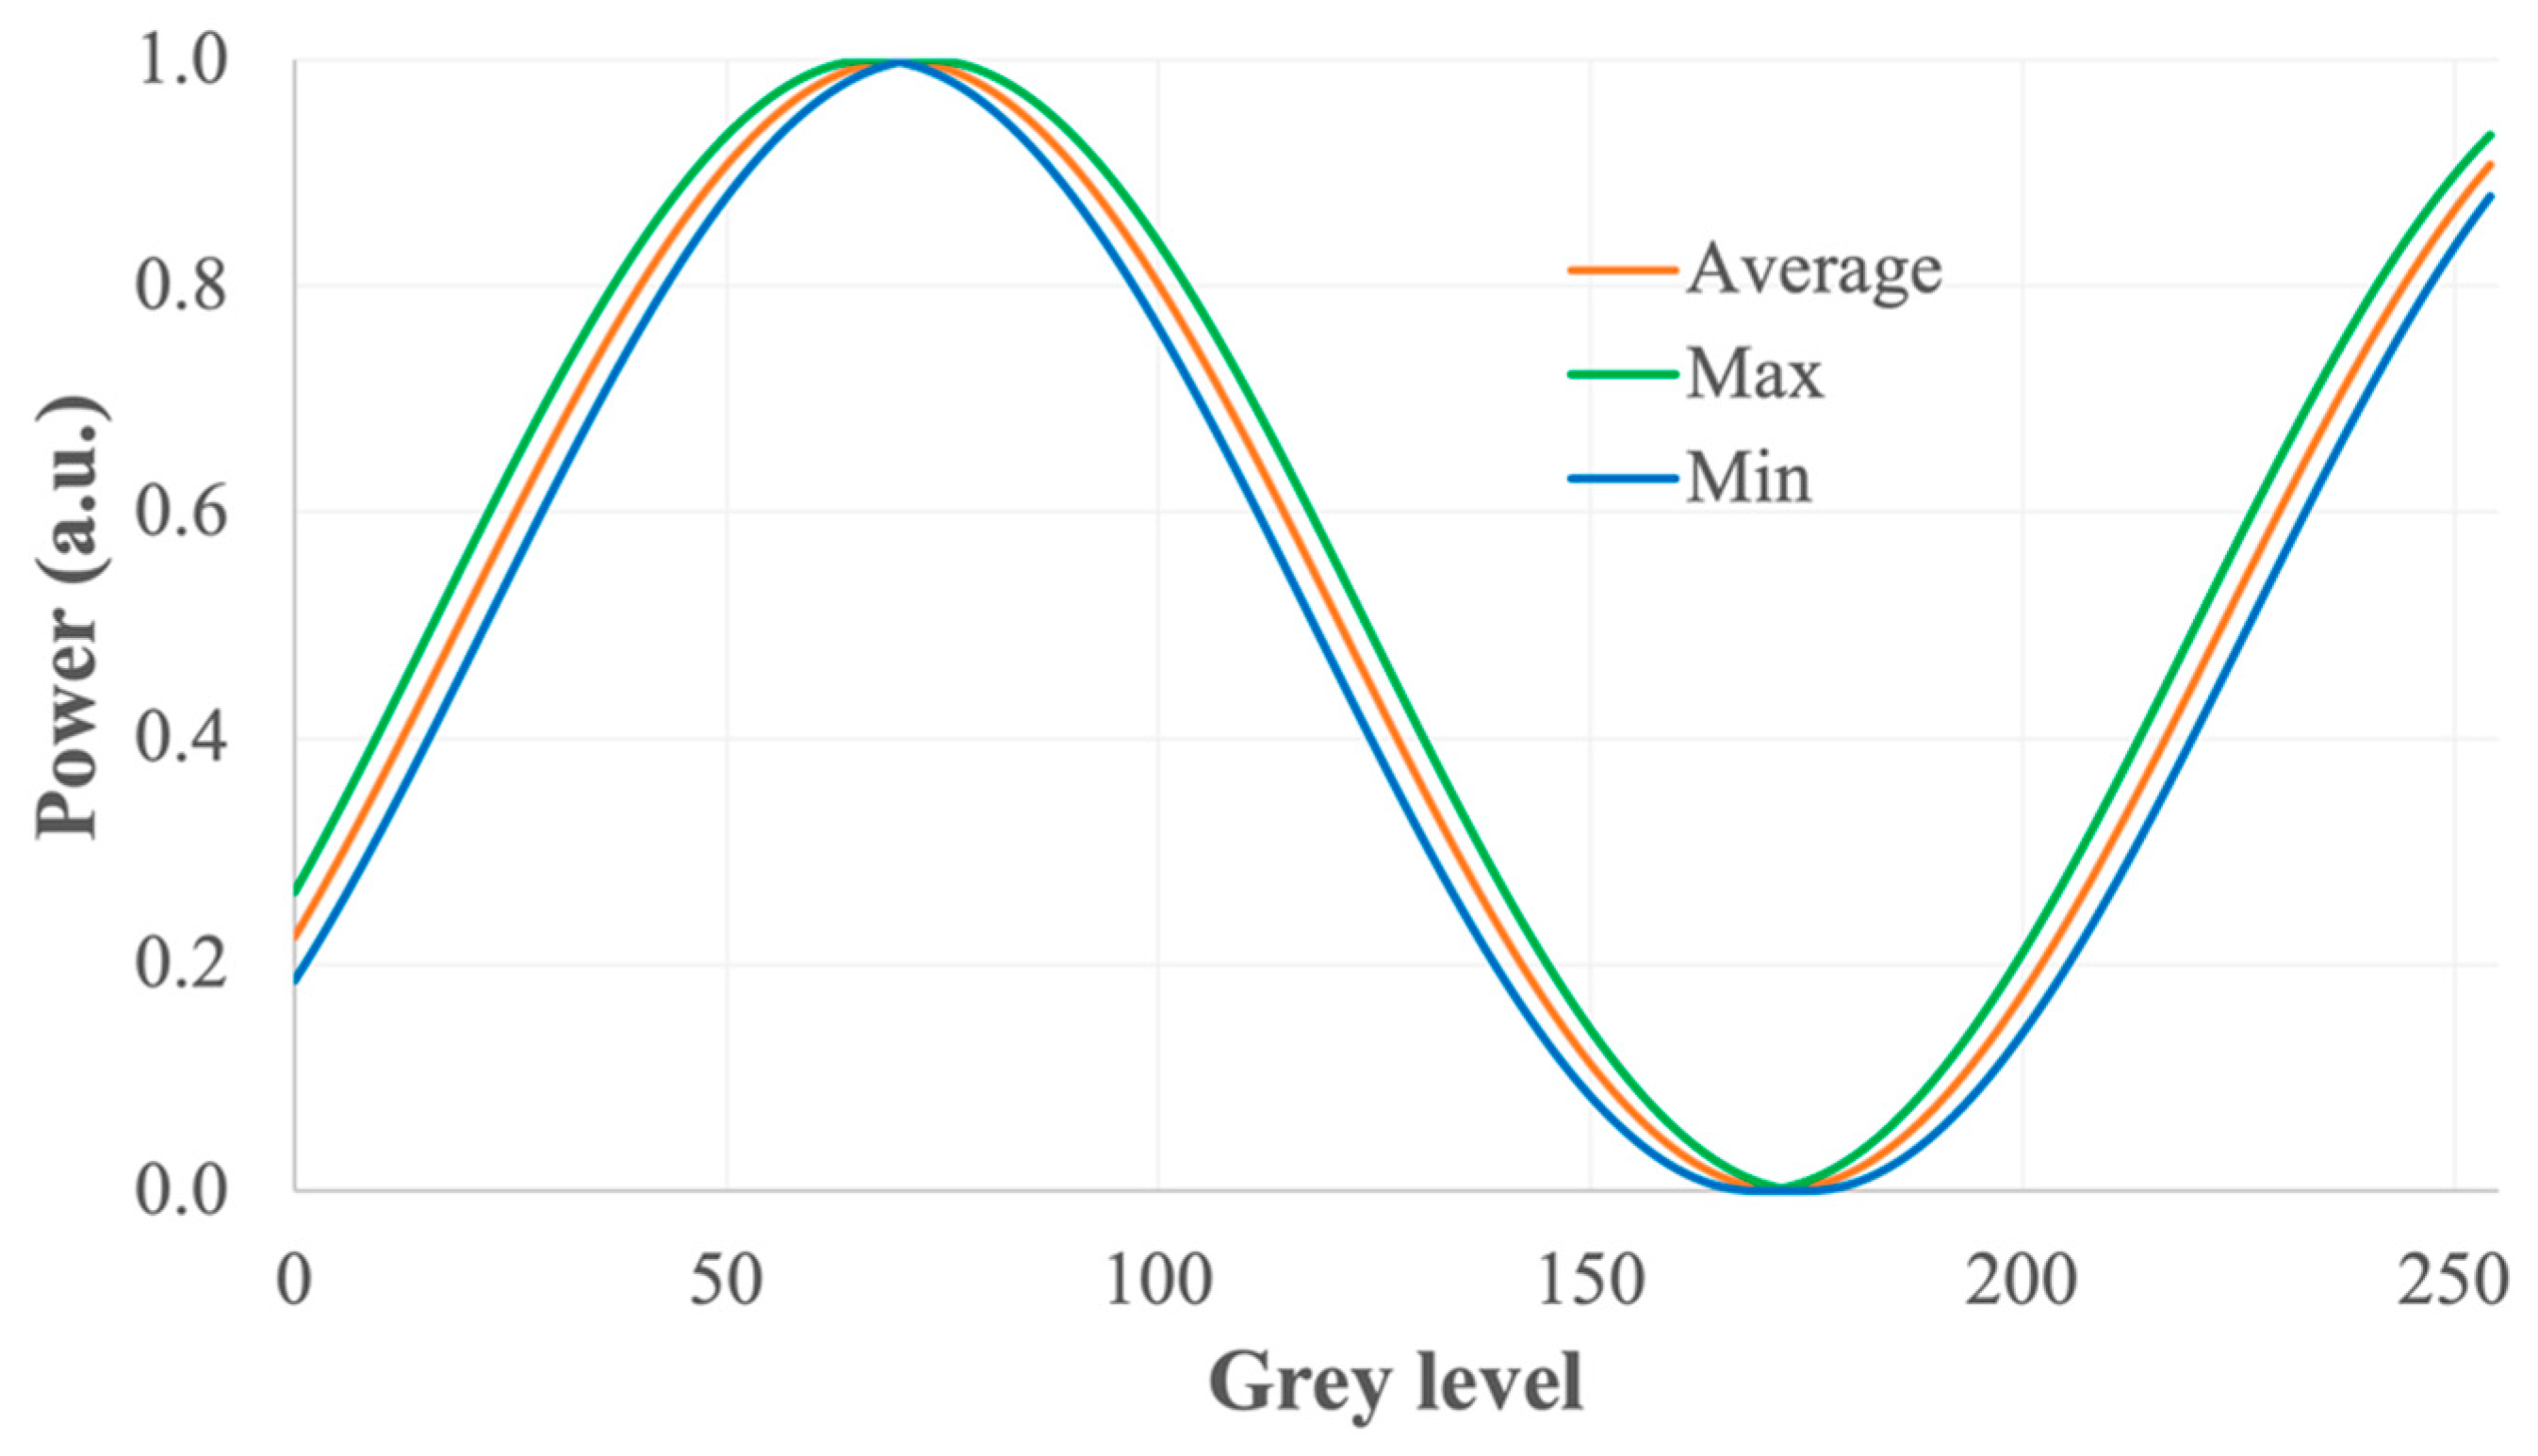
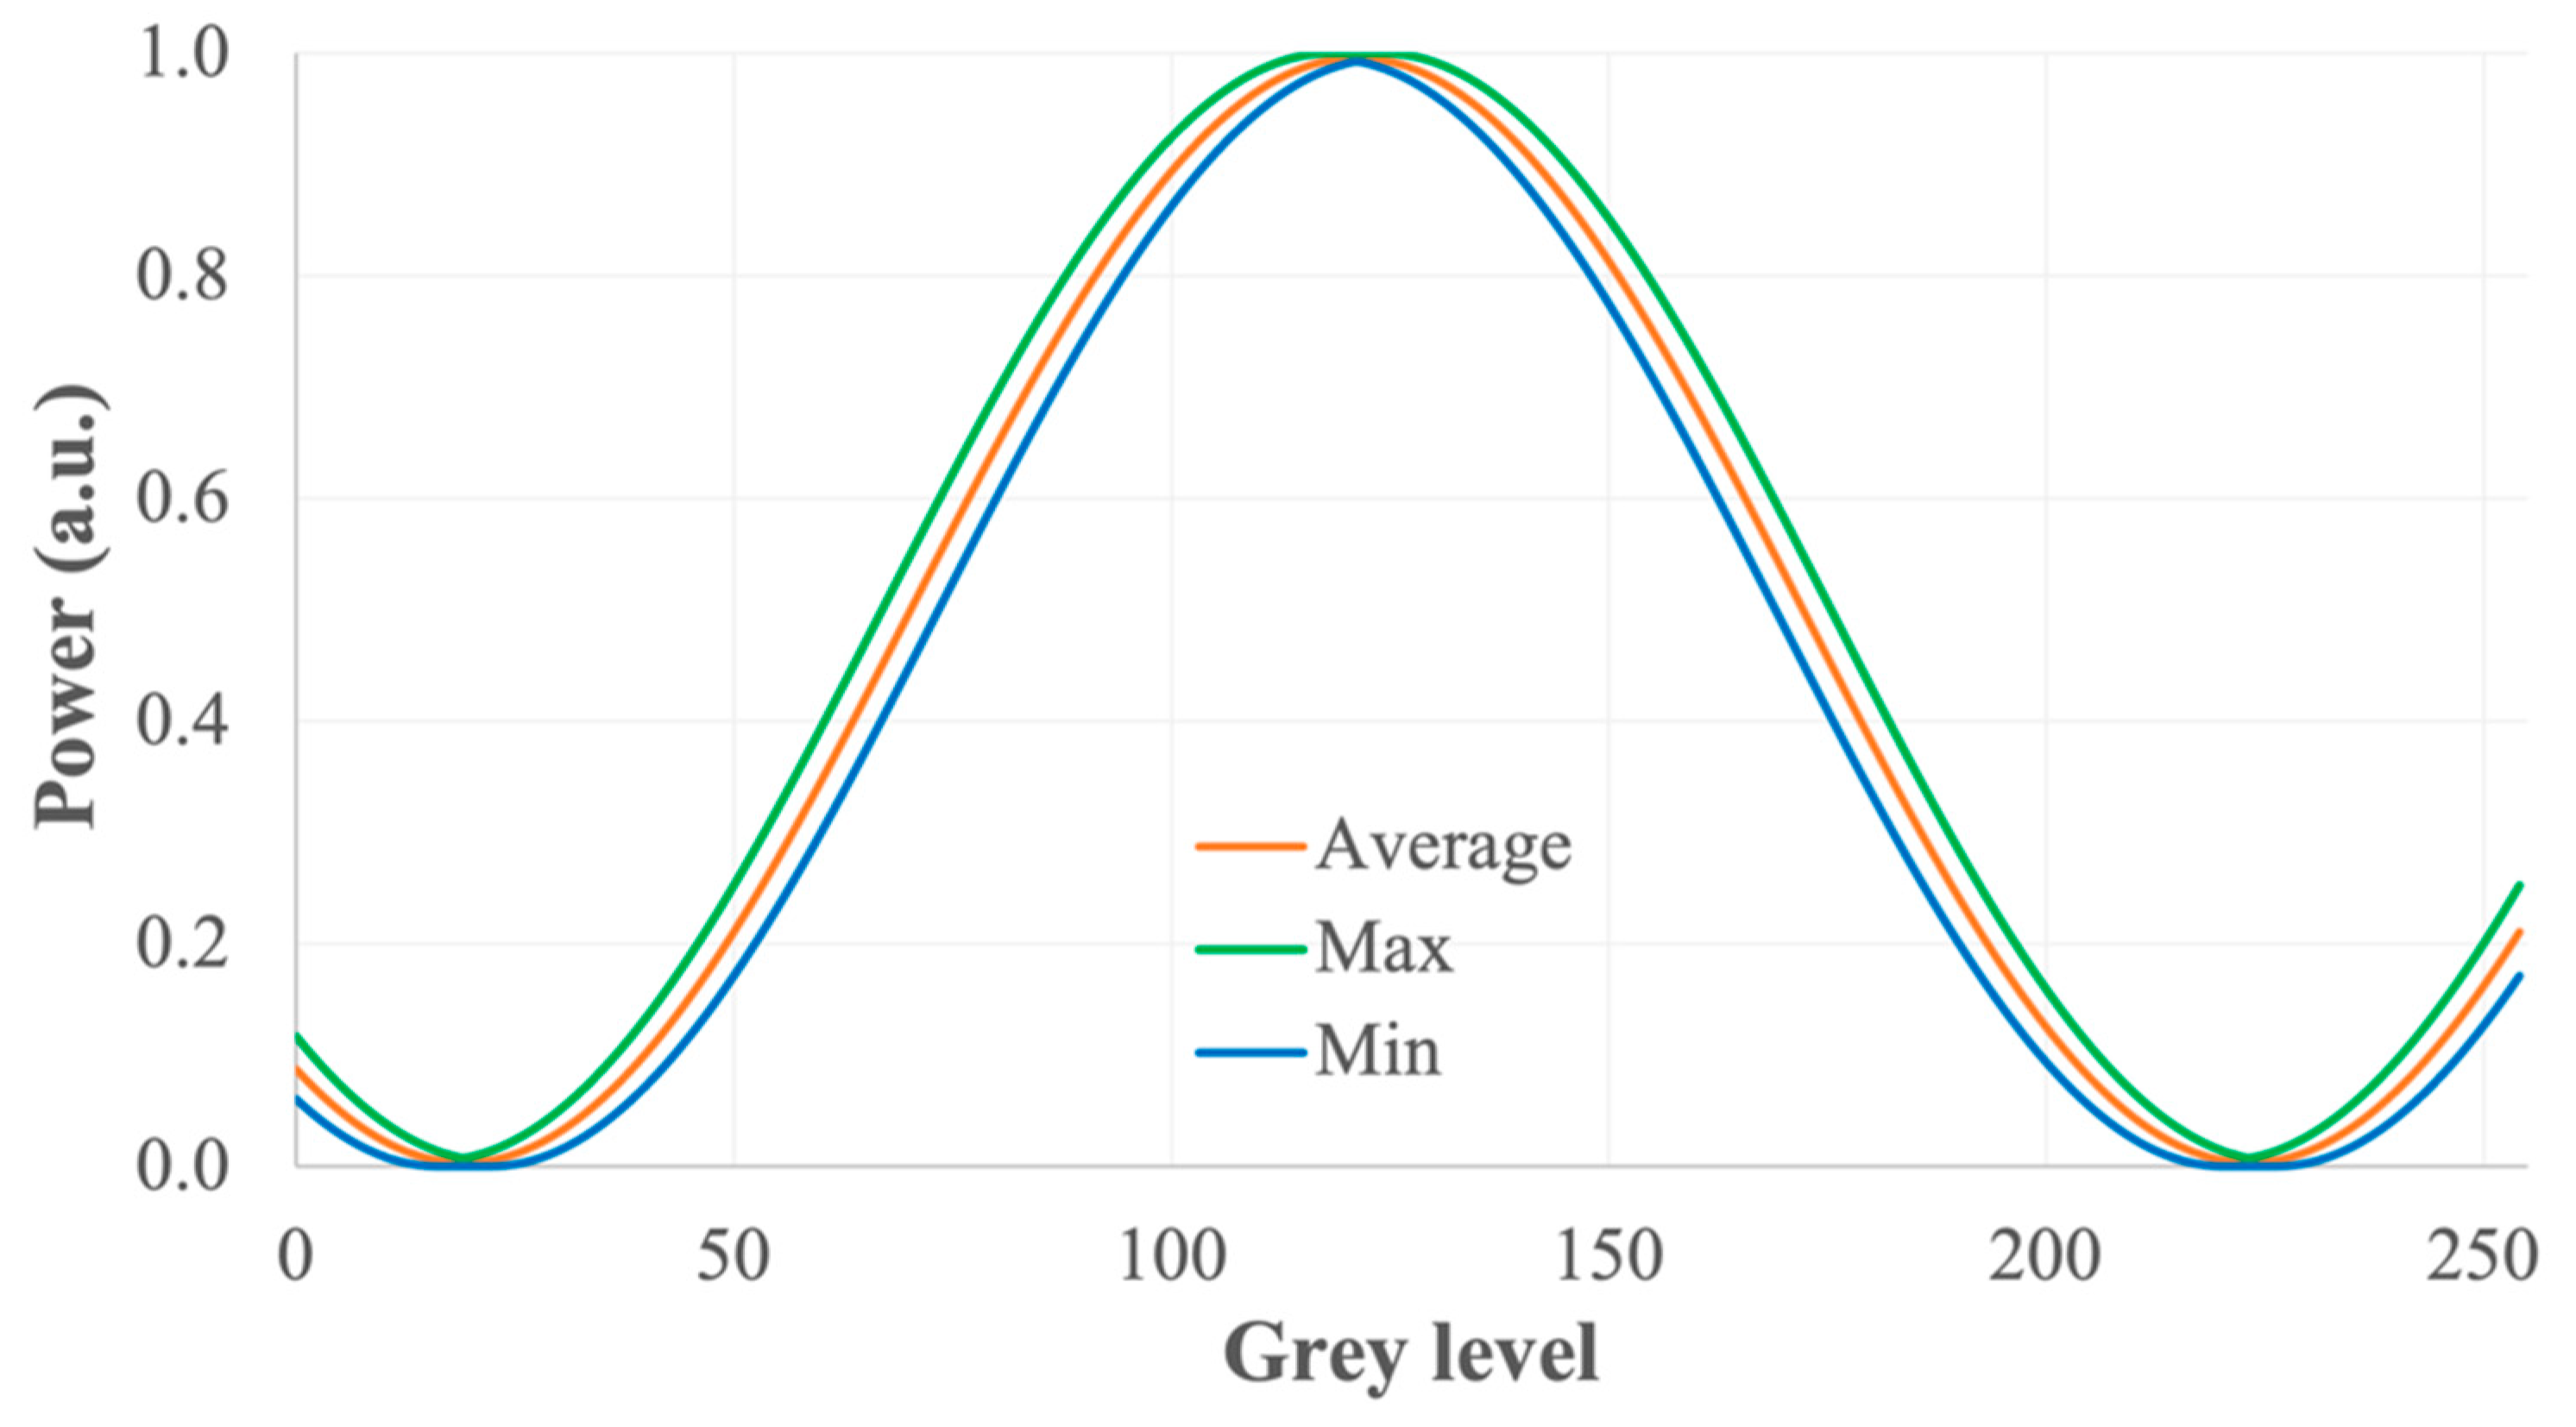
First, we assumed that the characterisation system is without any noise and the LCOS device had a peak-to-peak flicker of 0.06 π for all the phase levels. The light intensity at the photodiode detector was simulated.
Figure 2 showed the maximum, minimum and average intensity measured by the photodiode circuit at each grey level. In this simulation, the value of
was set arbitrarily at 0.16π. In practice, the value of
depends on the liquid crystal cell thickness of the LCOS device and the birefringence of the liquid crystal material. This would not affect the analysis and the conclusion described in the below.
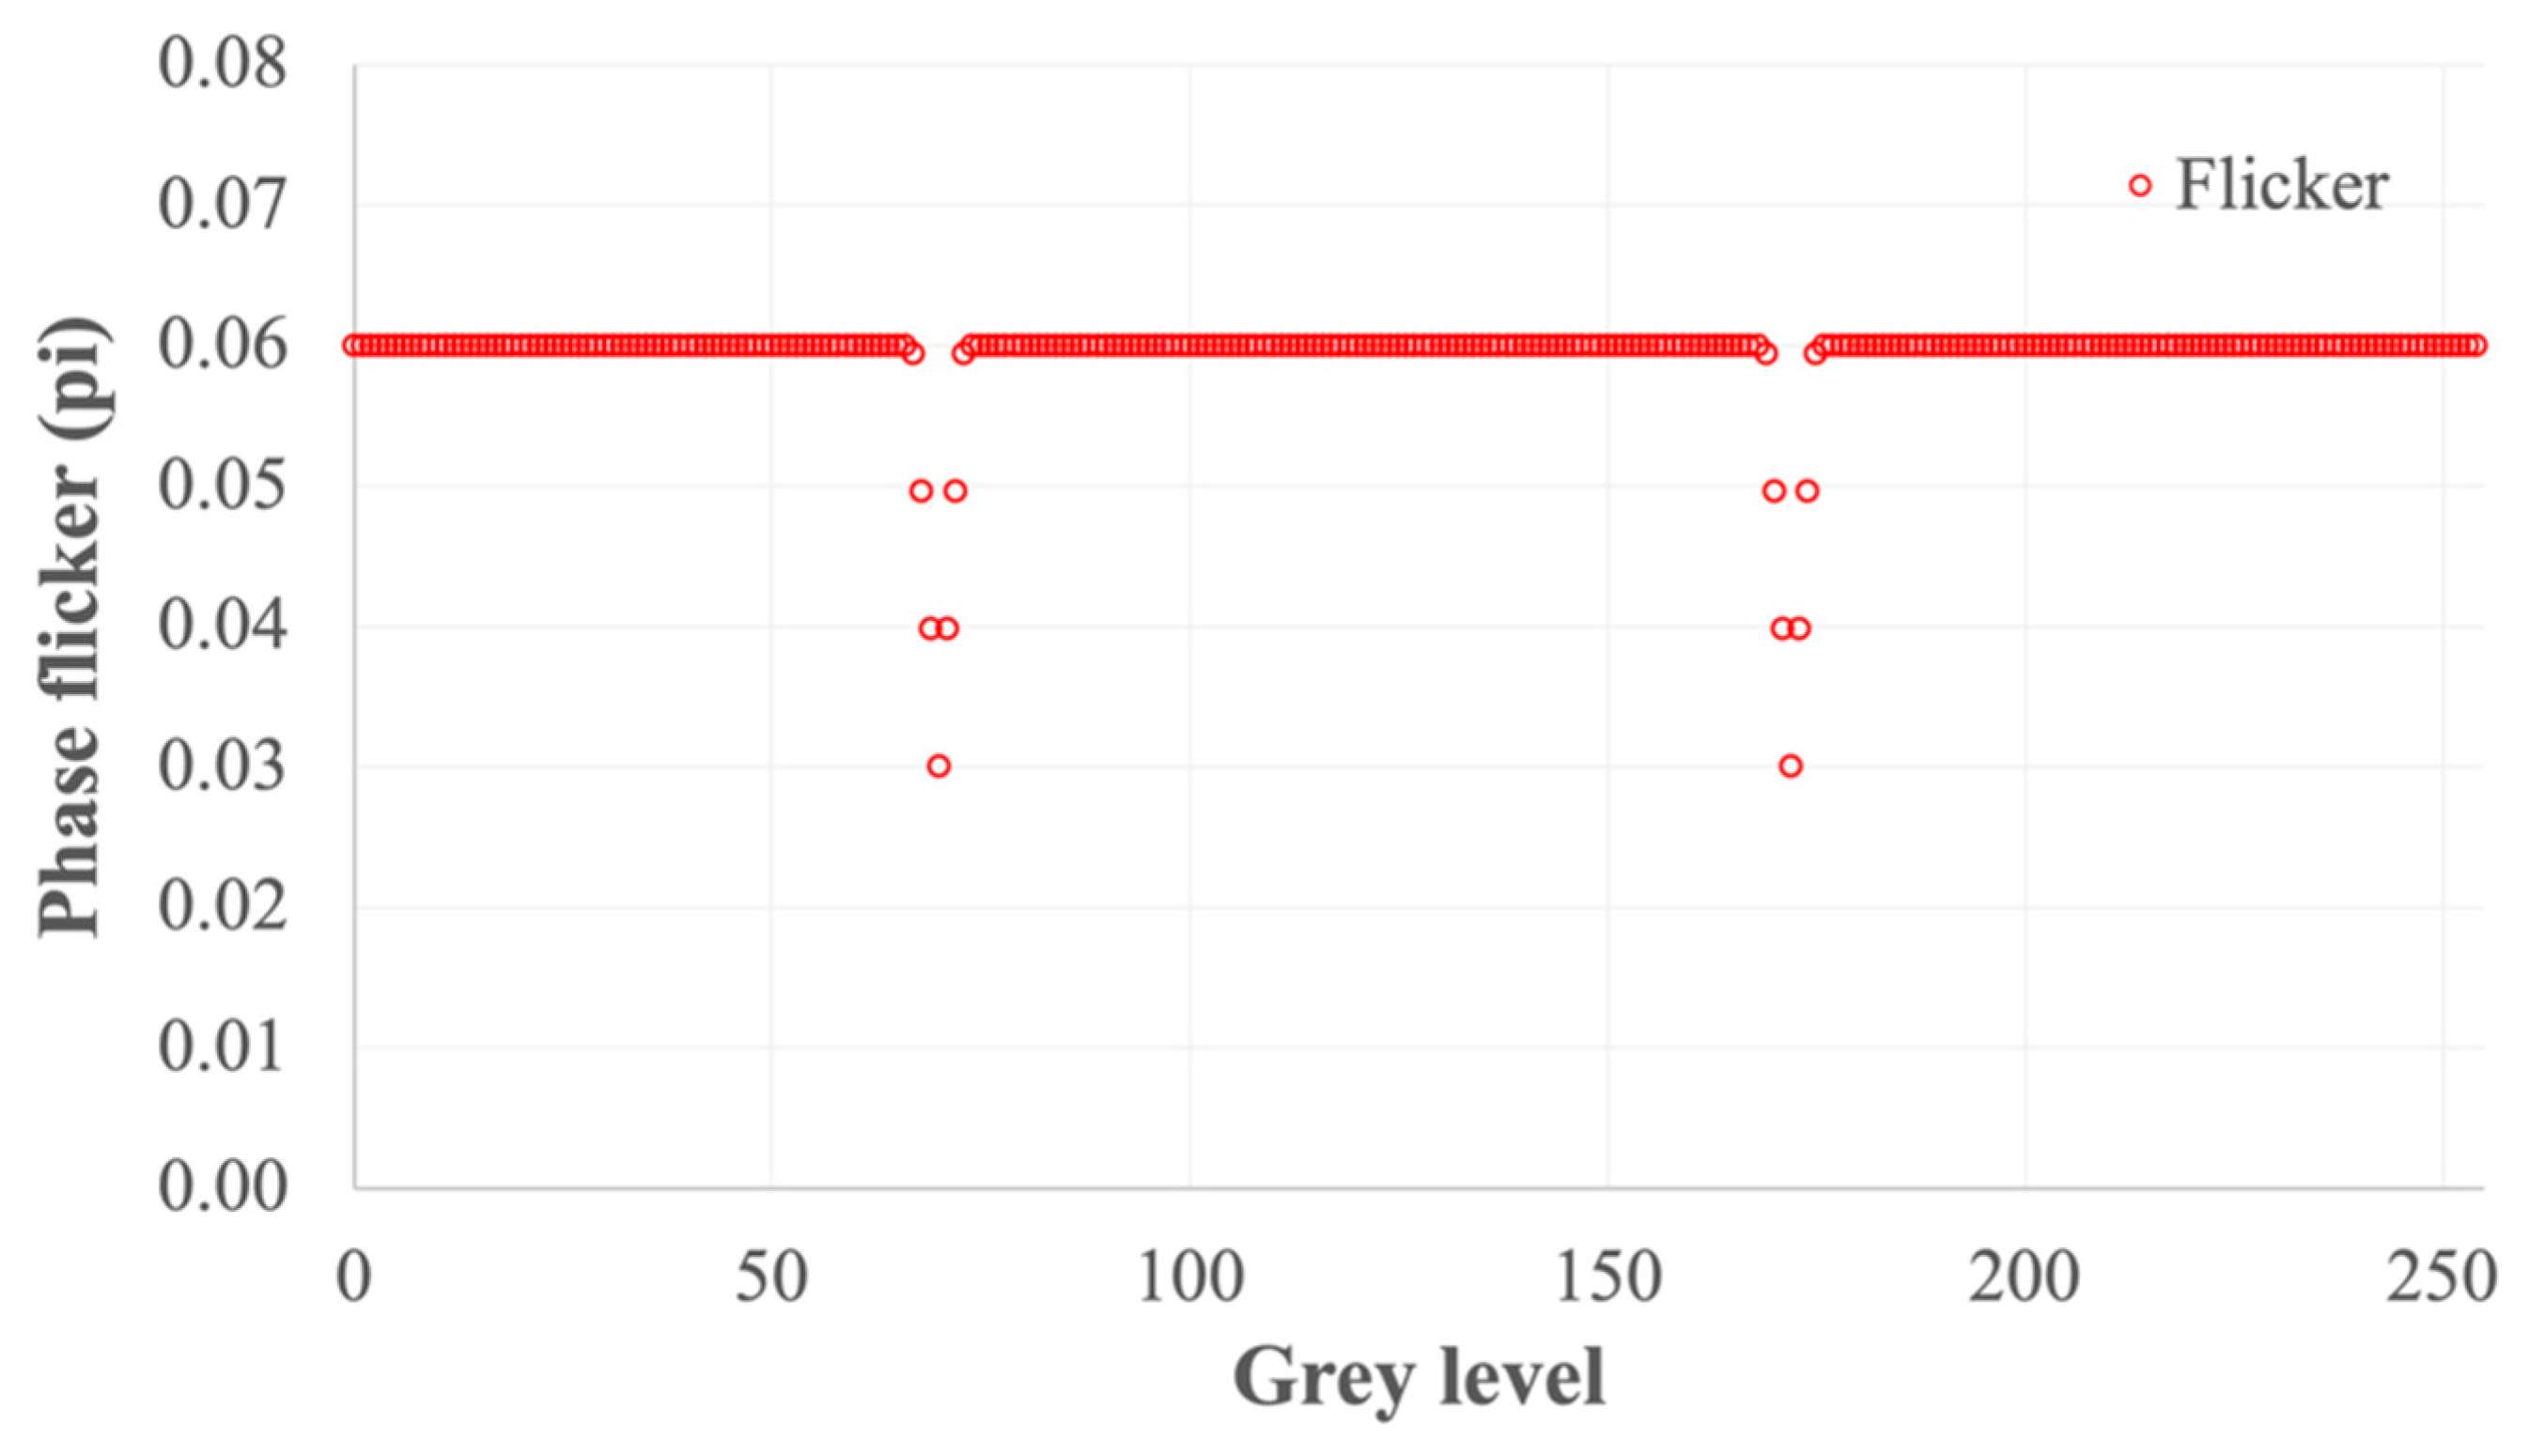
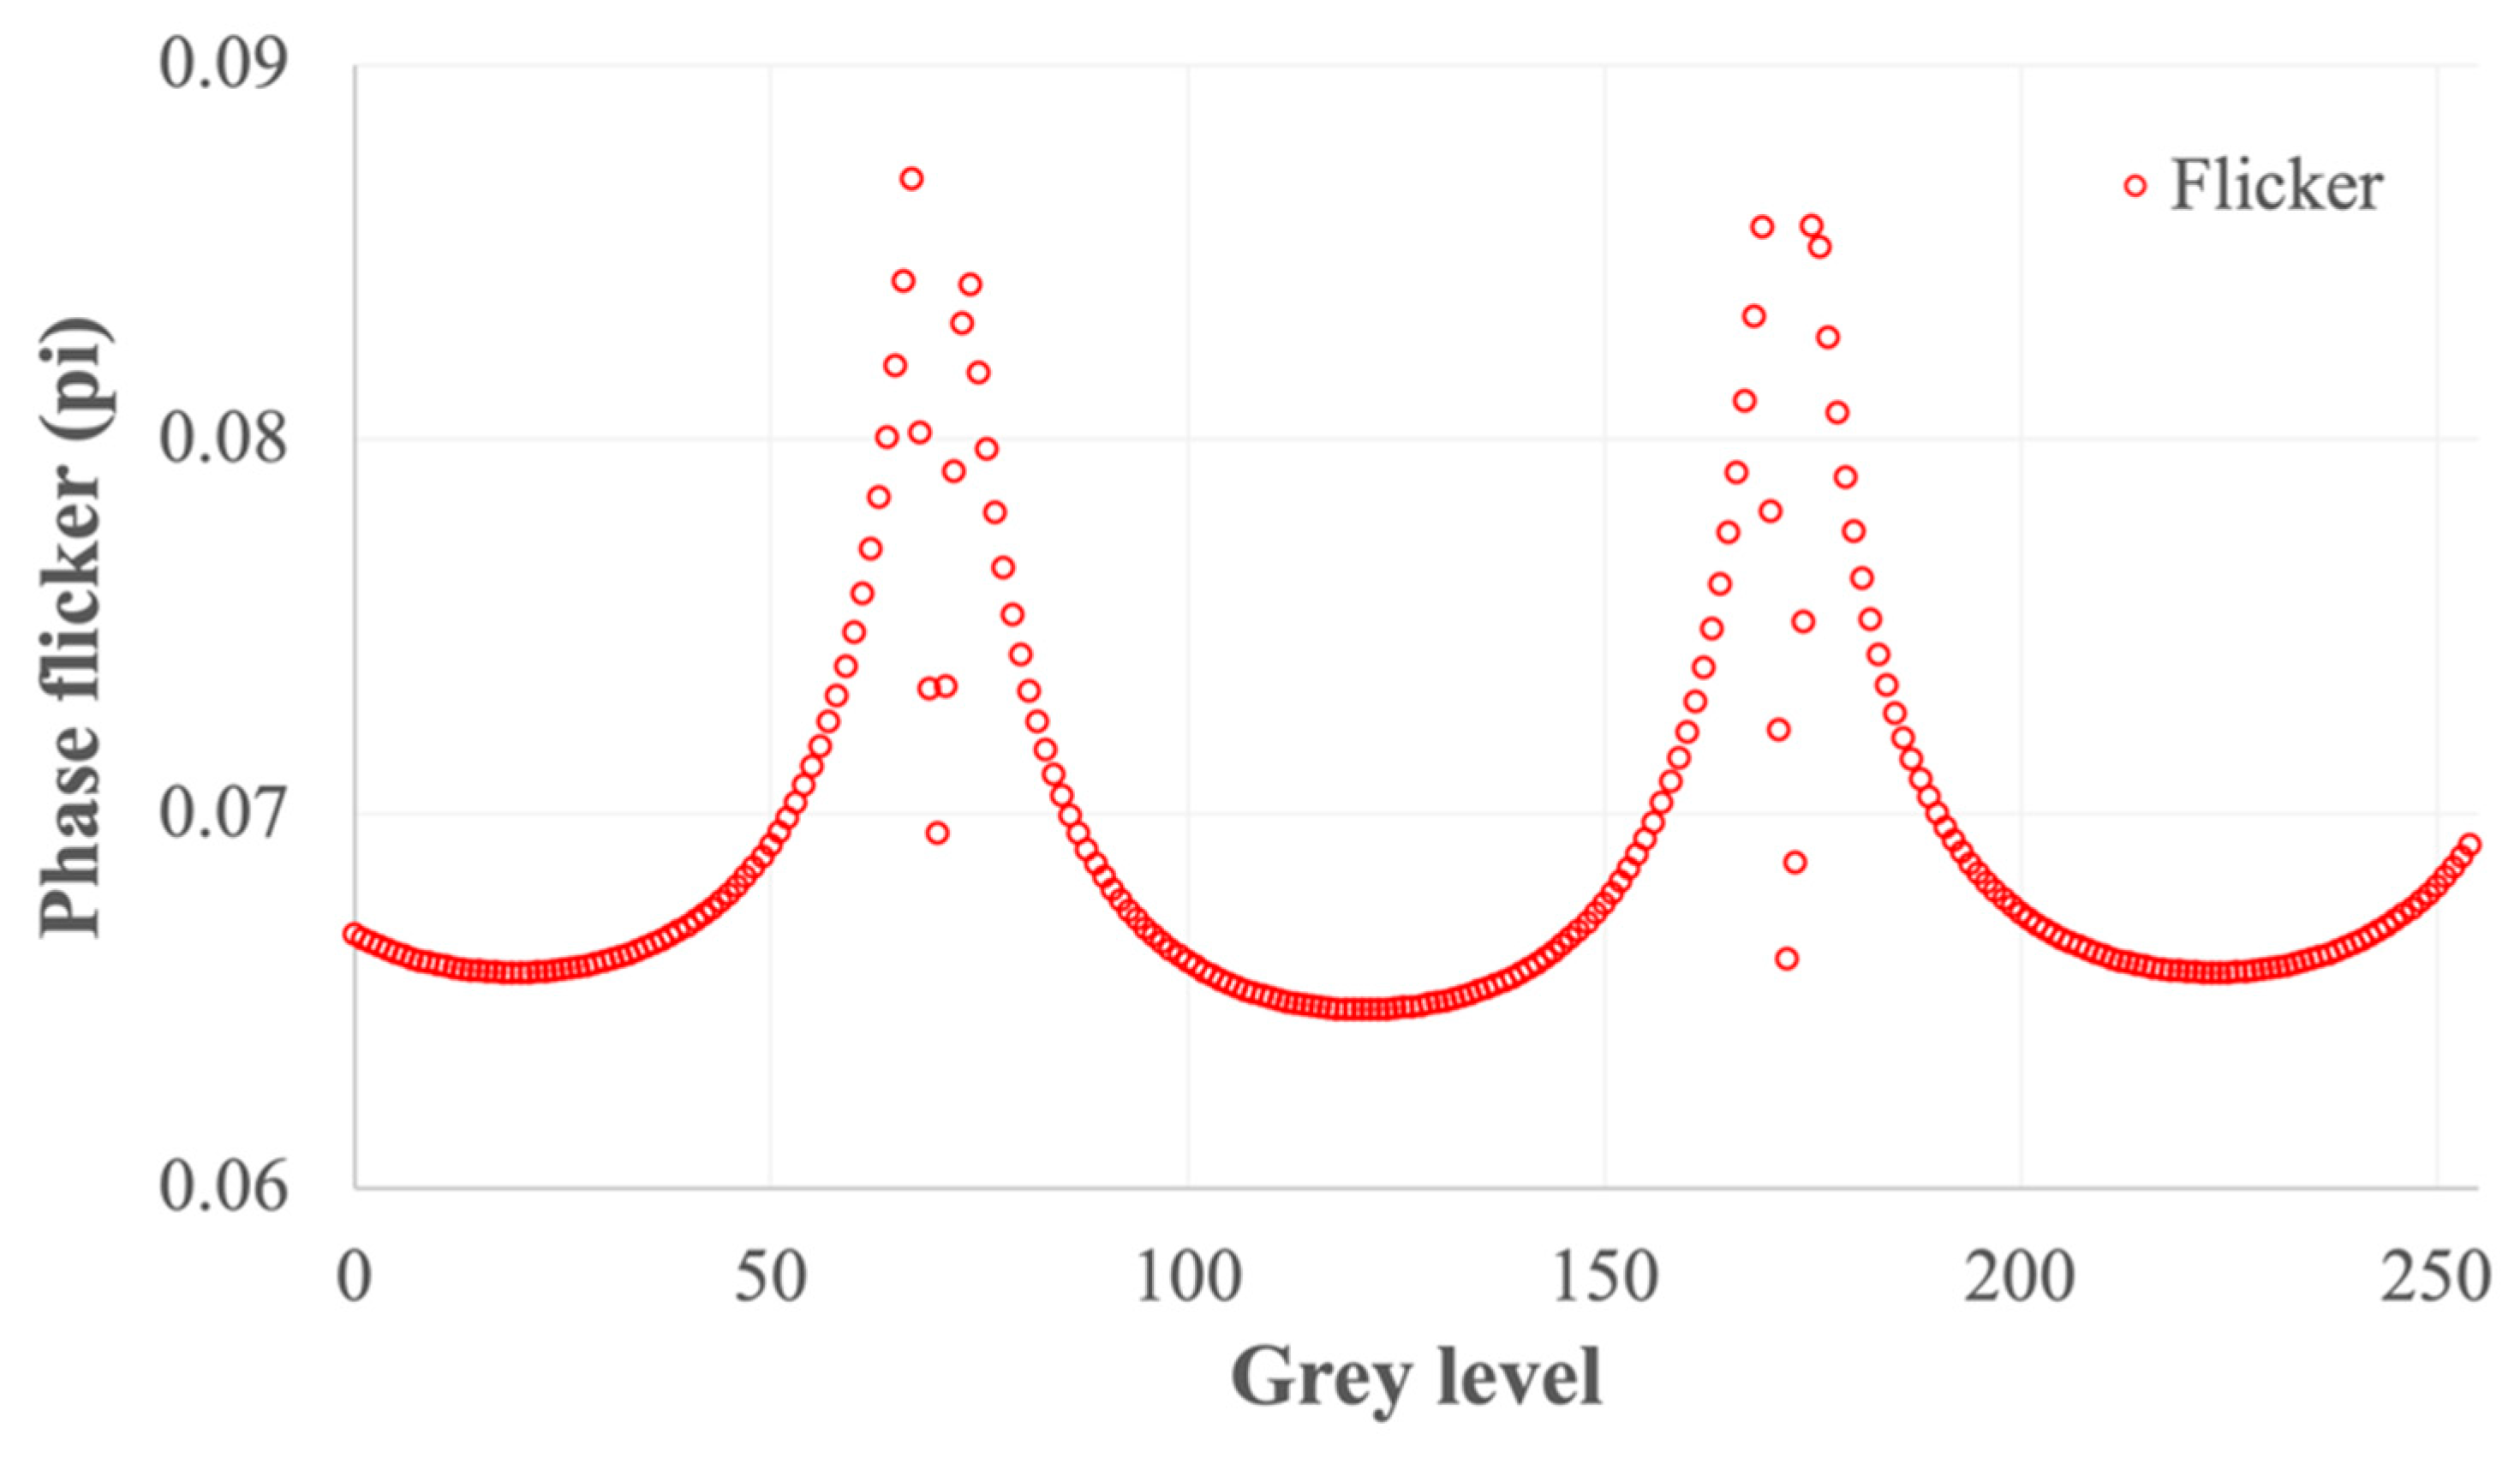
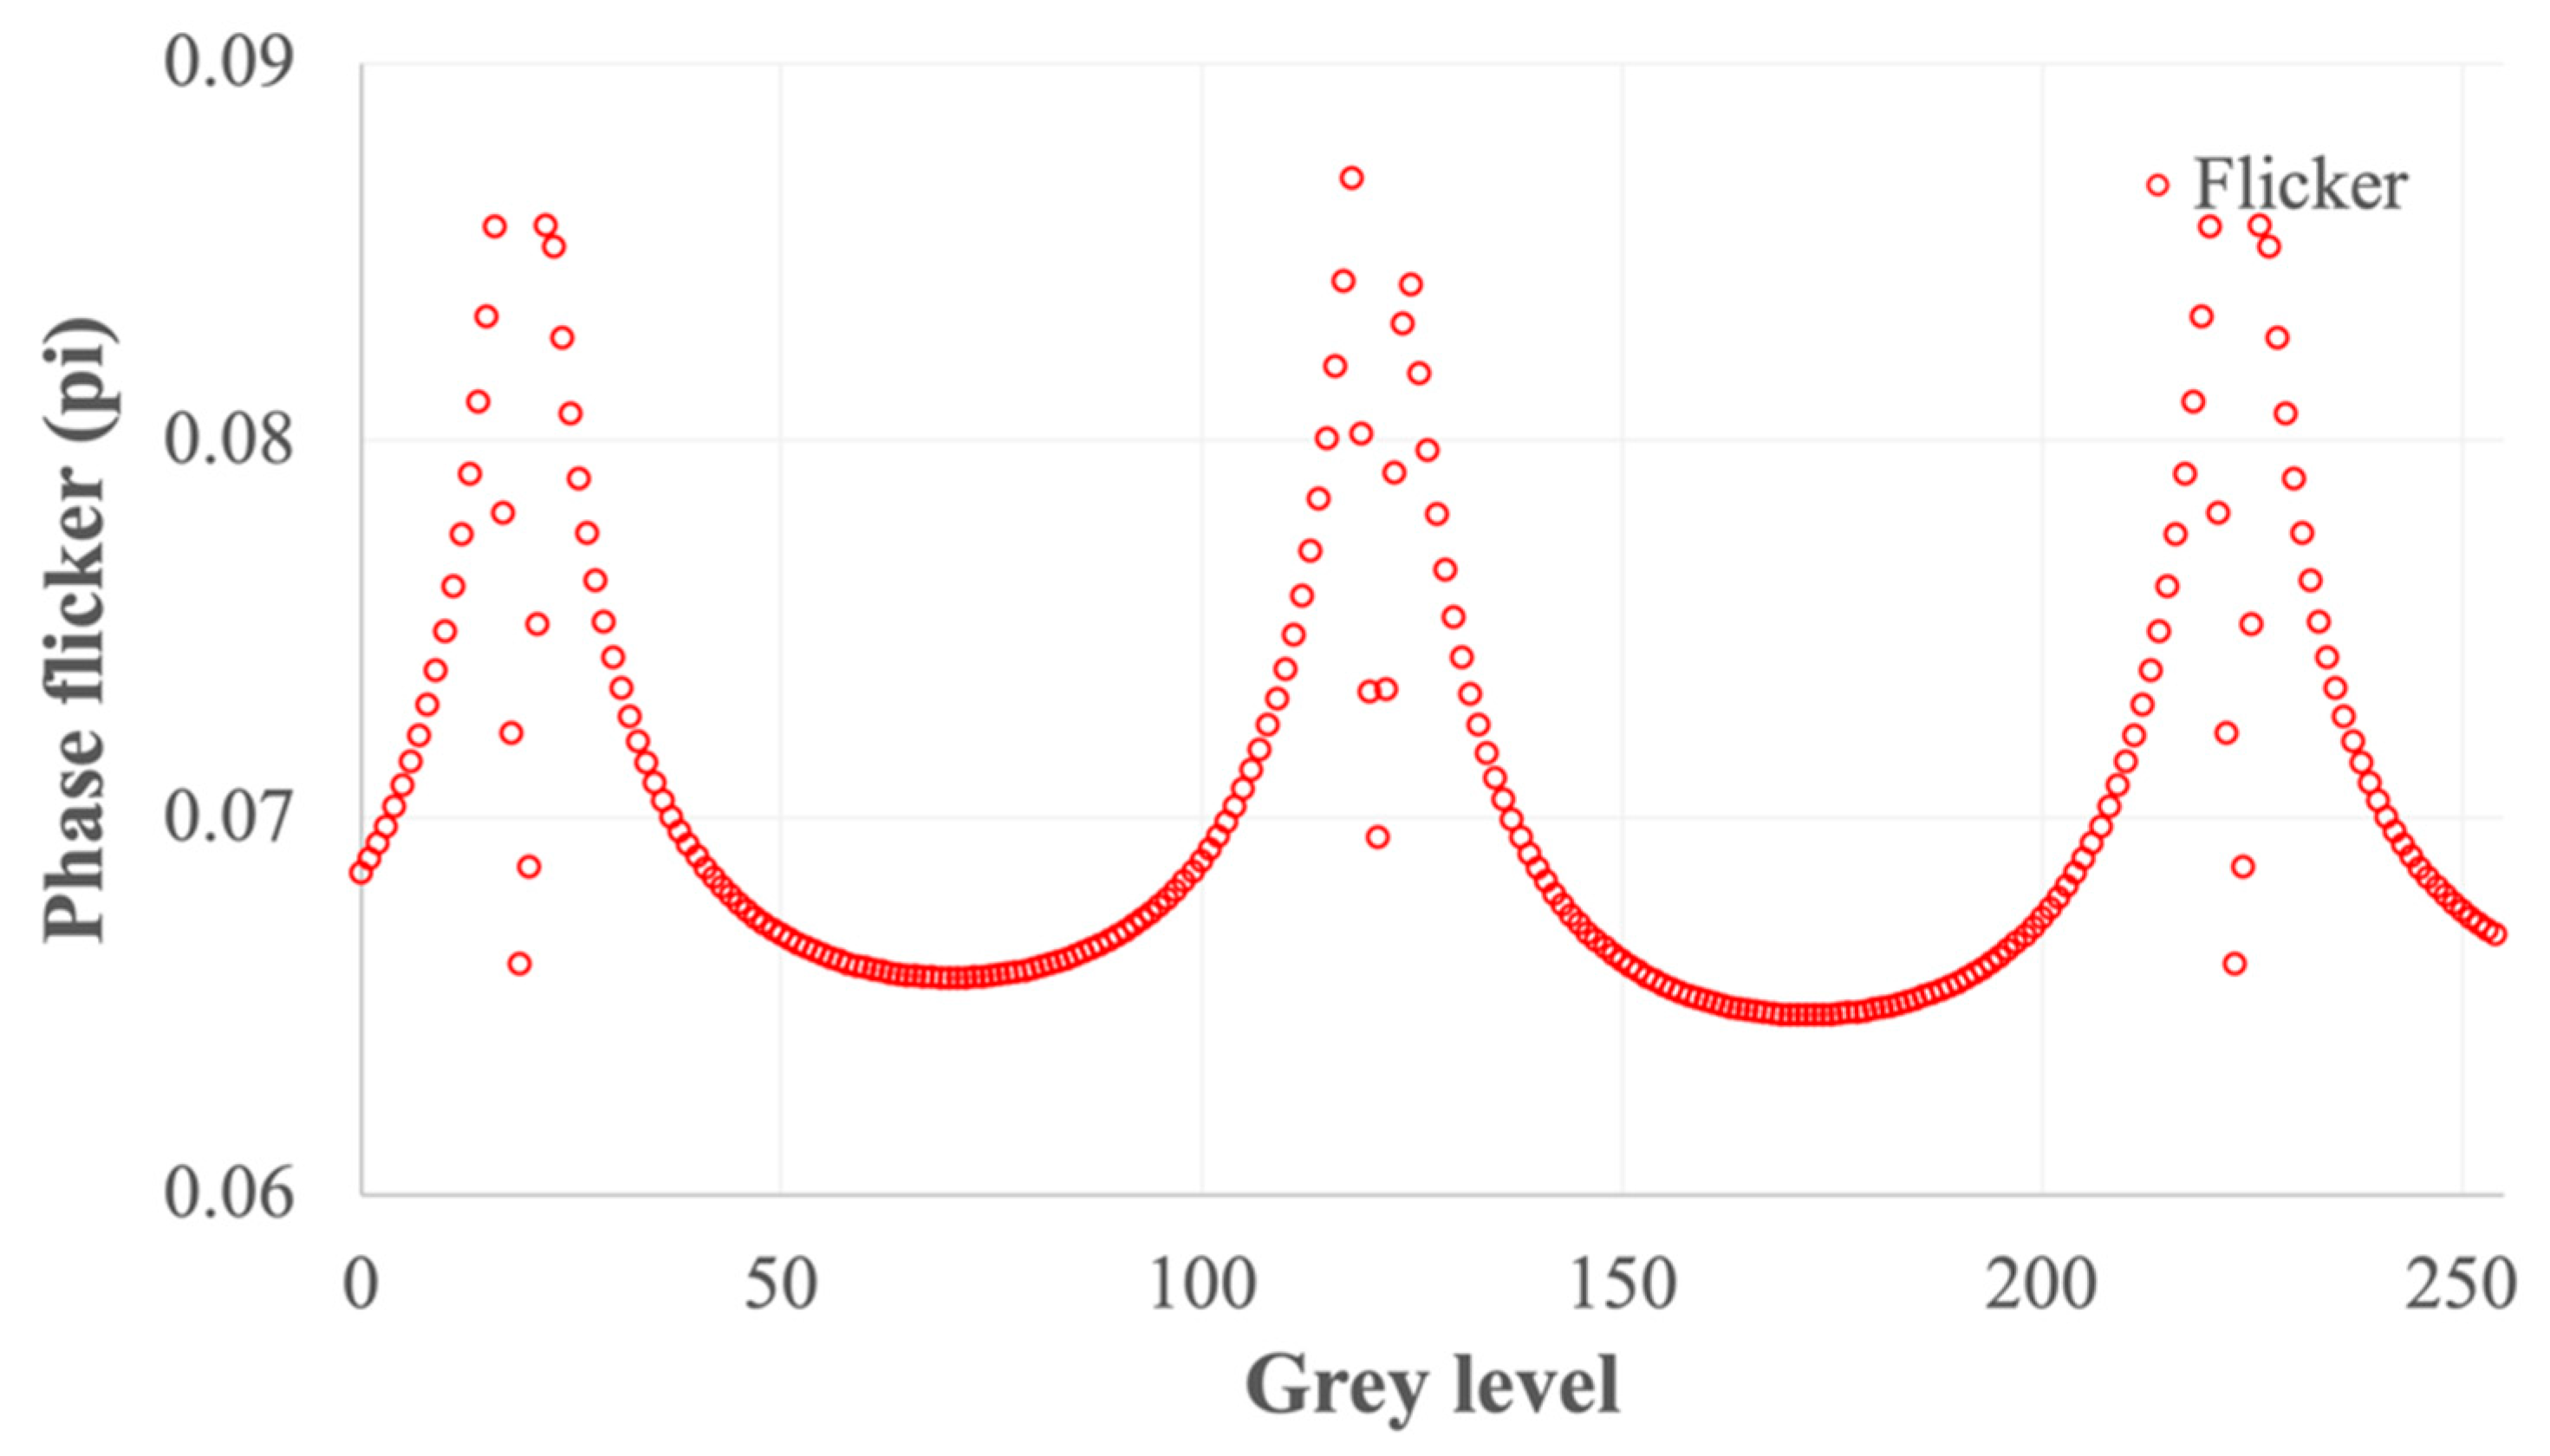
Subsequently, the phase flicker at each grey level was calculated based on the Equation (1). The results were presented in
Figure 3. For majority of the grey levels, the calculated phase flicker was consistent with the assumed value of 0.06 π. However, the calculated flicker was smaller than it should be around the grey level of 70 and 172. These regions also correspond to turning points of the intensity response shown in
Figure 2. In those regions, the relationship between the phase level and detected light intensity was not monotonic. This would bring certain degree of uncertainty in the calculation.
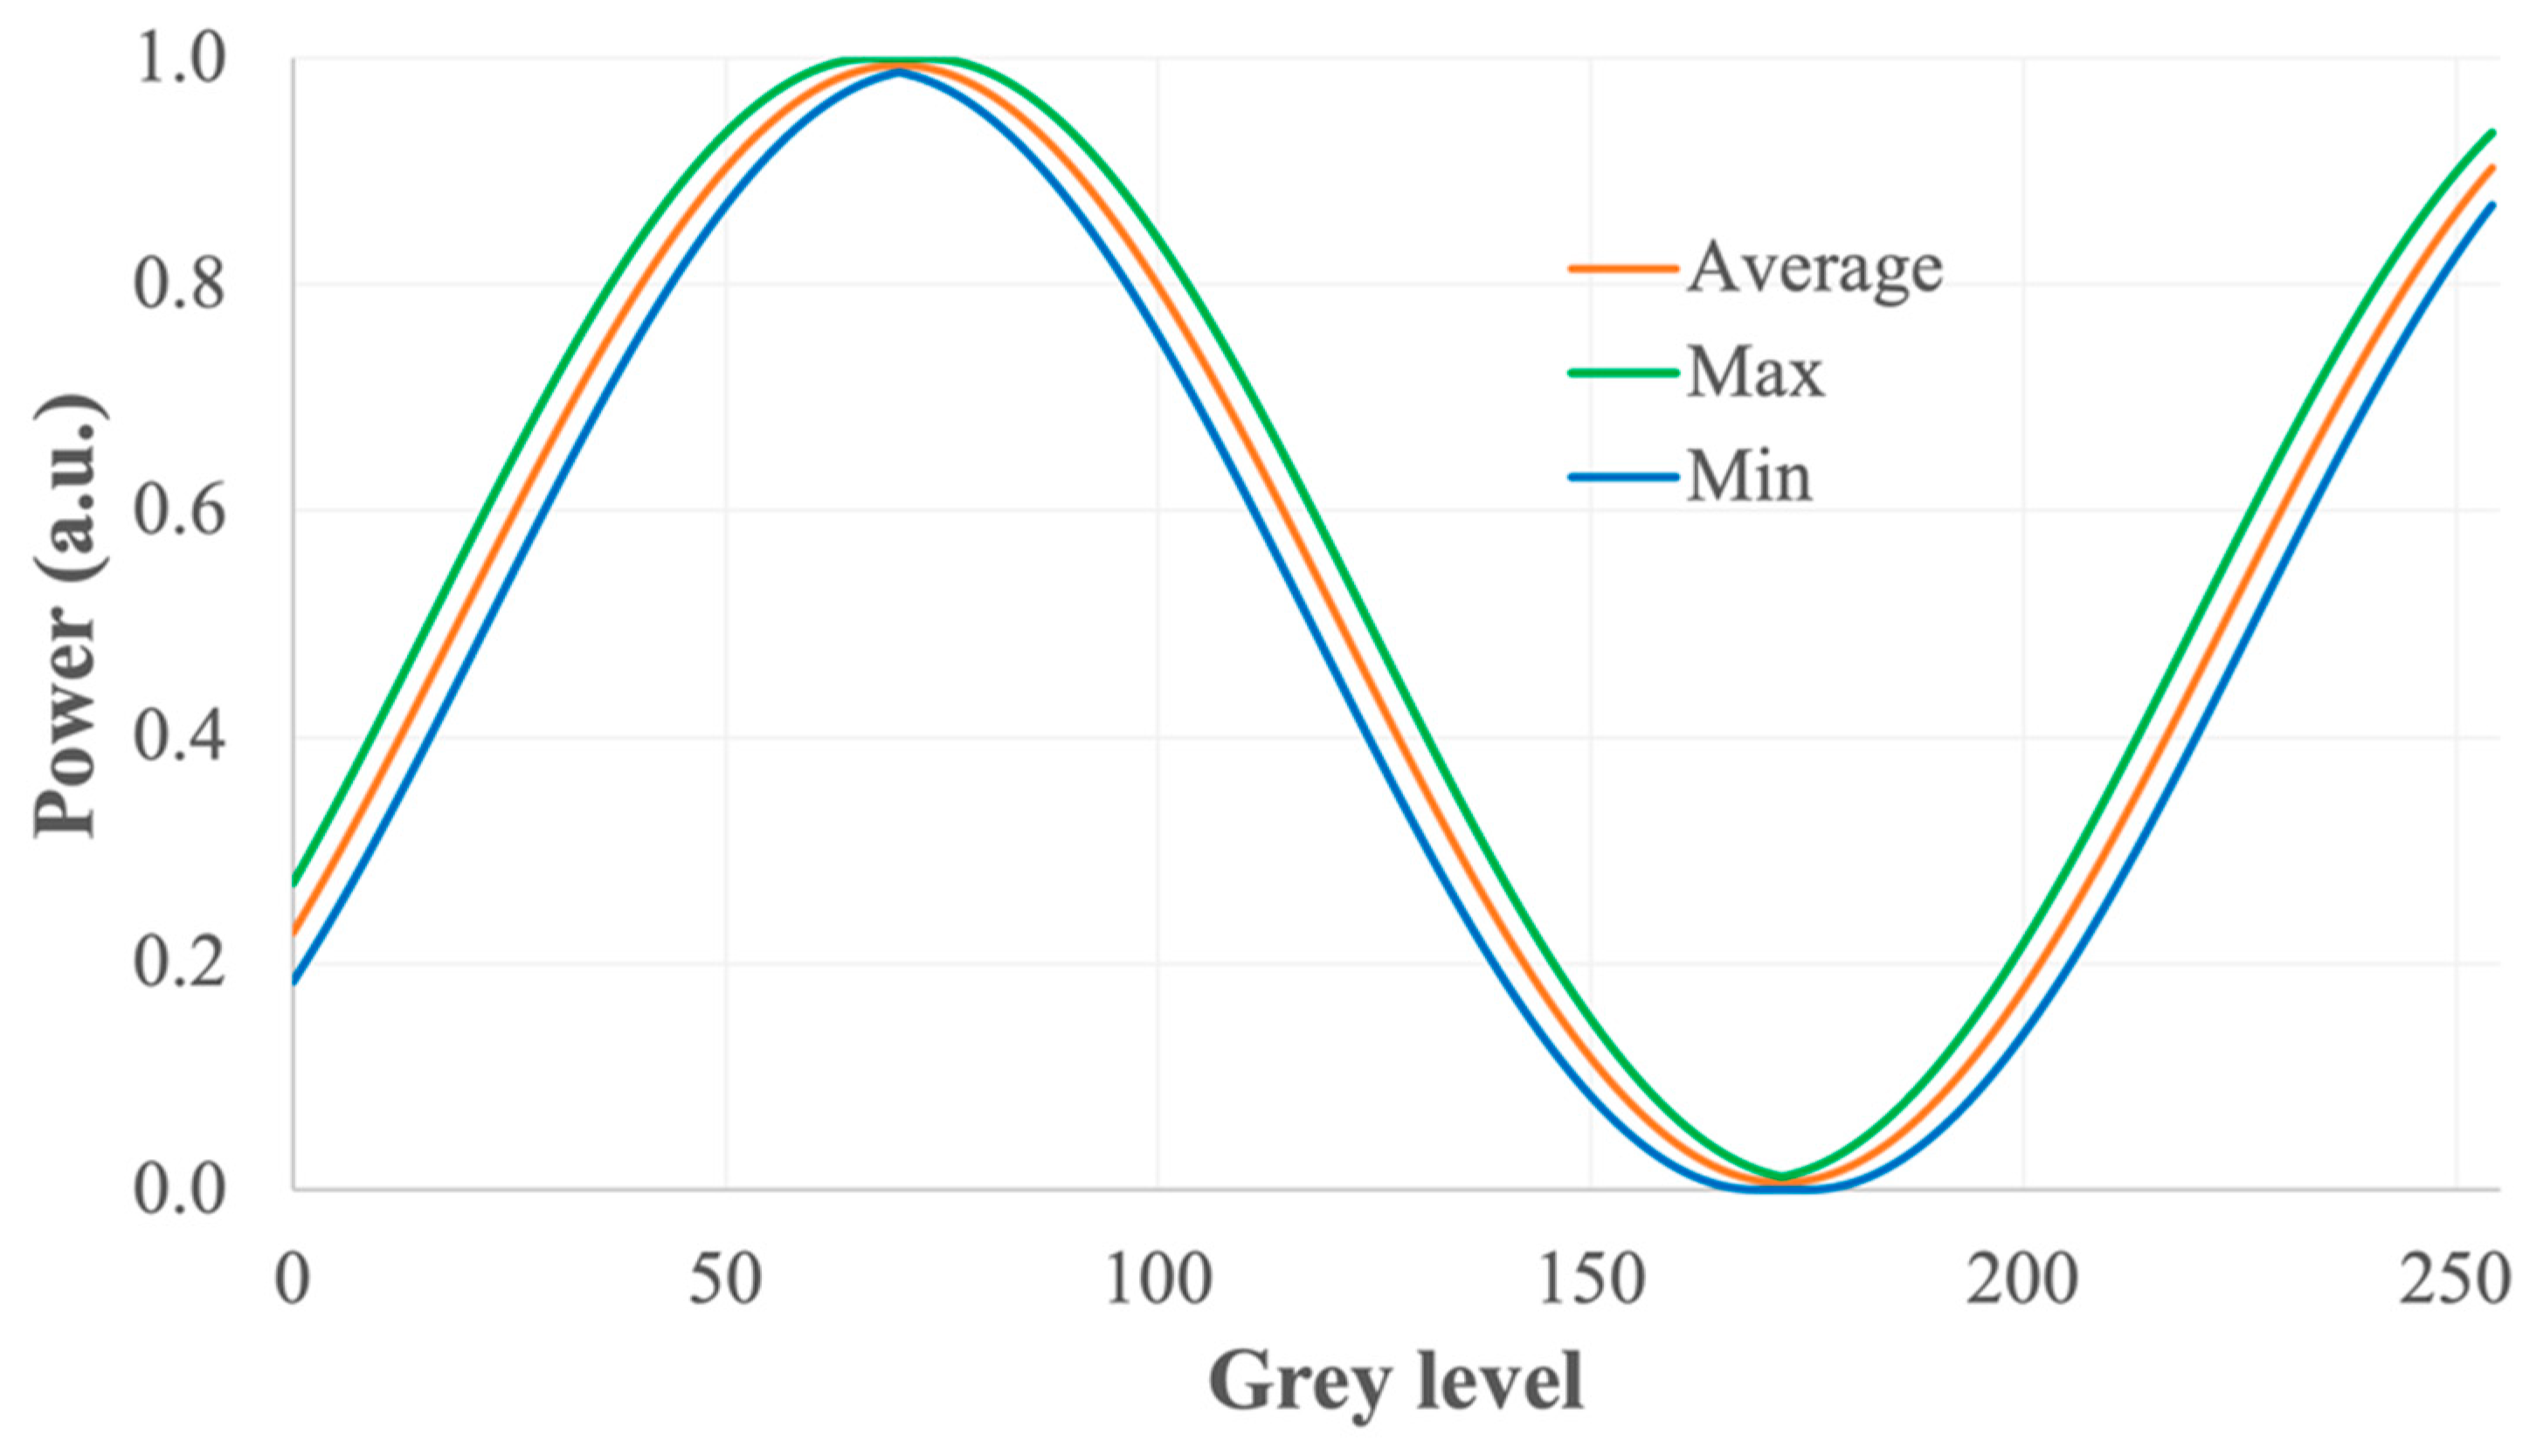
In the following simulation, the impact of the characterisation system noise was considered. First, the noise was assumed to be only 0.5% of the maximum power level detected.
Figure 4 shows the maximum and minimum intensity detected at each grey level, which looked very similar to the results shown in
Figure 2. The calculated phase flicker is shown in
Figure 5 for all the phase levels. The level of the flicker was elevated for all the phase levels. This is expected due to the contribution of the characterisation system noise. However, the calculated phase flickers were raised to ~0.9 π for the regions corresponding to the turning points in
Figure 4. An extremely low level of noise within the characterisation system led to a ~50% measurement error in this case.
In order to further analyse the impact of characterisation system noise, we repeated the simulation process described in the above with different configurations. In these simulations, the actual phase flicker of the LCOS device ranged from 0.02 to 0.1 π. The noise of the characterisation systems ranged from 0% to 3% of the maximum intensity detected by the photodiode circuit. The calculated worst-case phase flicker under each configuration was shown in
Table 1. It can be seen that the noise within the characterisation system was able to elevate the calculated phase flicker significantly. In some extreme cases, the calculated phase flicker was ~7 times higher than the actual phase flicker. The largest calculation errors occurred at the phase levels close to the turning points of the detected intensity curves. These results indicated that an accurate characterisation on the phase flicker required a detector with extremely low level of temporal noise. On the other hand, the detector should also be fast enough to capture the flicker of the LCOS device. Therefore, a balance between the response speed and the noise level should be achieved.
4. Experimental Verification
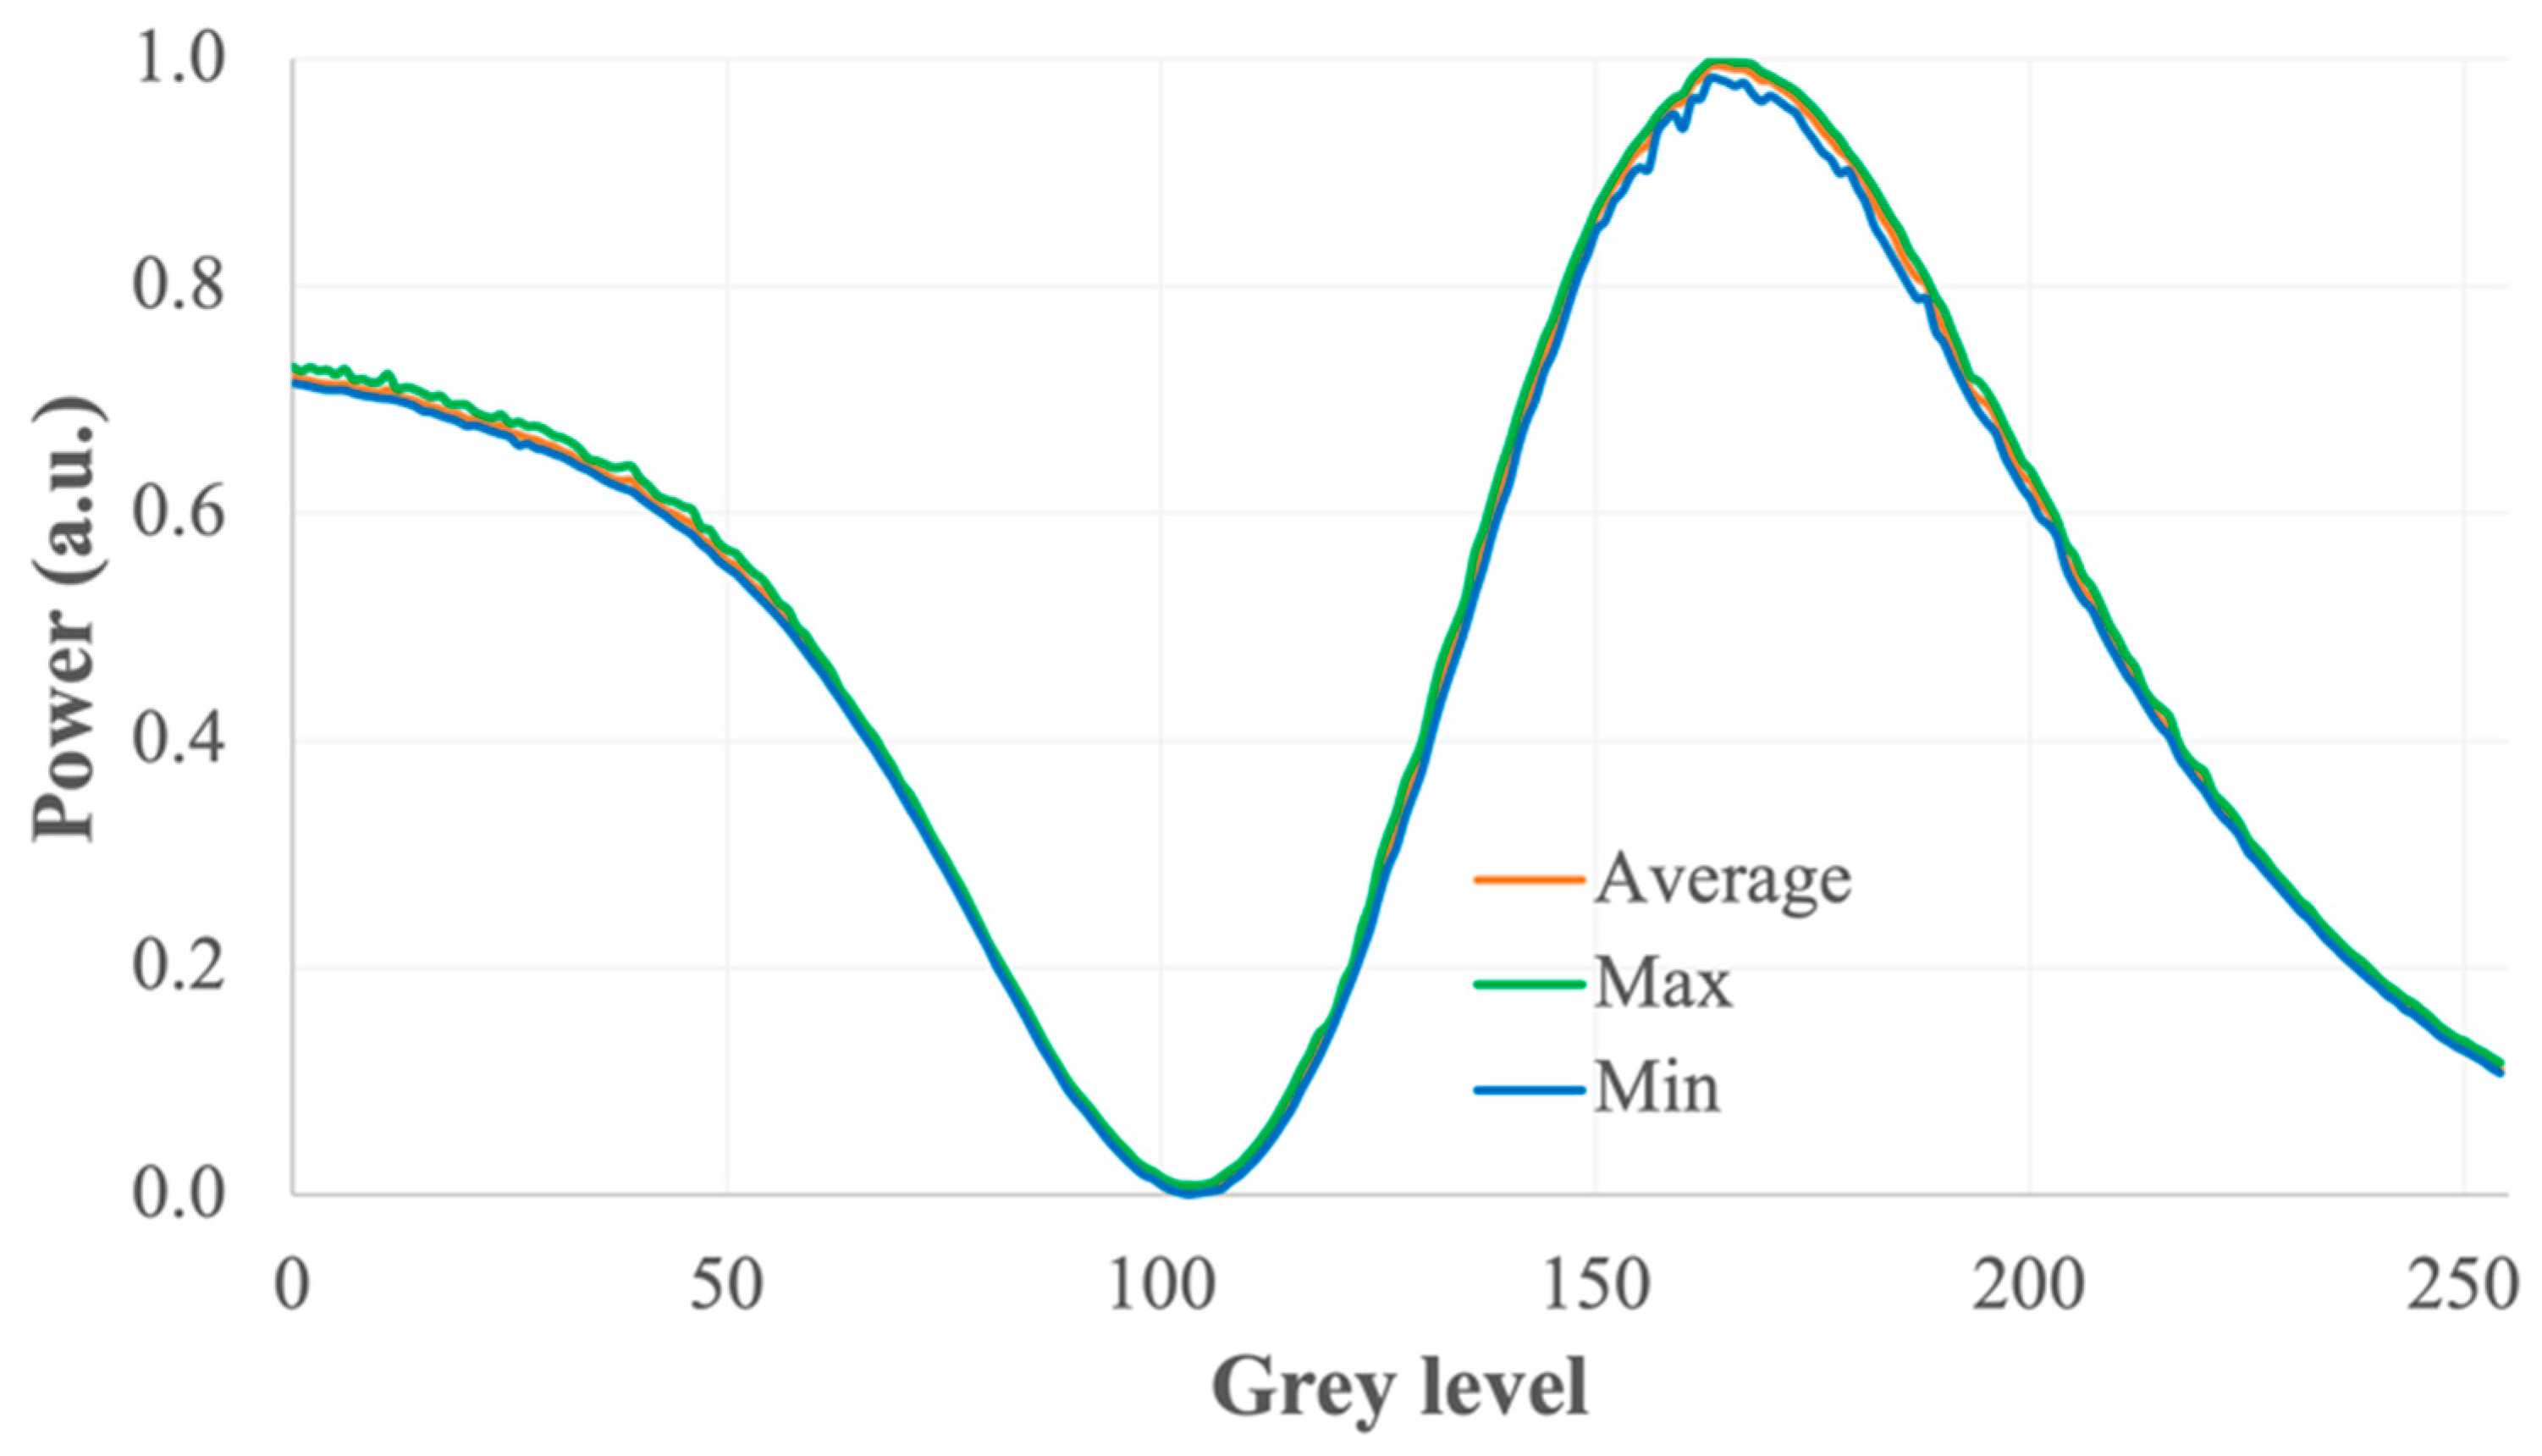
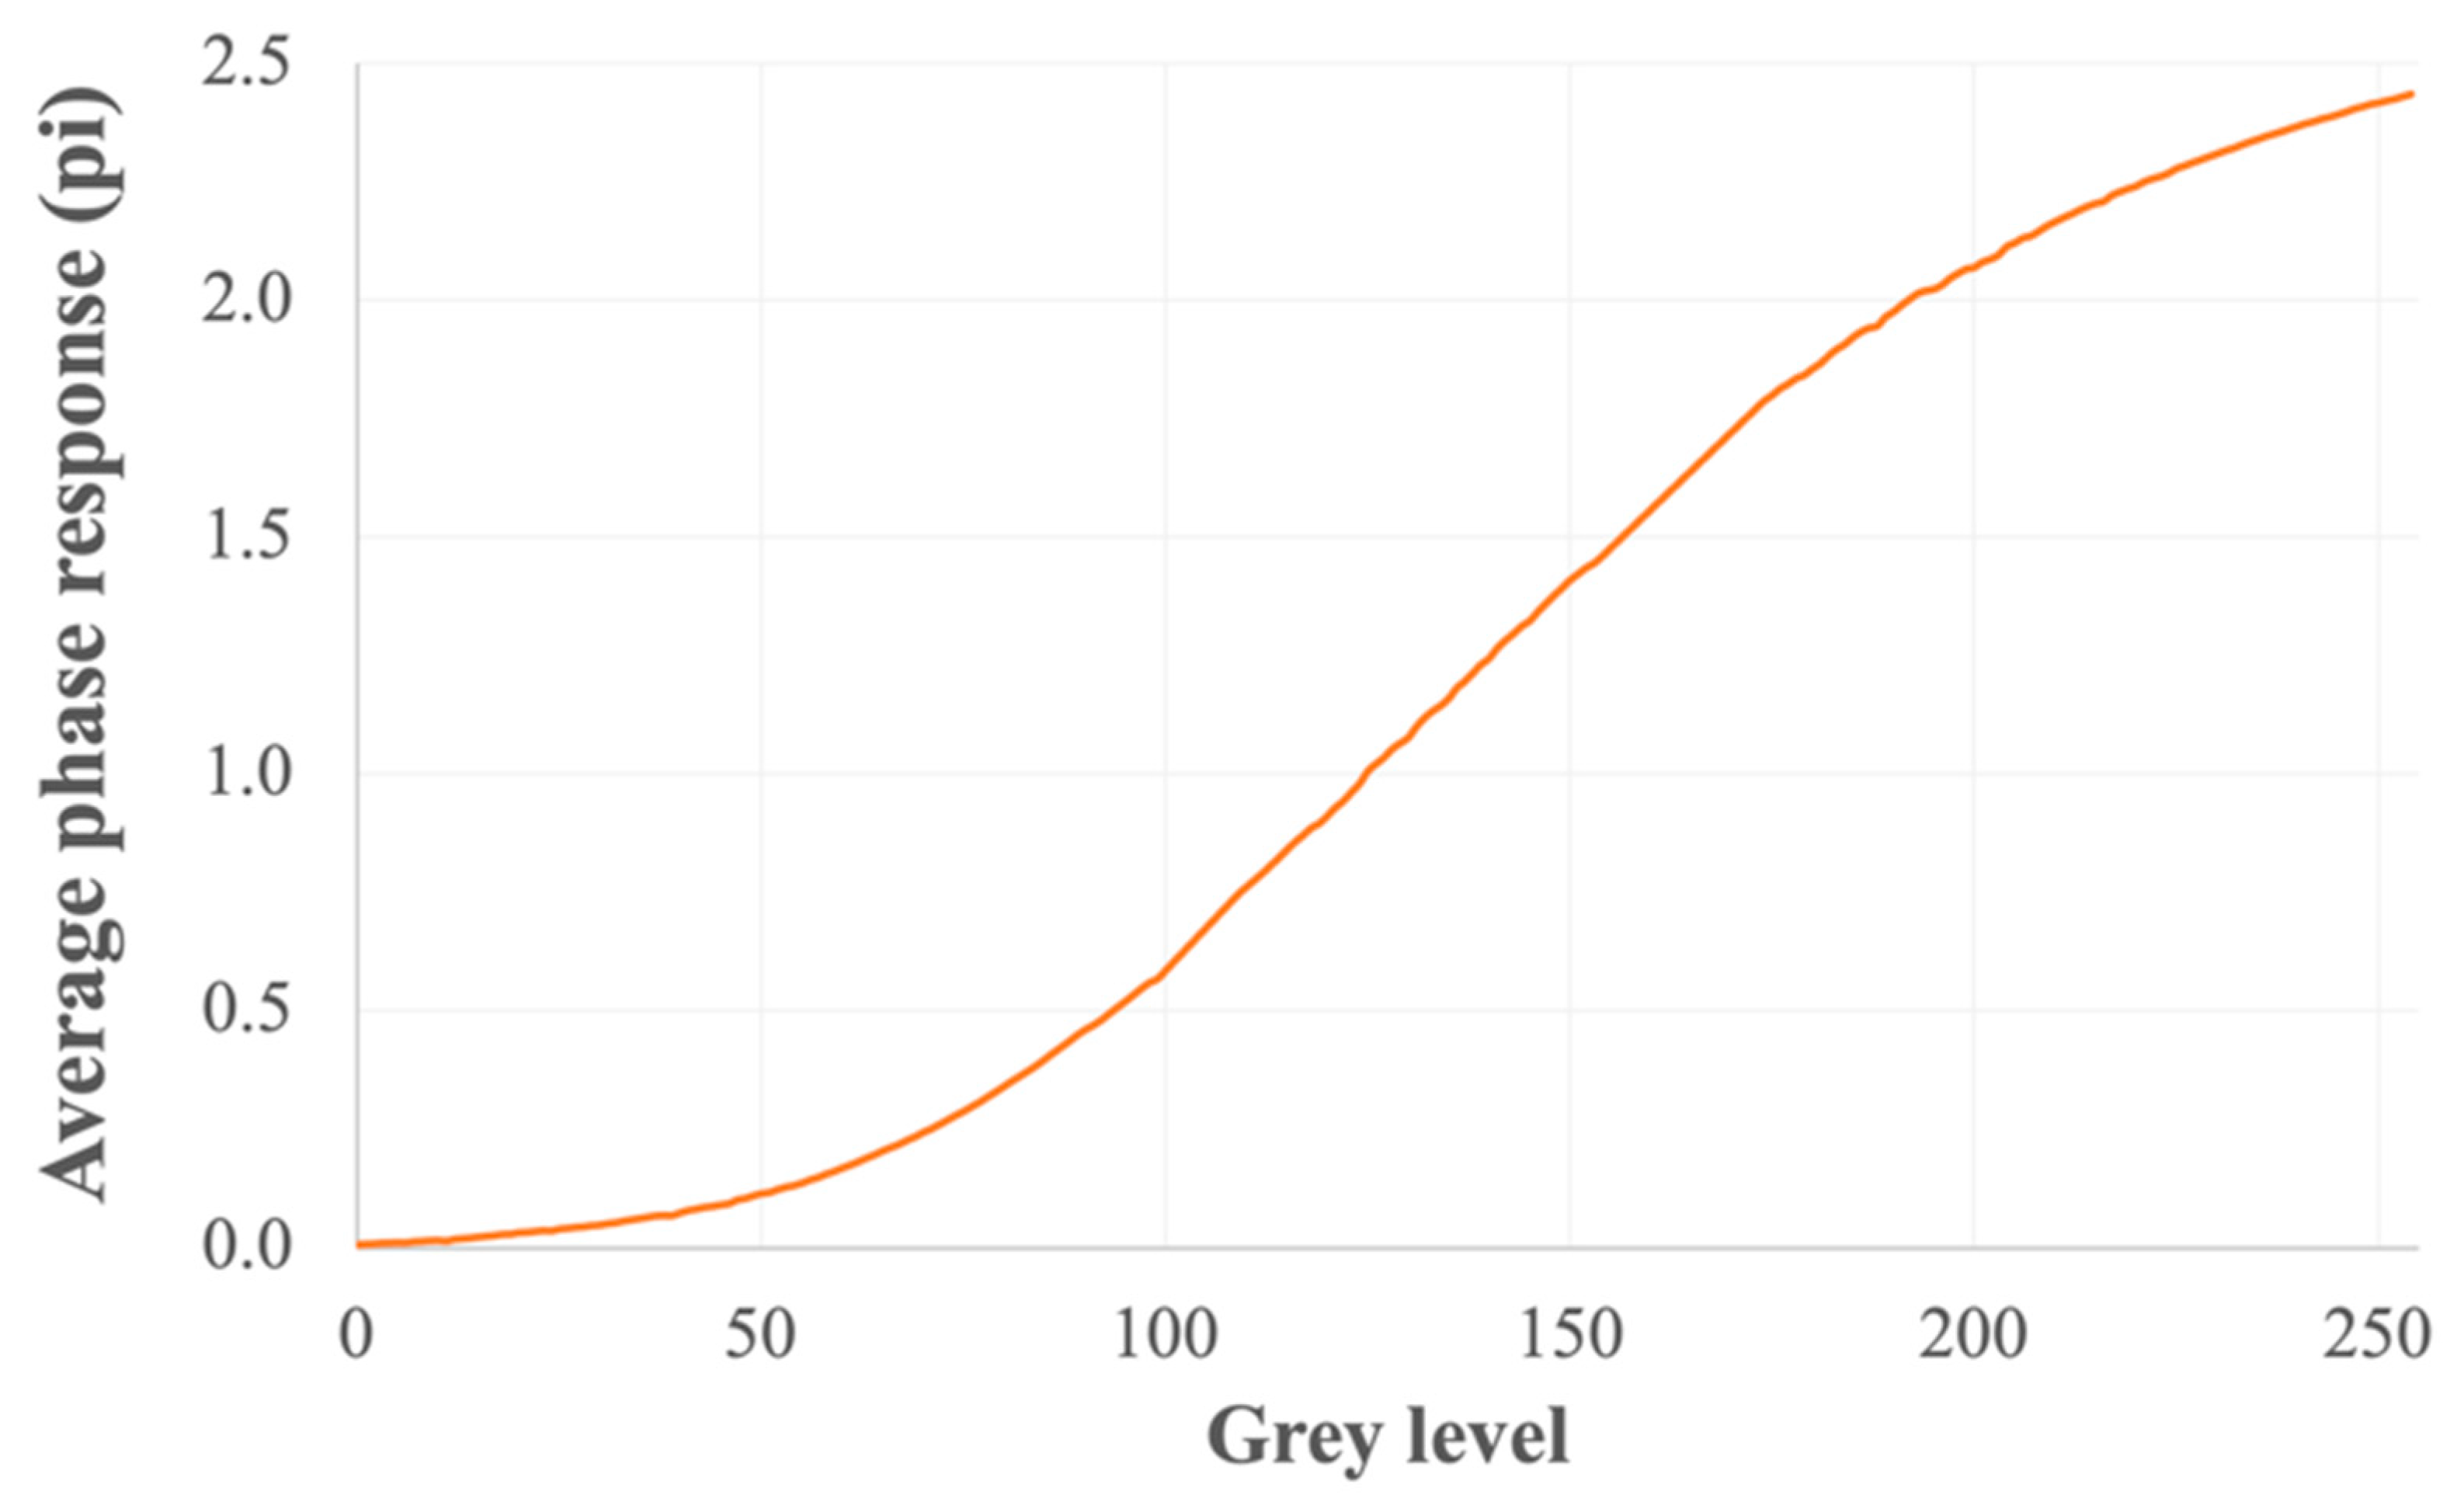
Experimental verification was carried out in this work. An LCOS device with a resolution of 1920 × 1200 and a pixel size of 8 µm was used in our experiment. The driving scheme for this LCOS device is analogue with a field inversion frequency of >1 kHz. As a result, this device exhibits a consistently low phase flicker for all the grey levels. This was similar to our simulation condition, in which the LCOS had a constant peak-to-peak flicker across all the grey levels. This LCOS device was designed to operate at 1550 nm since its primary application is for the telecom optical switches, in which the phase flicker is a critical performance parameter. It should be noted that LCOS devices based on the digital driving schemes suffer from higher phase flicker. Adjacent grey levels within a digital LCOS device may exhibit significantly different flickering characteristics due to the nature of the digital PWM driving. As the main goal of this experiment is to verify the uncertainty of the phase flicker derivation, the use of a digital LCOS device would complicate the analysis. Therefore, an analogue LCOS device was chosen. The 1550 nm laser source used in our experiments quoted a power instability of <±1%. The amplified photodiode circuit used in this work was Thorlabs PDA50B2.
Figure 6 shows the measured power response of the LCOS device when it is placed in the characterisation system shown in
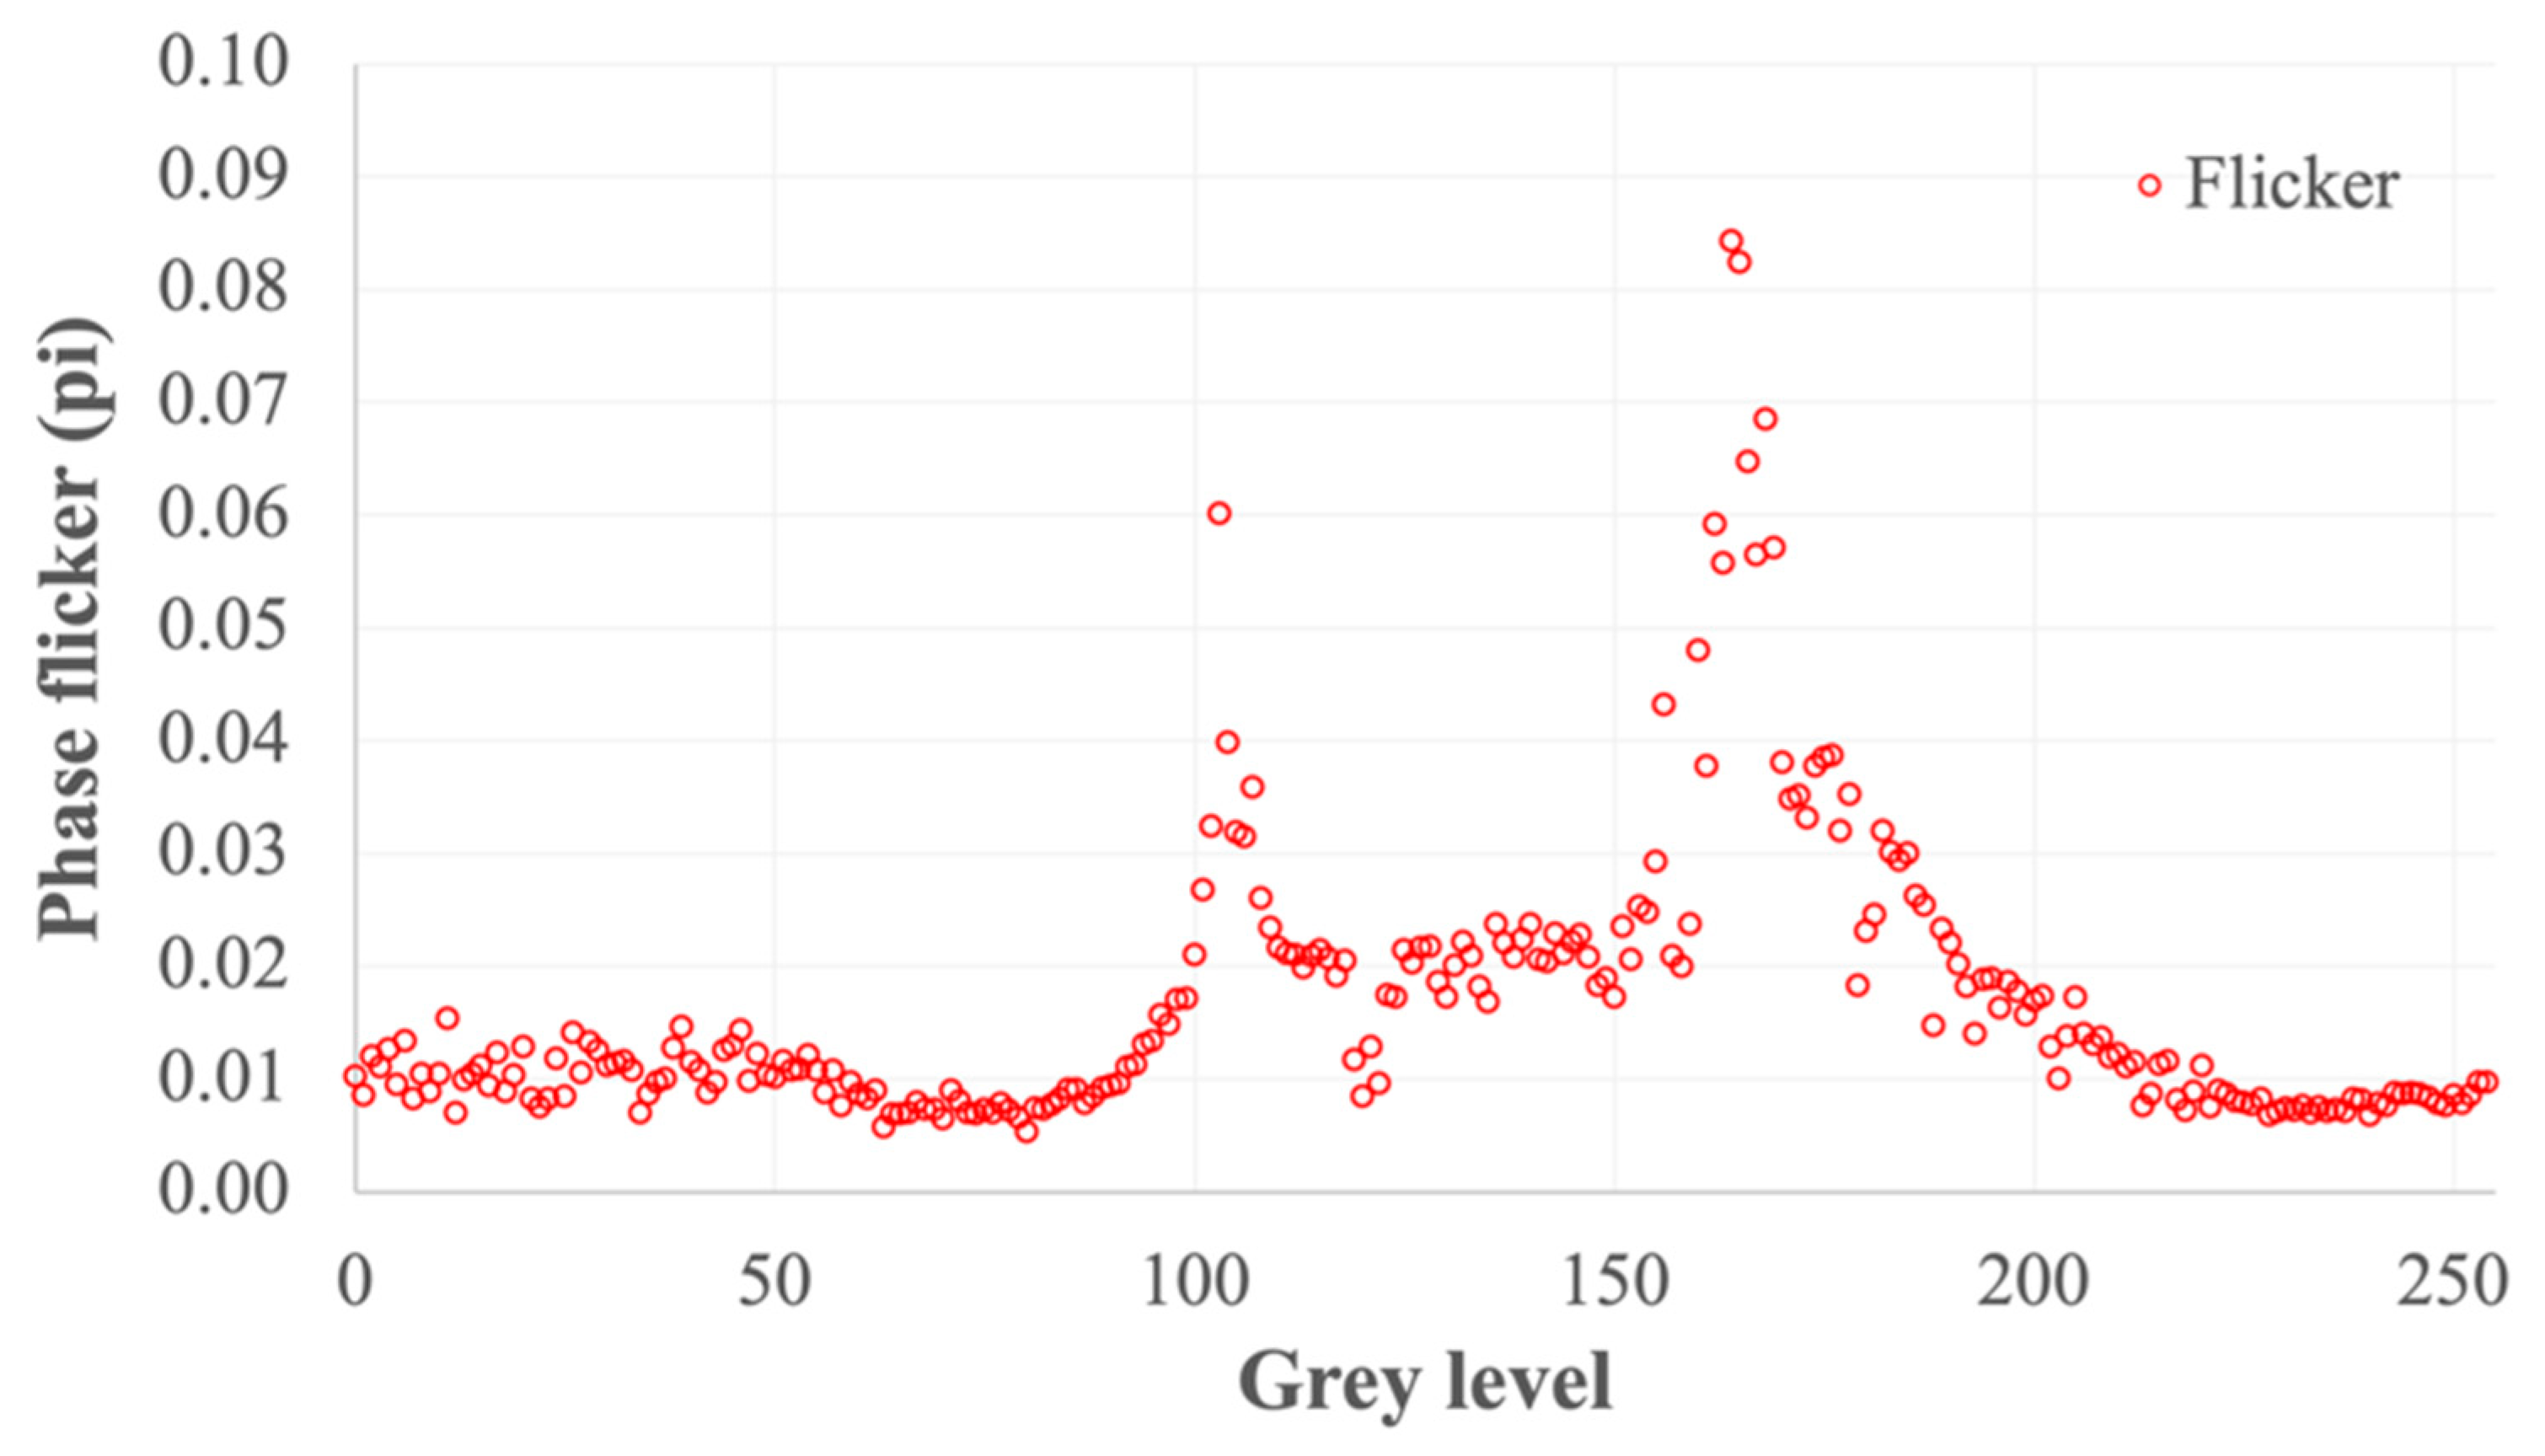
Figure 1. Based on these results, the phase response and the phase flicker at each grey level were calculated. The results were shown in
Figure 7 and
Figure 8, respectively. It can be seen from
Figure 8 that the calculated phase flicker of the LCOS device under the test was ~0.01 π for majority of the grey level. However, the calculated phase flicker was significantly elevated for the phase range corresponding to the turning points of the intensity response shown in
Figure 6. It can reach as high as ~0.09π, which is highly unlikely due to the inherent phase flicker of the LCOS device. Instead, these results were consistent with the pattern observed in our simulation. Therefore, the calculated phase flicker was artificially raised by the noise within our characterisation systems.
5. Mitigation Strategy
Our simulation and experimental results have demonstrated that the turning points of the intensity response will cause uncertainty in the phase flicker analysis. Unfortunately, it is impossible to avoid those turning points if the phase depth of the LCOS device is beyond π. However, the intensity response curve can be shifted by adding an additional waveplate between the first polariser and the LCOS device, as illustrated in
Figure 9. The fast axis is aligned 45° with respect to the first polariser, i.e., parallel to the polarisation direction of the LCOS device under the test. In this case, the turning points within the measured intensity response can be shifted by adjusting the retardation of this additional waveplate.
In order to verify the effectiveness of this proposed method, we carried out the same simulation we did for
Figure 4 and
Figure 5. Specifically, the LCOS device was assumed to have a peak-to-peak flicker of 0.06 π for all the phase levels. The noise caused by the photo detector was assumed to be only 0.5% of the maximum power level detected. The simulated relationship between the grey level and the detected power level was plotted in
Figure 10. It can be seen that the intensity curve was shifted by a quarter period in this case. The grey levels that were close to the turning points within
Figure 4 corresponded to the linear region of the curve in this measurement. As shown in
Figure 11, the measurement error for those grey levels was significantly reduced in this setup. The residual error was primarily contributed to by the noise within the photo detector. Therefore, multiple measurements using waveplates with different retardations should be carried out to ensure that each grey level had been in the linear region of the intensity curve in at least one of the measurements. In this case, we could have an accurate assessment for all the grey levels.
6. Conclusions
This paper demonstrated that there is a high degree of uncertainty in the phase flicker calculation in the presence of the noise from the characterisation system. Such noise could significantly elevate the level of the phase flicker, particularly for the phase levels corresponding to the turning points of the intensity response. Therefore, a precise characterisation of the phase flicker requires a characterisation system with an extremely low level of temporal noises. To mitigate the impact of the noise within the characterisation system, a multi-step measurement strategy was proposed in this paper. This method was able to avoid the use of data close to the turning points of the intensity response. Therefore, the measurement accuracy can be improved. The findings presented in this work could also be applicable to other characterisation methods for the phase flicker in the LCOS device, including the diffraction based methods, interferometer based methods, etc.
Author Contributions
Conceptualization, H.Y.; methodology, H.Y.; validation, Z.Y., S.W. and J.N.; formal analysis, Z.Y., S.W. and J.N.; writing—original draft preparation, Z.Y.; writing—review and editing, Z.Y., S.W. and H.Y.; visualization, Z.Y., S.W. and H.Y.; supervision, H.Y.; funding acquisition, H.Y. All authors have read and agreed to the published version of the manuscript.
Funding
This research and APC was funded by Natural Science Foundation of Jiangsu Province (BK20200351); Jiangsu Special Professorship.
Institutional Review Board Statement
Not applicable.
Informed Consent Statement
Not applicable.
Data Availability Statement
The data may be available upon request.
Conflicts of Interest
The authors declare no conflict of interest.
References
- Vettese, D. Liquid crystal on silicon. Nat. Photonics 2010, 4, 752. [Google Scholar] [CrossRef]
- Zhang, Z.; You, Z.; Chu, D. Fundamentals of phase-only liquid crystal on silicon (LCOS) devices. Light Sci. Appl. 2014, 3, e213. [Google Scholar] [CrossRef]
- Collings, N.; Crossland, W.A.; Ayliffe, P.J.; Vass, D.G.; Underwood, I. Evolutionary development of advanced liquid crystal spatial light modulators. Appl. Opt. 1989, 28, 4740–4747. [Google Scholar] [CrossRef] [PubMed]
- Lazarev, G.; Chen, P.-J.; Strauss, J.; Fontaine, N.; Forbes, A. Beyond the display: Phase-only liquid crystal on Silicon devices and their applications in photonics. Opt. Express 2019, 27, 16206–16249. [Google Scholar] [CrossRef] [PubMed]
- E Buckley, Holographic Laser Projection. J. Disp. Technol. 2011, 7, 135–140. [CrossRef]
- Armitage, D.; Underwood, I.; Wu, S.-T. Introduction to Microdisplays; John Wiley & Sons, Ltd.: Hoboken, NJ, USA, 2006. [Google Scholar]
- Baxter, G.; Frisken, S.; Abakoumov, D.; Zhou, H.; Clarke, I.; Bartos, A.; Poole, S. Highly programmable wavelength selective switch based on liquid crystal on silicon switching elements. In Optical Fiber Communication Conference and Exposition and The National Fiber Optic Engineers Conference, Technical Digest (CD); Optical Society of America: Anaheim, CA, USA, 2006. [Google Scholar]
- Yang, H.; Wilkinson, P.; Robertson, B.; Giltrap, S.; Snowdon, O.; Prudden, H.; Chu, D. 24 [1 × 12] Wavelength Selective Switches Integrated on a Single 4k LCoS Device. J. Light. Technol. 2021, 39, 1033–1039. [Google Scholar] [CrossRef]
- Jesacher, A.; Maurer, C.; Schwaighofer, A.; Bernet, S.; Ritsch-Marte, M. Full phase and amplitude control of holographic optical tweezers with high efficiency. Opt. Express 2008, 16, 4479–4486. [Google Scholar] [CrossRef] [PubMed]
- Hermerschmidt, A.; Krüger, S.; Haist, T.; Zwick, S.; Warber, M.; Osten, W. Holographic optical tweezers with real-time hologram calculation using a phase-only modulating LCOS-based SLM at 1064 nm. In Complex Light and Optical Forces II; International Society for Optics and Photonics: Bellingham, WA, USA, 2008; Volume 6905, p. 690508. [Google Scholar]
- Frumker, E.; Silberberg, Y. Femtosecond pulse shaping using a two-dimensional liquid-crystal spatial light modulator. Opt. Lett. 2007, 32, 1384–1386. [Google Scholar] [CrossRef] [PubMed] [Green Version]
- Tong, Y.; Pivnenko, M.; Chu, D. Improvements of phase linearity and phase flicker of phase-only LCoS devices for holographic applications. Appl. Opt. 2019, 58, G248–G255. [Google Scholar] [CrossRef] [PubMed]
- Tong, Y.; Pivnenko, M.; Chu, D. Implementation of 10-Bit Phase Modulation for Phase-Only LCOS Devices Using Deep Learning. Adv. Devices Instrum. 2020, 2020, 9515747. [Google Scholar] [CrossRef]
- Nie, J.; Dong, L.; Tong, X.; Xu, Y.; Lin, W.; Yang, H. Phase flicker minimisation for crosstalk suppression in optical switches based on digital liquid crystal on silicon devices. Opt. Express 2021, 29, 10556–10567. [Google Scholar] [CrossRef] [PubMed]
- Available online: https://www.hamamatsu.com/us/en/product/optical-components/lcos-slm/index.html (accessed on 28 July 2021).
- Available online: https://www.meadowlark.com/spatial_light_modulators (accessed on 28 July 2021).
- Benicewicz, B.C.; Johnson, J.F.; Shaw, M.T. Viscosity Behavior of Liquid Crystals. Mol. Cryst. Liq. Cryst. 1981, 65, 111–131. [Google Scholar] [CrossRef]
- García-Márquez, J.; López-Padilla, E.; González-Vega, A.; Noé-Arias, E. Flicker reduction in an LCoS spatial light modulator. In 22nd Congress of the International Commission for Optics: Light for the Development of the World; International Society for Optics and Photonics: Bellingham, WA, USA, 2011; Volume 8011. [Google Scholar]
- Hermanns, A.; Wilson, C.; Patel, J.S.; Grueneberg, K.A.; Nelson, K.S.; Townsend-Booth, A.; Ratna, B.R. Effect of cell thickness on electroclinic liquid crystal response time. In Liquid Crystal Materials, Devices, and Applications VI; International Society for Optics and Photonics: Bellingham, WA, USA, 1998; Volume 3297, pp. 73–80. [Google Scholar]
- Yang, H.; Chu, D.P. Phase flicker optimisation in digital liquid crystal on silicon devices. Opt. Express 2019, 27, 24556–24567. [Google Scholar] [CrossRef] [PubMed]
- Yang, H.; Chu, D.P. Phase flicker in liquid crystal on silicon devices. J. Phys. Photonics 2020, 2, 32001. [Google Scholar] [CrossRef]
- Ramirez, C.; Karakus, B.; Lizana, A.; Campos, J. Polarimetric method for liquid crystal displays characterization in presence of phase fluctuations. Opt. Express 2013, 21, 3182–3192. [Google Scholar] [CrossRef] [PubMed]
- Martínez, F.J.; Márquez, A.; Gallego, S.; Francés, J.; Pascual, I.; Beléndez, A. Retardance and flicker modeling and characterization of electro-optic linear retarders by averaged Stokes polarimetry. Opt. Lett. 2014, 39, 1011–1014. [Google Scholar] [CrossRef] [PubMed] [Green Version]
- Zhang, Z.; Yang, H.; Robertson, B.; Redmond, M.; Pivnenko, M.; Collings, N.; Crossland, B.; Chu, D. A Diffraction Based Phase Compensation Method for Phase-Only Liquid Crystal on Silicon (LCOS) Devices in Operation. Appl. Opt. 2012, 51, 3837–3846. [Google Scholar] [CrossRef] [PubMed]
- García-Márquez, J.; López, V.; González-Vega, A.; Noé, E. Flicker minimization in an LCoS spatial light modulator. Opt. Express 2012, 20, 8431–8441. [Google Scholar] [CrossRef] [PubMed]
- Chiang, K.-H.F.; Wu, S.-T.; Chen, S.-H. Fringing Field Effect of the Liquid-Crystal-on-Silicon Devices. Jpn. J. Appl. Phys. 2002, 41, 4577–4585. [Google Scholar] [CrossRef]
| Publisher’s Note: MDPI stays neutral with regard to jurisdictional claims in published maps and institutional affiliations. |
© 2021 by the authors. Licensee MDPI, Basel, Switzerland. This article is an open access article distributed under the terms and conditions of the Creative Commons Attribution (CC BY) license (https://creativecommons.org/licenses/by/4.0/).


