Design of a Surface Plasmon Resonance Temperature Sensor with Multi-Wavebands Based on Conjoined-Tubular Anti-Resonance Fiber


Abstract
:1. Introduction
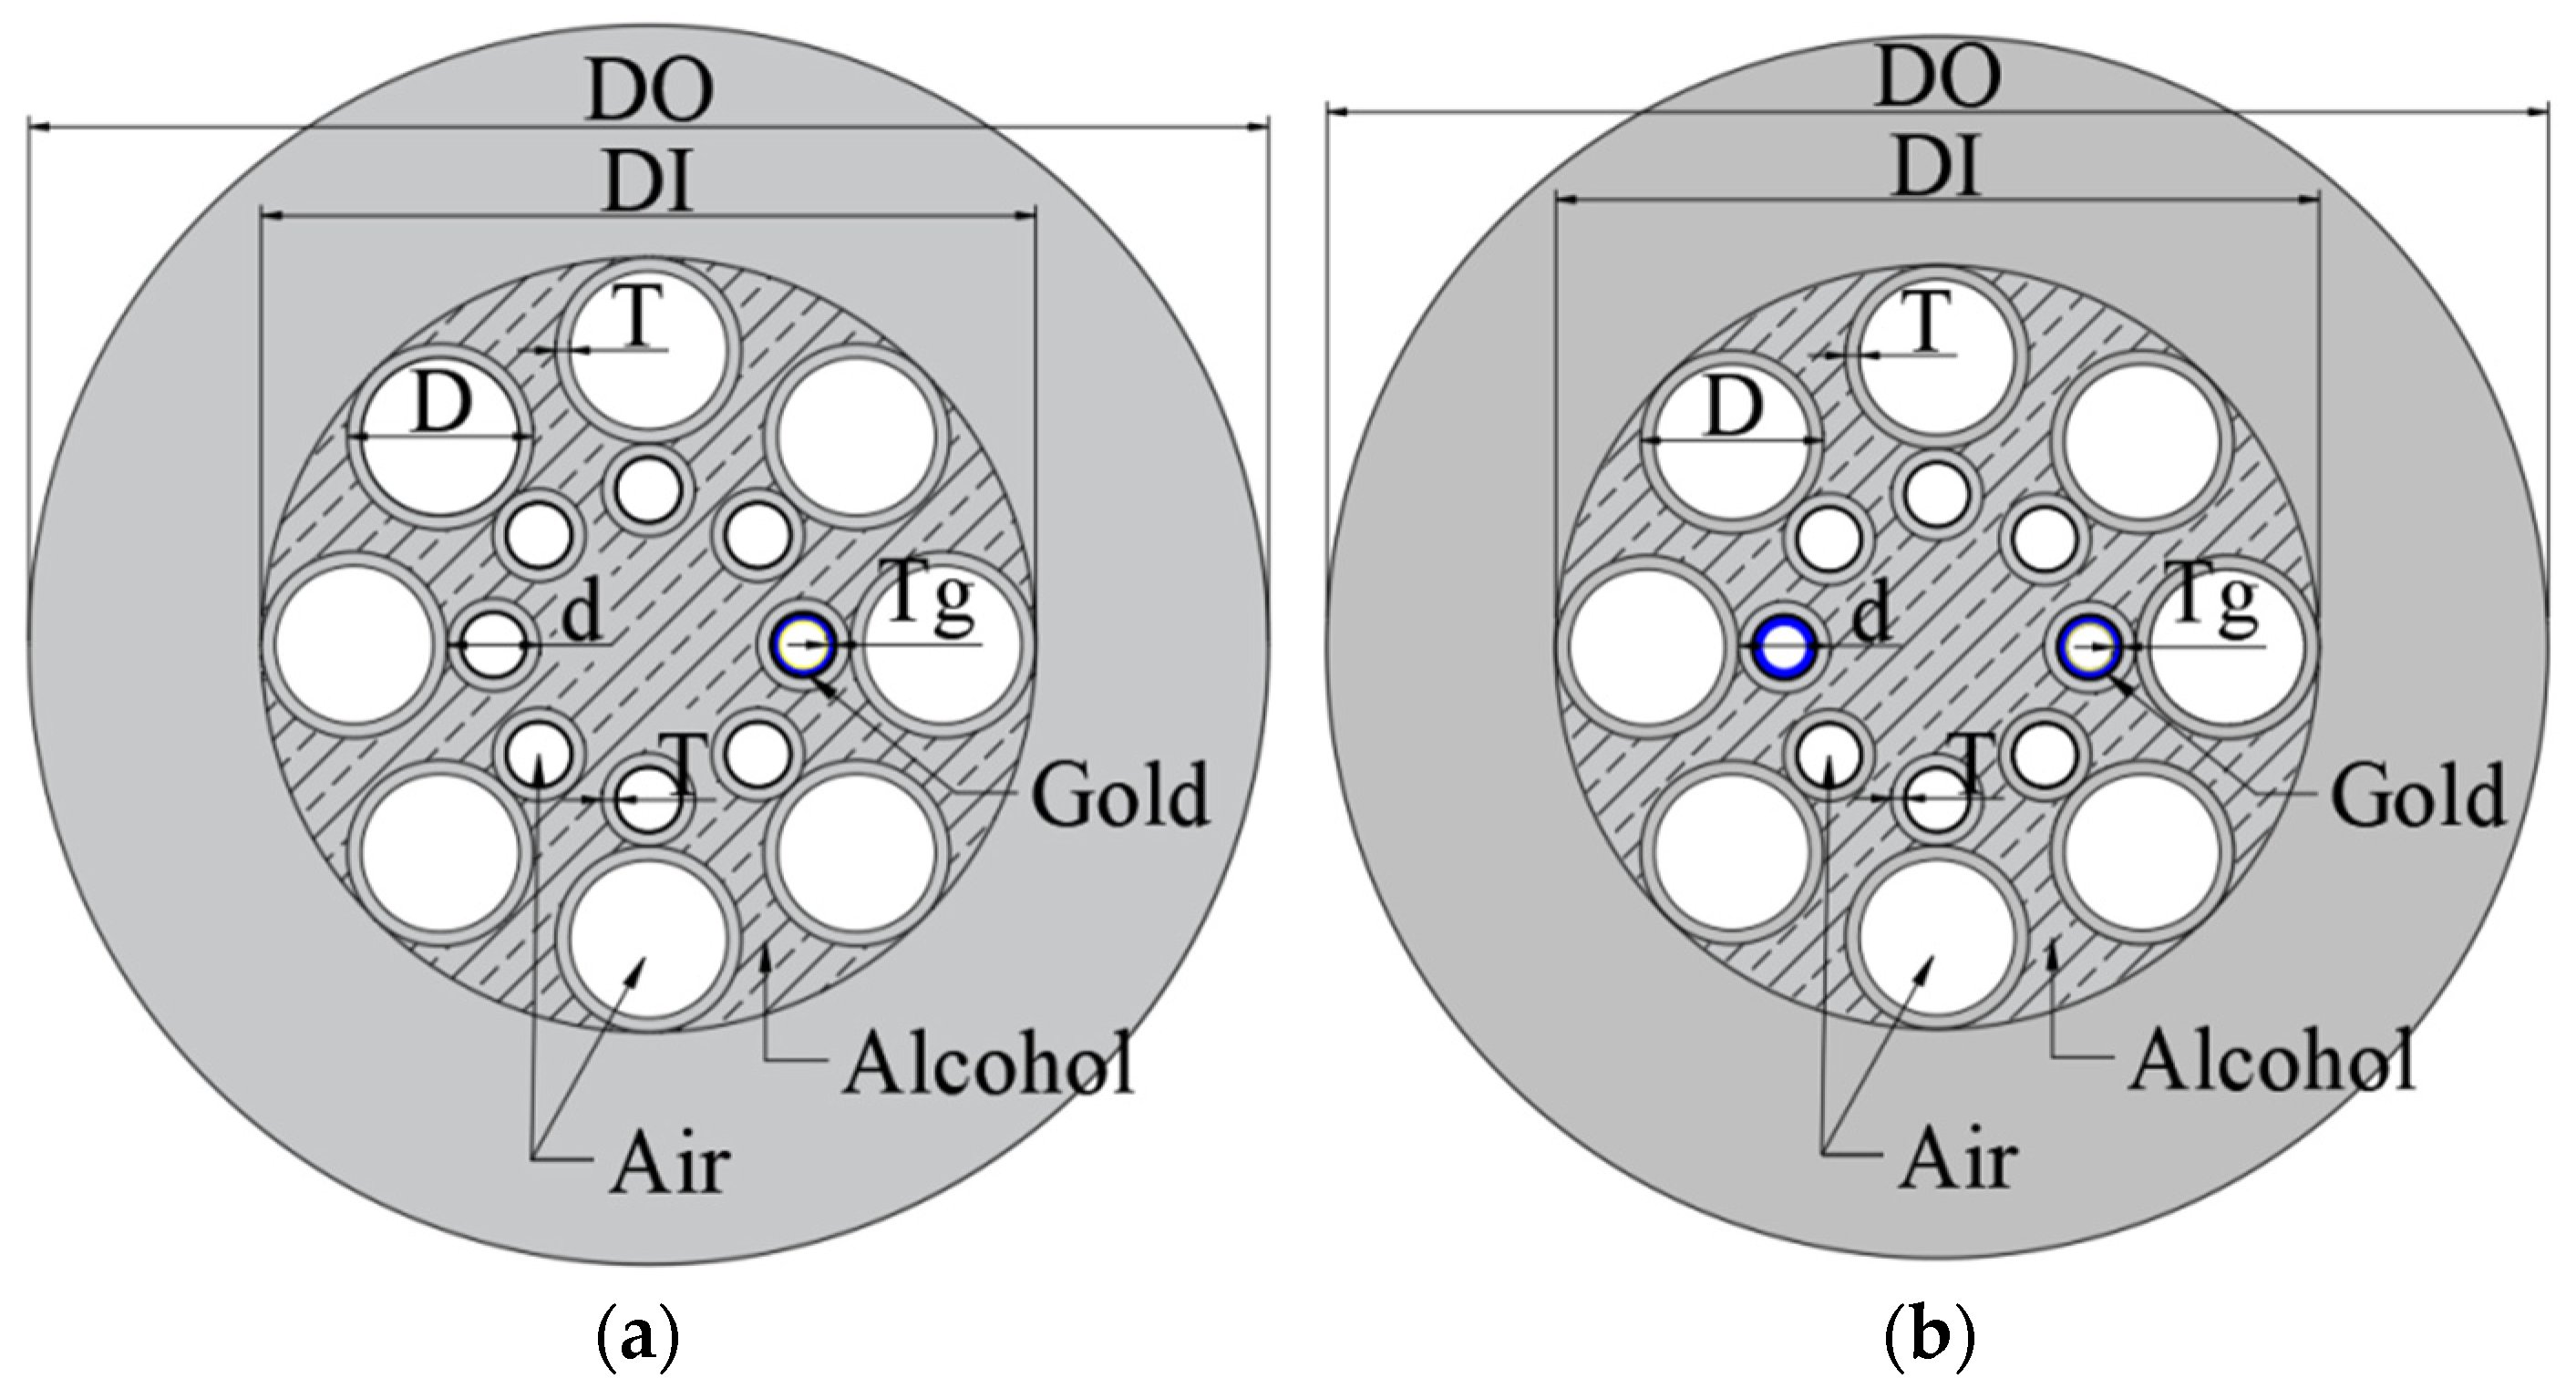
2. Sensing Principle
3. Simulation and Analysis
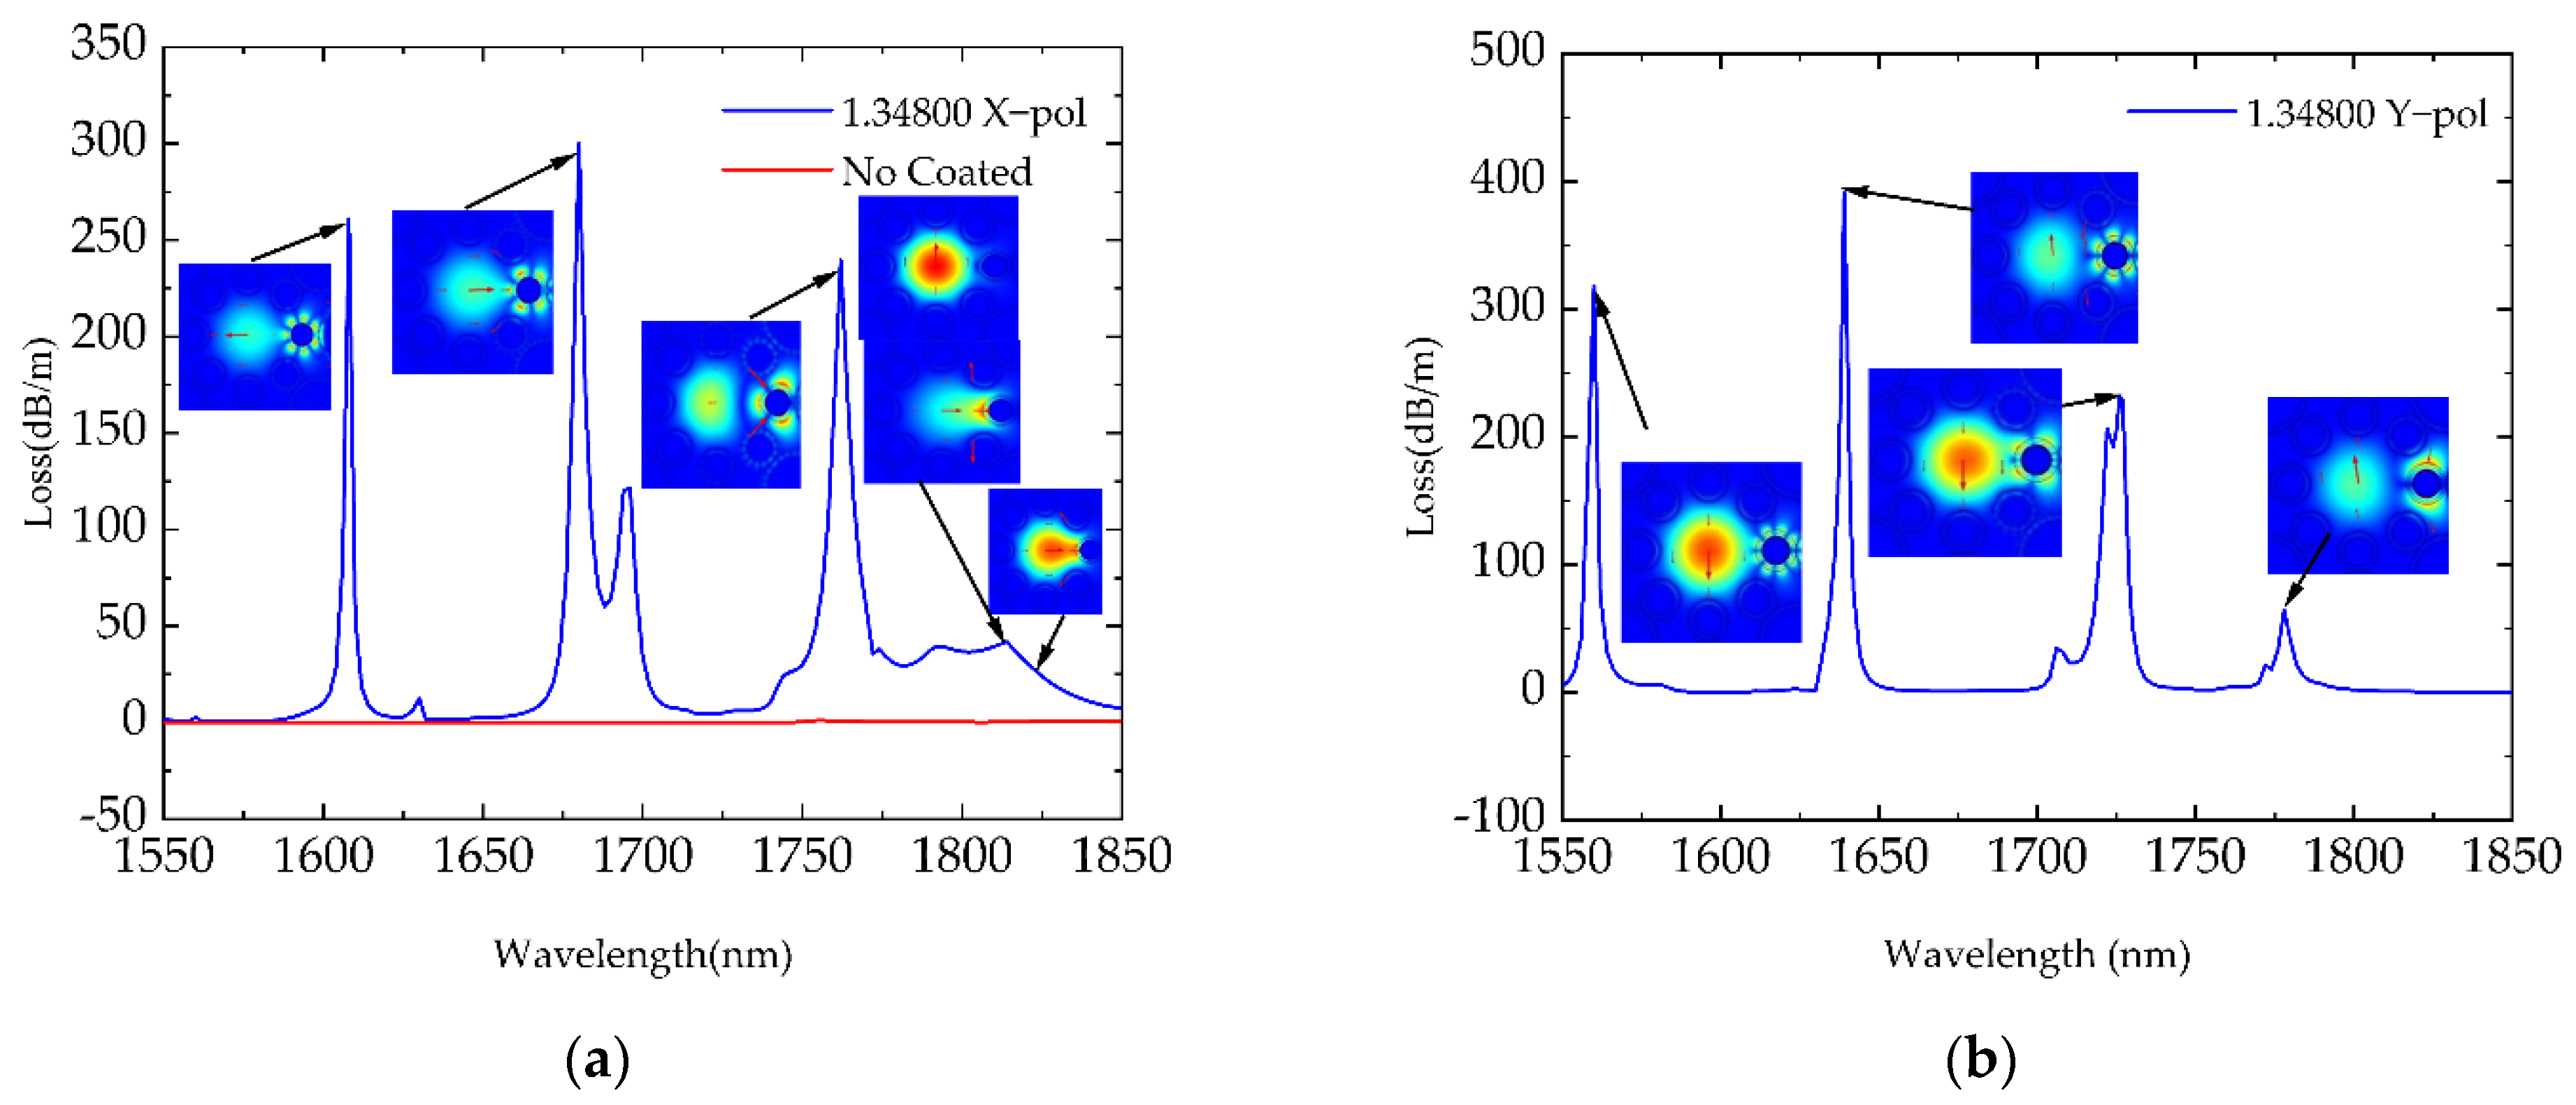
3.1. Preliminary Simulation without Temperature Variation
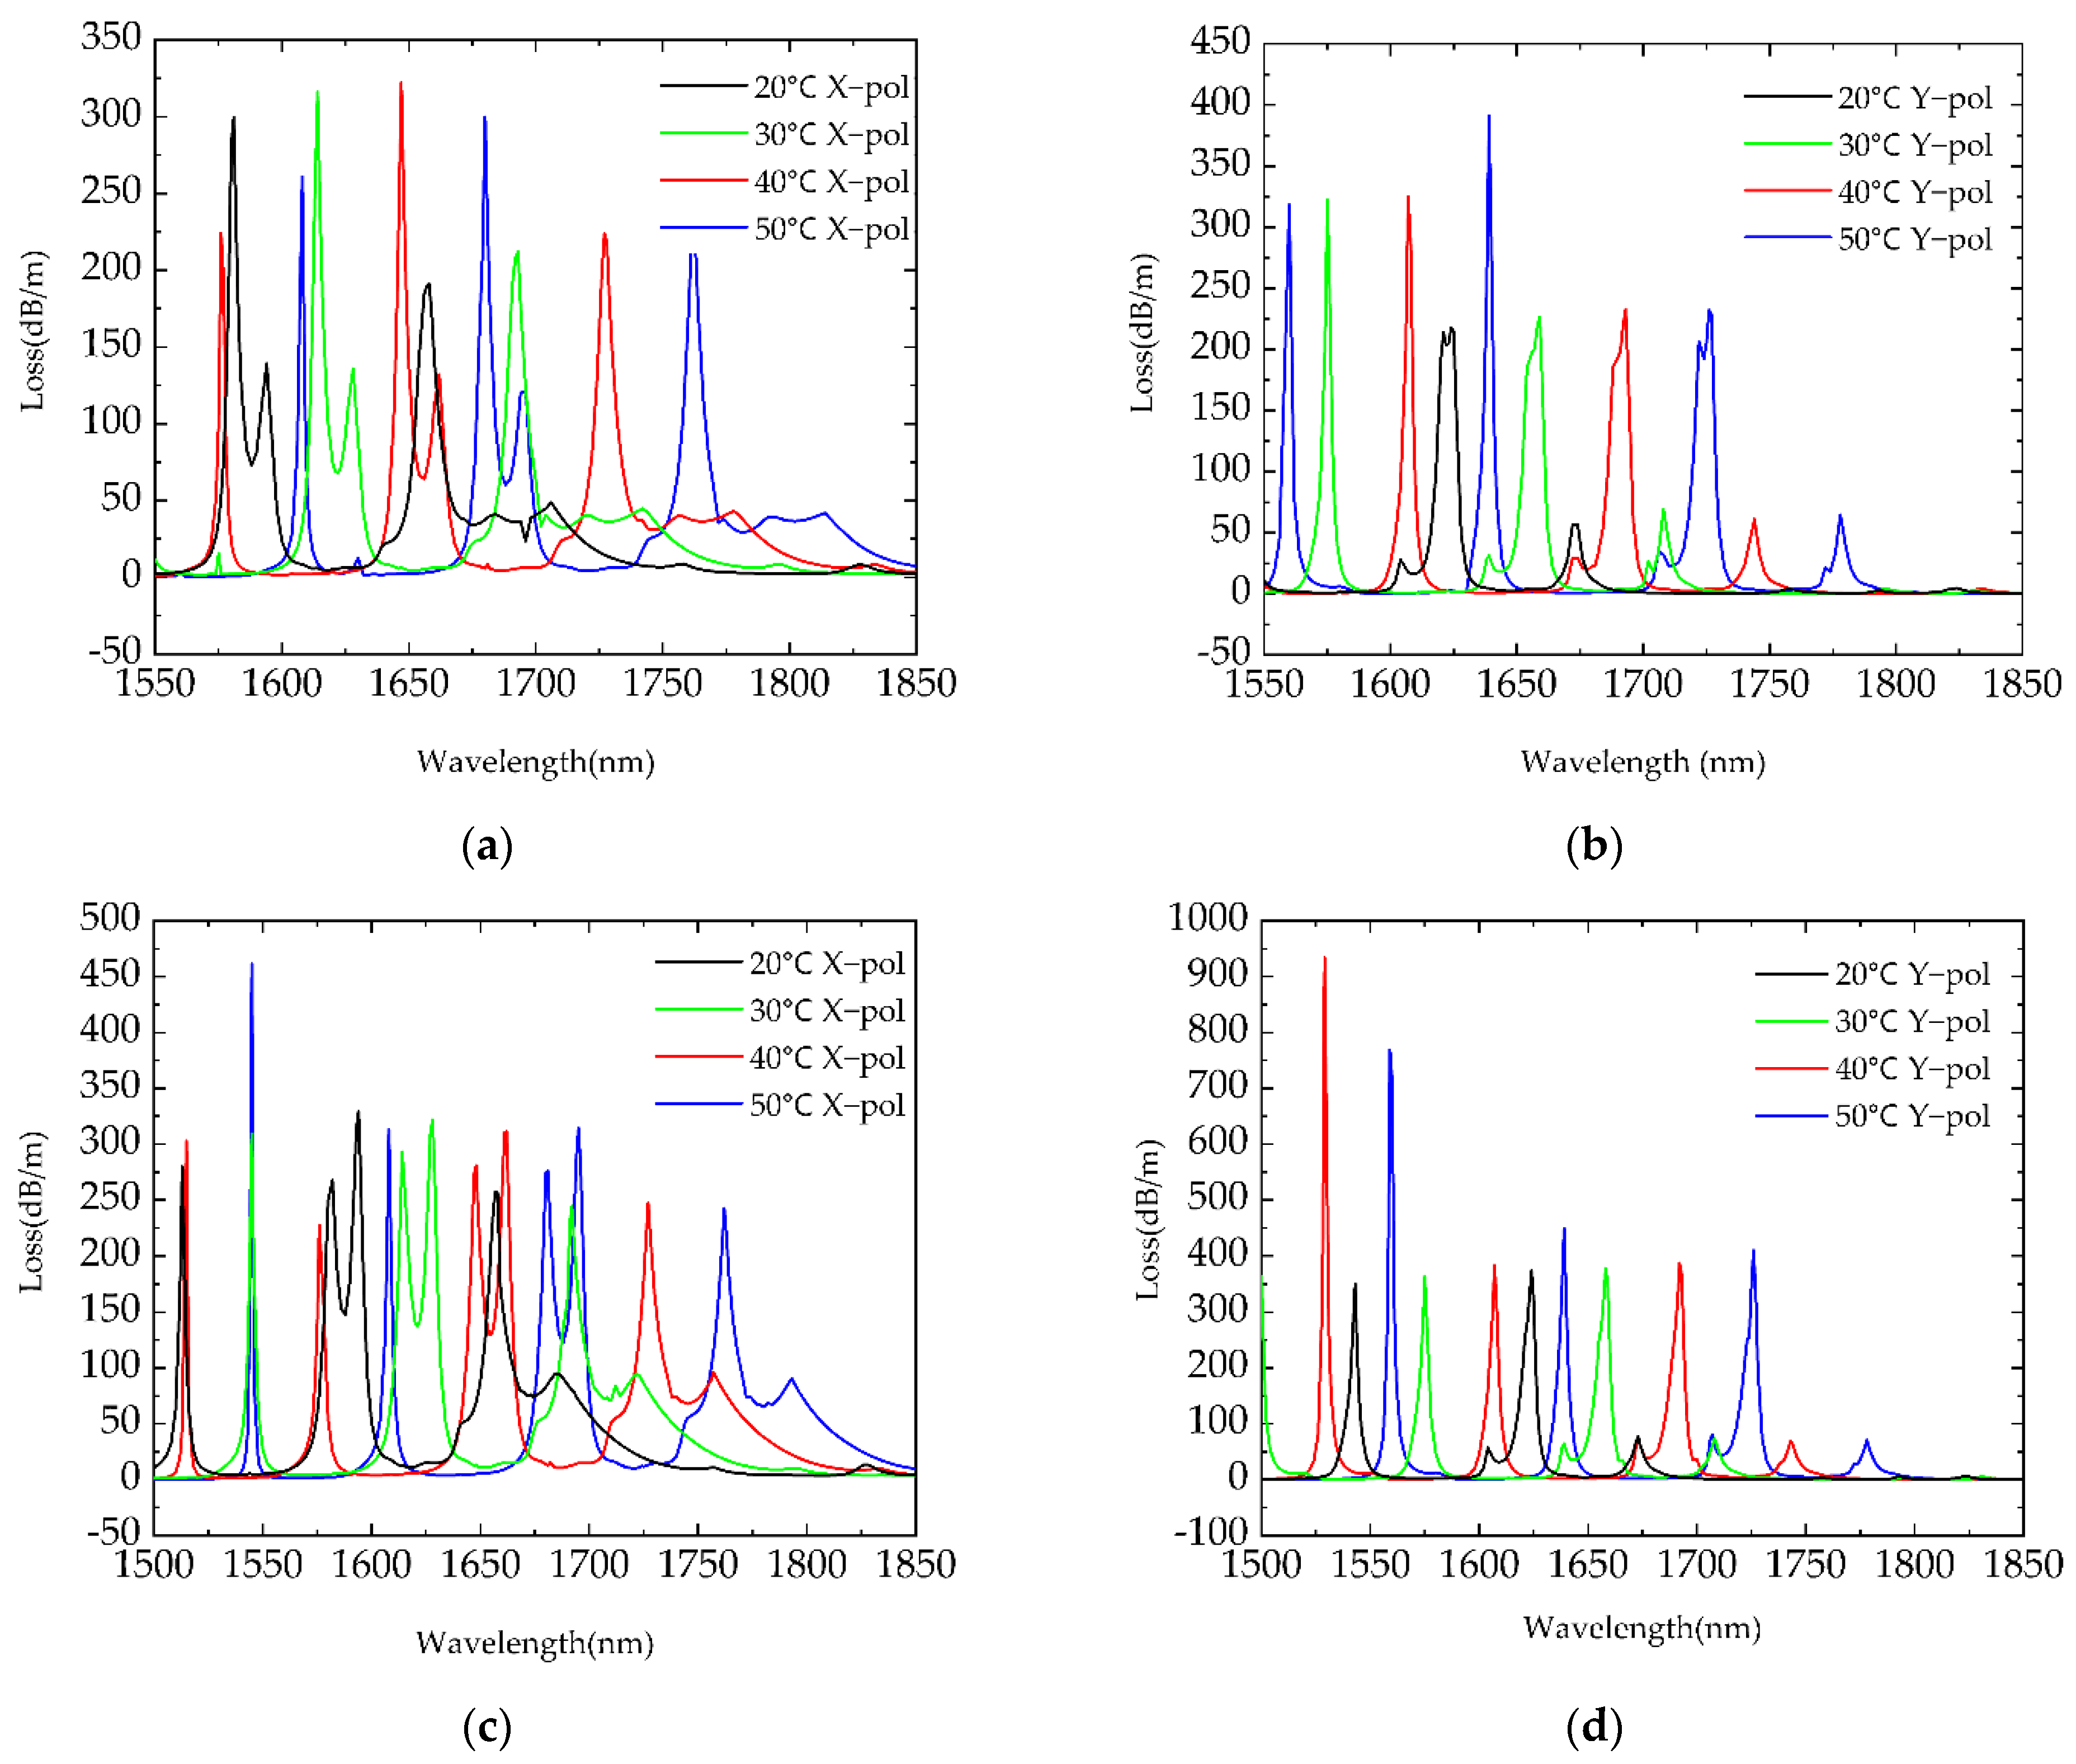
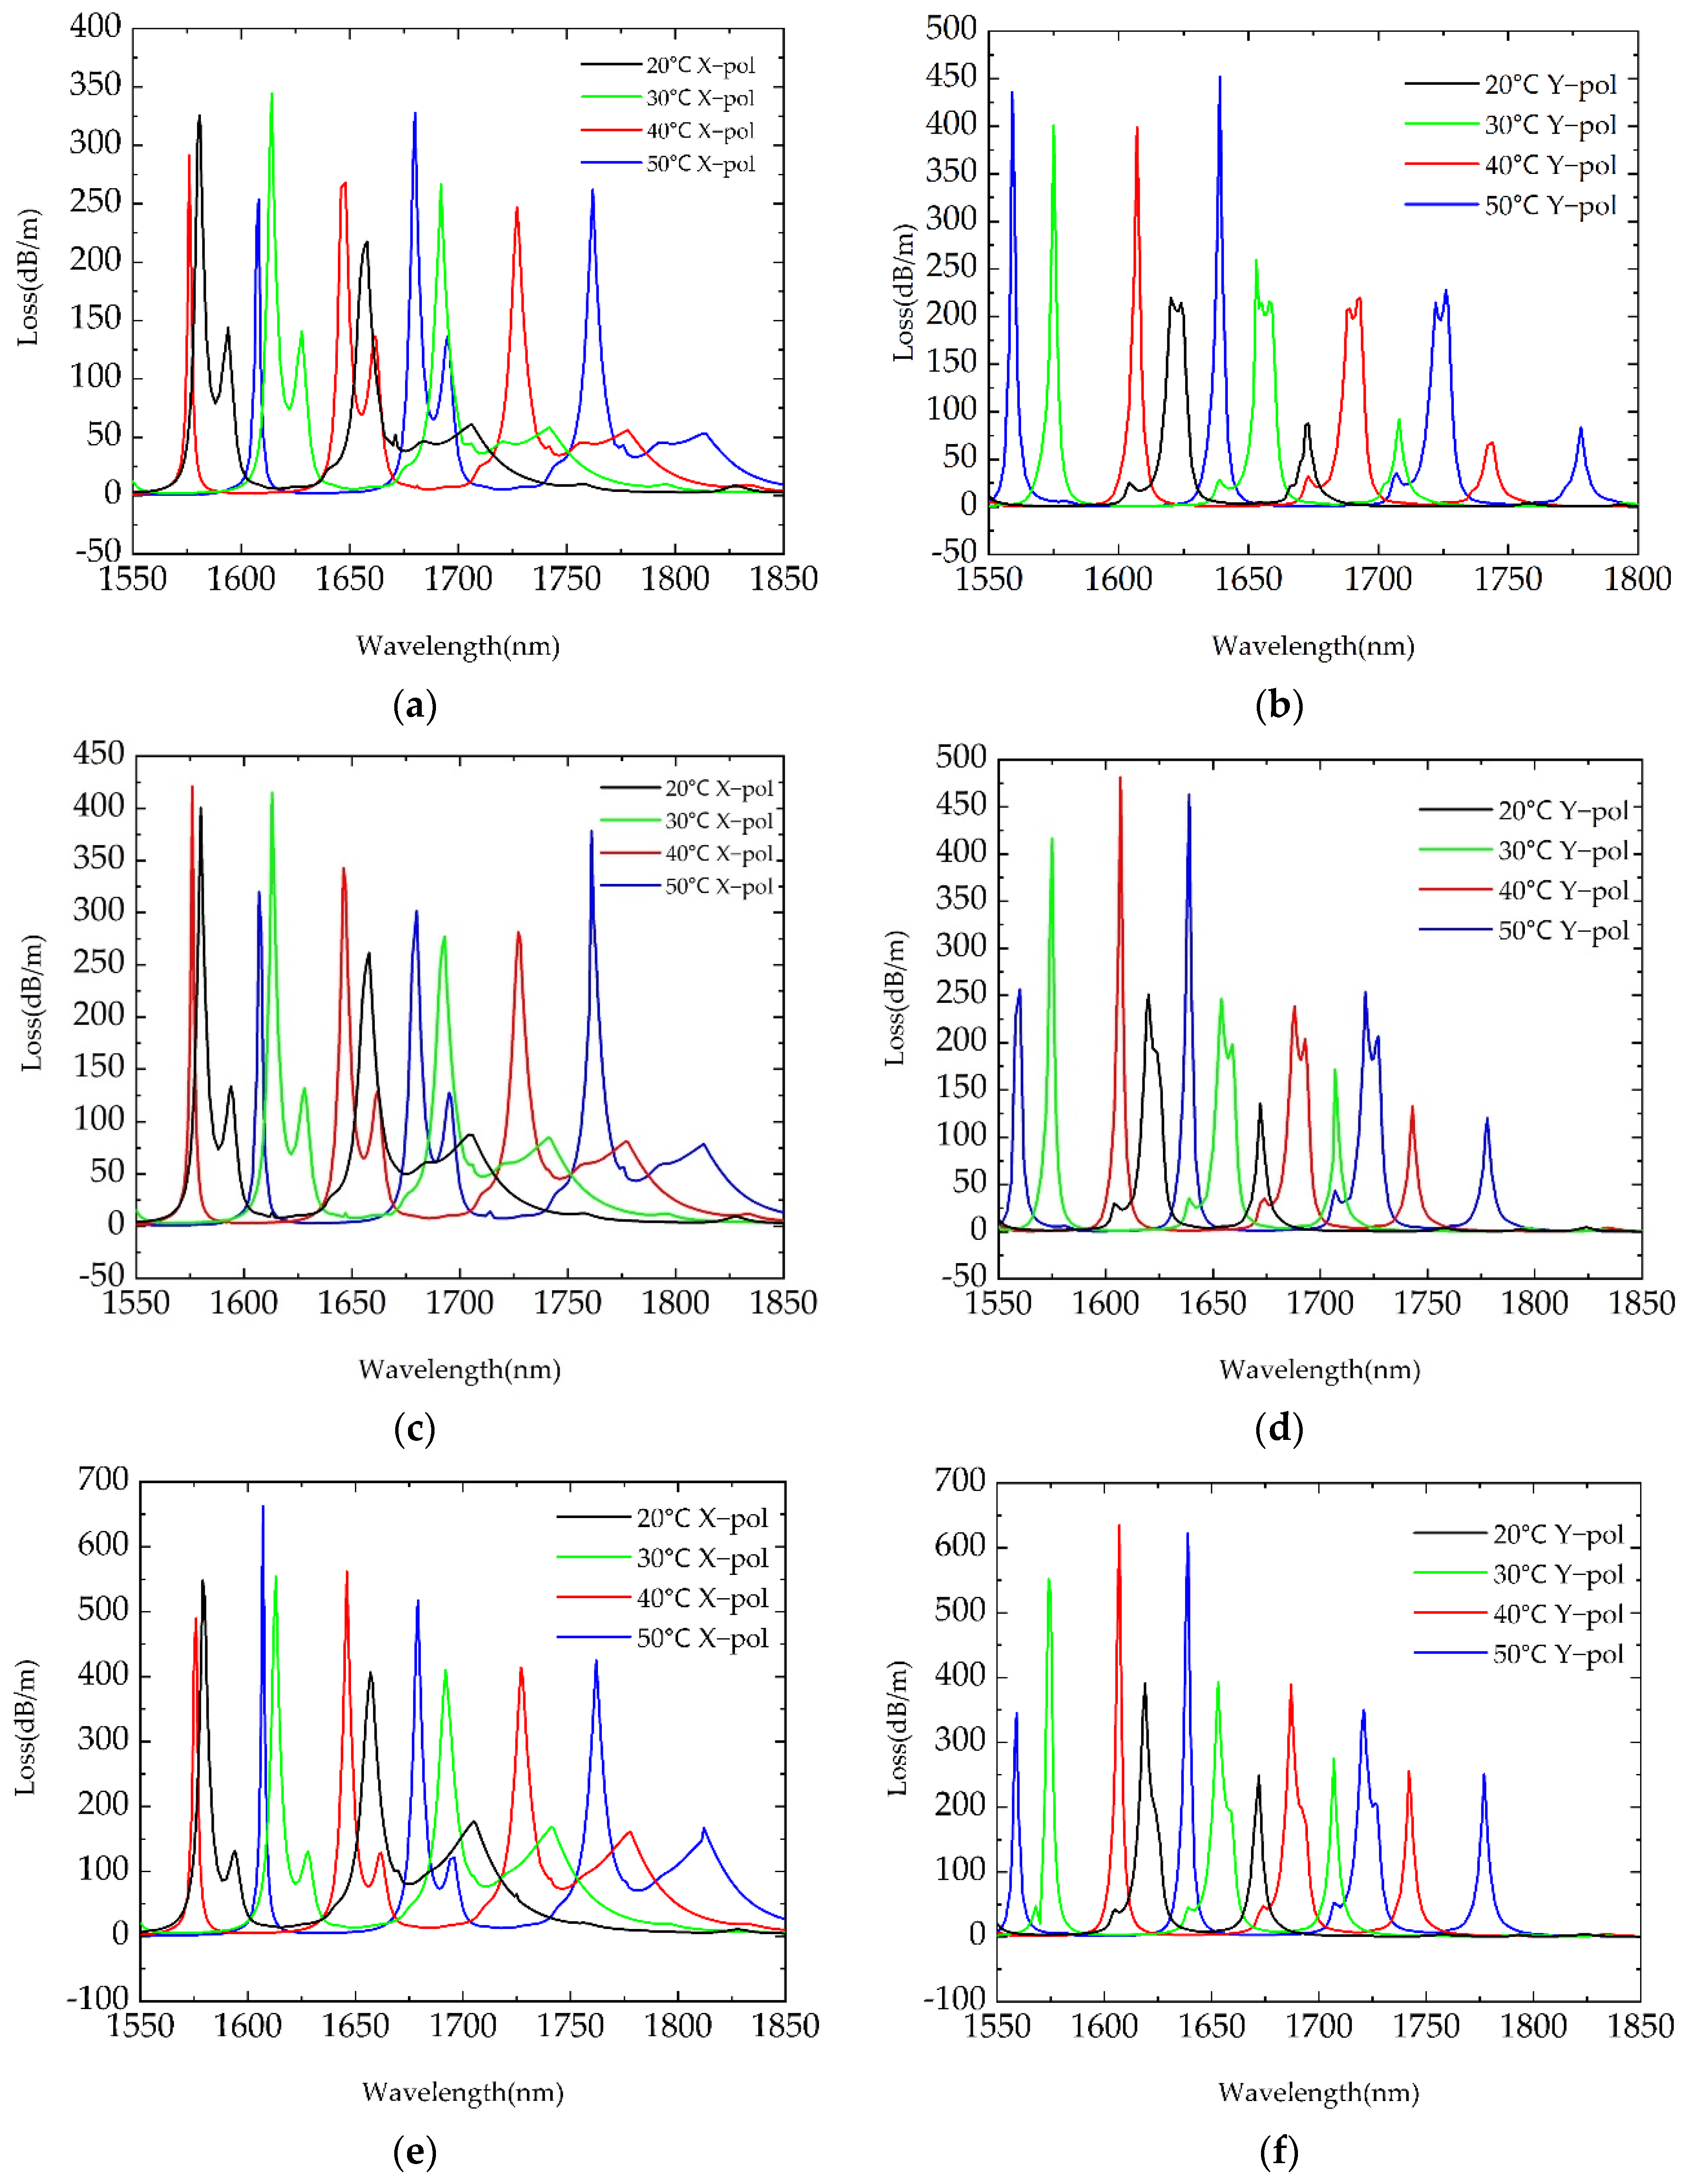
3.2. Simulation on Temperature Sensing Performance
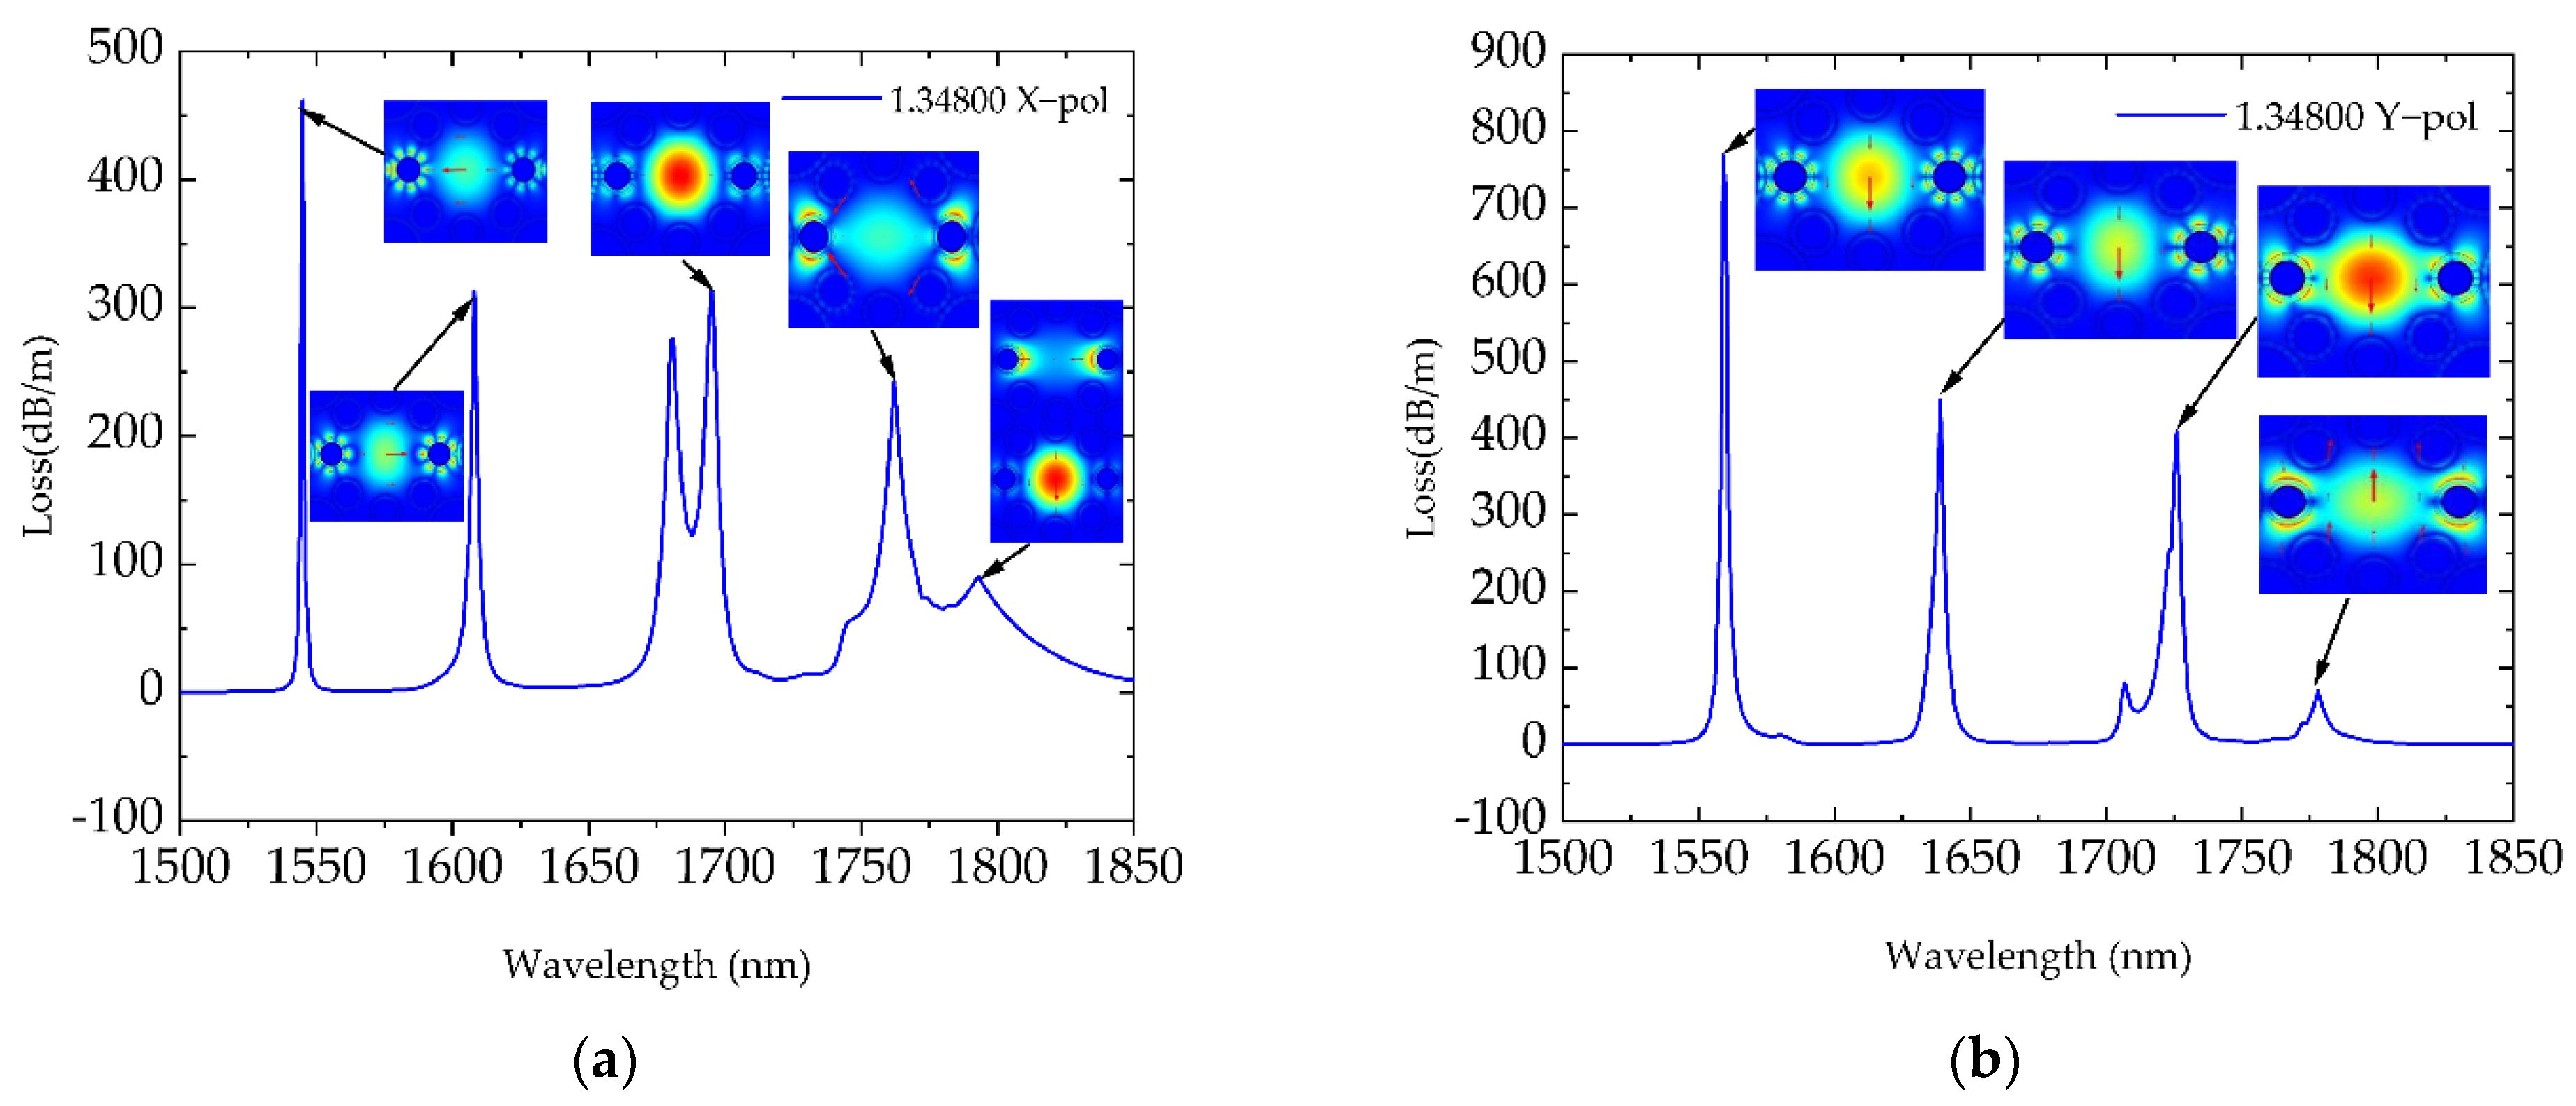
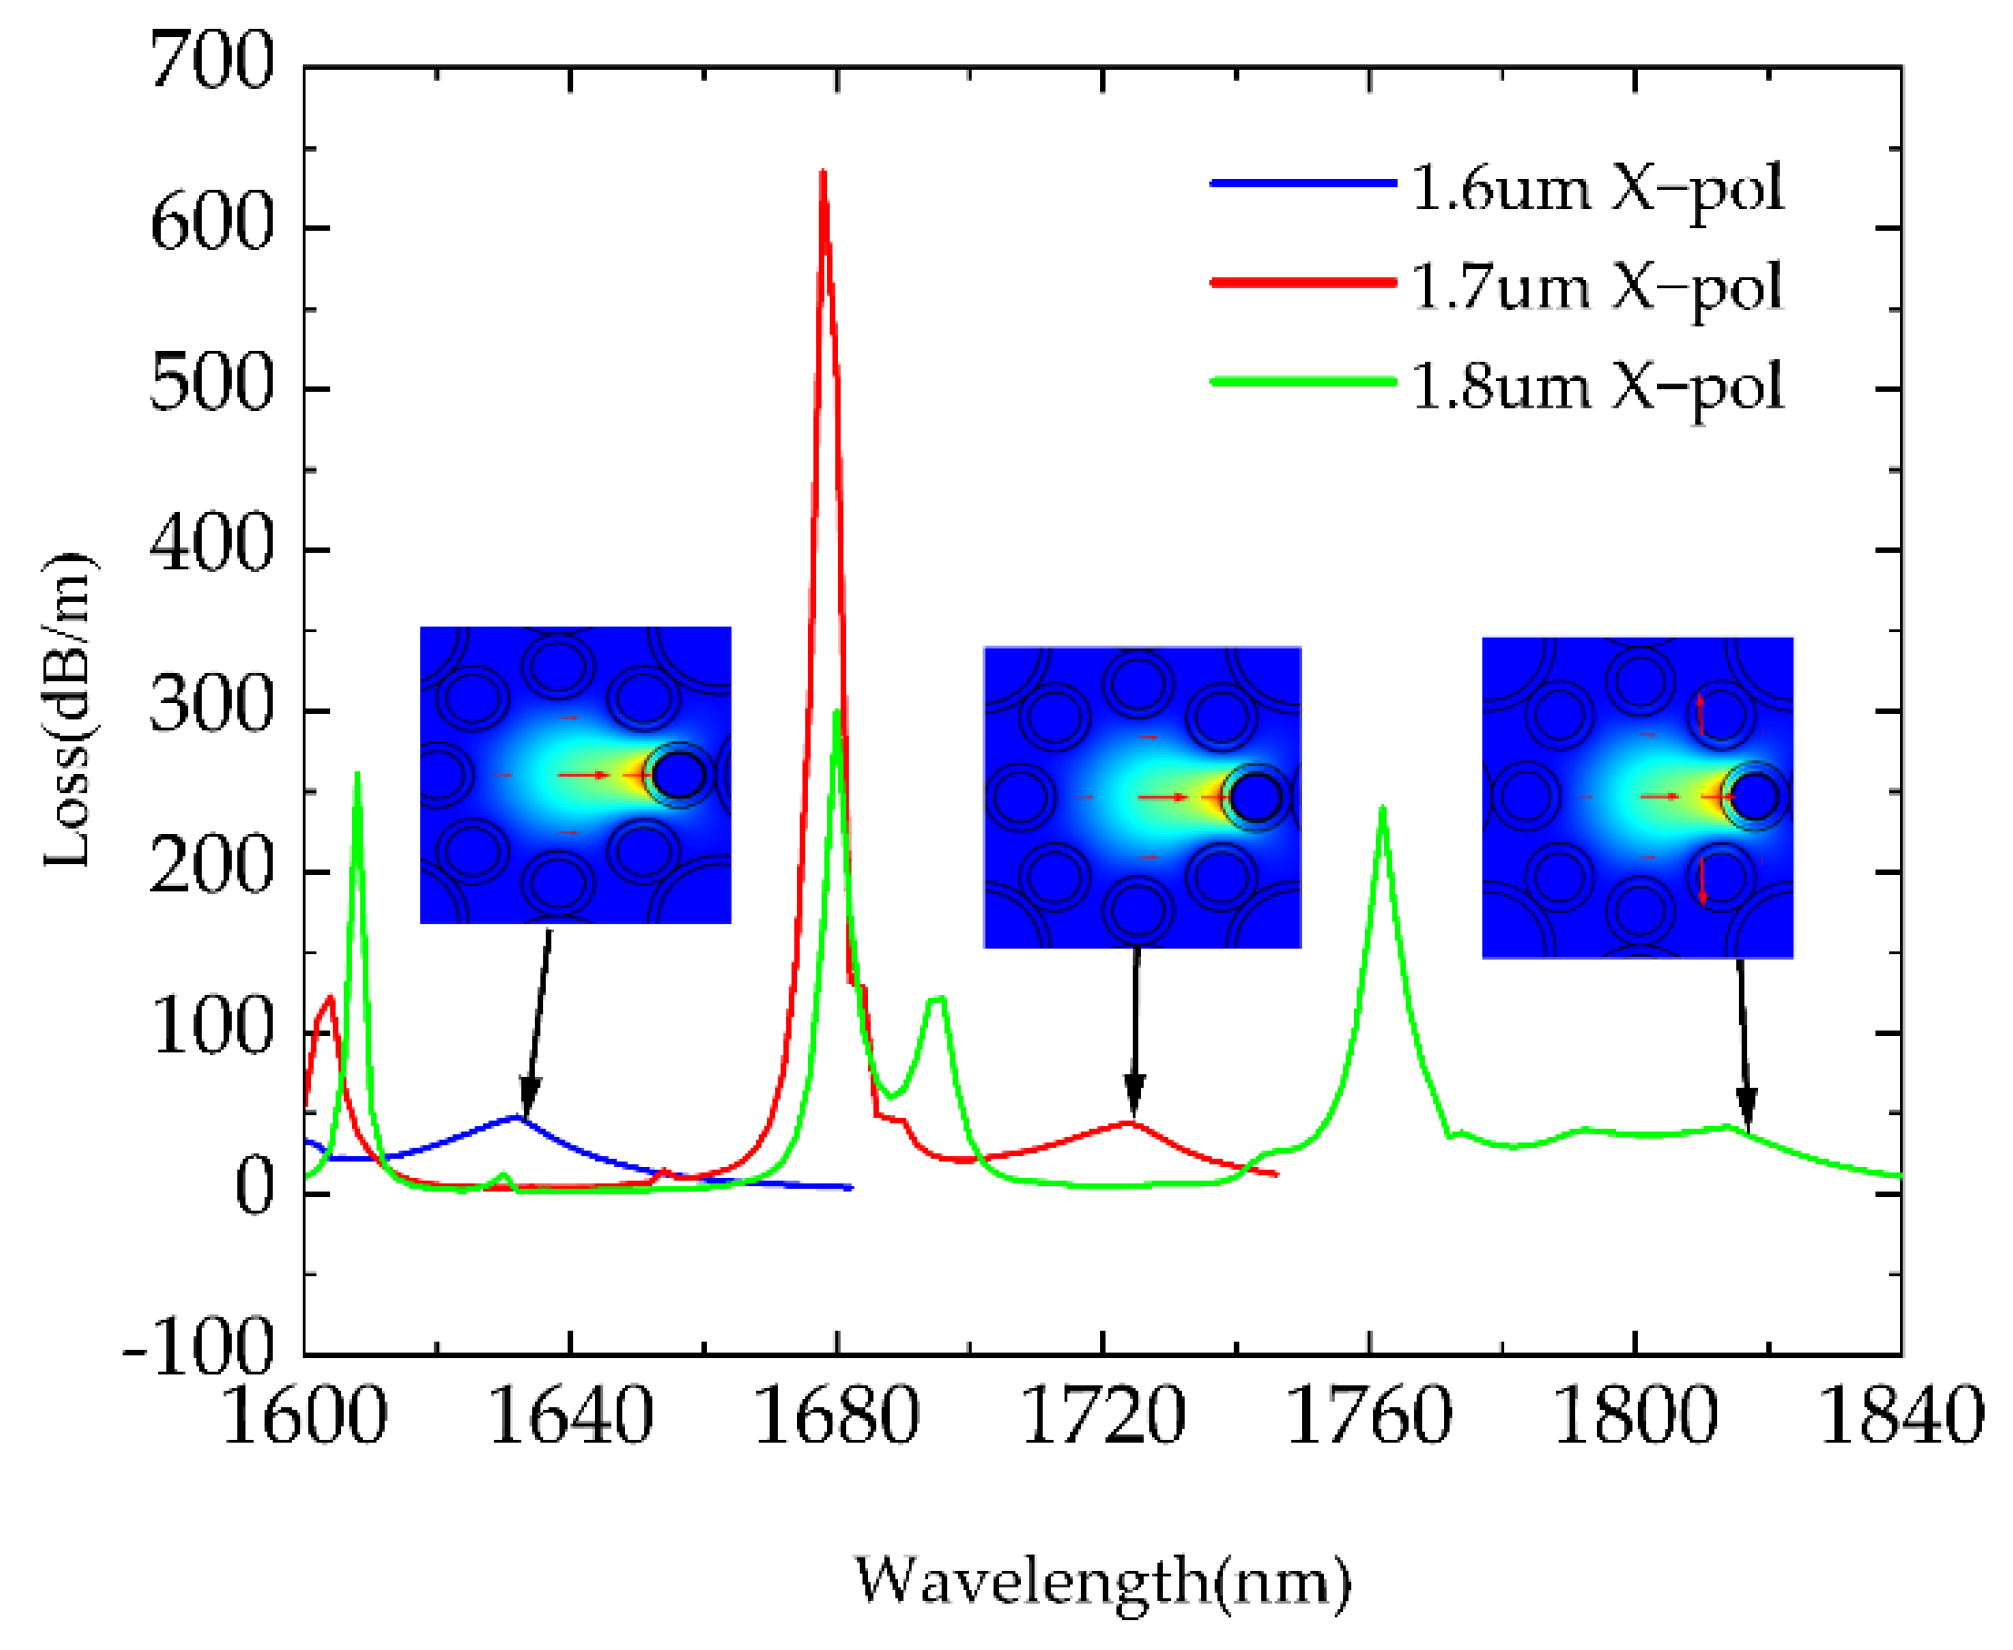
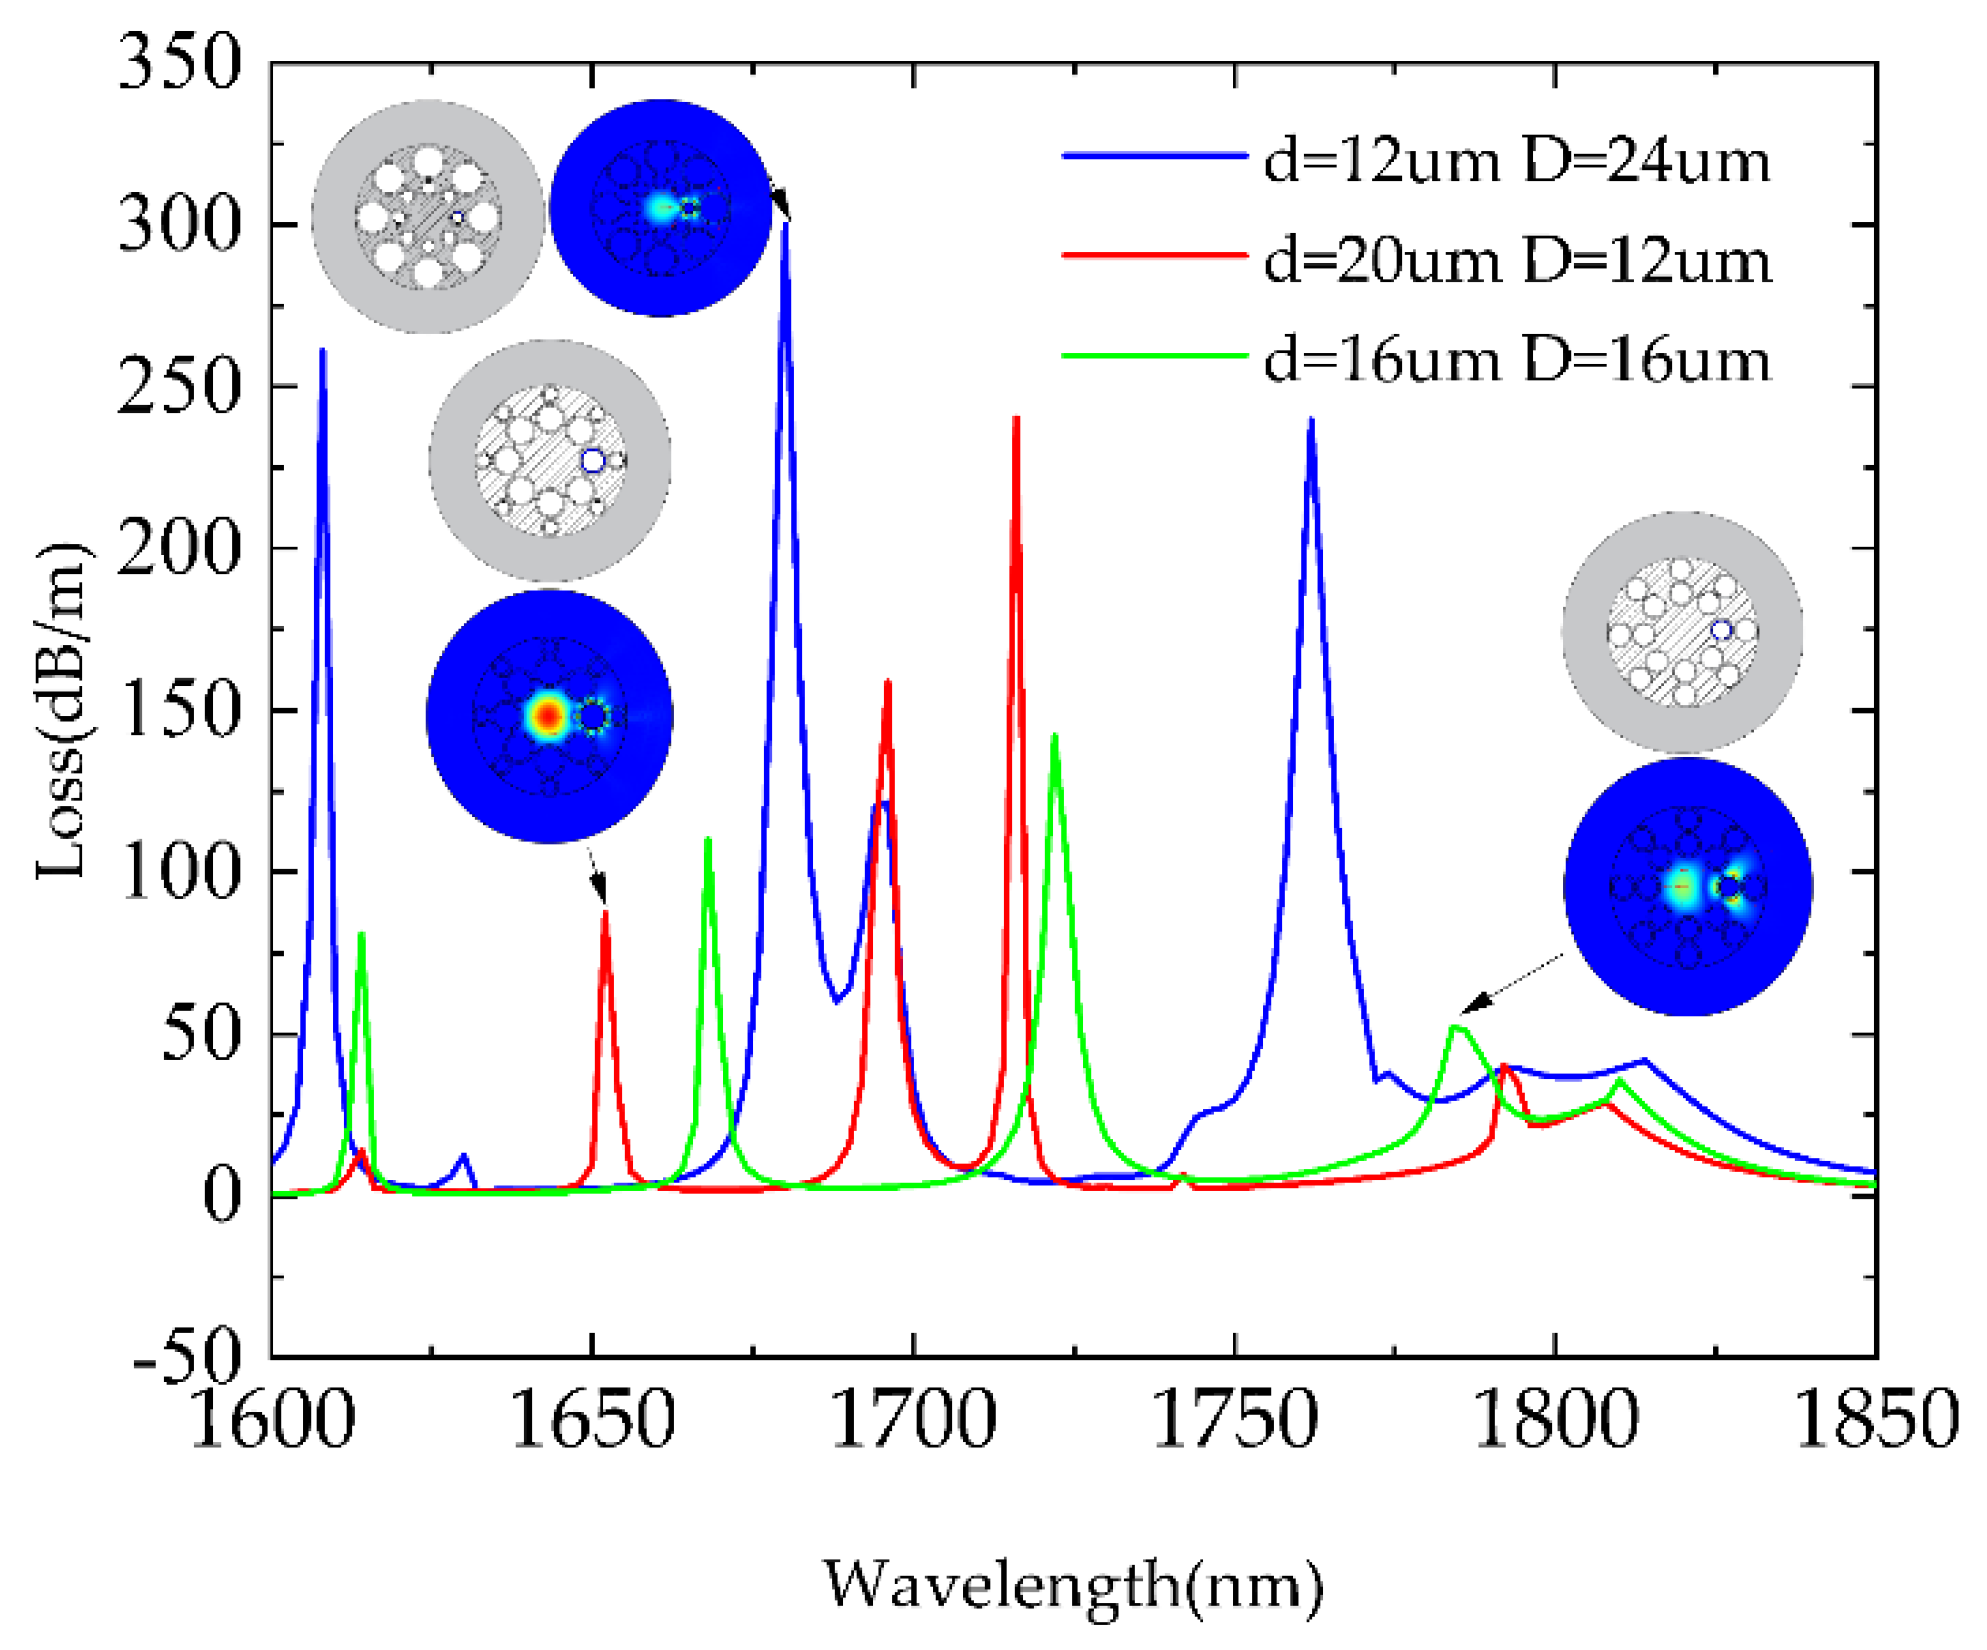
3.3. Model Optimization
4. Conclusions
Author Contributions
Funding
Institutional Review Board Statement
Informed Consent Statement
Data Availability Statement
Conflicts of Interest
References
- Yu, F.; Knight, J.C. Negative Curvature Hollow-Core Optical Fiber. IEEE J. Sel. Top. Quantum Electron. 2016, 22, 146–155. [Google Scholar] [CrossRef] [Green Version]
- Wei, C.; Weiblen, R.J.; Menyuk, C.R.; Hu, J. Negative curvature fibers. Adv. Opt. Photonics 2017, 9, 504–561. [Google Scholar] [CrossRef]
- Knight, J.C. Anti-Resonant Hollow Core Fibers. In Proceedings of the Optical Fiber Communication Conference, San Diego, CA, USA, 7 March 2019. [Google Scholar]
- Taranta, A.; Fokoua, E.N.; Mousavi, S.A.; Hayes, J.R.; Bradley, T.D.; Jasion, G.T.; Poletti, F. Exceptional polarization purity in antiresonant hollow-core optical fibres. Nat. Photonics Eng. 2020, 14, 504–510. [Google Scholar] [CrossRef]
- Yan, S.; Lou, S.; Wang, X.; Zhao, T.; Zhang, W. High-birefringence hollow-core anti-resonant THz fiber. Opt. Quantum Electron. 2018, 50, 1–13. [Google Scholar] [CrossRef]
- Yu, F.; Wadsworth, W.J.; Knight, J.C. Knight. Low loss silica hollow core fibers for 3–4 μm spectral region. Opt. Express 2012, 20, 11153–11158. [Google Scholar] [CrossRef] [PubMed] [Green Version]
- Pryamikov, A.D.; Biriukov, A.S.; Kosolapov, A.F.; Plotnichenko, V.G.; Semjonov, S.L.; Dianov, E.M. Demonstration of a waveguide regime for a silica hollow—Core microstructured optical fiber with a negative curvature of the core boundary in the spectral region > 3.5 μm. Opt. Express 2021, 19, 1441–1448. [Google Scholar] [CrossRef]
- Chen, F.; Jiang, S.; Jin, W.; Bao, H.; Ho, H.L.; Wang, C.; Gao, S. Ethane detection with mid-infrared hollow-core fiber photothermal spectroscopy. Opt. Express 2020, 28, 38115–38126. [Google Scholar] [CrossRef]
- Yao, C.; Xiao, L.; Gao, S.; Wang, Y.; Wang, P.; Kan, R.; Jin, W.; Ren, W. Sub-ppm CO detection in a sub-meter-long hollow-core negative curvature fiber using absorption spectroscopy at 2.3 μm. Sens. Actuators B Chem. 2020, 303, 127238. [Google Scholar] [CrossRef]
- Gao, S.F.; Wang, Y.Y.; Ding, W.; Jiang, D.L.; Gu, S.; Zhang, X.; Wang, P. Hollow-core conjoined-tube negative-curvature fibre with ultralow loss. Nat. Commun. 2018, 9, 2828. [Google Scholar] [CrossRef] [Green Version]
- Wang, Y.Y.; Gao, S.F.; Ding, W.; Wang, P. Loss Reduction in Hollow-Core Conjoined-Tube Negative-Curvature Fiber. In Proceedings of the 45th European Conference on Optical Communication, Dublin, Ireland, 22–26 September 2019. [Google Scholar]
- Gao, S.F.; Wang, Y.Y.; Ding, W.; Hong, Y.F.; Wang, P. Conquering the Rayleigh Scattering Limit of Silica Glass Fiber at Visible Wavelengths with a Hollow-Core Fiber Approach. Laser Photonics Rev. 2020, 14, 1900241. [Google Scholar] [CrossRef] [Green Version]
- Nguyen, H.; Park, J.; Kang, S.; Kim, M. Surface plasmon resonance: A versatile technique for biosensor applications. Sensors 2015, 15, 10481–10510. [Google Scholar] [CrossRef] [Green Version]
- Zhou, X.; Cheng, T.; Li, S.; Suzuki, T.; Ohishi, Y. Practical sensing approach based on surface plasmon resonance in a photonic crystal fiber. OSA Contin. 2018, 1, 1332–1340. [Google Scholar] [CrossRef]
- Zhou, X.; Li, X.; Cheng, T.; Li, S.; An, G. Graphene enhanced optical fiber SPR sensor for liquid concentration measurement. Opt. Fiber Technol. 2018, 43, 62–66. [Google Scholar] [CrossRef]
- Zhou, X.; Li, X.; Li, S.; An, G.W.; Cheng, T. Magnetic Field Sensing Based on SPR Optical Fiber Sensor Interacting with Magnetic Fluid. IEEE Trans. Instrum. Meas. 2019, 68, 234–239. [Google Scholar] [CrossRef]
- Khanikar, T.; Singh, V.K. Analysis of a highly sensitive side polished hollow fiber plasmonic sensor and its application as a magnetometer. Appl. Opt. 2020, 59, 171–179. [Google Scholar] [CrossRef]
- Gangwar, R.K.; Singh, V.K. Highly Sensitive Surface Plasmon Resonance Based D-Shaped Photonic Crystal Fiber Refractive Index Sensor. Plasmonics 2017, 12, 1367–1373. [Google Scholar] [CrossRef]
- Li, T.; Zhu, L.; Yang, X.; Lou, X.; Yu, L. A Refractive Index Sensor Based on H-Shaped Photonic Crystal Fibers Coated with Ag-Graphene Layers. Sensors 2020, 20, 741. [Google Scholar] [CrossRef] [Green Version]
- Gomez-Cardona, N.; Reyes-Vera, E.; Torres, P. High Sensitivity Refractive Index Sensor Based on the Excitation of Long-Range Surface Plasmon Polaritons in H-Shaped Optical Fiber. Sensors 2020, 20, 2111. [Google Scholar] [CrossRef] [Green Version]
- Yang, X.; Lu, Y.; Liu, B.; Yao, J. High Sensitivity Hollow Fiber Temperature Sensor Based on Surface Plasmon Resonance and Liquid Filling. IEEE Photonics J. 2018, 10, 1–9. [Google Scholar] [CrossRef]
- Tang, Y.-X.; Zhang, X.; Zhu, X.-S.; Shi, Y.-W. Dielectric layer thickness insensitive EVA/Ag-coated hollow fiber temperature sensor based on long-range surface plasmon resonance. Opt. Express 2021, 29, 368–376. [Google Scholar] [CrossRef]
- Liu, B.-H.; Jiang, Y.-X.; Zhu, X.-S.; Tang, X.-L.; Shi, Y.-W. Hollow fiber surface plasmon resonance sensor for the detection of liquid with high refractive index. Opt. Express 2013, 21, 32349–32357. [Google Scholar] [CrossRef]
- Litchinitser, N.M.; Abeeluck, A.K.; Headley, C.; Eggleton, B.J. Antiresonant reflecting photonic crystal optical waveguides. Opt. Lett. 2002, 27, 1592–1594. [Google Scholar] [CrossRef]
- Zhang, X.; Zhu, X.-S.; Shi, Y.-W. Improving the performance of hollow fiber surface plasssmon resonance sensor with one dimensional photonic crystal structure. Opt. Express 2018, 26, 130–140. [Google Scholar] [CrossRef]
- Rifat, A.A.; Mahdiraji, G.A.; Sua, Y.M.; Ahmed, R.; Shee, Y.G.; Adikan, F.M. Highly sensitive multi-core flat fiber surface plasmon resonance refractive index sensor. Opt. Express 2016, 24, 2485–2495. [Google Scholar] [CrossRef]
- Litchinitser, N.M.; Dunn, S.C.; Usner, B.; Eggleton, B.J.; White, T.P.; McPhedran, R.C.; de Sterke, C.M. Resonances in microstructured optical waveguides. Opt. Express 2003, 11, 1243–1251. [Google Scholar] [CrossRef]
- Luan, N.; Wang, R.; Lv, W.; Lu, Y.; Yao, J. Surface plasmon resonance temperature sensor based on photonic crystal fibers randomly filled with silver nanowires. Sensors 2014, 14, 16035–16045. [Google Scholar] [CrossRef] [PubMed] [Green Version]
- Vial, A.; Grimault, A.S.; Macías, D.; Barchiesi, D.; De La Chapelle, M.L. Improved analytical fit of gold dispersion: Application to the modeling of extinction spectra with a finite-difference time-domain method. Phys. Rev. B 2005, 71, 085416. [Google Scholar] [CrossRef]
- Malitson, I.H. Interspecimen comparison of the refractive index of fused silica. J. Opt. Soc. Am. 1965, 55, 1205–1208. [Google Scholar] [CrossRef]
- Yu, Y.; Li, X.; Hong, X.; Deng, Y.; Song, K.; Geng, Y.; Wei, H.; Tong, W. Some features of the photonic crystal fiber temperature sensor with liquid ethanol filling. Opt. Express 2010, 18, 15383–15388. [Google Scholar] [CrossRef]
- Sani, E.; Dell’Oro, A. Spectral optical constants of ethanol and isopropanol from ultraviolet to far infrared. Opt. Mater. 2016, 60, 137–141. [Google Scholar] [CrossRef]


| Alcohol RI | Temperature (°C) |
|---|---|
| 1.36048 | 20 |
| 1.35639 | 30 |
| 1.35222 | 40 |
| 1.34800 | 50 |
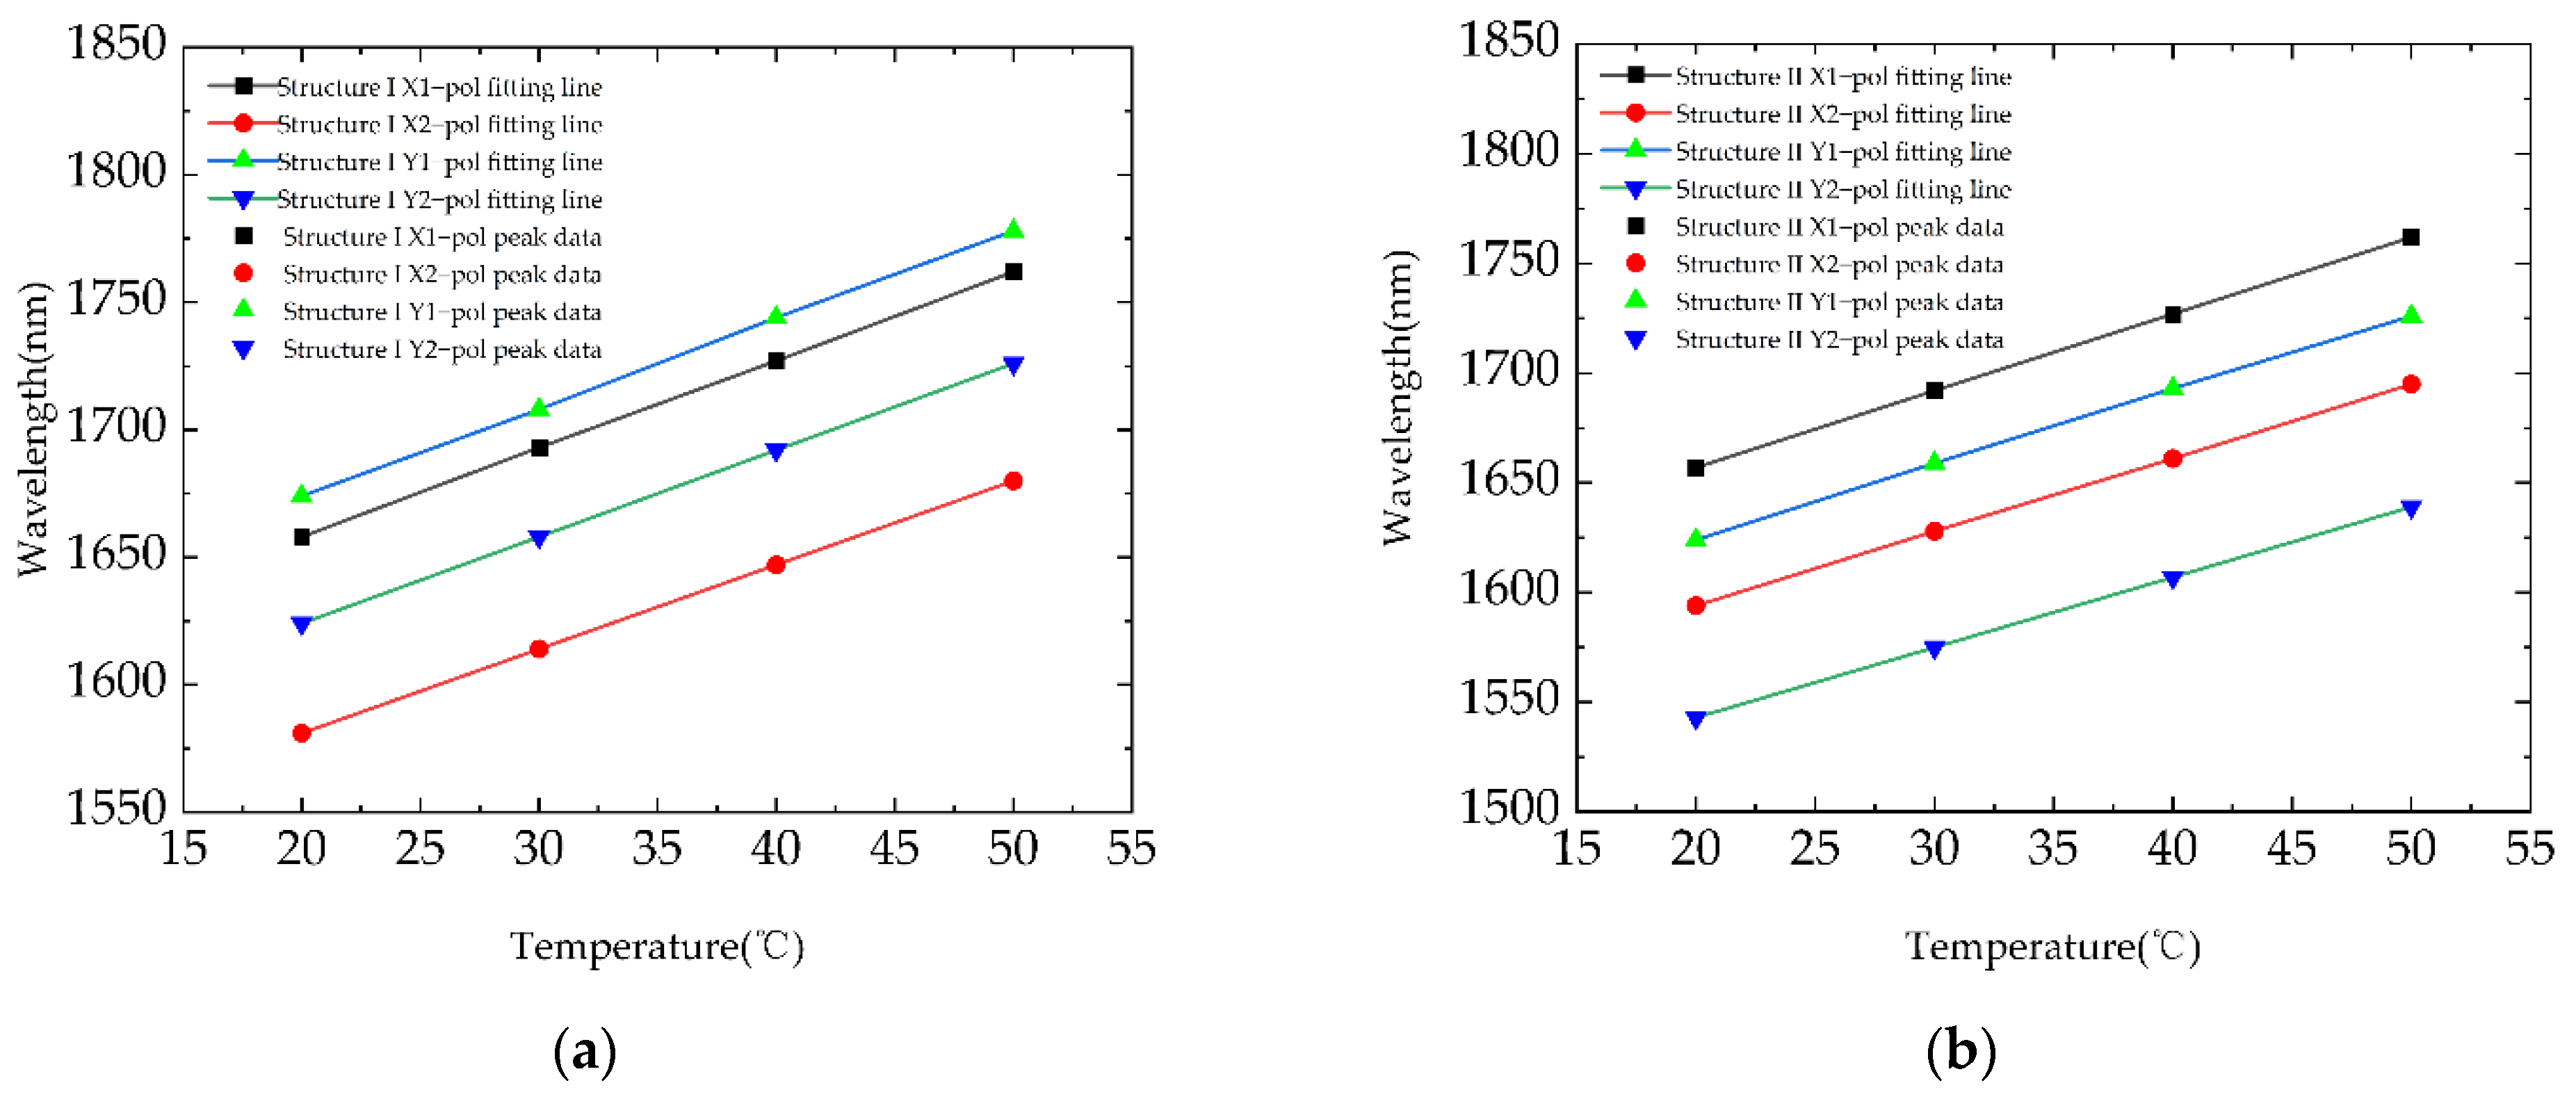
| Scheme | Polarized | Fitting | Sensitivity | R2 |
|---|---|---|---|---|
| I | x-pol1 | λ = 3.45T + 1589 | 3.45 | 1 |
| x-pol2 | λ = 3.3T + 1515 | 3.3 | 1 | |
| y-pol1 | λ = 3.48T + 1604 | 3.48 | 0.9999 | |
| y-pol2 | λ = 3.41T + 1556 | 3.41 | 0.9999 | |
| II | x-pol1 | λ = 3.5T + 1587 | 3.5 | 1 |
| x-pol2 | λ = 3.36T + 1527 | 3.36 | 1 | |
| y-pol1 | λ = 3.4T + 1556 | 3.4 | 0.9998 | |
| y-pol2 | λ = 3.2T + 1479 | 3.2 | 1 |
| Structure | Polarized | Fitting | Sensitivity | R2 |
|---|---|---|---|---|
| 300 nm | x-pol1 | λ = 3.47T + 1588 | 3.47 | 0.9998 |
| x-pol2 | λ = 3.31T + 1515 | 3.31 | 1 | |
| y-pol1 | λ = 3.51T + 1603 | 3.51 | 1 | |
| y-pol2 | λ = 3.41T + 1551 | 3.41 | 1 | |
| 200 nm | x-pol1 | λ = 3.43T + 1590 | 3.43 | 0.9999 |
| x-pol2 | λ = 3.33T + 1513 | 3.33 | 0.9999 | |
| y-pol1 | λ = 3.33T + 1513 | 3.33 | 0.9999 | |
| y-pol2 | λ = 3.37T + 1553 | 3.54 | 1 | |
| 100 nm | x-pol1 | λ = 3.56T + 1634 | 3.56 | 1 |
| x-pol2 | λ = 3.5T + 1587 | 3.5 | 0.9999 | |
| y-pol1 | λ = 3.5T + 1602 | 3.5 | 0.9999 | |
| y-pol2 | λ = 3.4T + 1551 | 3.41 | 0.9999 |
Publisher’s Note: MDPI stays neutral with regard to jurisdictional claims in published maps and institutional affiliations. |
© 2021 by the authors. Licensee MDPI, Basel, Switzerland. This article is an open access article distributed under the terms and conditions of the Creative Commons Attribution (CC BY) license (https://creativecommons.org/licenses/by/4.0/).
Share and Cite
Wang, Q.; Zhang, X.; Yan, X.; Wang, F.; Cheng, T. Design of a Surface Plasmon Resonance Temperature Sensor with Multi-Wavebands Based on Conjoined-Tubular Anti-Resonance Fiber. Photonics 2021, 8, 231. https://doi.org/10.3390/photonics8060231
Wang Q, Zhang X, Yan X, Wang F, Cheng T. Design of a Surface Plasmon Resonance Temperature Sensor with Multi-Wavebands Based on Conjoined-Tubular Anti-Resonance Fiber. Photonics. 2021; 8(6):231. https://doi.org/10.3390/photonics8060231
Chicago/Turabian StyleWang, Qiming, Xuenan Zhang, Xin Yan, Fang Wang, and Tonglei Cheng. 2021. "Design of a Surface Plasmon Resonance Temperature Sensor with Multi-Wavebands Based on Conjoined-Tubular Anti-Resonance Fiber" Photonics 8, no. 6: 231. https://doi.org/10.3390/photonics8060231