Article

Optical Characterization of Ultra-Thin Films of Azo-Dye-Doped Polymers Using Ellipsometry and Surface Plasmon Resonance Spectroscopy

1
Department of Chemistry, Faculty of Sciences, Mohammed V University, Rabat BP 1014, Morocco
2
Optics and Photonics Center, Moroccan Foundation for Advanced Science, Innovation and Research, Rabat BP 10100, Morocco
3
Frontiers Biosciences, Osaka University, Osaka 565-0871, Japan
4
Department of Applied Physics, Osaka University, Osaka 565-0871, Japan
*
Author to whom correspondence should be addressed.
Photonics 2021, 8(2), 41; https://doi.org/10.3390/photonics8020041
Submission received: 28 December 2020 / Revised: 19 January 2021 / Accepted: 27 January 2021 / Published: 5 February 2021

Abstract

:
The determination of optical constants (i.e., real and imaginary parts of the complex refractive index ( n c ) and thickness ( d )) of ultrathin films is often required in photonics. It may be done by using, for example, surface plasmon resonance (SPR) spectroscopy combined with either profilometry or atomic force microscopy (AFM). SPR yields the optical thickness (i.e., the product of n c and d ) of the film, while profilometry and AFM yield its thickness, thereby allowing for the separate determination of n c and d . In this paper, we use SPR and profilometry to determine the complex refractive index of very thin (i.e., 58 nm) films of dye-doped polymers at different dye/polymer concentrations (a feature which constitutes the originality of this work), and we compare the SPR results with those obtained by using spectroscopic ellipsometry measurements performed on the same samples. To determine the optical properties of our film samples by ellipsometry, we used, for the theoretical fits to experimental data, Bruggeman’s effective medium model for the dye/polymer, assumed as a composite material, and the Lorentz model for dye absorption. We found an excellent agreement between the results obtained by SPR and ellipsometry, confirming that SPR is appropriate for measuring the optical properties of very thin coatings at a single light frequency, given that it is simpler in operation and data analysis than spectroscopic ellipsometry.

Graphical Abstract

1. Introduction

Surface plasmons (SPs) are electromagnetic waves that are bound to metal/dielectric interfaces and are capable, among other things, of yielding the optical properties of very thin films (i.e., down to few angstroms) deposited on metal layers [1,2,3]. Optical characterization (i.e., determination of the complex refractive index ( n c ) and thickness ( d )) of thin films is required inasmuch as these films find applications in optoelectronics and photonics. Azo-dye-containing polymers are no exception in this regard. Besides SPs, other techniques can be applied to thin films, such as spectroscopic ellipsometry (SE) and photothermal deflection (PTD) spectroscopy. The latter can be applied to dye-doped polymers to measure optical absorption, requiring optical modeling such as Kramer–Kronig to get the refractive response. Unlike PTD, surface plasmon resonance (SPR) spectroscopy yields a direct measurement of the complex refractive index (i.e.,   n and κ ) without the need for data transformation. PTD may be useful, however, where there is a necessity to differentiate between scattering and absorption losses [4,5]. In this paper, we report on the optical characterization of very thin films (thickness: ~   58   nm ) of guest–host azo-dye-doped polymers at different dye/polymer concentrations. We use SP resonance (SPR) spectroscopy and spectroscopic ellipsometry (SE) to independently measure n c and d of our samples by both techniques. The experimental SPR spectra are theoretically compared to Fresnel’s reflectivity calculations of the layers system used in our study, and SE results are rationalized by the Lorentz equation for the resonance characteristics (i.e., the absorption of the azo dye, the host polymer being transparent in the frequency range studied, and Bruggeman’s effective medium approximation for the dye polymer system, which is considered as a composite material).
SPs and localized surface plasmons (LSPs) were reported long ago [6,7], and their use is of the utmost importance in, for example, the field of bio-sensing [8,9,10], enhanced spectroscopies [11], dye-sensitized solar cells [12], and photocatalysis [13]. Important reviews summarize the developments in the field [9,14,15,16,17,18,19]. The research discussed in this paper is part of a series of works published by our group in the field of plasmonics, combining metals and dielectric organic materials. This includes work on surface-enhanced visible absorption of dye molecules by LSPs at gold nanoparticles [11], optical characterization of nano-thin layers of dielectric and metals [1,2,20,21,22], sensing of photoreactions in molecularly thin layers, plasmons coupling at metal-insulator-metal (MIM) structures, glucose sensing using such structures [23,24,25], plasmons and waveguides (WGs), WG–WG coupling generating Fano resonances (FR), external control of FR by light action, and so on (for examples, see [26,27]).
Azo-dye-containing materials have been studied extensively in past decades for applications in holography and optical data storage [28,29], nonlinear optics (NLO), electro-optic modulation (EO), second-harmonic generation (SHG) [30,31,32,33], photomechanical actuation and matter motion, and so on [34,35,36,37,38,39,40]. Azo dyes also have potential applications in dye chemistry and bio-photonics [41,42], driving a natural interest in their optical characterization, namely the determination of the real and imaginary parts of n c as a function of the wavelength of light. For example, Prêtre et al. developed a method for calculating the real and imaginary parts of n c and the first order molecular hyperpolarizability of NLO azo-polymers for SHG based on UV–vis absorption spectroscopy and SE [43], and Bodarenko et al. determined n c for an azo-dye-doped polymer by SE, driven by the need for application of EO polymers in silicon-hybrid-organic photonics [44]. Several other researchers determined the optical properties of azo-dye-containing materials by SE [43,45,46]. The investigation of the optical properties of the DR1/PMMA nanocomposite material, which is considered as a mixture of two constituents (i.e., DR1 and PMMA), requires the use of a mixing law describing this material as an effective medium. Maxwell–Garnett (MG) and Bruggeman (BR) theories are usually employed to model the observations for composite materials [47,48]. It is not the purpose of this paper to discuss the detailed differences between these two theories, and we are only stating their usefulness in describing dye-doped polymer systems. For the DR1/PMMA material studied in this paper, we found that BR’s theory better fits our observations compared to MG. Other authors compared the usefulness of the two theories to model the same type of materials and found that BR is more appropriate than MG for modeling azo-dye-doped PMMA [45], and that BR theory is appropriate for modeling NLO guest–host systems [46,49].
In this paper, we determine the real and imaginary parts of n c for Disperse Red One (DR1), an azo dye that is well known for its photoisomerization and NLO properties [50], incorporated into a poly-methyl-methacrylate (PMMA) matrix at different dye/polymer concentrations by using SPR and SE, and we show that there is an excellent agreement between SPR and SE in the determination of the real and imaginary parts of n c for quite thin (i.e., 58 nm) DR1/PMMA films. For this range of thicknesses of the DR1/PMMA dielectric layer, only SP is observed (vide infra), and waveguides occur for thicker films [51].

2. Materials and Methods

For UV–Visible absorption, SPR, and SE measurements, we prepared DR1/ PMMA thin films in the following manner. Commercially available DR1 and PMMA (product reference 182230), with an average molecular weight of Mw ~120,000 and a glass transition temperature Tg of 110 °C, were purchased from Sigma-Aldrich, and were used without purification. The statistical segment length of the PMMA (density: ~1.188 g · cm 3 ) used in our study is not available to us, however the statistical segment length of PMMA of a density of 1.13 g · cm 3 is 6.5 Å [52]. A set of mixture solutions of DR1 and PMMA with different concentrations was prepared. First, we dissolved PMMA in chloroform with 0.83 weight percent (% w/w) concentration, and we stirred the solution for 12 h with a magnetic stirrer. Then we added the DR1 powder into the PMMA solution with 8%, 10%, and 12% w/w relative to PMMA. The DR1/PMMA solutions were also stirred for 12 h. The prepared solutions were then spin-coated onto cleaned glass substrates with appropriate speed to achieve the desired film thickness. Spin coating was performed with 5500 rpm to obtain thin films with thicknesses of ~ 58   nm . Finally, the films were dried at 80 °C for 30 min, followed by 115 °C for 1 min to remove the solvent remaining after spin-coating. We measured the film’s thickness, d , by a profilometer (Bruker), at four different positions for each sample, and we found that our samples were homogeneous with d = 58   nm ± 4   nm .

3. Results and Discussion

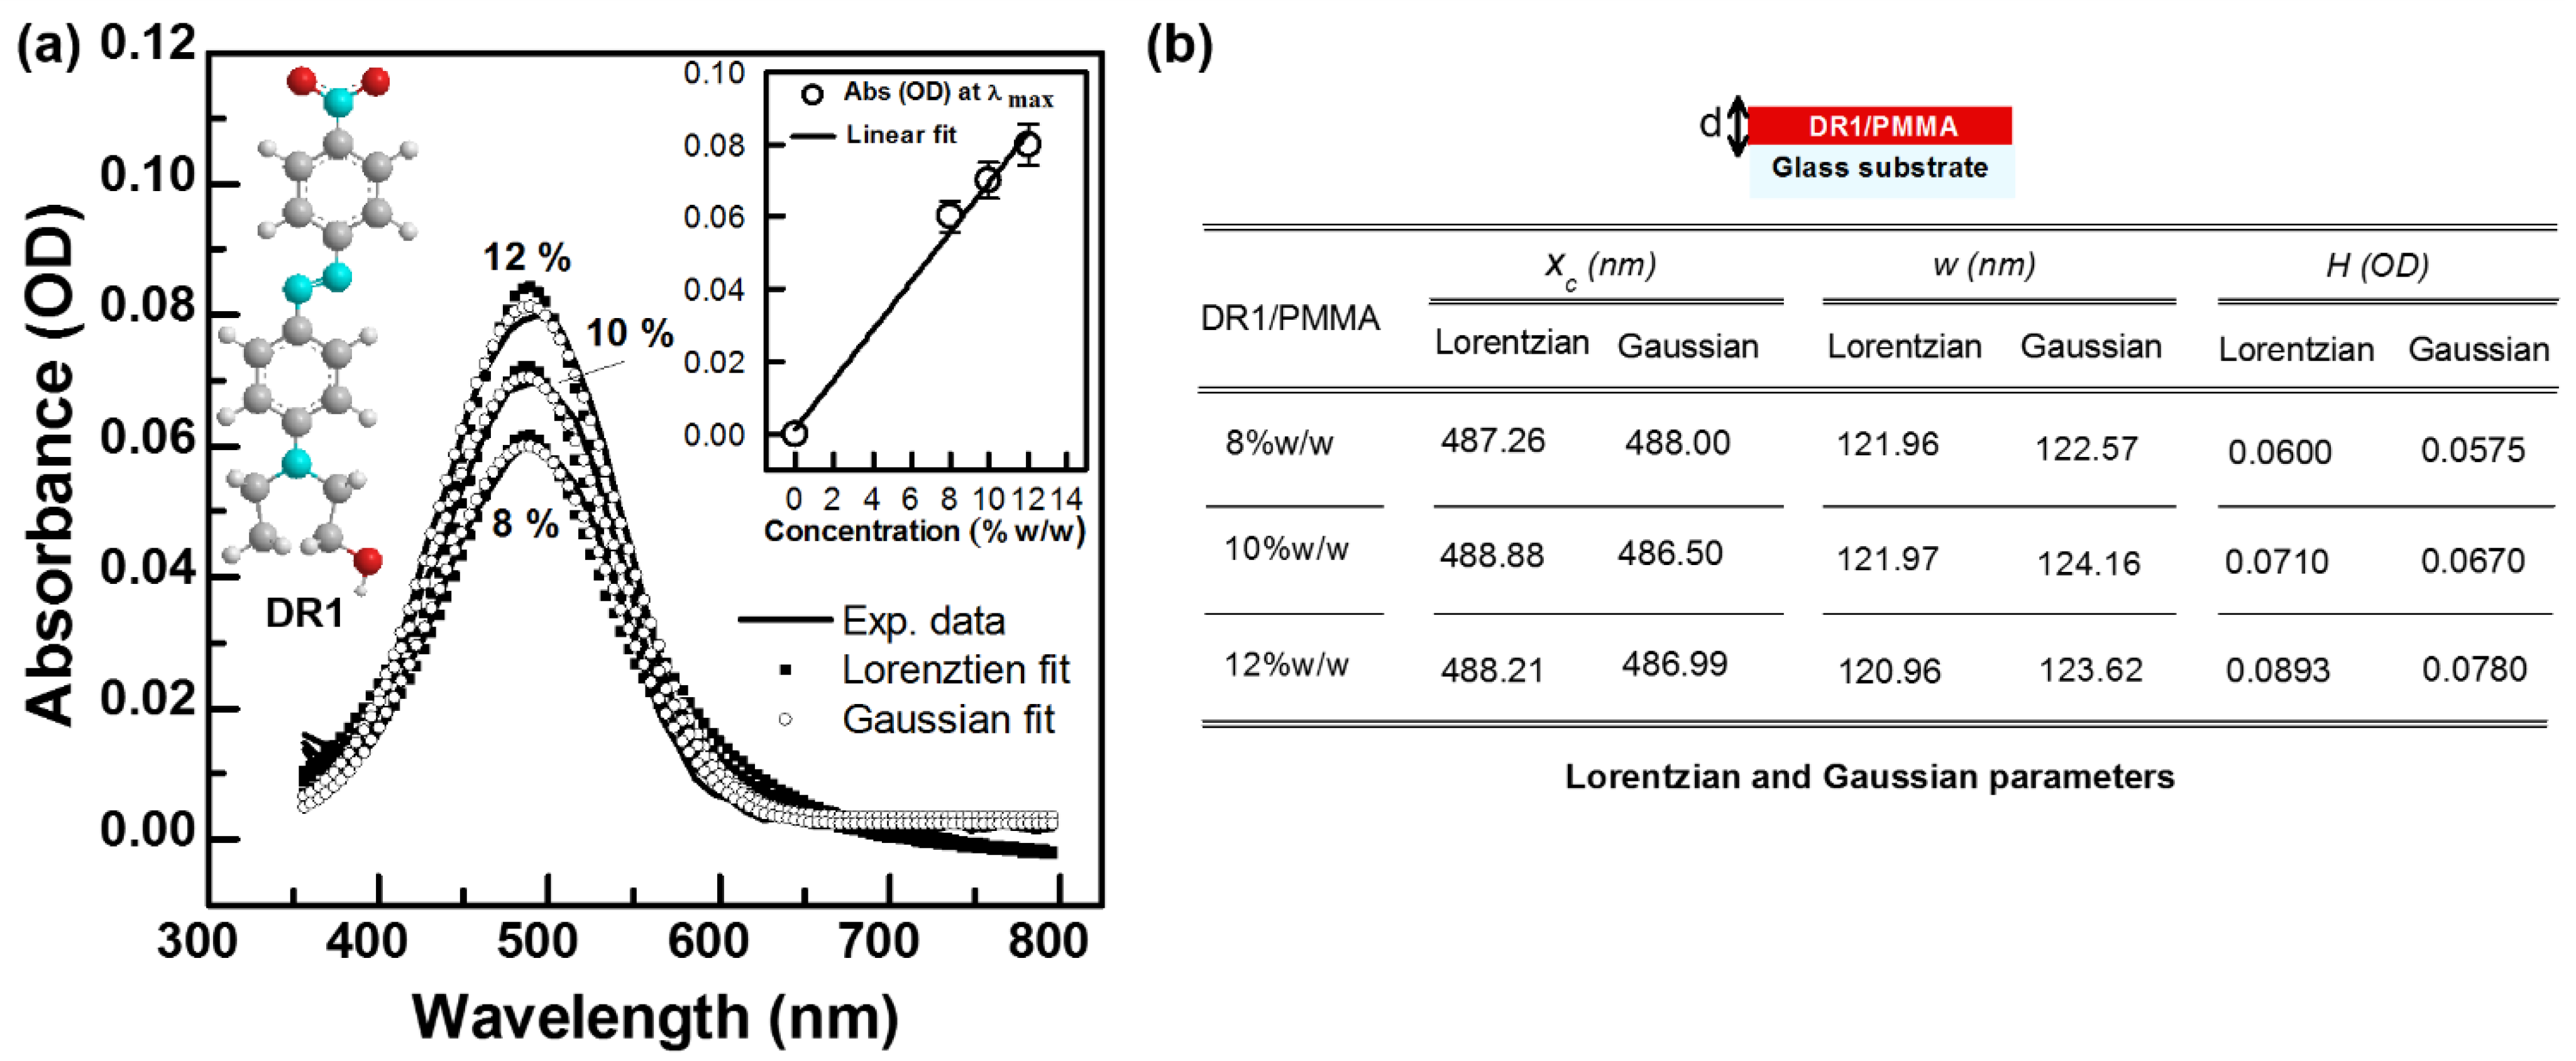
3.1. UV-Visible Spectroscopy

The absorption spectra of the film samples were measured by using a UV–visible spectrophotometer (Perkin Elmer-Lambda 1050). Figure 1a shows the absorption spectra of our film samples (e.g., of DR1/PMMA thin films) with different weight concentrations of DR1 versus PMMA C (% w/w), and the same thickness (i.e., ~ 58   nm ). For all the films prepared, the maximum absorption is observed at 488 nm and is assigned to the π → π* transition of trans-DR1, as is well known from the literature [50].
The inset to Figure 1a shows that the maximum absorption increases linearly with the increased concentration C (% w/w) of the dye according to A b s   ( O D ) = ε t · d · C (i.e., the Lambert-Beer law), where ε t is the molecular extinction coefficient of trans-DR1, d the thickness of the DR1/PMMA film, and C the concentration of DR1. Aggregation may occur when dye concentration exceeds 12% in weight [53,54]; however, in our case, we did not observe aggregation of DR1 at 12% w/w, since the shape of the absorption spectrum of the 12% sample is the same as those at lower concentrations, and the linear increase of the absorbance with the concentrations extrapolates to the origin (see inset to Figure 1a). This indicates that the chromophores can be considered as isolated for all concentrations studied.
Lorentz and Gaussian functions curve fitting are applied to the UV–visible spectra of the DR1/PMMA films by using the equations shown in the caption to Figure 1a for each function. Where   x c , is the center of the peak, w is the width of the peak at half height, and H is the amplitude (in OD units) defined by H = 2 A / w π for the Lorentzian and by H = A / w π / 4 ln ( 2 ) for the Gaussian (where A is the area under the absorption band). These parameters (i.e., x c , w , and H ) are the most representative of each spectrum in Lorentz and Gaussian fitting. Each of the DR1/PMMA spectrums has unique Lorentz parameters as shown in Figure 1b. For all concentrations, we found that x c is located at ~ 488   nm (corresponding to central energy of ~   2.54   eV ). H has different values corresponding to the optical densities of the different concentrations of DR1. Figure 1a shows that the Gaussian function fits the absorption spectra nicely as well and yields nearly the same theoretical spectra as those obtained by the Lorentzian fit, except at the tail ~ 700 nm, where the Gaussian better fits the experimental data than the Lorentzian. The characteristic parameters of both functions, summarized in the table in Figure 1b, are close enough. We extracted the extinction coefficient of our sample using both sets of parameters, and we found nearly the same values of the extinction coefficients of the samples at the three concentrations studied. Indeed, using κ = ( λ   α / 4 π ) for the extinction coefficient of the sample, with α = 2.303 H / d being the optical density of the sample in units of [43], we found the values of 0.0925   ( 0.088 ) , 0.1094 (0.1033), and 0.1279   ( 0.1202 ) at 488 nm, and 0.0065 (0.0069), 0.0108 (0.0093), and 0.0115 (0.0105) at 632.8 nm, for κ for the 8%, 10%, and 12 % samples, respectively. The values between parentheses are those corresponding to the Gaussian function. The values of κ found by UV–vis spectroscopy are nearly the same as those we found by SPR spectroscopy and SE (vide infra).

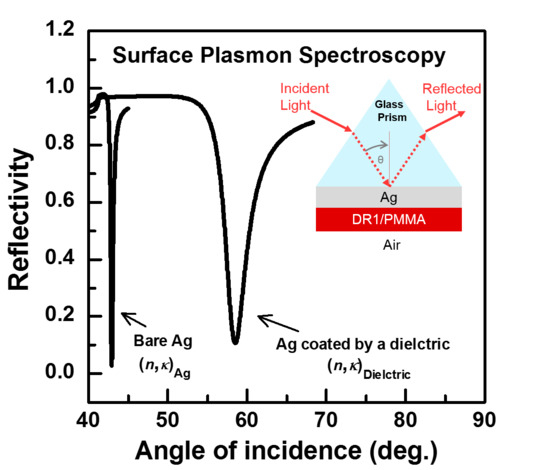
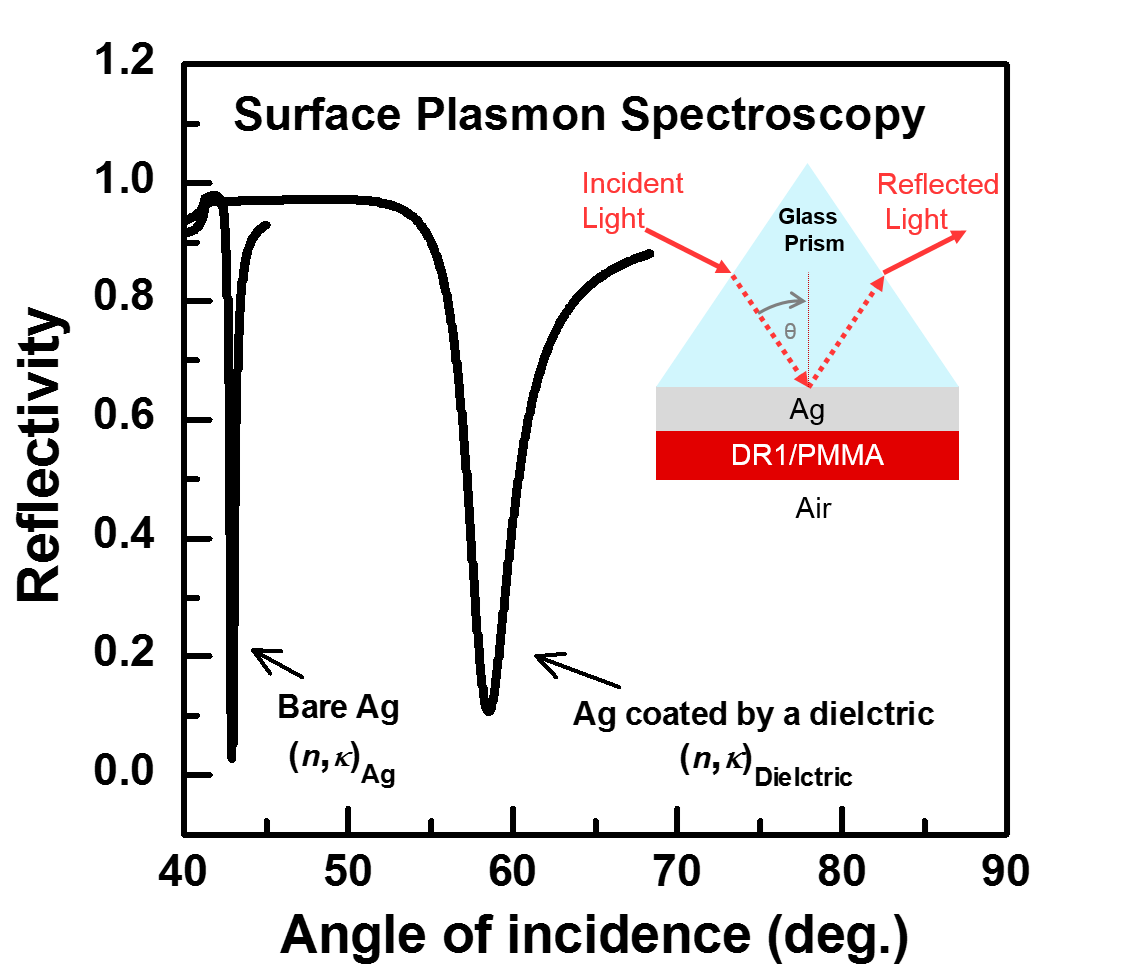
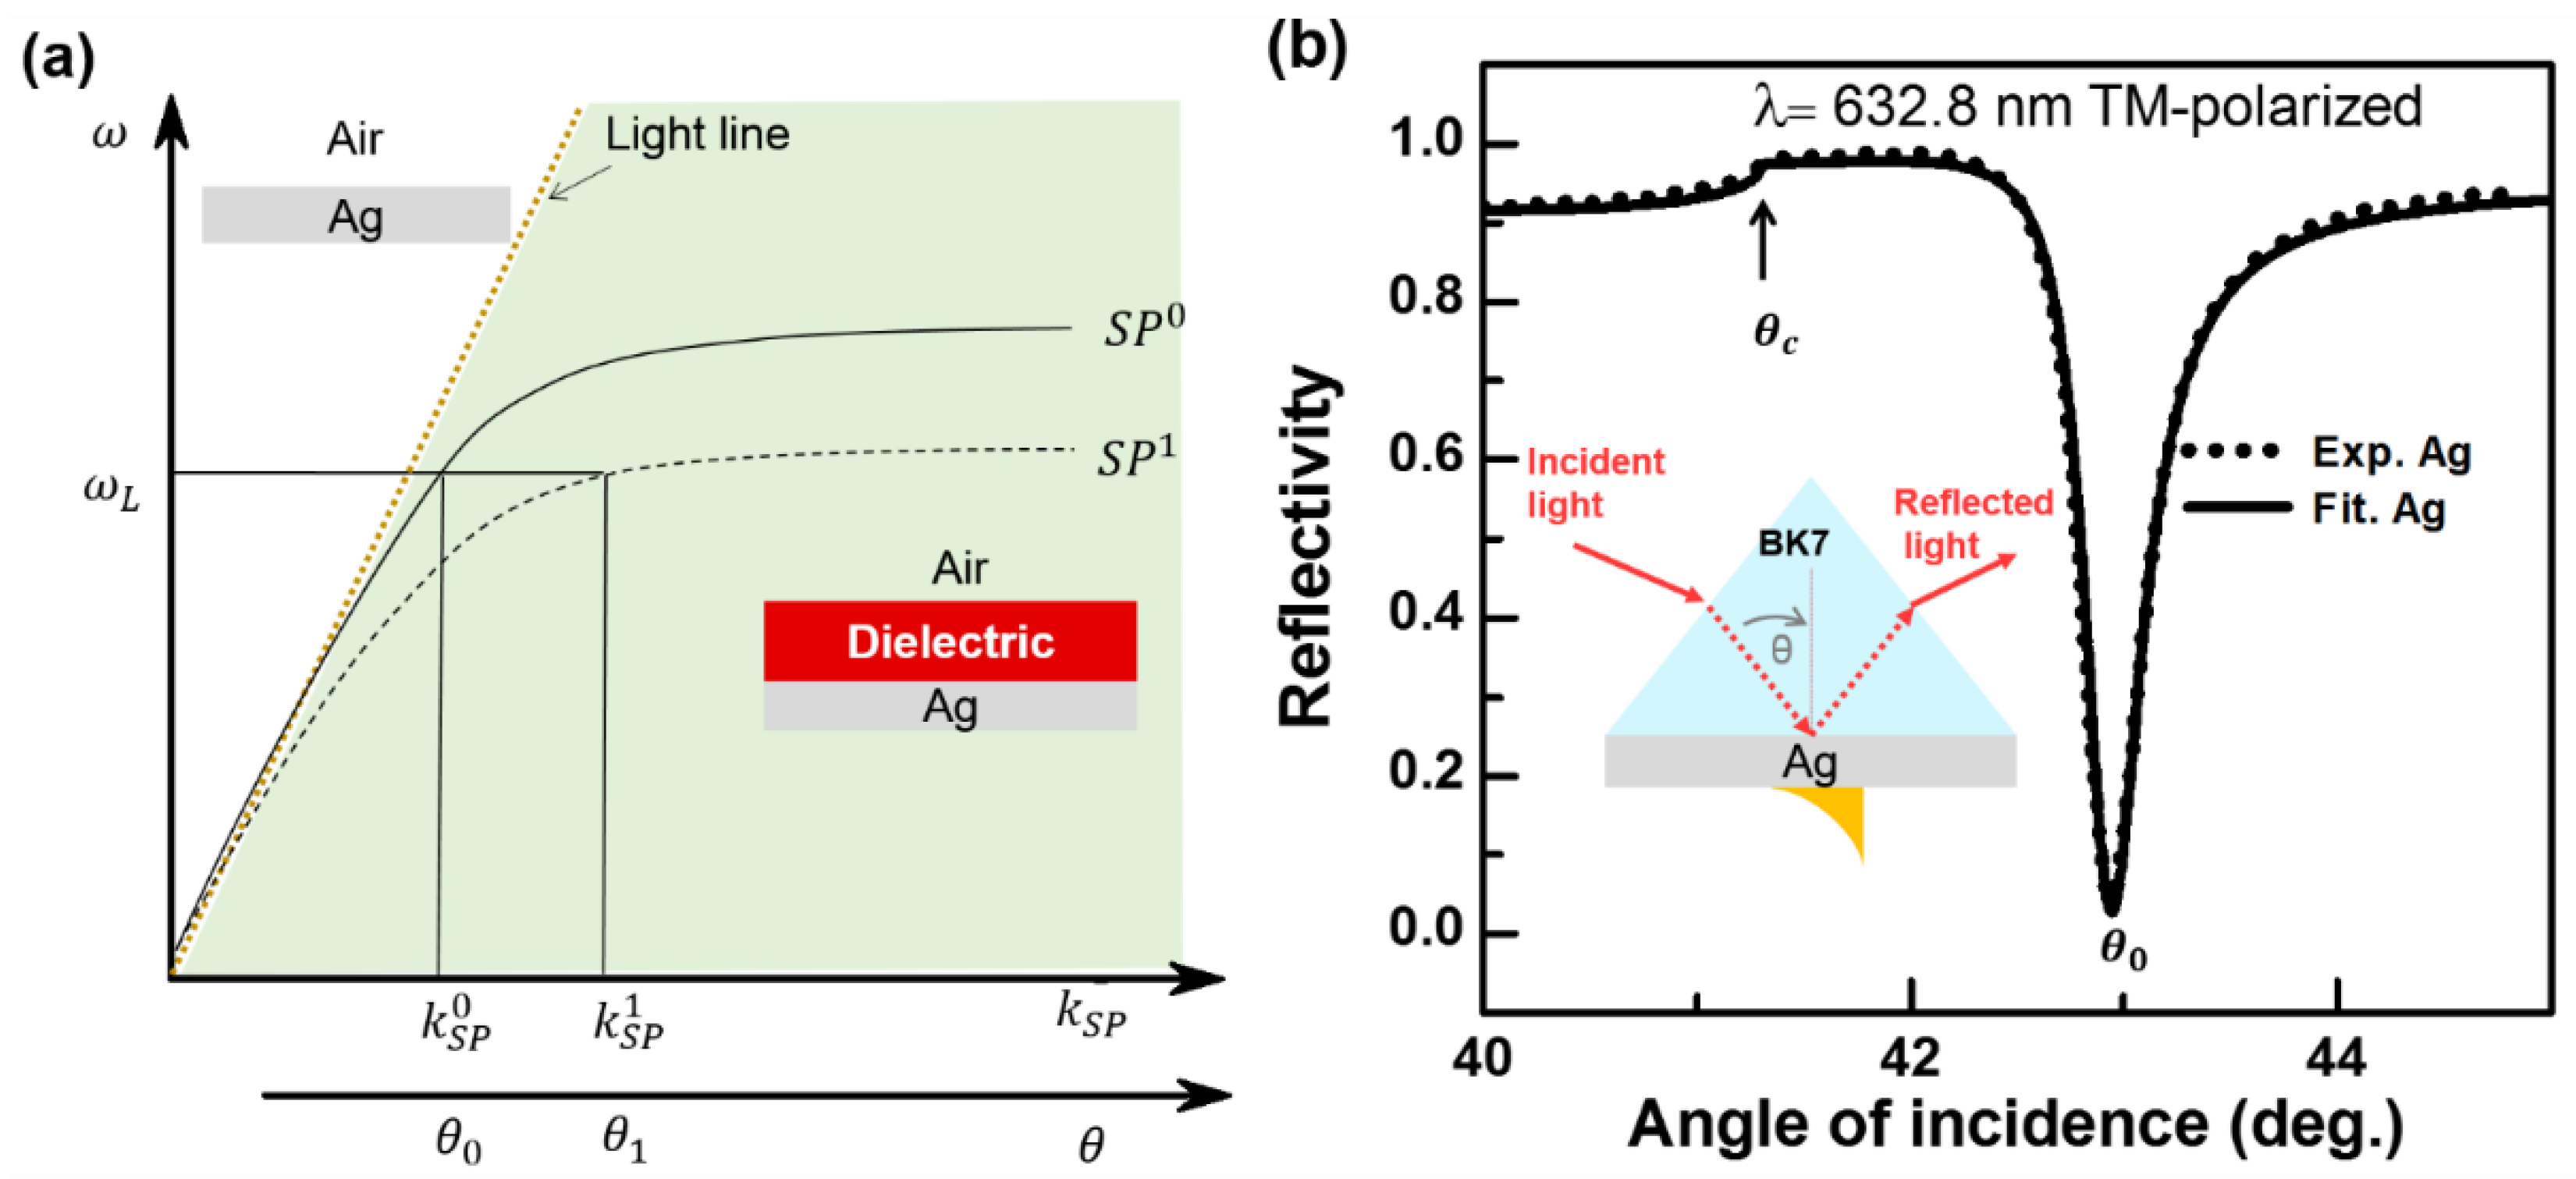
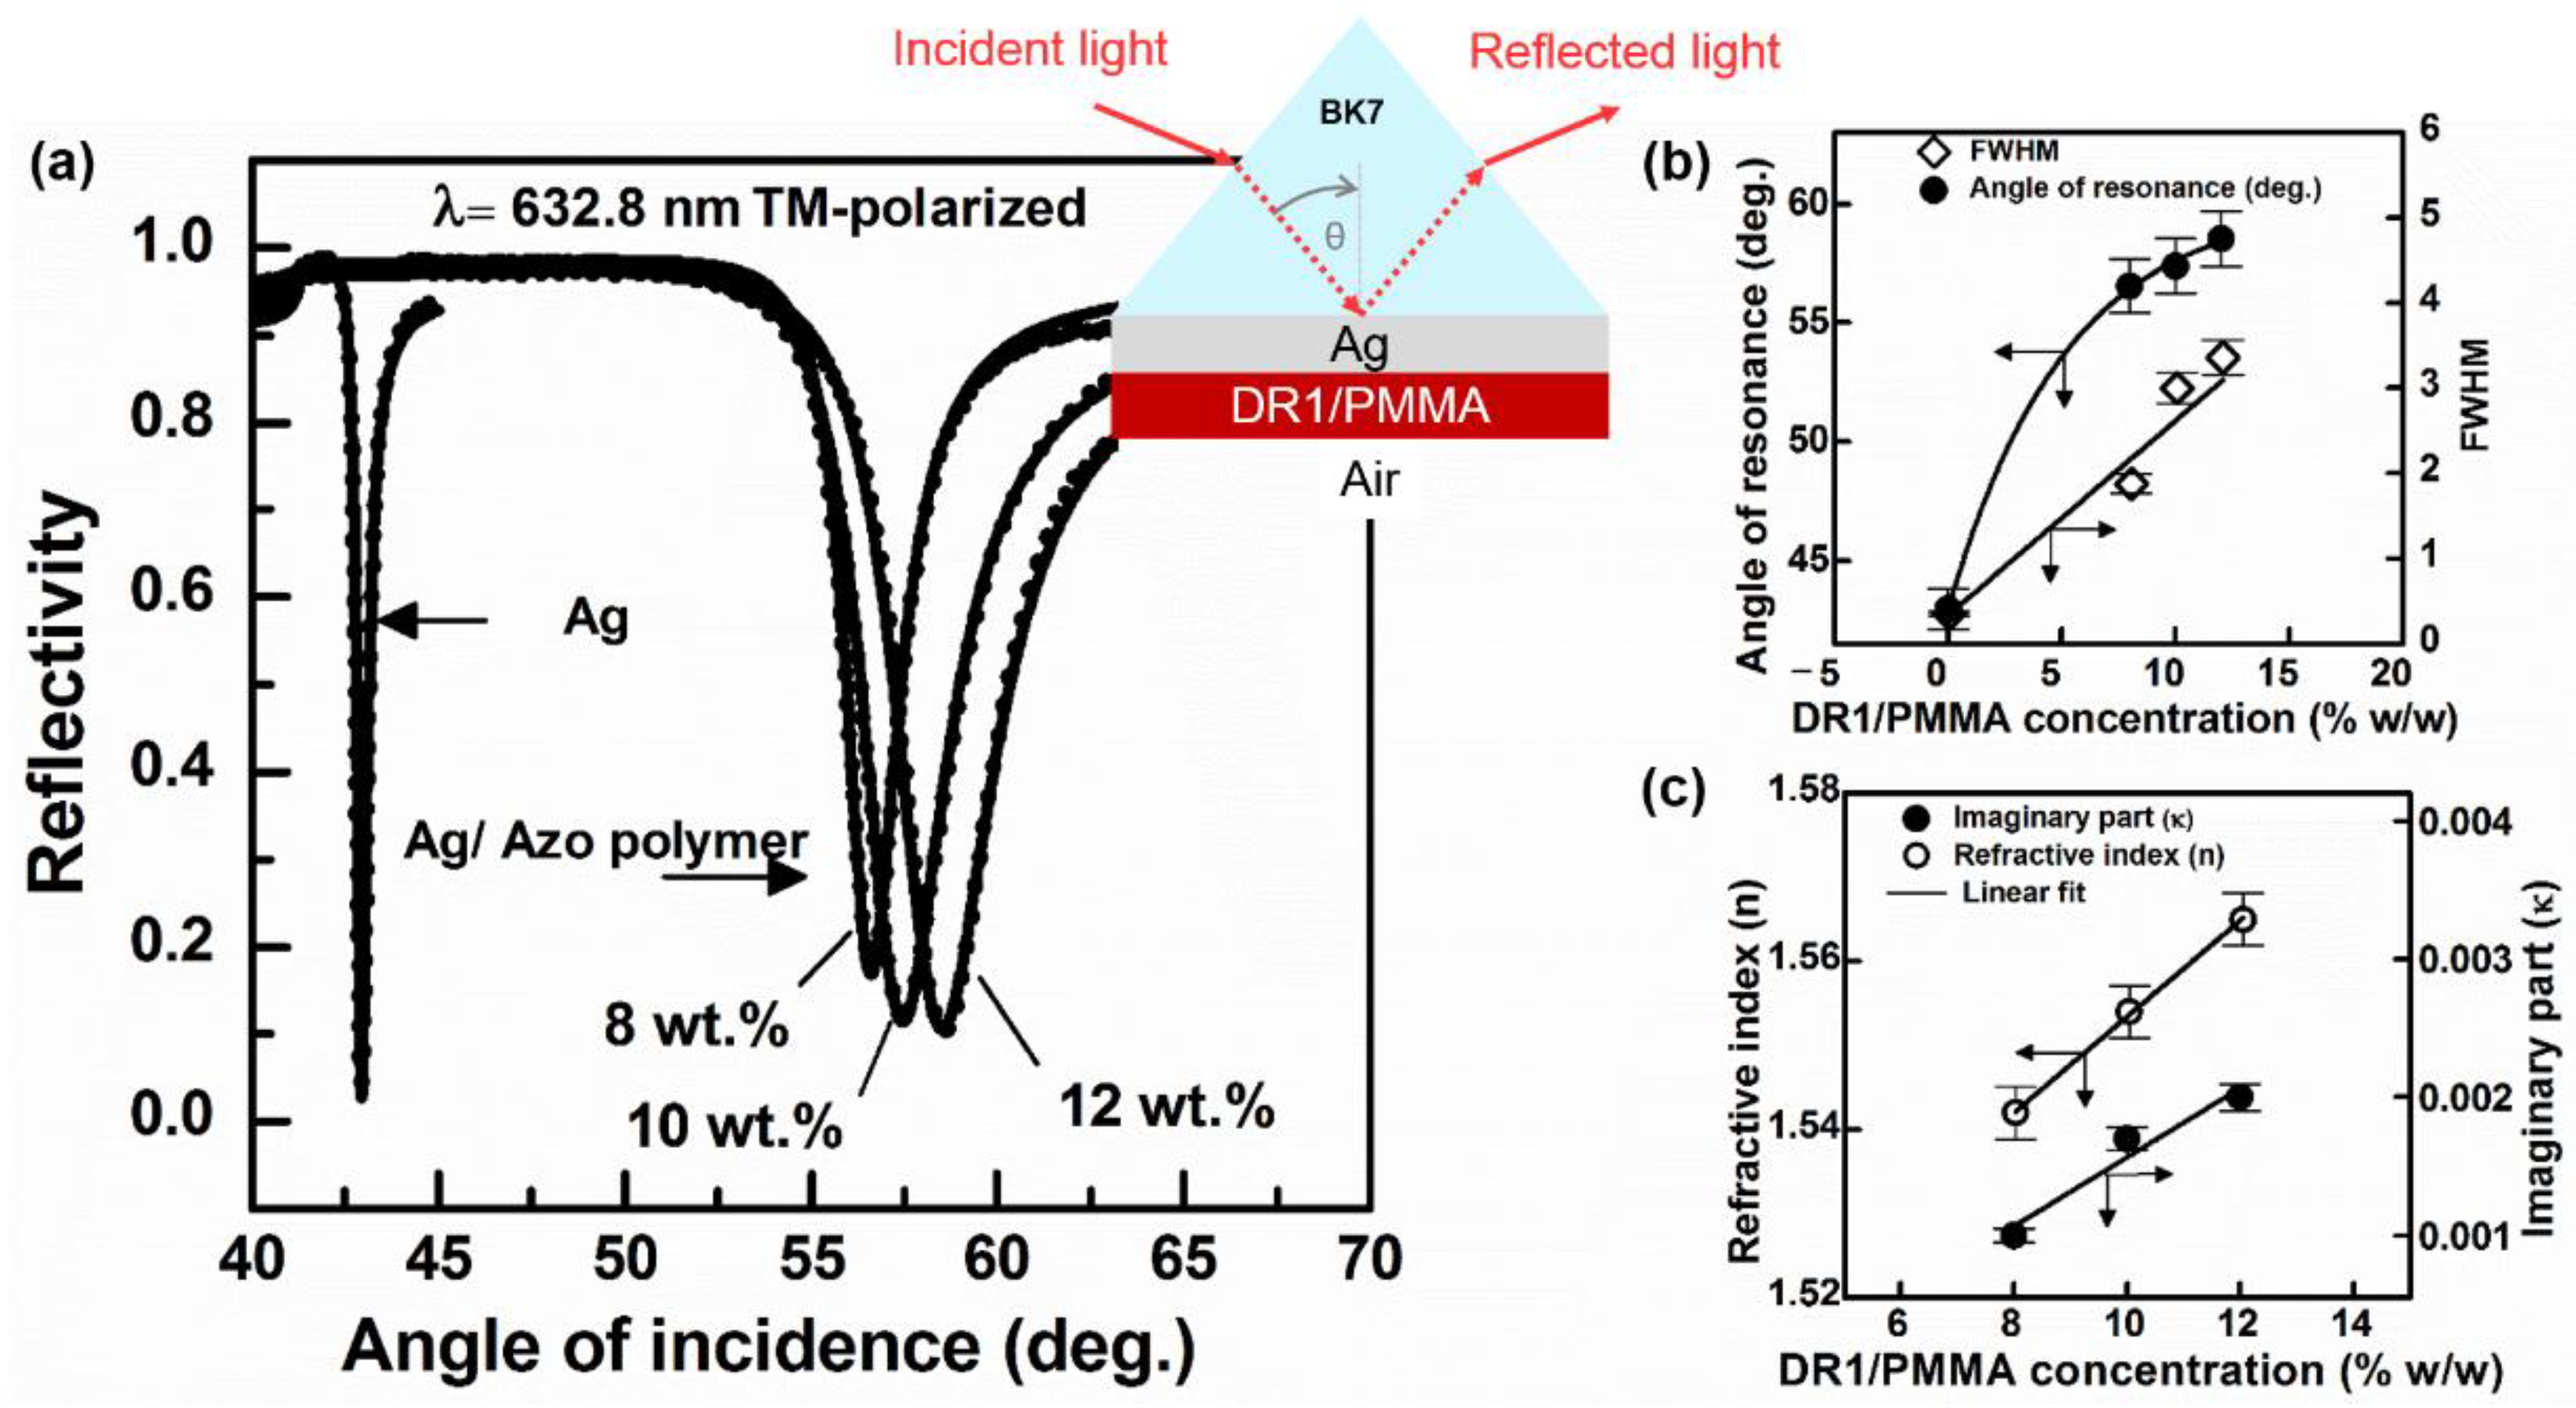
3.2. SPR Spectroscopy

We will briefly recall the principle of SPR spectroscopy, and how it is used to calculate the optical properties of very thin coatings (up to a few tens of nanometers). Then, we will discuss our experimental results of SPR observations in films of the same thickness and different dye concentrations. SPs are electromagnetic waves that are bound to and propagate along the interface between metal and dielectric. They penetrate to different extents into the metal and the dielectric, with penetration depths given by their field amplitudes decaying exponentially perpendicular to the interface [1,55,56,57]. The dispersion relation of SPs is given by:
k S P = ω c ε m ( ω ) . ε d ( ω ) ε m ( ω ) + ε d ( ω )
where k S P 0 is the longitudinal component of the SP wave vector and is proportional to the wave frequency ω , and c is the speed of light in vacuum. ε d ( ω ) and ε m ( ω ) are the complex dielectric constants of the dielectric and the metal, respectively, and they are light-frequency-dependent. A free wave of wave-vector k and frequency ω propagating in the dielectric, at an incidence angle θ , is characterized by:
k p h o t o n 0 = ω c ε d ( ω ) sin θ
Equations (1) and (2) indicate that a free wave, characterized by a line (i.e., the light line on Figure 2a), cannot couple to an SP wave unless its k vector is augmented, by, for example, adding a prism, or a grating that brings the additional longitudinal k vector required for coupling [1]. When coupling takes place, a resonance phenomenon is observed in the attenuated total reflection (ATR) spectrum, as can be seen from, for example, an angular scan (Figure 2b). In such a scan, θ c is a critical angle at which light incident on the prism/metal is totally reflected from the base of the prism, a phenomenon referred to as total internal reflection (TIR). Below θ c , the metal film acts as a mirror, and reflectivity is still high with little transmission, while above θ c , TIR takes place, and ATR occurs via coupling to a resonance (i.e., SPR). A dip occurs in the reflectivity curve at θ 0 . The coupling angle (i.e., θ 0 ) is given by the energy and momentum matching condition between surface plasmons and photons. When a dielectric coating is applied to the metal layer, the resonance condition changes and θ 0 shifts to larger angles θ 1 (Figure 3a). From this shift and Fresnel’s calculations, one can calculate the optical thickness of the coating. This is what is discussed next for our DR1/PMMA thin films.
As schematically depicted in Figure 3a, the bilayer stack used for our SPR measurements consisted of an Ag layer (thickness: ~56 nm) coated with a 58-nm thin layer of DR1/PMMA. The stack was deposited onto cleaned BK7 glass slides (15 × 22 mm with a refractive index of 1.5151 at λ = 632.8 nm [58]), which were put in contact with a 90° BK7 glass prism by an index-matching oil. The DR1/PMMA dielectric layer was deposited on Ag by the spin-coating process. To measure the angle-scan ATR spectra (i.e., SPR in Kretschmann configuration), we used a custom-made optical setup, which is described in detail in [59]. To do so, the sample/prism system was mounted on a ( θ ,   2 θ ) rotating stage, where θ is the internal angle of incidence (see Figure 3a). The sample/prism system was illuminated by P-polarized (e.g., transverse magnetic (TM)-polarized) light from a Helium–Neon (He–Ne) laser operating at the wavelength of 632.8 nm, with few μ W of power to avoid absorption by the sample, even though at this wavelength the sample presents negligible absorption. The reflected light was measured by using a Si photodiode connected to a lock-in-amplifier as a function of θ . The precision of the measurement of θ was 0.018°. The error that this precision can cause on reflectivity measurements is Δ R = 7 × 10 3 .
Figure 3a shows the experimental and the theoretical fit ATR angular spectra for an Ag layer ( ~ 56   nm ) without and with DR1/PMMA (~58 nm) at different weight concentrations C (8%, 10%, and 12% w/w). Electromagnetic (EM) calculations of the reflectivity of light at multilayer structures based on Fresnel reflection were performed using a freely available software package (Winspall) to reproduce experimental ATR spectra. We used a value of the refractive index at the wavelength λ   =   632.8   nm , for BK7 prism of n g   = 1.5151 from a database [58], and we extracted the refractive index and the thicknesses of Ag, which led to the theoretical spectrum that fits the experimental one well. Theoretical fits to the experimental data yielded the values n A g = 0.0679 + i 4.087 of the refractive index and the thicknesses (i.e., 56 nm) of the Ag layer. The refractive index of silver determined in our work (0.0679 + i4.087) is close to that found in the literature (0.0562 + i4.276) [58,60]. The thickness of the Ag layer obtained from the theoretical SPR curves was identical to that measured by profilometry.
In Figure 3a, we see that the ATR scan at the prism/Ag system exhibits a sharp dip at 42.96°, due to the excitation of SP at the Ag/Air interface. The full width at half maximum (FWHM) of this dip was about 0.34°. After adding the outermost layer of 58 nm of DR1/PMMA, the resonance shifts towards higher incidence angles: 56.59°, 58.13°, and 59.66° for the DR1 concentration of 8%, 10%, and 12% w/w, respectively (Figure 3b). This figure also shows that the FWHM of the mode increases linearly with the dye concentration owing to the increase of losses (i.e., linear increase of κ with the DR1 concentration). Indeed, by fitting the experimental data of SPR observed with DR1/PMMA, we extracted the optical properties ( n and κ ) of the outermost layer (i.e., DR1/PMMA) for different concentrations of DR1 (Figure 3c). We found a linear relationship between the dye concentration and the mode shift, as well as the refractive index ( n and κ ) of the material. This result confirms the fact that both the refractive index and the extinction coefficient of material are proportional to the molecules concentration in agreement with the UV–vis data of the previous section (see also [61]). Next, we discuss the determination of n c = n + i κ , i.e., n and κ , by SE.

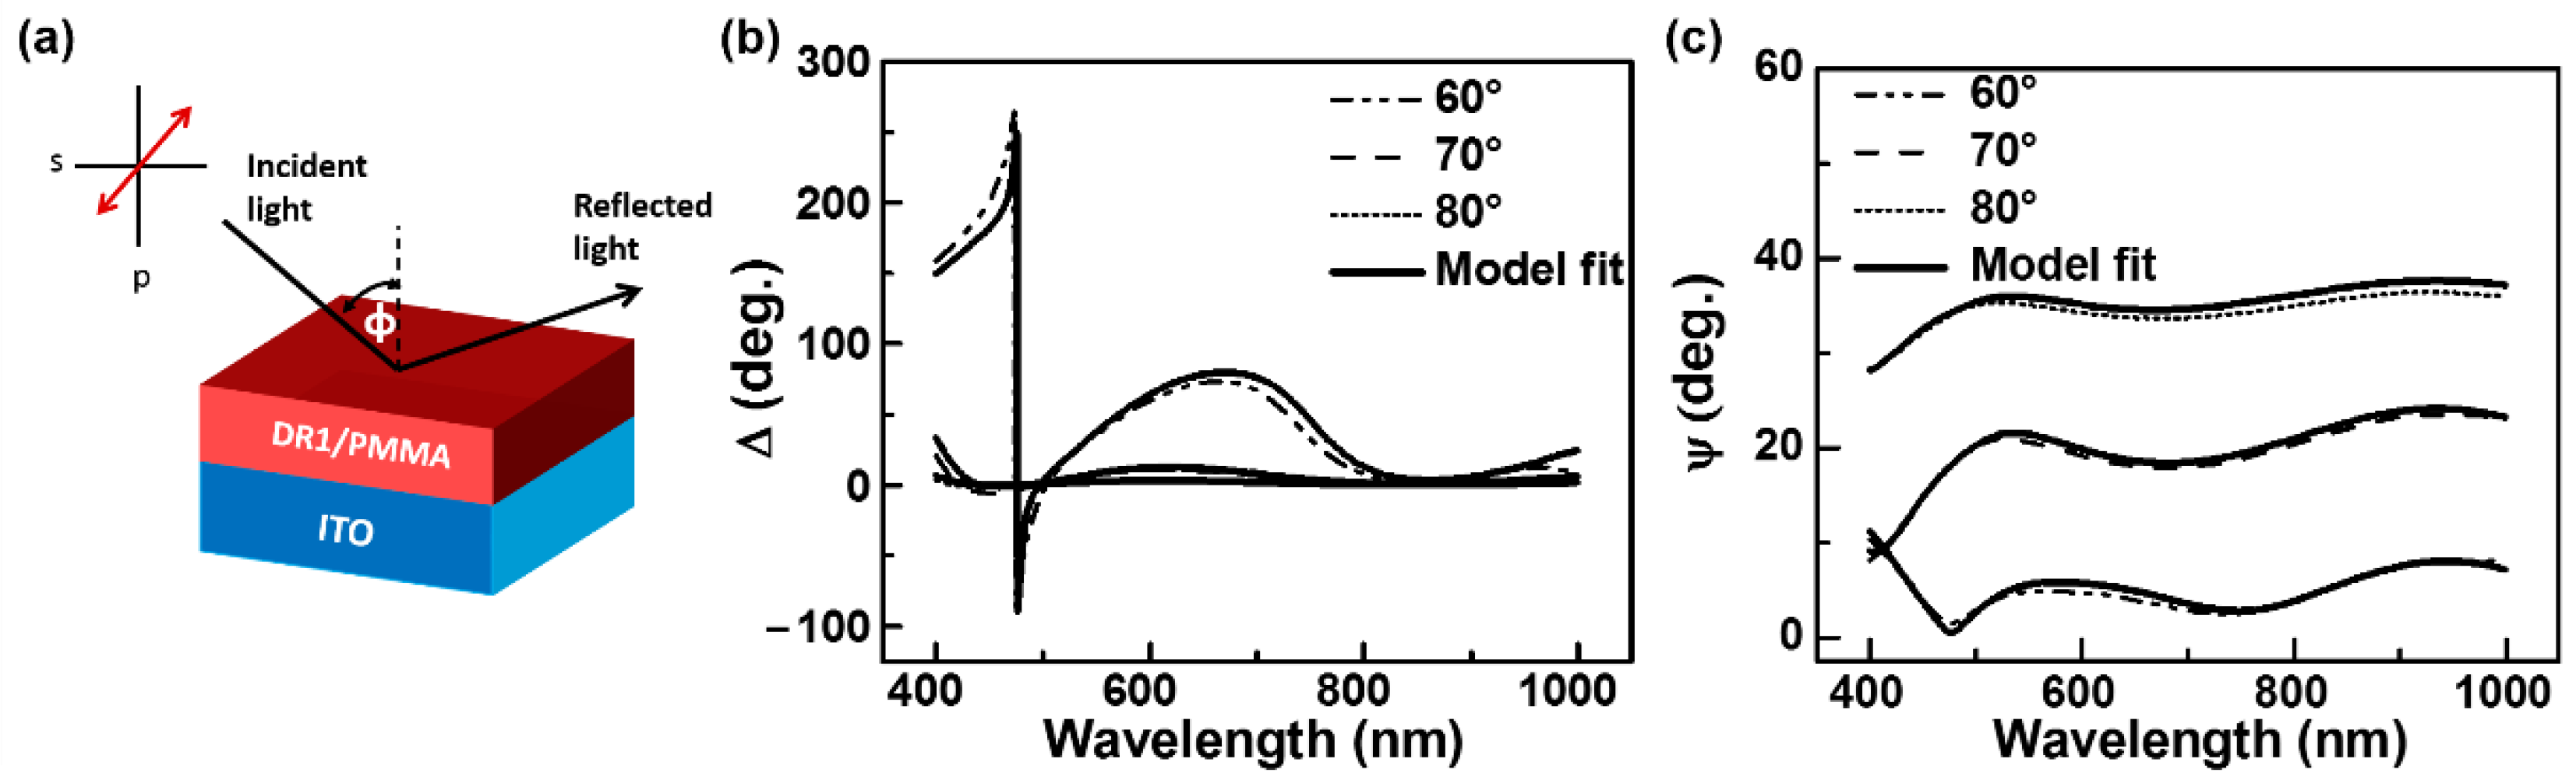
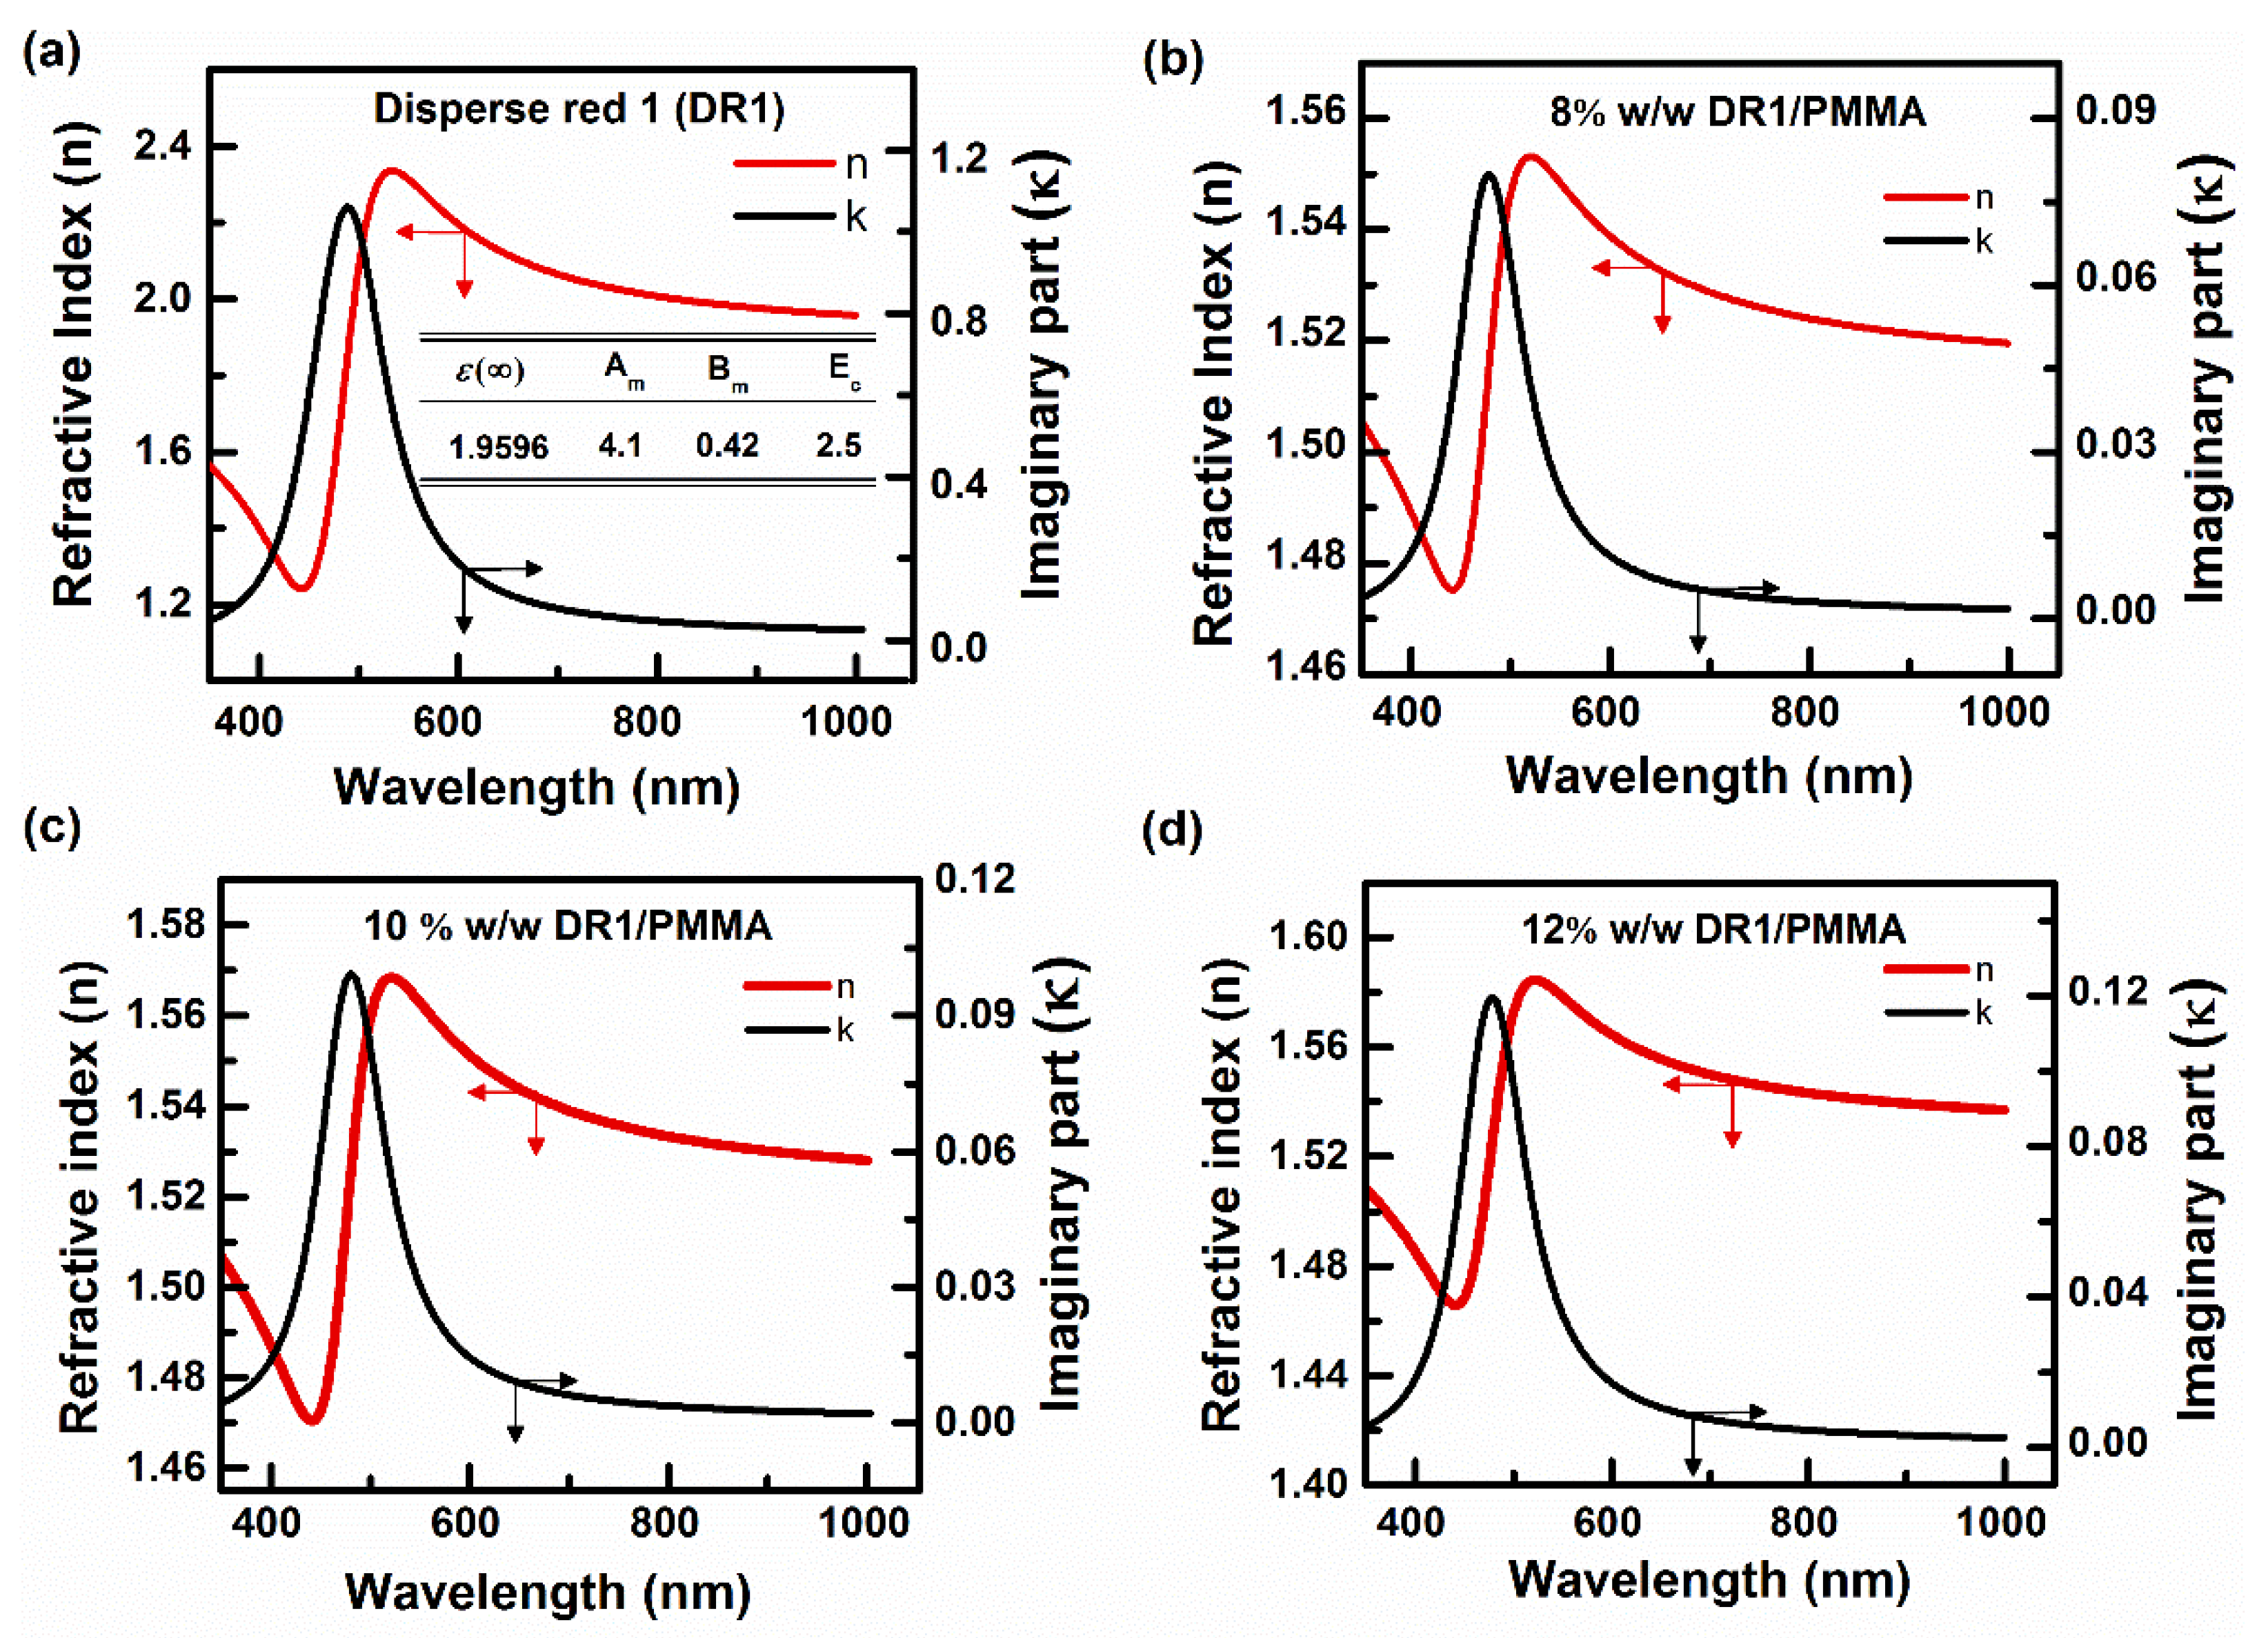
3.3. Spectroscopic Ellipsometry

Ellipsometry data were acquired using a commercially available variable angle SE system (VASETM, J.A. Woollam). The principle of operation of SE is schematically depicted in Figure 4. A light beam is first polarized by passing through a polarizer, and is then reflected from the sample surface at an angle of incidence φ. After reflection, light passes through a second polarizer, which is called an analyzer, and it falls onto the detector. Our sample consists of a thin film of DR1/PMMA (vide infra) deposited on the top of an ITO glass ( ~ 147   nm ). All measurements were performed in air at room temperature for three angles of incidence (60°, 70°, and 80°) and in the wavelength range 400–1000 nm. The data analysis was made using Complete EASE software (version 5.04). The SE method is based on Fresnel reflection coefficients measurement [62], which is given by:
ρ = r p r s = tan ( ψ ) e i Δ
where r p and r s   are the complex Fresnel reflection coefficients for parallel (P-) and perpendicular (S-) polarized (i.e., transverse electric (TE)) light to the plane of incidence, respectively, and delta (∆) and psi (Ψ) are the ellipsometry angles [62,63]. We determined the optical properties, n and κ , of DR1/PMMA at different dye concentrations, as functions of the wavelength, by fitting the ∆ and Ψ using the SE software (Figure 4). The most appropriate way of simulating the dielectric functions of the DR1/PMMA thin films is to treat the films as a mixture of two constituents. Generally, Bruggeman effective medium approximation (B-EMA) is frequently used to calculate the dielectric function of the composite layer based on the volume ratios (f) and the dielectric functions of each constituent [62,63,64]. The complex dielectric constant of DR1/ PMMA was fitted using B-EMA, given by:
f v D R 1 ε ˜ D R 1 ε ˜ ε ˜ D R 1 + 2 ε ˜ + f v P M M A ε ˜ P M M A ε ˜ ε ˜ P M M A + 2 ε ˜ = 0
where ε ˜ = ε + i ε is the effective complex dielectric function of the mixture, with ε = n 2 κ 2 and ε = 2 n κ , and ε ˜ D R 1 and ε ˜ P M M A are the complex dielectric functions of DR1 and PMMA, respectively. f v D R 1 and f v P M M A are the volume fractions of DR1 and PMMA with ( f v D R 1 + f v P M M A = 1 ) . The values of volume fractions can be calculated by using Equation (5).
                f v D R 1 = f w D R 1 f w D R 1 + ( 1 f w D R 1 ) . ρ D R 1 ρ P M M A
where f w D R 1 is the weight fraction of DR1, and ρ D R 1 = 1.1523   g · cm 3 and ρ P M M A = 1.1880   g · cm 3 are the densities of DR1 and PMMA, respectively. We determined the optical properties of the DR1/PMMA mixture as follows: for the PMMA constituent, we used the dielectric functions parameterized in the database of the software, and for the DR1 constituent (i.e., an absorbing compound), we used the Lorentz model describing absorption. The Lorentz parameters are obtained by fitting the experimental data of ∆ and Ψ of the DR1/PMMA mixture for each concentration, allowing us to extract n and κ of DR1 and the DR1/PMMA composite.
It is well known that Lorentz oscillators are primarily useful for describing resonant absorption peaks due to doping of a transparent dielectric material with an absorbing dye [63]. DR1 is one of such dyes, and it absorbs light in the UV–visible range. It has an absorption peak centered at 488 nm. When DR1 is introduced as a guest into a PMMA matrix, the absorption of the DR1 can still be described by the Lorentz formula, which gives the dimensionless complex dielectric function of DR1 as a function of the photon energy E (Equation (6)).
ε ( E ) = ε + i ε = ε ( ) + k = 1 N A k E k 2 E 2 i B k E
where ε and ε are the real and imaginary parts of the complex dielectric function of DR1, ε ( ) is its real dielectric function at infinite energy (offset term), and N is the number of oscillators. Each oscillator is described by three parameters: A κ is the amplitude of the kth oscillator in units of (eV)2, B κ is the broadening of the kth oscillator in units of eV, and E κ is the center energy of the kth oscillator [45]. For DR1, a single oscillator centered at 2.5 eV yields the best fit value, corresponding to 495 nm. This value is close to (i.e., shifted by 7 nm) the experimentally observed wavelength (i.e., 488 nm), corresponding to the maximum absorption of DR1 in the visible region of the spectrum (Figure 1a). SE data allows for the determination of n and κ of all constituents of a composite material, in our case DR1 and PMMA, as well as their composition, and we could extract n and κ of neat DR1. To do so, we used both the model of Brugemann for the composite material and the Lorentz model to account for the absorption of DR1 in the composite (vide infra). Data for PMMA is available from the literature and from the Complete EASE software. We did not measure neat PMMA independently, but the theoretical dispersion curve of PMMA extracted from the database. (i.e., from EASE software) and used in our Bruggeman effective medium match well with that of the literature [44]. Indeed, the refractive index of PMMA extracted from the EASE software at 632.8 nm is n 632.8   n m P M M A = 1.4888 , and is close enough to the value of n 632.8   n m P M M A = 1.4889 that we found in our previous works using plasmonic structures [59]. The fit parameters of DR1 corresponding to Equation (6) (i.e., ε ( ) , A 1 , E 1 , B 1 ) are shown on the table as an inset to Figure 5a. These fitting parameters allow for the determination of the dispersion curve of n and κ   as a function of the wavelength using the data of Δ and Ψ . We found the same values of the parameters of the table in the inset of Figure 5a for all 3 concentrations (i.e., 8%, 10%, and 12% of w/w) of DR1 compared to PMMA. These values yielded the best theoretical fits of the experimental data.
Figure 5 shows the dispersive curves of optical constants ( n and κ ) of neat DR1 (Figure 5a) and DR1/PMMA composite at different concentrations (Figure 5b–d) as obtained from SE experiments. Figure 5a shows that for neat DR1, the value of κ at the wavelength of maximum extinction (i.e., 495 nm) is 1.066. This is in good agreement with the value of κ (i.e., 1.077) which we extracted from [43] using the data of this reference.
The extinction coefficient   κ , which is related to the absorption coefficient α by κ = ( λ α / 4 π ) , is calculated to be 1.077 using λ = 478   nm and H / d = 123 × 10 3 cm 1 , with H / d calculated in [43], using 478 nm corresponding to the maximum absorption of DR1 measured in chloroform. Comparing n and κ of DR1/PMMA in Figure 5b–d with those for neat DR1 in Figure 5a, we see that the values of n and κ of DR1/PMMA are lower than those of neat DR1, and that n and κ increase with the increased concentration of DR1 in the DR1/PMMA composite. The molecular polarizability of DR1 is larger than that of PMMA. For both SPR and ellipsometry, the measurements at each concentration were repeated three times and the value of n and κ was calculated as the average of the three measurements for each sample. Table 1 summarizes the results of n and κ of all the samples measured with UV–vis spectroscopy, SE, and SPR, together with data from the literature [43,44]. A good agreement between the data from our paper and the literature is obtained, and interestingly enough, n and κ obtained from SE measurements are reasonably close to those obtained by SPR spectroscopy.

4. Conclusions

The optical properties, n and κ , of azo-dye-contacting materials are often researched for photonics applications, especially for NLO including EO modulation and SHG. In this paper, we determined n and κ of DR1-doped PMMA for different dye concentrations, a feature which is useful for researchers working in the fields of, for example, NLO and plasmonics. We also demonstrate the potential of SPR spectroscopy in determining such properties for ultrathin films of the NLO dye-doped polymer studied, especially that SPR mode shifts were observed at different concentrations of DR1. Both the determination of n and κ and the observed SPR modes shifts for different dye concentrations constitute the originality of this work. We also used UV–vis spectroscopy and SE with Lorentz theory and Bruggeman effective medium approximation to determine n and κ of the films studied. The results obtained by SPR measurements are in good agreement with those obtained by UV–vis and ellipsometric spectroscopies.

Author Contributions

Z.S. conceived the idea and wrote the paper; N.A. and S.R. did the experiments; H.I. and Y.I. helped with the spectroscopic ellipsometry experiments and discussed the results; Z.S. gave overall guidance. All authors have read and agreed to the published version of the manuscript.

Funding

This work was funded by the priority research area project “Next Generation Optical Media Recordable Via Nano-photonics” (MEFCRS PPR/2015/69) funded by the Moroccan Ministry of Higher Education and Research.

Data Availability Statement

The data is available from the corresponding author upon reasonable request.

Conflicts of Interest

The authors declare no conflict of interest.

References

  1. Sekkat, Z.; Wood, J.; Geerts, Y.; Knoll, W. Surface Plasmon Investigations of Light-Induced Modulation in the Optical Thickness of Molecularly Thin Photochromic Layers. Langmuir 1996, 12, 2976–2980. [Google Scholar] [CrossRef]
  2. Bartual-Murgui, C.; Salmon, L.; Akou, A.; Thibault, C.; Molnár, G.; Mahfoud, T.; Sekkat, Z.; Real, J.A.; Bousseksou, A. High quality nano-patterned thin films of the coordination compound {Fe(pyrazine)[Pt(CN)4]} deposited layer-by-layer. New J. Chem. 2011, 35, 2089–2094. [Google Scholar] [CrossRef]
  3. Shah, D.; Reddy, H.; Kinsey, N.; Shalaev, V.M.; Boltasseva, A. Optical Properties of Plasmonic Ultrathin TiN Films. Adv. Opt. Mater. 2017, 5, 1700065. [Google Scholar] [CrossRef]
  4. Huang, H.T.; Huang, C.Y.; Ger, T.R.; Wei, Z.H. Anti-integrin and integrin detection using the heat dissipation of surface plasmon resonance. Appl. Phys. Lett. 2013, 102, 111109. [Google Scholar] [CrossRef]
  5. Krasilnikova, S.A. Measurement of optical constants of thin films by non conventional ellipsometry, photothermal deflection spectroscopy and plasmon resonance spectroscopy. In Proceedings of the Advances in Optical Thin Films III, 71010R, Glasgow, Scotland, UK, 2–5 September 2008; Volume 7101. [Google Scholar] [CrossRef]
  6. Wood, R.W. On a Remarkable Case of Uneven Distribution of Light in a Diffraction Grating Spectrum. Proc. Phys. Soc. Lond. 1902, 18, 269–275. [Google Scholar] [CrossRef]
  7. Mie, G. Beiträge zur Optik trüber Medien, speziell kolloidaler Metallösungen. Ann. Phys. 1908, 330, 377–445. [Google Scholar] [CrossRef]
  8. Nguyen, H.; Park, J.; Kang, S.; Kim, M. Surface Plasmon Resonance: A Versatile Technique for Biosensor Applications. Sensors 2015, 15, 10481–10510. [Google Scholar] [CrossRef] [PubMed] [Green Version]
  9. Brolo, A.G. Plasmonics for future biosensors. Nat. Photon. 2012, 6, 709–713. [Google Scholar] [CrossRef]
  10. Kashyap, R.; Chakraborty, S.; Zeng, S.; Swarnakar, S.; Kaur, S.; Doley, R.; Mondal, B. Enhanced Biosensing Activity of Bimetallic Surface Plasmon Resonance Sensor. Photonics 2019, 6, 108. [Google Scholar] [CrossRef] [Green Version]
  11. Elhani, S.; Ishitobi, H.; Inouye, Y.; Ono, A.; Hayashi, S.; Sekkat, Z. Surface Enhanced Visible Absorption of Dye Molecules in the Near-Field of Gold Nanoparticles. Sci. Rep. 2020, 10, 3913. [Google Scholar] [CrossRef] [PubMed] [Green Version]
  12. Jeong, N.C.; Prasittichai, C.; Hupp, J.T. Photocurrent Enhancement by Surface Plasmon Resonance of Silver Nanoparticles in Highly Porous Dye-Sensitized Solar Cells. Langmuir 2011, 27, 14609–14614. [Google Scholar] [CrossRef]
  13. Zhou, X.; Liu, G.; Yu, J.; Fan, W. Surface plasmon resonance-mediated photocatalysis by noble metal-based composites under visible light. J. Mater. Chem. 2012, 22, 21337. [Google Scholar] [CrossRef]
  14. Knoll, W. Interfaces and thin films as seen by bound electromagnetic waves. Annu. Rev. Phys. Chem. 1998, 49, 569–638. [Google Scholar] [CrossRef] [PubMed] [Green Version]
  15. Maier, S.A. Plasmonics: Fundamentals and Applications; Springer: New York, NY, USA, 2007. [Google Scholar]
  16. Brongersma, M.L.; Shalaev, V.M. The Case for Plasmonics. Science 2010, 328, 440–441. [Google Scholar] [CrossRef] [PubMed]
  17. Kawata, S. Near-Field Optics and Surface Plasmon Polaritons; Springer: Berlin, Germany; New York, NY, USA, 2001. [Google Scholar]
  18. Kawata, S.; Inouye, Y.; Verma, P. Plasmonics for near-field nano-imaging and superlensing. Nat. Photon. 2009, 3, 388–394. [Google Scholar] [CrossRef]
  19. Stockman, M.I. Nanoplasmonics: Past, present, and glimpse into future. Opt. Express 2011, 19, 22029. [Google Scholar] [CrossRef] [Green Version]
  20. Rehman, S.; Rahmouni, A.; Mahfoud, T.; Nesterenko, D.V.; Sekkat, Z. Determination of the Optical Thickness of sub 10-nm Thin Metal Films by SPR Experiments. Plasmonics 2014, 9, 381–387. [Google Scholar] [CrossRef]
  21. Liu, C.; Liu, Q.; Hu, X. SPR phase detection for measuring the thickness of thin metal films. Opt. Express 2014, 22, 7574–7580. [Google Scholar] [CrossRef]
  22. Gonzalez-vila, A.; Debliquy, M.; Lahem, D.; Zhang, C.; Mégret, P.; Caucheteur, C. Molecularly imprinted electropolymerization on a metal-coated optical fiber for gas sensing applications. Sens. Actuators B Chem. 2017, 244, 1145–1151. [Google Scholar] [CrossRef]
  23. Refki, S.; Hayashi, S.; Rahmouni, A.; Nesterenko, D.V.; Sekkat, Z. Anticrossing Behavior of Surface Plasmon Polariton Dispersions in Metal-Insulator-Metal Structures. Plasmonics 2016, 11, 433–440. [Google Scholar] [CrossRef]
  24. Refki, S.; Hayashi, S.; Nesterenko, D.V.; Sekkat, Z.; Inoue, Y.; Kawata, S. Metal-insulator-metal structures for high-resolution sensing. In JSAP-OSA Joint Symposia 2014 Abstracts; Hokkaido: Sapporo, Japan, 2014; p. 19p_C3_5. [Google Scholar] [CrossRef]
  25. Sekkat, Z.; Hayashi, S.; Nesterenko, D.V.; Rahmouni, A.; Refki, S.; Ishitobi, H.; Inouye, Y.; Kawata, S. Plasmonic coupled modes in metal-dielectric multilayer structures: Fano resonance and giant field enhancement. Opt. Express 2016, 24, 20080. [Google Scholar] [CrossRef] [PubMed]
  26. Hayashi, S.; Nesterenko, D.V.; Rahmouni, A.; Sekkat, Z. Observation of Fano line shapes arising from coupling between surface plasmon polariton and waveguide modes. Appl. Phys. Lett. 2016, 108, 051101. [Google Scholar] [CrossRef] [Green Version]
  27. Hayashi, S.; Nesterenko, D.V.; Rahmouni, A.; Ishitobi, H.; Inouye, Y.; Kawata, S.; Sekkat, Z. Light-tunable Fano resonance in metal-dielectric multilayer structures. Sci. Rep. 2016, 6, 33144. [Google Scholar] [CrossRef] [PubMed] [Green Version]
  28. Parthenopoulos, D.A.; Rentzepis, P.M. Three-Dimensional Optical Storage Memory. Science 1989, 245, 843–845. [Google Scholar] [CrossRef] [PubMed]
  29. Maeda, M.; Ishitobi, H.; Sekkat, Z.; Kawata, S. Polarization storage by nonlinear orientational hole burning in azo dye-containing polymer films. Appl. Phys. Lett. 2004, 85, 351–353. [Google Scholar] [CrossRef]
  30. Sekkat, Z.; Dumont, M. Photoassisted poling of azo dye doped polymeric films at room temperature. Appl. Phys. B 1992, 54, 486–489. [Google Scholar] [CrossRef]
  31. Sekkat, Z.; Dumont, M. Poling of polymer films by photoisomerisation of azodye chromophores. Mol. Chryst. Liq. Chryst. Sci. Technol. B Nonlinear Opt. 1992, 2, 359–362. [Google Scholar]
  32. Xu, H.J.; Liu, F.; Elder, D.L.; Johnson, L.E.; De Coene, Y.; Clays, K.; Robinson, B.H.; Dalton, L.R. Ultrahigh electro-optic coefficients, High index of refraction, and long term stability from Diels-Alder Cross-Linkable Molecular Glasses. Chem. Mater. 2020, 32, 1408–1421. [Google Scholar] [CrossRef]
  33. Kalinin, A.A.; Islamova, L.N.; Shmelev, A.G.; Fazleeva, G.M.; Fominykh, O.D.; Dudkina, Y.B.; Vakhonina, T.A.; Levitskaya, A.I.; Sharipova, A.V.; Mukhtarov, A.S.; et al. D-pi-A chromophores with a quinoxaline core in the pi-bridge and bulky aryl groups in the acceptor: Synthesis, properties, and femtosecond nonlinear optical activity of the chromophore/PMMA guest-host materials. Dye. Pigment. 2021, 184, 108801. [Google Scholar] [CrossRef]
  34. Kuzyk, M.G.; Dawson, N.J. Photomechanical materials and applications: A tutorial. Adv. Opt. Photon. 2020, 12, 847. [Google Scholar] [CrossRef]
  35. Zhou, B.; Bernhardt, E.; Bhuyan, A.; Ghorbanishiadeh, Z.; Rasmussen, N.; Lanska, J.; Kuzyk, M.G. Theoretical and experimental studies of photomechanical materials [Invited]. J. Opt. Soc. Am. B 2019, 36, 1492. [Google Scholar] [CrossRef] [Green Version]
  36. Sekkat, Z. Optical tweezing by photomigration. Appl. Opt. 2016, 55, 259. [Google Scholar] [CrossRef] [PubMed]
  37. Sekkat, Z. Vectorial motion of matter induced by light fueled molecular machines. OSA Contin. 2018, 1, 668. [Google Scholar] [CrossRef]
  38. Moujdi, S.; Rahmouni, A.; Mahfoud, T.; Nesterenko, D.V.; Halim, M.; Sekkat, Z. Surface relief gratings in azo-polymers revisited. J. Appl. Phys. 2018, 124, 213103. [Google Scholar] [CrossRef]
  39. Sekkat, Z. Model for athermal enhancement of molecular mobility in solid polymers by light. Phys. Rev. E 2020, 102, 032501. [Google Scholar] [CrossRef] [PubMed]
  40. Ishitobi, H.; Akiyama, T.; Sekkat, Z.; Inouye, Y. Optical Trapping of Photosoftened Solid Polymers. J. Phys. Chem. C 2020, 124, 26037–26042. [Google Scholar] [CrossRef]
  41. Atkins, S.; Chueh, A.; Barwell, T.; Nunzi, J.-M.; Seroude, L. Capture and light-induced release of antibiotics by an azo dye polymer. Sci. Rep. 2020, 10, 3267. [Google Scholar] [CrossRef] [PubMed]
  42. Carmen, R.; Ursu, C.; Dascalu, M.; Asandulesa, M.; Tiron, V.; Bele, A.; Tugui, C.; Teodoroff-Onesim, S. Multi-stimuli responsive free-standing films of DR1- grafted silicones. Chem. Eng. J. 2020, 401, 126087. [Google Scholar] [CrossRef]
  43. Prêtre, P.; Wu, L.-M.; Knoesen, A.; Swalen, J.D. Optical properties of nonlinear optical polymers: A method for calculation. J. Opt. Soc. Am. B 1998, 15, 359. [Google Scholar] [CrossRef]
  44. Bondarenko, S.; Villringer, C.; Steglich, P. Comparative Study of Nano-Slot Silicon Waveguides Covered by Dye Doped and Undoped Polymer Cladding. Appl. Sci. 2018, 9, 89. [Google Scholar] [CrossRef] [Green Version]
  45. Taqatqa, O.; Al Attar, H. Spectroscopic ellipsometry investigation of azo dye and azo dye doped polymer. Eur. Phys. J. Appl. Phys. 2007, 37, 61–64. [Google Scholar] [CrossRef]
  46. Steglich, P.; Villringer, C.; Dietzel, B.; Mai, C.; Schrader, S.; Casalboni, M.; Mai, A. On-Chip Dispersion Measurement of the Quadratic Electro-Optic Effect in Nonlinear Optical Polymers Using a Photonic Integrated Circuit Technology. IEEE Photonics J. 2019, 11, 1–10. [Google Scholar] [CrossRef]
  47. Niklasson, G.A.; Granqvist, C.G.; Hunderi, O. Effective medium models for the optical properties of inhomogeneous materials. Appl. Opt. 1981, 20, 26–30. [Google Scholar] [CrossRef]
  48. Boyd, R.W.; Gehr, R.J.; Fischer, G.L.; Sipe, J.E. Nonlinear optical properties of nanocomposite materials. Pure Appl. Opt. 1996, 5, 505–512. [Google Scholar] [CrossRef]
  49. Lee, K.J.; Kang, T.D.; Lee, H.S.; Lee, H.K. Ellipsometric study of polymer thin films: Nonlinear optical guest-host system. J. Appl. Phys. 2005, 97, 083543. [Google Scholar] [CrossRef]
  50. Sekkat, Z.; Knoll, W. (Eds.) Photoreactive Organic Thin Films; Academic Press: Amsterdam, The Netherlands; Boston, MA, USA, 2002. [Google Scholar]
  51. Sekkat, Z.; Prêtre, P.; Knoesen, A.; Volksen, W.; Lee, V.Y.; Miller, R.D.; Wood, J.; Knoll, W. Correlation between polymer architecture and sub-glass-transition-temperature light-induced molecular movement in azo-polyimide polymers: Influence on linear and second- and third-order nonlinear optical processes. J. Opt. Soc. Am. B 1998, 15, 401. [Google Scholar] [CrossRef]
  52. Zeroni, I.; Lodge, T.P. Chain Dimensions in Poly(ethylene oxide)/ Poly(methyl methacrylate) Blends. Macromolecules 2008, 41, 1050–1052. [Google Scholar] [CrossRef]
  53. Swalen, J.D.; Bjorklund, G.C.; Fleming, W.W.; Hung, R.Y.; Jurich, M.C.; Lee, V.Y.; Miller, R.D.; Moerner, W.E.; Morichere, D.Y.; Skumanich, A.; et al. NLO Polymeric Waveguide Electro-Optic Phase Modulator. Proc. SPIE Int. Soc. Opt. Eng. 1993, 1775. [Google Scholar] [CrossRef]
  54. Kuzyk, M.G.; Sohn, J.E.; Dirk, C.W. Mechanisms of quadratic electro-optic modulation of dye-doped polymer systems. J. Opt. Soc. Am. B 1990, 7, 842–858. [Google Scholar] [CrossRef]
  55. Kretschmann, E. Decay of non radiative surface plasmons into light on rough silver films. Comparison of experimental and theoretical results. Opt. Commun. 1972, 6, 185–187. [Google Scholar] [CrossRef]
  56. Aust, E.F.; Sawodny, M.; Ito, S.; Knoll, W. Surface plasmon and guided optical wave microscopies. Scanning 1994, 16, 353–362. [Google Scholar] [CrossRef]
  57. Borstel, G.; Falge, H.J. Surface polaritons in semi-infinite crystals. Appl. Phys. 1978, 16, 211–223. [Google Scholar] [CrossRef]
  58. Polyanskiy, M. Refractive Index. 2014. Available online: https://refractiveindex.info/?shelf=glass&book=BK7&page=SCHOTT (accessed on 19 January 2021).
  59. Refki, S.; Hayashi, S.; Ishitobi, H.; Nesterenko, D.V.; Rahmouni, A.; Inouye, Y.; Sekkat, Z. Resolution Enhancement of Plasmonic Sensors by Metal-Insulator-Metal Structures. Ann. Phys. 2018, 530, 1700411. [Google Scholar] [CrossRef]
  60. Johnson, P.B.; Christy, R.W. Optical Constants of the Noble Metals. Phys. Rev. B 1972, 6, 4370. [Google Scholar] [CrossRef]
  61. Elhani, S.; Maouli, I.; Refki, S.; Halim, M.; Hayashi, S.; Sekkat, Z. Quantitative analyses of optically induced birefringence in azo dye containing polymers. J. Opt. 2019, 21, 115401. [Google Scholar] [CrossRef]
  62. Jellison, G.E. Data analysis for spectroscopic ellipsometry. Thin Solid Film. 1993, 234, 416–422. [Google Scholar] [CrossRef]
  63. Woollam, J.A. VASE Manual; Woollam, J.A. Inc.: Lincoln, NE, USA, 1997. [Google Scholar]
  64. Bruggeman, D.A.G. Berechnung verschiedener physikalischer Konstanten von heterogenen Substanzen. I. Dielektrizitätskonstanten und Leitfähigkeiten der Mischkörper aus isotropen Substanzen. Ann. Phys. 1935, 416, 636–664. [Google Scholar] [CrossRef]
Figure 1. (a) Absorption spectra of DR1/PMMA thin films with different weight concentrations of DR1 versus PMMA C (% w/w). The inset shows a linear evolution of the maximum of absorption, at λ m a x D R 1 = 488   nm   of the film, with its concentration, for a fixed film thickness d   ~   58   nm ; and the absorbance extrapolate to the origin. The solid curves are the experimental data, and the close circles’ curve is a Lorentzian theoretical fit y = y 0 + ( 2 A / π ) ( w / ( 4 ( x x c ) 2 + w 2 ) , while the open circles’ curve is Gaussian theoretical fit y = y 0 + A e ln ( 2 )   ( x x c ) 2 / w 2 / w π / 4 l n ( 2 ) , where y 0 is the baseline. (b) The values of the characteristic parameters of the Lorentzian and Gaussian are given in the table. The Lorentzian function does not fit the data as well as the Gaussian function at the infrared tail ~ 700 nm.
Photonics 08 00041 g001
Figure 2. (a) Dispersion relation of SPs (i.e., ω vs. k S P (e.g., Equation (1)), referring to the SP at an Ag-air interface ( S P 0 ), and when a thin dielectric coating (DC) is deposited on the Ag layer ( S P 1 ). The light line is also indicated in this figure. A light frequency ω L crosses the dispersion curves at k S P 0 and k S P 1 , and it determines the coupling angle θ 0 and θ 1 , for k S P 0 and k S P 1 , respectively. The thin DC shifts the SP dispersion curve to higher coupling ( k S P 1 = k S P 0 + Δ k S P , i.e., resonance, angle, and momentum). (b) Experimentally observed SPR at a prism/Ag (thickness~56 nm) system with a 638 nm laser light. The scatters are experimental data points, and the solid curve is a Fresnel’s theoretical fit.
Photonics 08 00041 g002
Figure 3. Angle-scan ATR spectra in a Kretschmann configuration for a single Ag layer (56 nm) at a wavelength of 632.8 nm. (a) Experimental (dots) and theoretical (solid curve) ATR spectra of an Ag layer sample without and with DR1/PMMA thin films (d ~ 58 nm) at 8%, 10%, and 12% w/w as indicated on the figure. (b) Dependence of SPR angle and full width at half maximum (FWHM) versus DR1 concentration in PMMA. (c) Refractive index (real, n , and imaginary, κ , parts) of DR1/PMMA versus DR1 concentration. Note the linear dependence of n and κ of DR1/PMMA on the DR1 concentration. The scatters are experimental data adapted from the SPR curves at the corresponding concentrations, and the full lines are guides to the eye.
Photonics 08 00041 g003
Figure 4. (a) Schematic of light reflection on a layered stack (i.e., polymer film on top of an ITO layer), which we used in our SE experiments. The experimental data, measured at three different angles (i.e., 60°, 70°, and 80° incidence angles) are (b) delta ( Δ ) angle and (c) psi ( ψ ). Experiments were performed on DR1/PMMA thin films (thickness ~ 58 nm) at 8%, 10%, and 12% w/w concentrations (only the data of 8% w/w are shown). Dotted curves are experimental data and the theoretical fits are represented by full curves. See text for more details.
Photonics 08 00041 g004
Figure 5. n and κ as a function of the wavelength for (a) neat DR1, (b) 8% w/w DR1/PMMA, (c) 10% w/w DR1/PMMA, and (d) 12% w/w DR1/PMMA. The film’s thickness was d   ~   58   nm .
Photonics 08 00041 g005
Table 1. Optical Constants of neat DR1 and thin films of DR1/PMMA at 488 nm and 632.8 nm. The precision of the measured data by spectroscopic ellipsometry and SPR is 2 × 10 3 and 4 × 10 4 for n , and 4 × 10 3 and 1 × 10 4 for   κ , respectively.
DR1/PMMA ConcentrationLiteratureSPR aEllipsometry aUV-Vis a
632.8 nm632.8 nm488 nm632.8 nm488 nm632.8 nm
nκnκnκnκκκ
Neat DR12.0536 b---1.8351.0582.1360.126--
8% w/w--1.54010.00751.5340.0821.5370.0080.09250.0065
10% w/w1.5450 c0.008 c1.55400.01011.5450.0981.5500.0110.10940.0108
12% w/w--1.56500.01201.5530.1201.5610.0120.12790.0115
a This paper; b From [43]; c From [44].
Publisher’s Note: MDPI stays neutral with regard to jurisdictional claims in published maps and institutional affiliations.

