1. Introduction
A recently discovered family of 2D materials—transition metal carbides/nitrides called MXenes—has become the subject of versatile intensive studies due to the materials’ unique optoelectronic properties as well as hydrophilicity, flexibility and metal-like electronic conductivity [
1,
2,
3,
4,
5,
6,
7,
8,
9,
10]. This interest in MXenes is fueled by the possibility of applications as supercapacitors [
11] and in electromagnetic interference shielding [
5], in optical sensing and light detection [
7], and even in communication and biology [
9]. The study of the optical properties of MXenes showed the possibility of creating transparent conductive electrodes [
9] and saturable absorbers for femtosecond mode-locked lasers [
12], for photonic devices [
4] and for plasmonic applications at near-infrared wavelengths [
13].
MXenes are mostly synthesized by etching out the A layers from parent MAX phases [
11,
14,
15], which have a composition generally denoted as M
AX
, where M is an early transition metal, A is mainly a group IIIA or IVA element, X is C and/or N, and n = 1, 2, 3 or 4. In most cases the etching process with acids or alkalis results in the fabricated MXene, M
X
T
, that is terminated by some surface functional groups—T
, such as OH, O, Cl or F (depending on the synthesis method). The synthesis method is a crucial aspect for controlling the surface functionality of MXenes and hence the underlying properties.
Much work has been performed for exploring the optical properties of MXenes. For instance, the plasmonic properties of MXenes were investigated by electron energy loss spectroscopy (EELS) [
16,
17] and by optical measurements in the IR, visible and UV ranges [
13,
18,
19]. In these studies, both surface plasmons (SPs) as well as bulk plasmons and interband transitions (IBTs) were identified. Optical forces on MXene nanoparticles in the near-infrared have been calculated using the finite-difference time-domain method [
20]. Non-linear optical properties of MXenes have also been studied [
21]. The exploitation of optical properties of MXenes is not limited to the possibility of creating new photonics devices. Another promising area of their application is molecular sensing by surface enhanced Raman scattering (SERS). For the most widely studied MXene, Ti
C
T
, the first experimental result demonstrated a SERS enhancement factor in the order of
[
19]. Afterwards, the following studies included other types of MXenes as well, such as nitride Ti
N, which yielded a notable enhancement factor of
[
22]. Recently, more publications appeared on thickness dependence of SERS in Ti
C
T
nanosheets [
23], or for using it as a SERS active substrate for reliable and sensitive detection of organic pollutants [
24]. A systematic theoretical understanding of the optical properties of MXenes is not developed yet, which makes difficult the interpretation of all the experimental data.
In this paper we analyze the experimental data obtained in TiCT nanoparticles by both optical absorption and EELS and present the results of calculations for the absorption cross-section in isolated and interacting nanoparticles composed of MXene sheets. To effectively use the simulation software, an approximate analytical method is applied to identify the ranges of wavelengths corresponding to the peculiarities of spectra. The presented approach allows interpretation of experimental results on EELS in MXene in the vis-infrared range. Moreover, an interesting phenomenon related to the interaction between longitudinal quadrupole and transversal dipole modes suggests the appearance of a Fano resonance.
2. Analysis of Experimental Data of EELS and Optical Absorption Spectroscopy of TiCT
To assess the physical properties of MXenes it is crucial to reveal the peculiarities of the energy spectrum of free and bounded carriers. EELS experiments in Ti
C
T
, covering a fairly wide range of energies up to 30 eV, showed that the maxima at lower energy losses between 0.2 and 0.7 eV in stacks of MXenes occur due to dipole oscillations [
16]. Furthermore, in [
16], for the energy losses at higher energies up to 1.5 eV a weaker maximum was also found, which was independently revealed in optical spectra of Ti
C
T
as well in [
18,
19]. Detected by different methods, this peculiarity was prescribed to low-energy IBTs (see Figure 2 and Figure S6 in [
19]). At energies over 5 eV, rather strong IBTs were detected, after which bulk plasmons occured [
16]. It was also shown that dipole plasmonic frequencies can be tuned in the mid-infrared range by controlling the sheet geometries and terminations. Moreover, the experiment of [
16] revealed that in multilayered (ML) MXene sheets the individual 2D flakes interact weakly, apparently reducing the intensity of bulk excitations and leaving longitudinal surface plasmons (LSPs) as a source of dominant screening mechanism. In [
17], a strong IBT centered around 4 eV was revealed by exploring the role of the localization of termination groups on the optical properties of ML Ti
C
T
. It was shown that the T
functional group localization on the surface has a prominent effect on the optical properties of the ML MXene, leading to 40% variations in the optical conductivity in the middle of the visible spectrum.
For a complete understanding of the optical properties of ML MXenes, it is necessary to know the permittivity tensor of the material. For the first time, the Ti
C
T
permittivity was measured by the ellipsometric method at 45
polarized light in [
13]. We recall that setting the real part of the transversal component of a dielectric function equal to 0 (
) of a thin film is the condition for the realization of transversal surface plasmons (TSPs). According to the measurements of [
13], this condition for the films of thicknesses from 14 to 75 nm is satisfied for the wavelength range
. Thus, in ML MXene one can expect the appearance of TSP peaks in the EELS and optical absorption spectra with a photon energy of less than 1.1 eV. This means that the absorption in ML Ti
C
T
in the photon energy region above the values corresponding to TSP can be attributed to IBT except if higher plasmonic multipoles are excited.
In [
25], using scanning transmission electron microscopy (STEM) combined with ultra-high resolution EELS, the spatial and energy distribution of electron excitations in Ti
C
T
were obtained. It was shown that the longitudinal multipolar SP modes strongly depend on the geometry of the sample. An interesting result related to the similarity in the behavior of polarizability of monolayer (1L) and ML samples attributed to unusual weak interlayer coupling was obtained. The origin of the peak at energy of 1.7 eV in EELS spectra [
25] will be discussed in the next section.
Recently, Ti
C
T
MXene disk arrays on glass and on Au/alumina were fabricated, and it was shown that the new metamaterial exhibits strong broadband absorption in a wide range of wavelengths,
[
26]. The origin of this effect is conditioned by the appearance of gap plasmons, localized SPs and plasmon-polaritons. Full wave three-dimensional finite element method (FEM) simulations were performed using the COMSOL package, and a good agreement with the experiment was demonstrated. The broadband absorption, obviously being the result of hybridization of different plasmonic modes via interparticle interaction in the array, causes splitting of the absorption frequency. While in a system of
noninteracting resonators the resonance frequency is
-fold degenerated, in the case of interacting nanoparticles within an array
spectral lines appear in the absorption band because of splitting. The absorption spectrum of a single disk for both TE and TM polarizations will be considered in the next section, and it will be demonstrated that a strong broadening takes place already in the isolated particle.
3. Calculation of Optical Spectra of Single TiCT Nanoparticles
In this section, we consider the excitation of the quadrupole SP mode in large enough MXene nanoparticles. Moreover, we show that hybridization of transversal modes in large coupled particles initiates Fano resonance. Theoretical study of optical properties such as wavelength dependence of dielectric function, reflection and absorption for 1Ls of pristine MXenes is performed by DFT calculations of density of states (DOS) and band structures [
27]. In [
28,
29], analogous DFT calculations were performed and substantial differences were revealed in the absorption spectra of 1L MXenes with various terminations particularly in the lower photon energy regime. Furthermore, in case of ML MXene sheets with thicknesses ranging from 5 to 45 nm, ab initio calculations revealed LSPs [
16]. It was also shown that the thinner the sheets are, the stronger are the contribution of LSP modes in the total cross section, and with the increase of the thickness the role of surface terminations becomes negligible. In [
17] ab initio calculations were carried out to investigate the role of surface functionalization on dielectric properties of ML Ti
C
T
for the termination cases of either OH or F, and intense IBT at 4 eV and higher energies was identified. However, the lower energy region was not investigated and consequently SPs were not studied.
Below, we present our numerical simulations on optical spectra of MXene particles of sizes up to 2000 nm, exploiting analytically a priori identified ranges of resonance frequencies for various configurations and shapes (see
Supplementary Information (SI)—S1 Analytical approach). For that purpose, we applied the COMSOL Multiphysics
® package, modeling the shapes and sizes of sheets as close as possible to the synthesized samples in the above-mentioned experiments with a known dielectric function [
13,
26]. It is important that scanning electron microscope (SEM) and atomic force microscope (AFM) images show a continuous coverage of Ti
C
T
flakes predominantly oriented parallel to the substrate. MXenes flakes parallel to Si-SiO2 substrates, as shown in [
13], take place even for thicknesses of less than 10 nm, corresponding to just a few MXene layers. A more detailed description of the modeling method is provided in
Section S2 of the SI. The resulting plots are accompanied with corresponding intensity maps (spatial distribution of electric field normalized to the amplitude of the incident field). Throughout the paper the scale bars on the right side of each inset correspond to the absolute value of the ratio between the amplitude of the total electric field and the amplitude of the incident field. The direction of wave incidence coincides with the Z-axis in the figures, and the electric field oscillates along the Y-axis. In all of the calculations, MXene particles are embedded in air, i.e., the effect of the substrate that could be important in certain experiments is not considered here. We also compare our results with experiments performed with MXene films on substrates. This approach is justified by the very small difference of the reflectance between common substrates and MXene [
13]. On the other hand, neglecting the role of the substrate of MXene films is also justified by the fact that our results, which are based on experimental values of the dielectric function from [
26], match well with measured absorption data.
Calculation of the absorption in Ti
C
T
in the range of 400 to 1600 nm, when the single sheets are modeled as small oblate spheroids with a shape approximation to a disk, are presented in the Supplementary Information of [
19]. As shown for small MXene particles of different thickness, in case of an electric field directed along the long axis the IBT occurs at a wavelength of about 760 nm. This value is formed under the influence of strong LSP absorption at longer wavelengths—the effect of “attraction” of peaks (see Figure S7a in [
19], and S1 Analytical approach of this paper). The calculations were also performed with different aspect ratios (
) of spheroids in the case of light polarization along the short axis and an IBT at 600 nm was identified. It was shown that for small nanoparticles, the absorption of light polarized along the short axis is relatively weak and the “attraction” by the TSP peak is negligible. Thus, for the polarization considered, the redshift of IBT peaks does not appear, independently of
and in accordance with the experiment (see Figure S7b in [
18]).
In [
26], for the wavelength range of 600 to 2100 nm the absorption spectrum of unpatterned nanometer-thin MXene film was measured for TE polarization of incident light. On the absorption curve, two maxima decreasing with the increase of wavelength were observed at around 600 and 1000 nm (see red curve corresponding to unpatterned MXene film in Figure 4c of [
26]). To assess the thickness dependence of absorption cross-section in unpatterned film, we performed COMSOL simulations for different heights of single MXene disks. The result of calculations for the absorption in a Ti
C
T
disk of 500 nm diameter with a thickness of 14 nm using
from [
13] is presented in
Figure 1. The maxima in the short wavelength range of 640 nm, also observed in [
26], corresponds to IBT. Indeed, our calculations give the same value of 640 nm for the left-side maxima regardless of nanoparticle shapes (see
Figure 2,
Figure S3), if the electric field polarization allows excitation of only TSP. This behavior is expected since the absorption peak corresponding to IBT always essentially dominates that of TSPs located nearby and therefore the IBT resonance wavelength is not shifted. The second peak for the chosen polarization located at 1200 nm obviously corresponds to TSP resonance for a disk of a large aspect ratio [
30]. Note that this wavelength is very close to
nm, satisfying the condition
for the
measured in [
13]. The minor shift here is conditioned by the contribution of the imaginary part of
into the polarizability. We also calculated the absorption cross-section for the disk with a diameter of 1000 nm (see
Figure S3) and found that the resonances are located at the same wavelengths as for that with a diameter of 500 nm. This is not surprising since also our analytic approach shows (see
SI) that the peak position of TSP resonance in a small particle does not depend on the diameter at large aspect ratios. On the other hand, the peak values of absorption for a larger disk are four times higher, which is a consequence of the four-fold increase of volume of the particle.
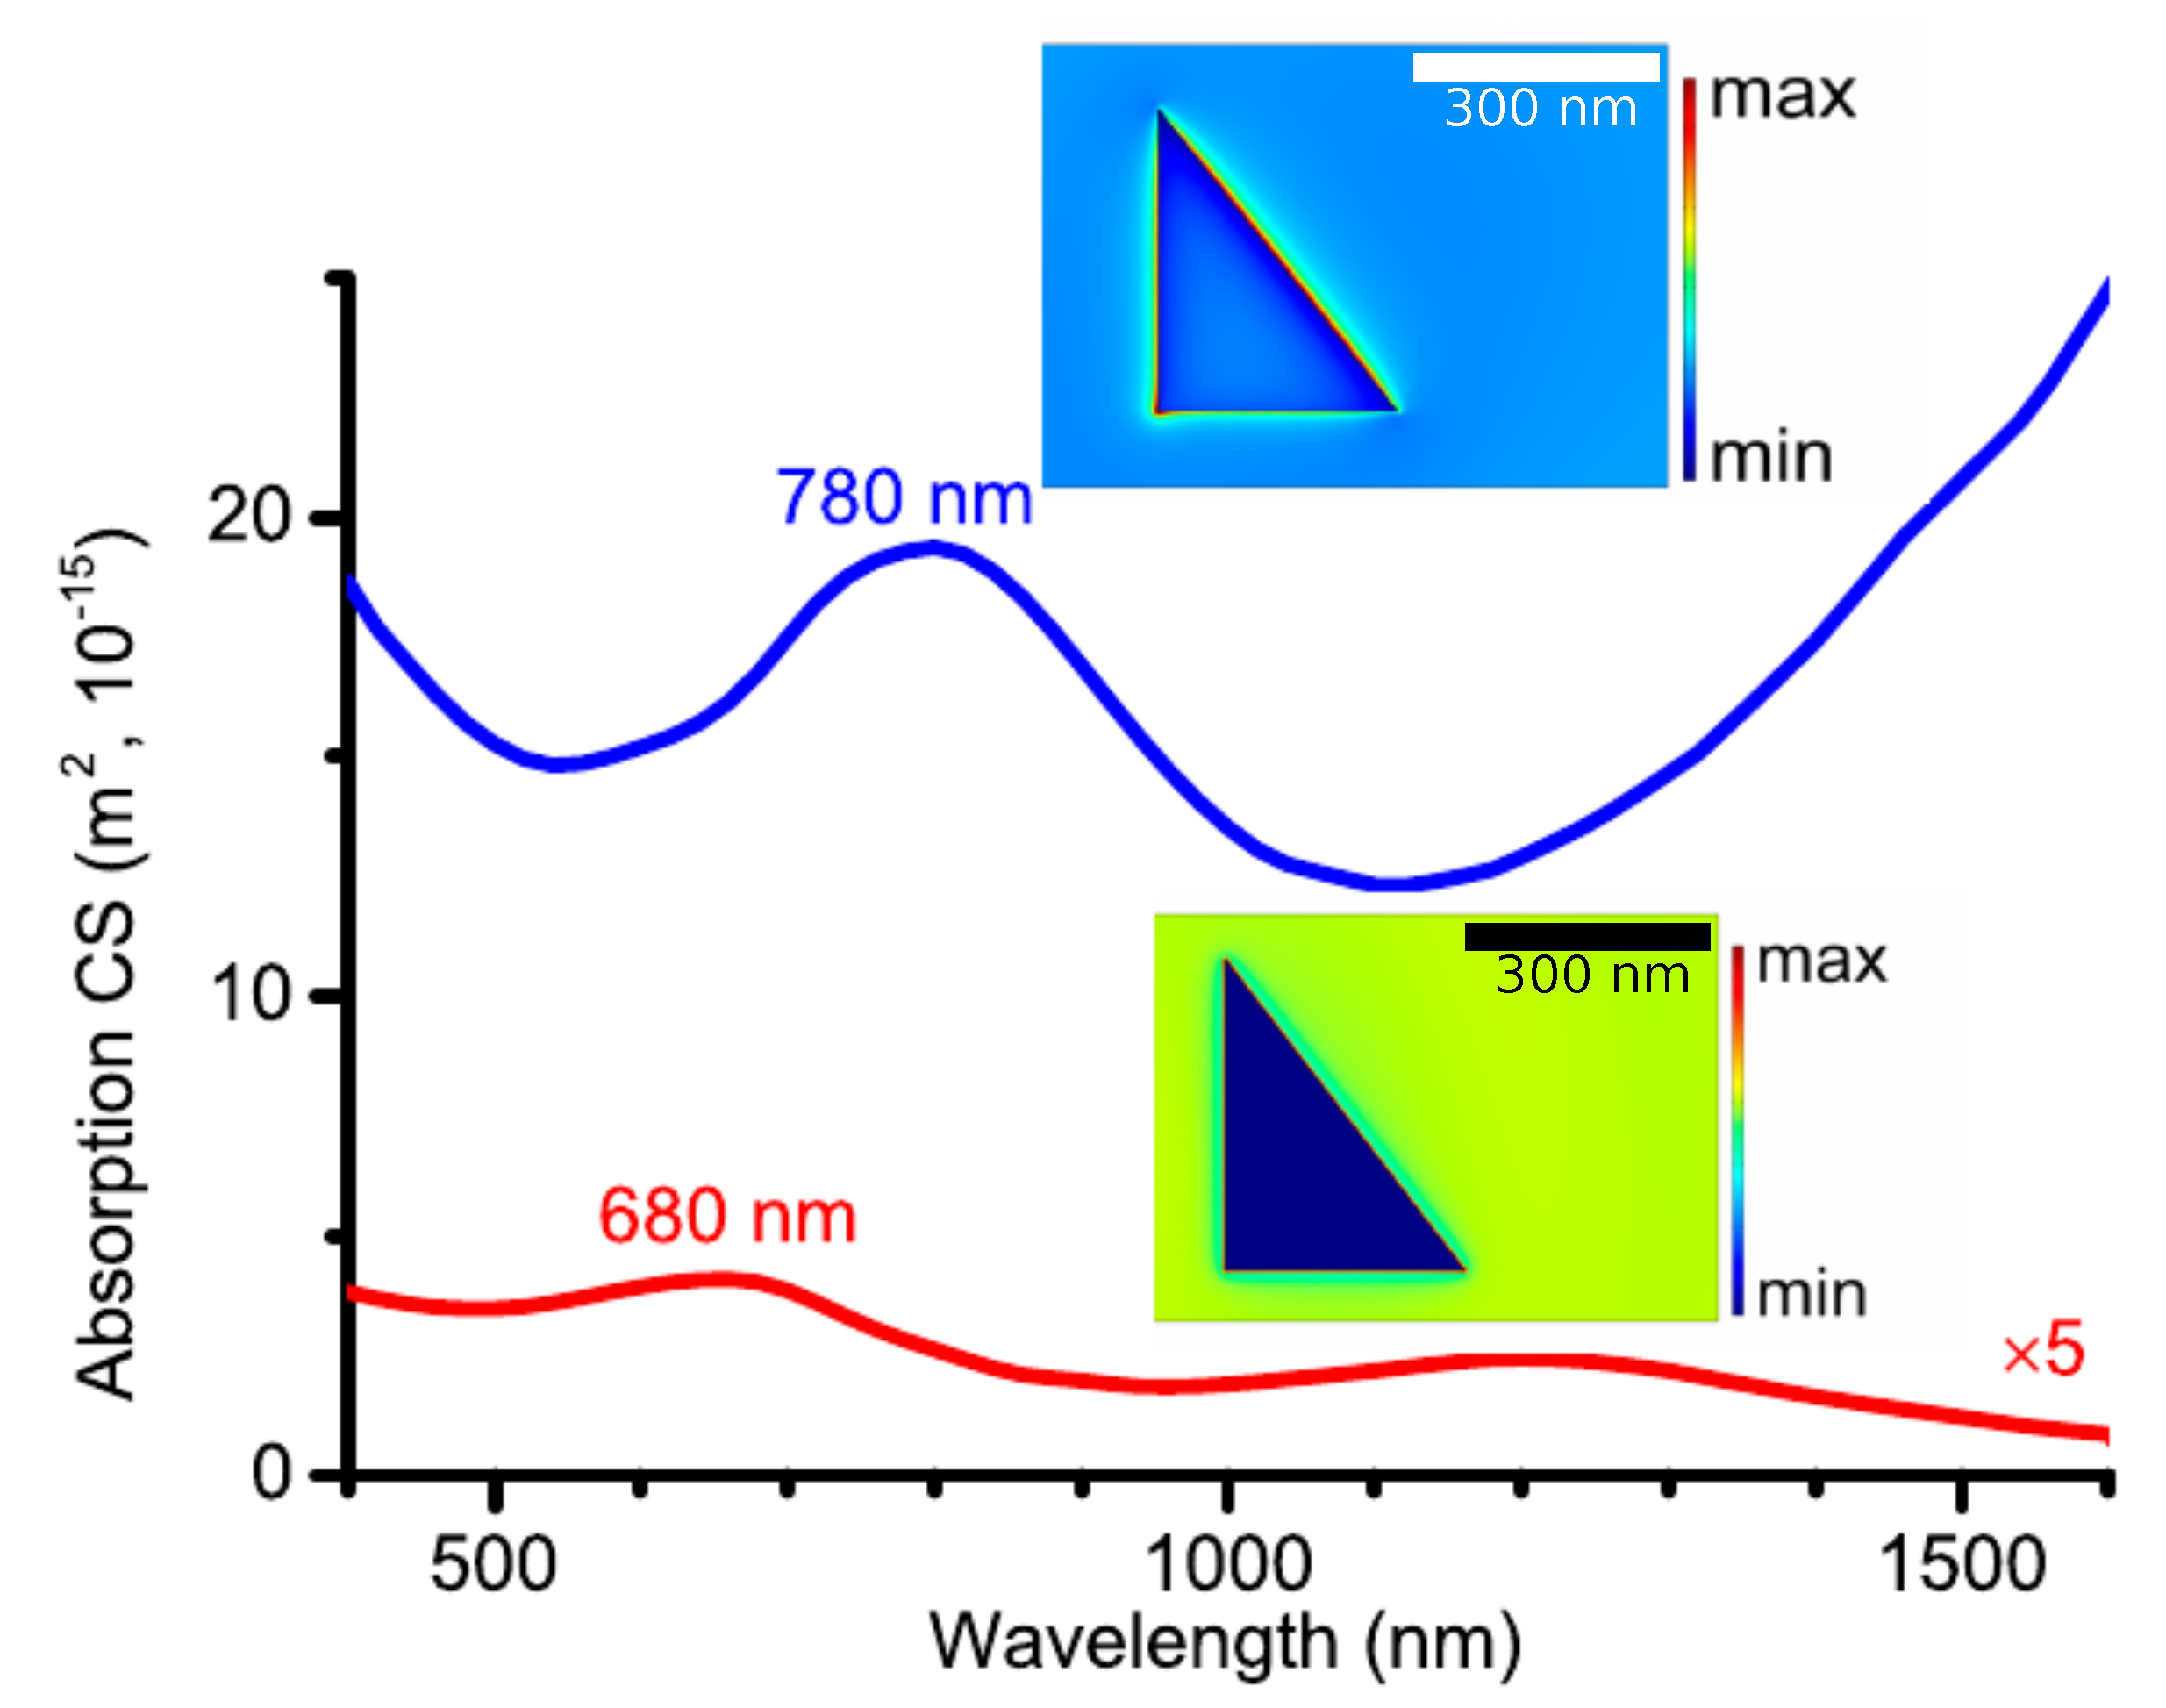
To counter for the effect of particle thickness, we calculated the absorption cross-section of a cylinder of 1000 nm diameter and 300 nm height using the
measured in [
26], where the nanoparticles of these sizes were experimentally studied. Herein, two directions of electric field are applied—parallel and perpendicular to the base of the disk. Interestingly, for parallel polarization, a new peak appeared next to IBT one (600 nm) at around 1000 nm, which we attribute to quadrupole SP (QSP) absorption (see
Figure 3). Indeed, the penetration depth
d of an incident wave defined by
(where
is the vacuum wavelength and
is the complex index of refraction) at
nm takes a value of 100 nm. Obviously, the decrease and vanishing of the electric field amplitude over the penetration depth and consequent fading of the dipolar polarization of MXene along with propagation of light leads to an increase in the symmetry of charge distribution. Indeed, the loss of axial symmetry leads to full isotropy of charge distribution allowing the excitation of higher multipoles. This creates favorable conditions (full symmetry and appropriate value of QSP wavelength in the material) for inhomogeneity of charge distribution. This causes the appearance of a quadrupole mode due to fluctuations of charge distribution.
The wavelength
denoting the longitudinal oscillation induced by the pump wave at 980 nm in the medium is determined by the formula
and gives for
. Such a value of
obviously allows the excitation of longitudinal quadrupole mode in a cylinder with a diameter of 1000 nm. The excitation of the QSP mode at a shorter wavelength than the dipole SP mode is well-known in the quasistatic approximation [
30]. The absorption cross-section of TE polarized light in unpatterned MXene film was measured and two absorption peaks at around 600 nm and 1000 nm were revealed (see
Figure 4c of [
26]). Our simulation for the same polarization of incident light for the cylinder, as was mentioned above (see
Figure 3), gives exactly the same maxima, which we identify as IBT and QSP resonances, respectively. The close values of resonance wavelengths of QSP for the unpatterned film and cylinder are conditioned by the fact that the electric field strength of quadrupole charge distribution decreases very fast, in the order of
, where
R is the distance from the center of charge distribution to the point of observation. This behavior of the field is associated with a weak dependence of the sensitivity of QSP resonance on the shape of the nanoparticle. As can be seen from the inset of
Figure 3, for the considered polarization there should be a peak corresponding to LSP resonance at much longer wavelengths. However, to demonstrate it, we need the experimental dielectric function of MXene in that region, which is not yet available.
The increase in the absorption cross-section at longer wavelengths (
) is conditioned by the broadened weak LSP resonance. We interpret this behavior as a consequence of the fact that the diameter of the cylinder is much larger than the mean free path of charge carriers. In the inset of
Figure 3 the presented electric field intensity map corresponding to the peak wavelength of QSP absorption at 980 nm for the cylinder of 300 nm height shows inhomogeneous field distribution around the particle. This asymmetry is caused by the extinction of the electric field along the propagation direction. The occurrence of four maxima beneath the cylinder shown in the inset of
Figure 3 (see also
Figure S7) indicates the excitation of a quadrupole plasmonic mode. We recall that the QSP absorption is proportional to the fourth power of the resonator size, whereas the dipole absorption of LSP is proportional to the square of resonator size. Our calculation shows that due to that reason the QSP resonance is not excited in smaller cylinders. Particularly, the simulation of the absorption cross-section for a cylinder with a diameter of 500 nm and height of 200 nm does not indicate a QSP resonance (see
Figure S4). However, for a larger height of 300 nm, there appears a broad peak caused by a joint contribution of IBT resonance and QSP oscillations.
For the perpendicular polarization (electric field is directed along the cylinder axis) the change of cylinder diameters from 500 to 1000 nm and heights from 200 to 400 nm does not cause qualitative differences in absorption cross-sections. In
Figure 2 we present the results of calculations of absorption cross-section spectra of a Ti
C
T
cylinder of diameter 500 nm with heights 200 nm (blue curve) and 300 nm (red curve) with an electric field that is perpendicular to the disk base. Particularly, one can see a broadened absorption band due to the joint contribution of three processes—the IBT, QSP and TSP modes. In addition, the described behavior of the cross-section takes place for a larger particle (cylinder diameter 1000 nm) as well (see
Figure S5).
To verify the possibility of the appearance of a QSP resonance in MXene, we also calculated the absorption cross-section of a large spheroidal particle (with semiaxes
nm,
nm). As expected, a peak at 980 nm was revealed, indicating the appearance of a QSP resonance (see
Figure 4) in the spheroidal nanoparticle as well. The symmetry braking of the field distribution with respect to the XY-plane typical for the QSP mode can be observed in the inset of
Figure 4. Note that the exhibited sharp rise of the cross-section with wavelengths is due to LSP resonance for
, which is typical for sub-micrometer spheroidal nanoparticles.
Thus, the resonance wavelengths corresponding to QSP modes for a single cylinder (
Figure 3) and a spheroid (
Figure 4) are very close to each other, which is a consequence of insensitivity of QSP resonance on the shape of such a large nanoparticle.
Next, we apply the measured dielectric function of [
13] to analyze the experimental data of [
25], where in the vicinity of 1.7 eV (730 nm) in the EELS spectrum of a triangular Ti
C
T
film a peak was ascribed to TSPs. To analyze this experiment, we look for the positions of SP and IBT modes of a triangular 7.5 nm-thick MXene (using values of
from [
13] for the thinnest available sample, i.e., 14 nm-thick film) by carrying out COMSOL calculations. We found the absorption spectra for two geometries, corresponding to the excitation of LSP and TSP resonances for the triangular sheet of sides of 300, 400 and 500 nm. In
Figure 5 we present the spectra for the cases when the incident electric field is directed perpendicular to the plane of the film to excite TSP (red curve), and when the electric field is directed parallel to the plane of film (perpendicular to the longest side of the triangle) to excite LSP (blue curve). We see that for the geometry close to the experimentally studied one (by EELS), there are two peaks in each spectrum.
The maxima at longer wavelengths correspond to TSP, at 1215 nm (red curve) and LSP, exceeding 2300 nm (blue curve). As expected, the LSP peak is much stronger than the TSP. We interpret the peaks at shorter wavelengths on both curves in the range of 650 to 800 nm in
Figure 5 as IBT, based on the following reasoning. First, when the electric field is directed perpendicularly to the film plane our calculations for the triangular sheets of differing thickness from 7.5 to 30 nm give the same peak at the wavelength of 600 nm. Obviously, this is because the IBT peak values, which depend solely on material properties, are stronger and cannot be shifted by the weaker TSP resonance peaks located at higher wavelengths. Note that the maxima of IBT peaks for two polarizations in
Figure 5 do not match since the higher peak of LSP, unlike TSP, causes a redshift of IBT maxima by 140 nm (effect of “attraction” of peaks, see
SI—Analytical approach). Thus, we can state that the detected peak at 1.7 eV in EELS spectra of Ti
C
T
[
25] is due to IBTs. It can also be seen from
Figure 5 (blue curve) that the values of the LSP resonance absorption cross-section are much higher (25 times) than the TSP peak around 1200 nm. This could be the reason why the TSP resonance was suppressed in the EELS spectrum of [
25]. Note that in case of excitation of SP, higher multipoles cannot be optically excited because of the shortness of the propagation length (7.5 nm) compared to penetration depth. The peak at 0.66 eV in the EELS spectrum prescribed to the QSP mode (see
Figure 1 in [
25]) arises due to the strong inhomogeneity of the field created by the electron beam. Dissimilar to that, the QSP mode of the cylinder revealed in this study (
Figure 3) appears because of light intensity decay during prorogation in the nanoparticle. Interestingly, these two physical mechanisms of inhomogeneity excite QSPs at very different wavelengths. The direction of light propagation for the case of TM polarization is parallel to the plane of the triangle and, consequently, the absorbing area is much smaller than for the TE polarization where the light incidence is normal to the triangle. Thus, the electric field intensity in the vicinity of the triangle in TE case is much stronger than in the TM case, as demonstrated in the insets of
Figure 5.
Thus, the interpretation of the peculiarities of spectra of ML MXene sheets exploiting the measured dielectric function provides good agreement with a wide range of wavelengths, namely 500 to 2500 nm, and predicts the appearance of QSP in large nanoparticles.
4. Calculation of Optical Spectra of Coupled TiCT Nanoparticles
It is known that large and spatially confined electromagnetic enhancement effects can be reached only for the case of strongly coupled nanoparticles such as dimer configurations [
31]. Using experimental data for the dielectric function of Ti
C
T
measured in [
26] we also calculate the optical absorption in coupled particles that can present interest for reaching large values of enhancement factors of SERS. This type of physical enhancement mechanism commonly termed as hot-spots is important to consider for material design in practical applications.
To reveal the peculiarities of LSP resonances in coupled MXene nanoparticles, we calculated the absorption spectra of two identical interacting spheroidal Ti
C
T
particles in an end-to-end configuration at separations of
,
and
. The corresponding semiaxes of the particles are: (a) (20 nm, 5 nm, 5 nm), (b) (25 nm, 5 nm, 5 nm) and (c) (30 nm, 5 nm, 5 nm). The electric field of the light is again directed along the symmetry axis of the system. The results of the COMSOL simulation are presented in
Figure 6. The positions of the IBT peaks around 760–780 nm did not change significantly when varying the aspect ratios of spheroids and the interparticle separations, since the IBT and LSP peaks’ separation is large.
However, contrary to IBT, the LSP peaks were drastically redshifted. It is interesting that the proposed simple model consisting of coupled Ti
C
T
ellipsoids for the SP resonance energy of 0.59–0.73 eV is in good agreement with the results observed in EELS [
16] and optical absorption experiments [
19]. The corresponding electric field intensity map at 760 nm, presented in the inset of
Figure 6, clearly demonstrates the hotspot induced by IBT polarization.
Note that when aspect ratios of spheroids increase from
to
(the semiaxis
c varies from 20 to 30 nm), peak positions of LSP resonances shift by 100 nm for all interparticle separations. Furthermore, the peak positions of the absorption in the range of LSP resonances depend weakly on the interparticle separation. Thus, the corresponding shift for different separations makes no more than 50 nm for all three values of
. Consequently, the main peculiarities of the SP absorption spectrum can be prescribed to the geometry of a single nanoparticle of MXene rather than the random spatial deposition of their plurality on the substrate. Hence, for small nanoparticles wherein the spatial dependence of the EM field in the ignored, the simple model allows to describe the optical properties of individual MXene sheets. Note that the spectral shift of coupled SPs in the MXene dimer (50 nm in considered case) is smaller than that of the coupled noble metallic nanoparticles [
32]. This difference is due to a higher density of free charge carriers in noble metals as compared to MXene.
To see how the peculiarities revealed above can change in the case of relatively large particles, we further carried out simulations of the absorption spectra for the identical coupled MXene ellipsoids of semiaxes
nm,
nm and
nm. The calculation results presented in
Figure 7 show that the absorption spectrum of medium-sized coupled ellipsoidal particles still does not contain QSP resonance.
The optical spectrum of a single ellipsoid of the same size, presented in
Figure S6 of the SI, confirms that the IBT resonance wavelength is the same as that in
Figure 7 while the LSP resonance appears redshifted by 200 nm. This consistent IBT peak in the range of 700–800 nm (irrespective of particle size or colloidal solution concentration) is in accord with the UV-vis absorption results of Ti
C
T
often reported in the literature.
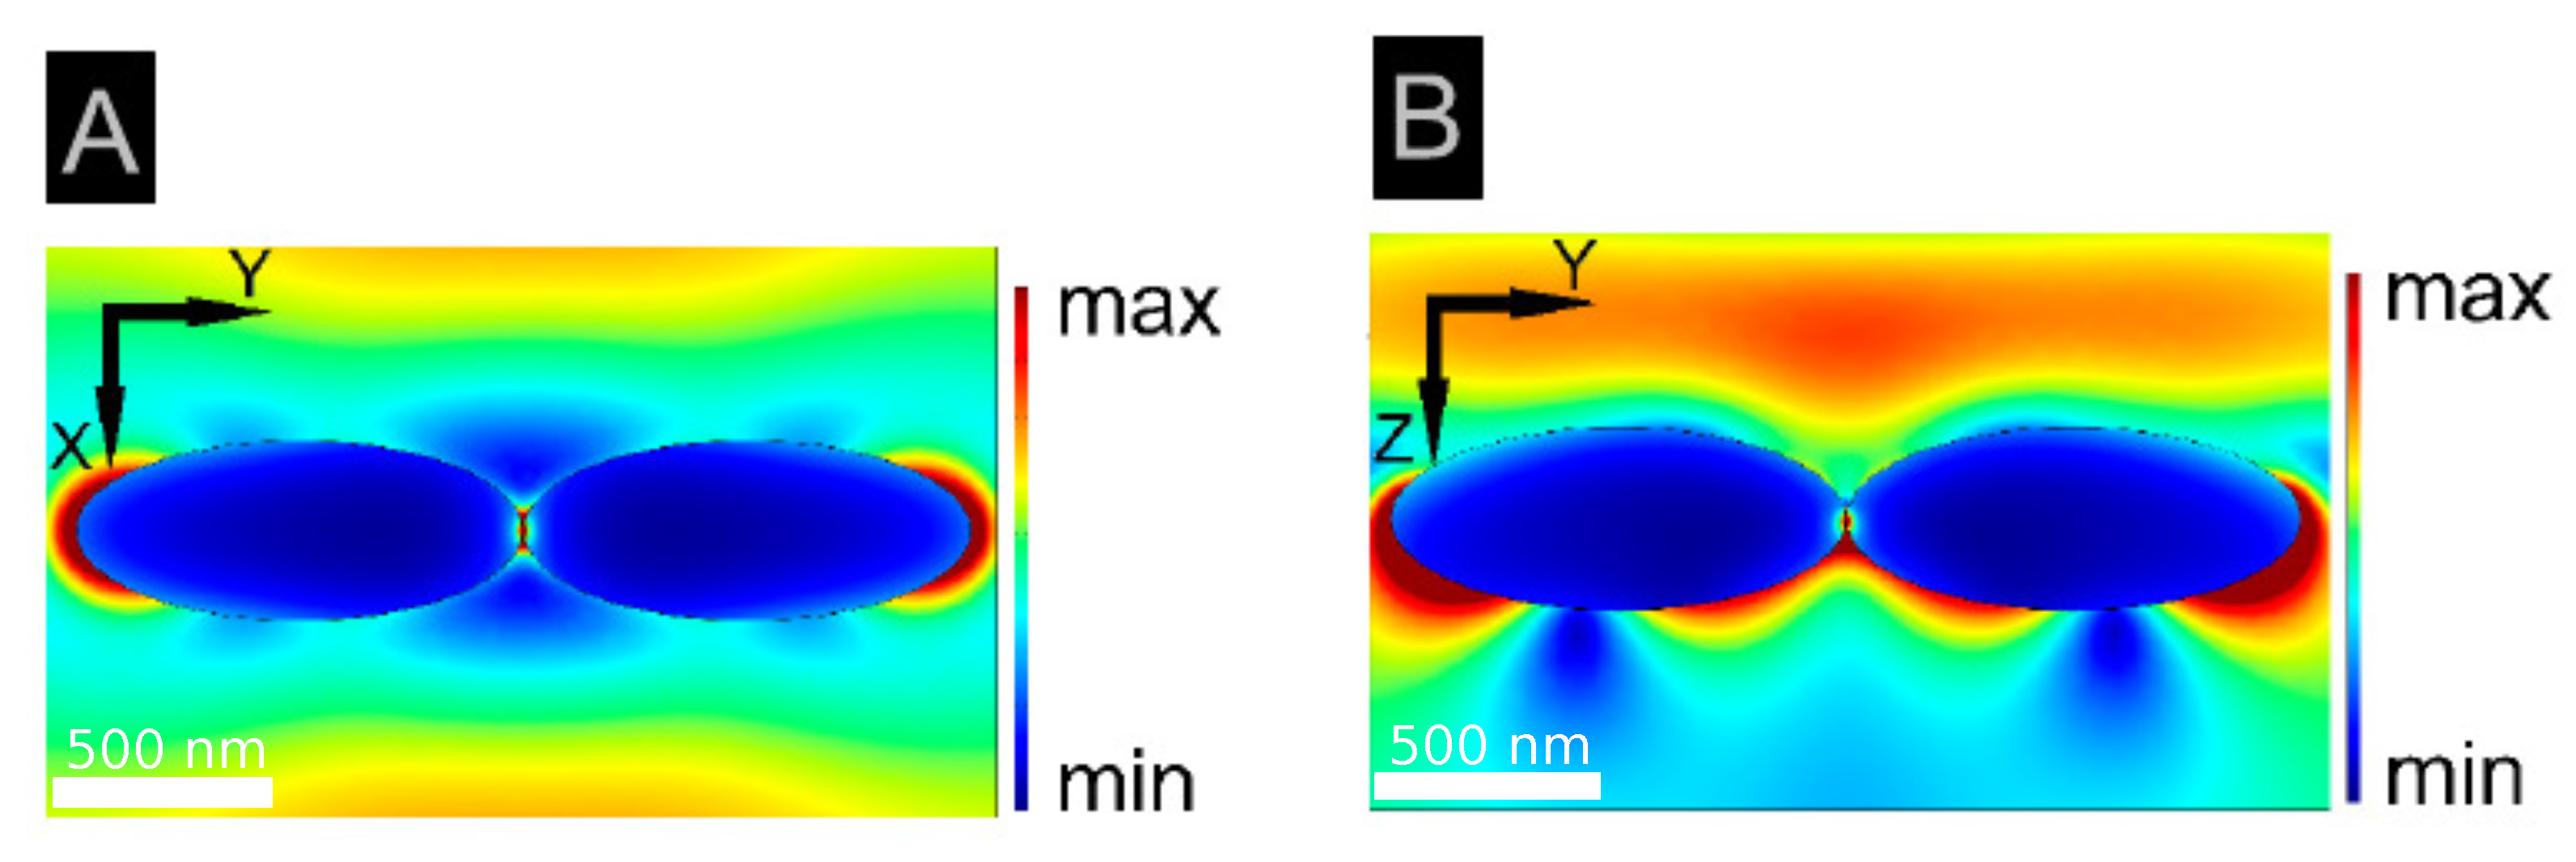
In order to assess the possibility of the appearance of QSP resonance in interacting MXene nanoparticles, we also simulated the absorption in notably larger coupled spheroids with semiaxes: 500, 200 and 200 nm. The results for the end-to-end configuration of spheroids with an inter-particle gap of 1.5 nm, when the incident electric field is directed along the long axis, are presented in
Figure 8. They clearly show the existence of a QSP mode at 980 nm, analogous to those revealed for the single cylinder and spheroid (see
Figure 3 and
Figure 4).
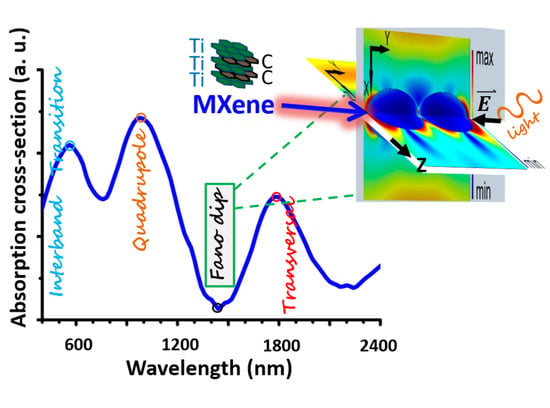
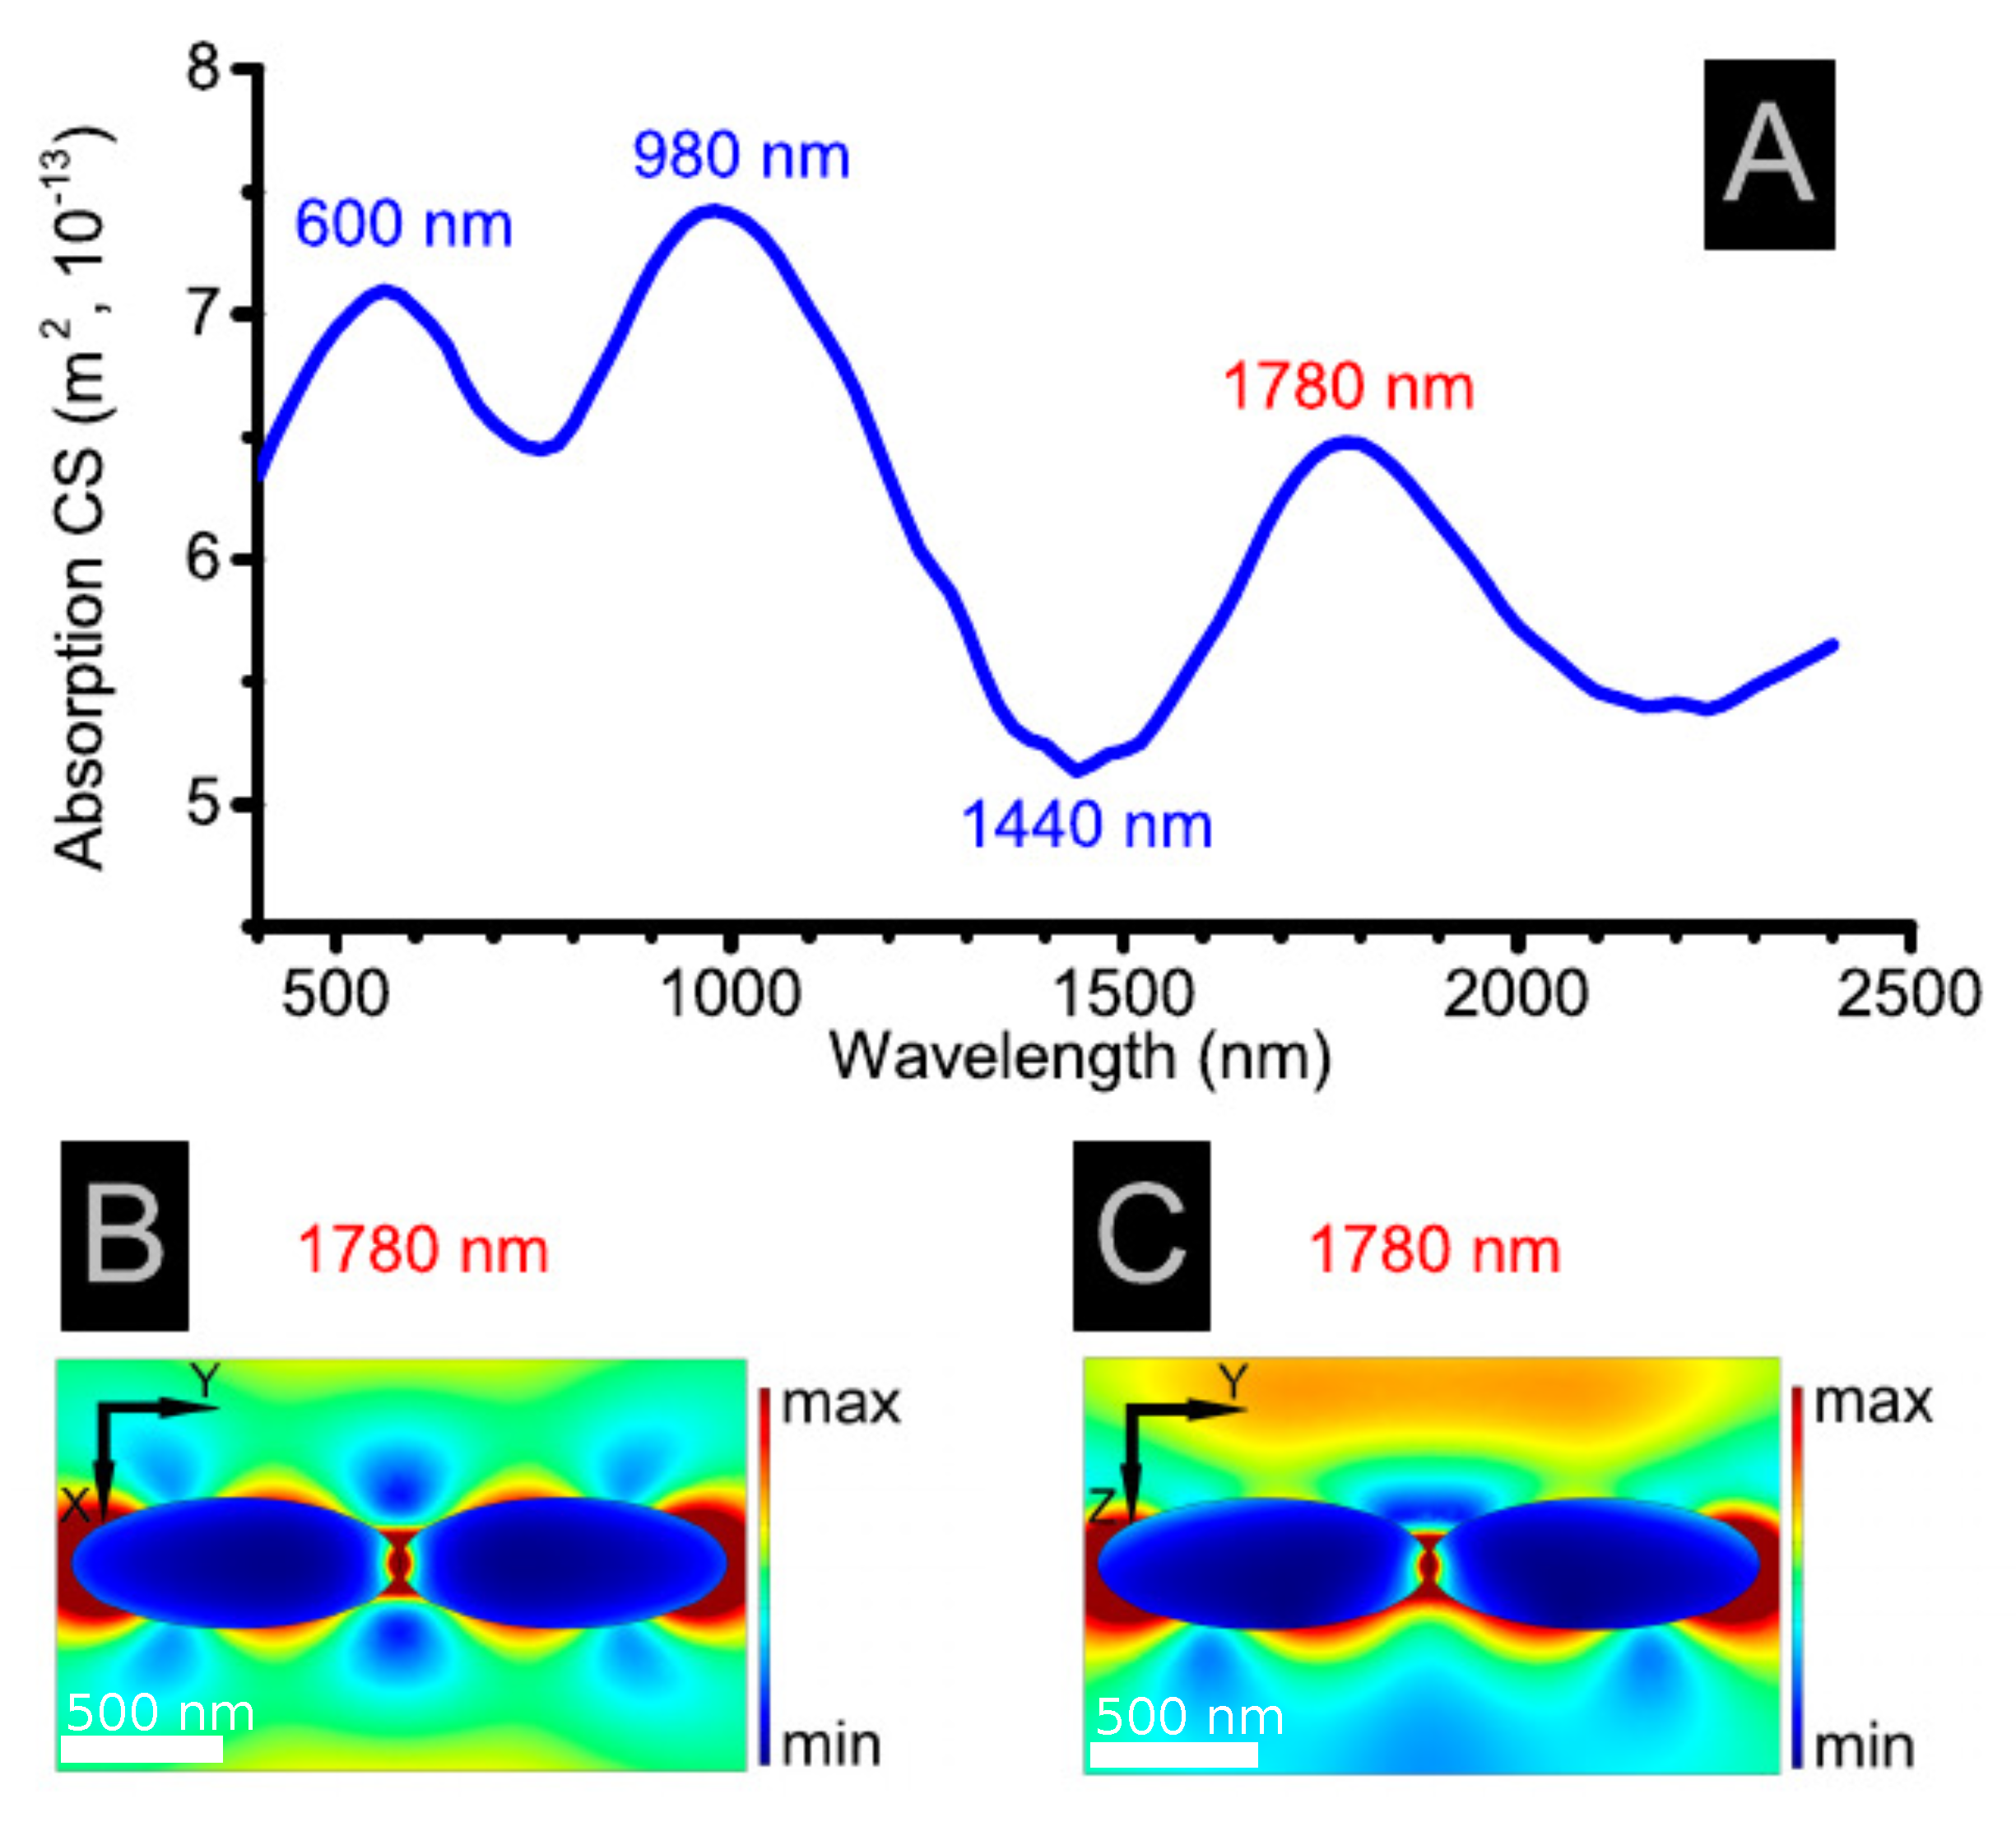
Interestingly, as can be seen from
Figure 8A, in addition to LSP at resonance wavelength
(the highest field strength at the far apexes of spheroids) and the quadrupole resonance detected at 980 nm, there is also a new resonance at 1780 nm. We attribute this resonance to longwave transversal plasmon oscillations, the mechanism of occurrence of which differs significantly from the classical one. The point is that typically the directions of the external field and plasmon oscillations coincide and correspondingly the transversal plasmon oscillations should not occur when the electric field of light oscillates along the long axis of coupled spheroids. The physical mechanism of excitation of TSP when the directions of incident electric field and SP oscillations are orthogonal is the following. In the center of the symmetry of the quadrupole charge distribution a repulsive alternating force appears orthogonal to the incident electric field (see schematics in
SI 2). It is this force that causes dipole transversal plasmon oscillations in both spheroids. It is easy to see from the electric field intensity maps of
Figure 8B,C that there is an attraction between the transversal plasmons, which is also demonstrated in
SI 2. Thus, the QSP–TSP coupling in each spheroid and TSP–TSP hybridization in interacting spheroids lead to a strong redshift of the new TSP resonance wavelength.
Figure 8B,C apparently demonstrate the occurrence of the TSP mode in the high field intensity regions close to middle parts of spheroids. A small shift of bright regions from the centers of spheroids is a consequence of attraction between counter-phase oscillating transversal dipoles. Moreover,
Figure 8C clearly shows the shift of all induced dipoles in the incident wave propagation direction.
Furthermore, in
Figure 9 the electric field intensity maps at QSP maximum (980 nm) in the XY-plane (A) and YZ-plane (B) are presented. Note that the resonance wavelength of QSP remains the same for single and coupled nanoparticles.
It is important to mention that as a result of strong coupling of QSP and induced TSP modes, as follows from
Figure 8A, there appears a Fano dip at 1440 nm. The lowest minimum at 1440 nm in strongly interacting nanoparticles (
Figure 8) is a result of destructive interference between QSP and TSP modes, which is a manifestation of Fano resonance [
33]. Moreover, the attraction between dipoles induced by TSP oscillations in two spheroids is clearly demonstrated. In
Figure 8C the symmetry of intensity distribution with respect to incident electric field is violated, obviously demonstrating the appearance of a QSP resonance. Furthermore, in
Figure 9 the electric field intensity maps at QSP maximum (980 nm) in the XY-plane (A) and YZ-plane (B) are presented. Note that the resonance wavelength of QSP remains the same for single and coupled nanoparticles.
It can be seen from
Figure 10A that the dipole and QSP modes are suppressed (“dark” mode in Fano resonance), whereas
Figure 10B shows that the energy is cumulated in the TSP mode (“bright” mode). Unlike the 1780 nm wavelength, the field distribution around the hotspot at the Fano resonance (1440 nm) is negligibly small, since the transversal dipoles oscillate counter-phase and their cumulative superimposed field vanishes. Our result is different from conventional Au nanoparticle systems where the Fano resonance appears only in the case of non-identical small nanoparticles (with sizes less than the wavelength of the incident wave) [
34]. It is clear, however, that in a realistic case of non-identical large interacting MXene flakes a Fano resonance can take place as well. The small asymmetry in the Fano deep, is a consequence of the moderate difference between the damping constants of the two modes considered.
Summarizing, all optical phenomena taking place in the visible and infrared ranges for arbitrary geometries of ML MXene single and coupled particles originate via strong polarization induced by IBT, QSP and TSP resonances. We stress that the QSP resonance in the absorption spectrum yields stronger peaks than the TSP. Moreover, the plasmonic behavior of this MXene starts not at the TSP resonance but at a shorter wavelength (980 nm).
5. Discussion
Experimental MXene 2D flakes present a large shape variety, depending on the fabrication conditions. It is therefore not easy to define a general shape for samples appropriate for all experiments. Hence we tried to model several flake shapes to see what kind of shape-dependent peculiar plasmonic effects are also evidenced in experiments. We studied the absorption spectra of MXene nanoparticles with shapes and sizes matching those studied experimentally. Thus, we considered both thin and thick samples.
The substrate was not taken into account in our simulations. Although we have used a homogeneous medium with a refractive index of
(air), this situation is similar to MXene flakes suspended in aqueous solution (the refractive index of water in the green region of the visible spectrum is
). On the other hand, the MXene films in [
13,
26] were deposited on quartz, glass, and SiO
/Si. As was shown experimentally, the difference in the reflectance between Ti
C
T
and quartz at
nm is only 4.7% (see Figure S5 in the SI of [
13]). Not taking into account the role of substrate of MXene film in the interpretation of absorption spectra can be largely justified by the fact that our results, which are based on experimental values of the dielectric function from [
26], match well with measured absorption data.
In the analysis of EELS spectra of MXenes it is important to stress that the energy loss experiments allow revealing all resonances of the sample. However, in some parts of experimental EELS spectra of ML MXenes, it is difficult to distinguish closely located maxima, such as resonances corresponding to IBT and TSP. On the other hand, optical absorption spectra expose the resonances selectively, depending on the polarization of incident light. Thus, for exciting TSP in optical experiments the electric field of the light wave should have a component perpendicular to the surface of the flake. Accordingly, changing the polarization of light will allow the identification of the TST mode revealed in EELS experiments. As for the peak frequency of IBT, it is independent on the geometry of the sample and is determined only by the dielectric properties of the material. Consequently, this resonance appears in both experiments.
To study the interaction of MXene sheets closely placed on the substrate, we considered coupled large nanospheroids with semiaxes of
nm,
nm and
nm in the end-to-end configuration under plane wave irradiation, as depicted in
Figure 7. The polarization is along the
Y-axis and the propagation is along the
Z-axis. Since the particle lengths are large enough compared to the penetration depth, higher multipole plasmon oscillations can be excited together with dipole LSP. In the case considered, quadrupole oscillations occur, since the QSP wavelength
for
nm is less than half the long axis of the spheroid. Here
n is the refractive index of the MXene. The configuration of dipole and quadrupole LSP in each spheroid is presented in the
Figure 8A,B. Furthermore, the TSP mode in the system is excited due to repulsion forces acting on the free carriers in the center of symmetry of the quadrupole charge distribution. Thus, a new mechanism of excitation of the longwave TSP at
nm by an external electric field perpendicular to the direction of charge oscillations is presented. We note that this mechanism strongly differs from that inducing classical transversal oscillations.
In order to observe the typical asymmetric Fano dip characteristic of atomic ionization resonances, as well as in very small interacting nanoparticles, one needs narrow resonance and a continuum, which leads to the strong asymmetry. Obviously, in identical and very small interacting nanoparticles, when the damping of both rates is the same, a Fano resonance does not arise. However, for identical and large enough nanoparticles a Fano dip with a small asymmetry appears, when plasmonic modes (in our case QPS and induced TSP) are excited. The small asymmetry in our results is due to the small difference between the damping constants of two modes. Contrarily to atomic systems, in experiments and for some configurations of interacting metallic nanoparticles it is possible to detect the Fano dip with a small asymmetry, which was demonstrated theoretically is our study. In sensing applications of MXenes it is interesting to analyze the quality factor of resonances. It can be calculated using the method presented in [
35].

 ,
, 


