Article

Dispersion Tailoring and Four-Wave Mixing in Silica Microspheres with Germanosilicate Coating

by
Maria P. Marisova
1,2,
Alexey V. Andrianov
1,
Gerd Leuchs
1,3 and
Elena A. Anashkina
1,2,*
1
Institute of Applied Physics of the Russian Academy of Sciences, 46 Ulyanov Street, 603950 Nizhny Novgorod, Russia
2
Advanced School of General and Applied Physics, Lobachevsky State University of Nizhny Novgorod, 23 Gagarin Ave., 603022 Nizhny Novgorod, Russia
3
Max Planck Institute for the Science of Light, Staudtstr. 2, D-91058 Erlangen, Germany
*
Author to whom correspondence should be addressed.
Photonics 2021, 8(11), 473; https://doi.org/10.3390/photonics8110473
Submission received: 28 September 2021 / Revised: 21 October 2021 / Accepted: 22 October 2021 / Published: 24 October 2021

Abstract

:
Optical whispering gallery mode microresonators with controllable parameters in the telecommunication range are demanded for diverse applications. Controlling group velocity dispersion (GVD) in microresonators is an important problem, as near-zero GVD in a broad wavelength range could contribute to the development of new microresonator-based light sources. We demonstrated theoretically near-zero dispersion tailoring in the SCL-band in combination with free-spectral range (FSR) optimization for FSR = 200 GHz and 300 GHz in silica glass microspheres with micron-scale germanosilicate coating. As an illustration of a possible application of such a GVD, we also performed a theoretical study of degenerate four-wave mixing (FWM) processes in the proposed microresonators for pumping in the SCL-band. We found that in some cases the generation of two or even three pairs of waves–satellites in a FWM process is possible in principle due to the specific GVD features. We also determined optimal microresonator configurations for achieving gradual change in the satellite frequency shift for the pump wavelengths in the SCL-, S-, CL-, C-, and L-bands. The maximum obtained FWM satellite tunability span was ~78 THz for a pump wavelength change of ~30 nm, which greatly exceeds the results for a regular silica microsphere without coating.

1. Introduction

Optical χ(3) microresonators with whispering-gallery modes (WGMs) are widely used in fundamental research and various applications, such as spectroscopy [1,2], sensing [3,4,5], optical filtering [6], microwave photonic filtering [7], telecommunication [8,9,10,11], and in many more areas [12]. For nonlinear wave conversion processes, which are essential for some applications, significant constraints are imposed on the parameters of a microresonator, especially on group velocity dispersion (GVD). Dispersion tailoring is an important problem, as the development of systematic optimization methods inherently contribute to the development of new microresonator-based light sources with desired characteristics. Designing a microresonator with near-zero GVD in a broadband wavelength range could facilitate the realization of four-wave mixing (FWM) effects, including the optical frequency comb generation and the generation of correlated photon pairs [13] and entangled combs of photon pairs [14]. Such microresonators with controllable near-zero GVD can be interesting for the study of recently discovered zero-dispersion solitons [15]. The development of new approaches to the dispersion tailoring problem in microresonators as well as the investigation of their application to specific cases are highly important.
Here we propose using a silica glass microsphere covered with a micron-thick layer of germanosilicate glass ((1 − X)·SiO2X·GeO2) for achieving flat, near-zero GVD in the 1.46–1.625-μm telecommunication SCL-band, demonstrating a systematic approach to the parameter optimization problem and numerically studying the possibilities of achieving the target characteristics. The proposed microresonator design can be manufactured using available technologies. Silica glass microspheres with controlled parameters can be easily and quickly made of a telecom fiber, for example, using special programs for a fiber splicer [11]. Physical characteristics of germanosilicate glasses are similar to silica glass characteristics [16], which makes them a good choice for the layer material. Germanate and germanosilicate thin films can be fabricated by different techniques: chemical vapor deposition and flame hydrolysis [17], radio-frequency sputtering [18,19,20], and sol-gel [21,22,23]. Radio-frequency sputtering and sol-gel manufacturing methods provide control over molar composition of the deposited coating [20,21,22,23,24]. Silica glass microresonators with germanosilicate coating were successfully manufactured [25]. Microresonators covered with nanometer- and micron-thickness coating based on different materials were earlier demonstrated for various purposes [4,5,26,27]; therefore, the manufacturing process is well known. A monolithic microresonator may be covered with a thin layer of a different material for compensating the thermo-optic effect [28], designing high-sensitivity sensors [4,5,27], and enhancing Q-factor in liquid media [29].
We propose using the microresonators with coating for dispersion tailoring, in particular, aimed at achieving small anomalous GVD in a broad wavelength region. In monolithic microspheres without coating, zero-dispersion wavelength (ZDW) λZD can only be red-shifted relative to the ZDW of the material [30]; however, there are no such limitations for hollow bubble-like microspheres [31,32]. Therefore, we put forth the idea that, in the case of a coated microsphere, both solid sphere and coating geometric GVD contributions could compensate material GVD in a broader wavelength region than in a monolithic or a hollow microsphere separately. Here we demonstrate a microresonator parameter optimization for achieving small, flat, anomalous GVD in a broad wavelength region. We suggest using three optimization parameters: coating composition (molar content of GeO2), microsphere radius, and layer thickness. Moreover, we also studied the dispersion optimization, taking into account the free-spectral range (FSR), which is important for practical applications. Then, we investigated degenerate four-wave mixing (FWM) processes in the microresonators of the suggested design. These are key processes for the realization of χ(3) effects in microresonators [33]. The flat, near-zero GVD curves could potentially enhance FWM effects, as a phase-matching condition, for a FWM generation is, basically, a condition of mutual compensation of dispersion- and nonlinearity-related phase shifts. Therefore, some new FWM results could be expected for the microresonators of the proposed design.

2. Methods

2.1. Microresonator Model Description

The proposed microresonator design can be described as follows: monolithic, silica glass (SiO2), solid microspheres with a diameter of 2R, coated with a layer of germanosilicate glass ((1 − X)·SiO2X·GeO2, where X is the molar content of GeO2) of thickness b, as depicted in Figure 1a.
For bulk silica glass, λZD ≈ 1.28 μm, for bulk germanate glass, λZD ≈ 1.74 μm [16]; anomalous GVD is achieved at longer wavelengths in both cases. The dependence of the linear refractive index n on the wavelength λ of the germanosilicate glass can be calculated using the following equation [34]:
n 2 = 1 + i = 1 3 [ S A i + X · ( G A i S A i ) ] λ 2 λ 2 [ S l i + X · ( G l i S l i ) ] 2 ,
where SAi and Sli are the Sellmeier coefficients for silica glass; GAi and Gli are the Sellmeier coefficients for germanate glass; and SA1 = 0.6961663, Sl1 = 0.0684043 μm, SA2 = 0.4079426, Sl2 = 0.1162414 μm, SA3 = 0.8974794, Sl3 = 9.896161 μm, GA1 = 0.80686642, Gl1 = 0.068972606 μm, GA2 = 0.71815848, Gl2 = 0.15396605 μm, GA3 = 0.85416831, and Gl3 = 11.841931 μm. The refractive index of regular silica glass corresponds to X = 0 in Equation (1).
To calculate dispersion of a microresonator, we numerically solved the characteristic equation for the fundamental TE mode family [35]:
χ l ( k [ R + b ] ) χ l ( k [ R + b ] ) = n   N l ψ l ( n k [ R + b ] ) + χ l ( n k [ R + b ] ) N l ψ l ( n k [ R + b ] ) + χ l ( n k [ R + b ] ) ,
where the prime is the derivative with respect to the argument in parenthesis, l is the azimuthal index, and k = 2·π/λ is the light propagation constant in vacuum. The coefficient Nl can be expressed as:
N l = n i n ψ l ( n i n k R ) χ l ( n k R ) n ψ l ( n i n k R ) χ l ( n k R ) n i n ψ l ( n i n k R ) ψ l ( n k R ) + n ψ l ( n i n k R ) ψ l ( n k R ) ,
ψ l ( z ) = π z 2 j l + 1 / 2 ( z ) ;     χ l ( z ) = π z 2   y l + 1 / 2 ( z ) ,
where jl+1/2 and yl+1/2 are the Bessel function and the Neumann function of order l + 1/2, respectively. The glass dispersion given by Equation (1) was taken into account iteratively. To ensure the evaluation of the fundamental mode, several localization guesses were placed near the approximate resonance condition l ≈ k·n·R, and then the smallest obtained root k was chosen.
The expressions for electric and magnetic fields in a microresonator mode are rather cumbersome and are not presented here; however, they can be found in [35]. The characteristic distributions of the electric field absolute value in a fundamental TE mode are shown in Figure 1b,c.

2.2. Group Velocity Dispersion Calculation and Dispersion Optimization

To calculate the second-order dispersion of a microresonator, we used the previously obtained eigenfrequencies of the fundamental TE mode family:
β 2 = 1 4 π 2 R Δ ( Δ f l ) ( Δ f l ) 3 ,
where Δfl = (fl+1fl−1)/2 and Δ(Δfl) = fl+1 − 2fl + fl−1; fl = c/λ is the eigenfrequency with mode index l. To optimize a microresonator for achieving flat, small, negative β2 in a broad wavelength region for tuning, we chose three parameters: molar content X of GeO2 in the microresonator coating, silica microsphere radius R, and coating thickness b. To find a parameter combination {X, R, b} that provides the microresonator GVD function β2(λ) similar to the target β20(λ) in the wavelength range from λ1 to λ2, we introduce the following deviation function J(X, b, R):
J ( X ,   b ,   R ) = ( λ 1 λ 2 ( β 2 ( λ ) β 2 0 ( λ ) ) 2 d λ λ 2 λ 1 ) 1 / 2 .
The GVD optimization was performed in the SCL-band: λ1 = 1.46 μm, λ2 = 1.625 μm. The target GVD was chosen to be β20(λ) = −2 ps2/km. The optimization algorithm was based on an exhaustive search for the minimum of J(X, b, R) on a parameter grid with reasonable spacing and limits. The spacing of the used grid was set to be the following: dR = 10 μm, db = 0.1 μm, and dX = 0.1; parameter ranges: R = 20…200 μm, b = 1…3 μm, and X = 0…1.

2.3. Calculation of the Phase-Matching Curves for the Degenerate FWM Process

For theoretical estimation of possible generation of sidebands via degenerate FWM in the microresonators of the proposed design, we followed the strong continuous-wave (CW) pump approximation approach, which is thoroughly discussed in [36,37]. In short, we assumed that two relatively weak sidebands with frequencies ω+,− = ωp ± Ω, equally shifted from the pump frequency ωp, are generated. The largest gain coefficients are achieved for the sidebands with Ω satisfying the following phase-matching condition [36]:
n = 1 β 2 n ( ω p ) Ω 2 n ( 2 n ) ! L + 2 γ P L δ 0 = 0 ,
where L = 2·p·R, P is the intracavity power, Δ0 is the frequency detuning, γ is the nonlinear coefficient, and the coefficients β2n = d2nk/2n are even-order dispersion coefficients. As for the microresonators with flat dispersion curves, β2 and β4 are significantly smaller than for regular silica microspheres. We truncated the sum in Equation (7) after n = 4, thus taking into account sixth- and eighth-order dispersion, while for regular silica microspheres, n = 2 is enough [36].
The intracavity power P was calculated from the input power Pin as follows [38]:
P P i n = 1 ρ ( 1 ρ ) 2 + 4 ρ s i n 2   ( δ 0 + γ P L 2 )   ,
where ρ is the power coupling coefficient, as schematically shown in Figure 1a; ρ can be expressed through the finesse parameter: F = 2·π/(1ρ). In the case when Equation (8) had three roots, we chose the upper stable branch. The nonlinear coefficient γ was calculated using the following expression [39]:
γ = 2 π λ n 2 ( r ) S φ 2 d 2 r ( S φ 2 d 2 r ) 2 ,
where Sφ is the azimuthal projection of the Pointing vector that can be derived from the expressions for electric and magnetic fields in a microresonator mode [35] and n2(r) is the nonlinear Kerr coefficient. For r < R, n2 = 2.2·10−20 m2W−1; for R < r < R + b, n2 = (2.2 + X·2.9)·10−20 m2W−1; and for r > R + b, n2 = 0 [40]. We calculated γ for λ ≈ 1.55 μm and neglected its wavelength dependence.

3. Results

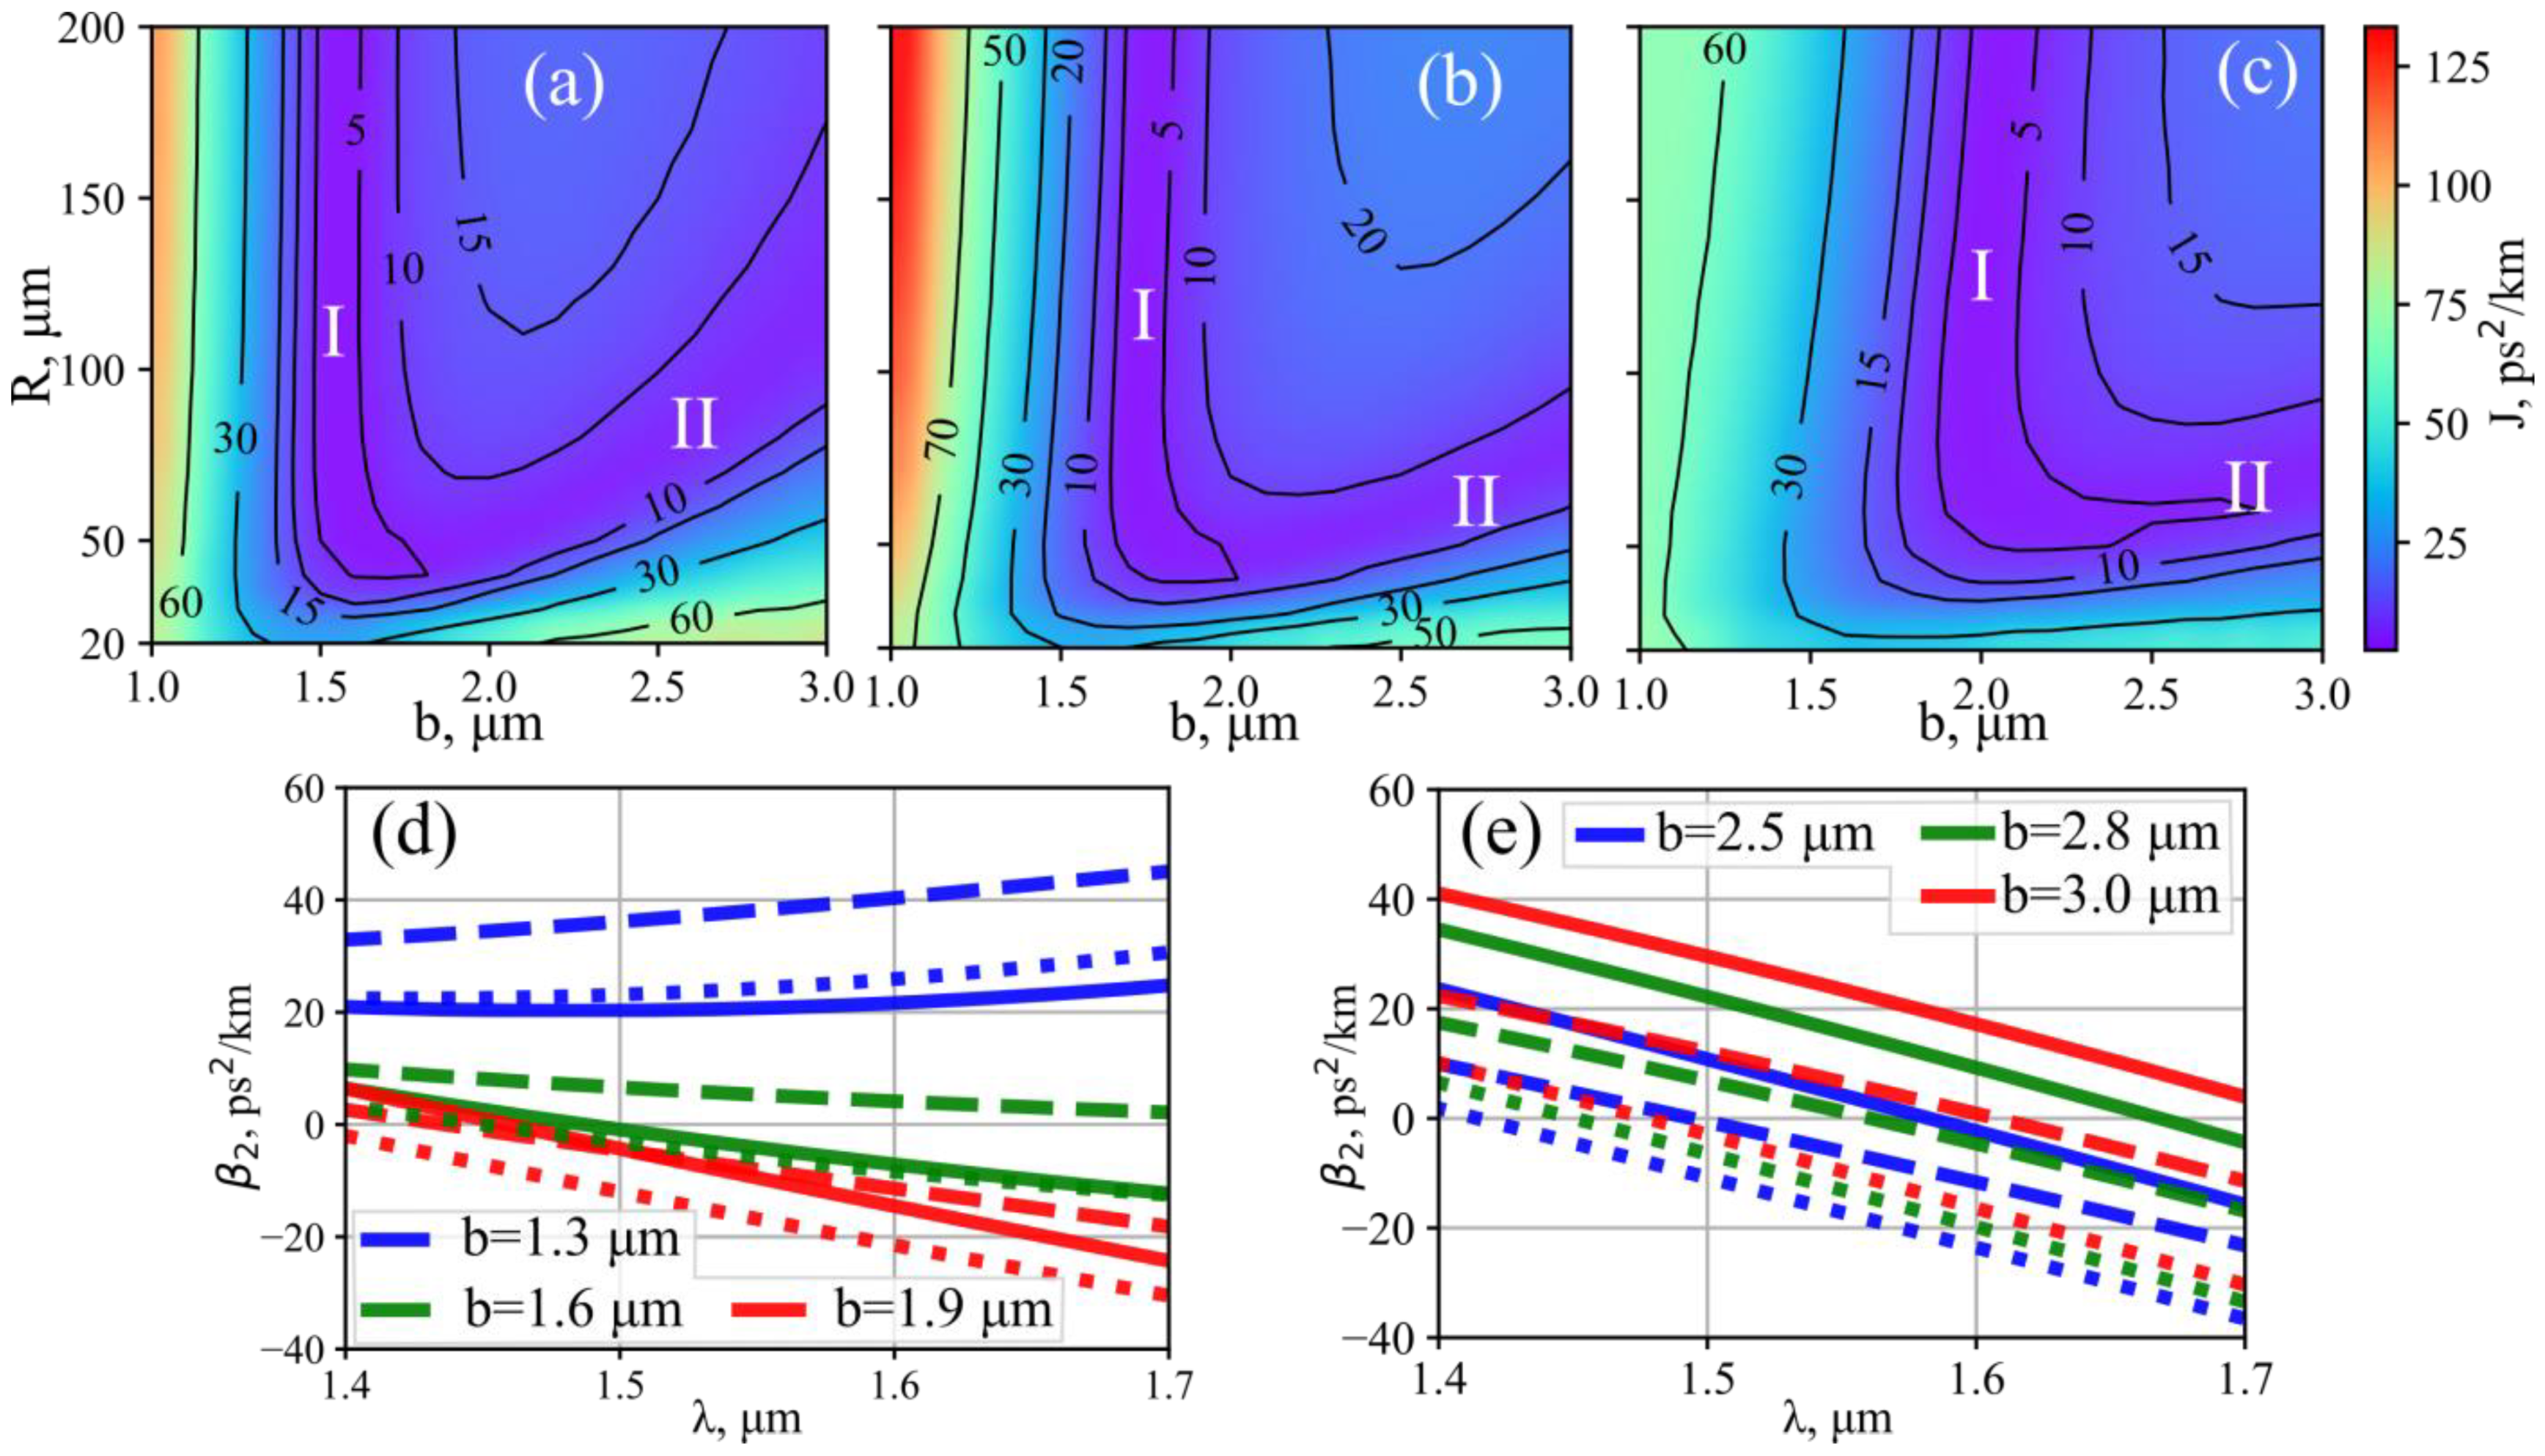
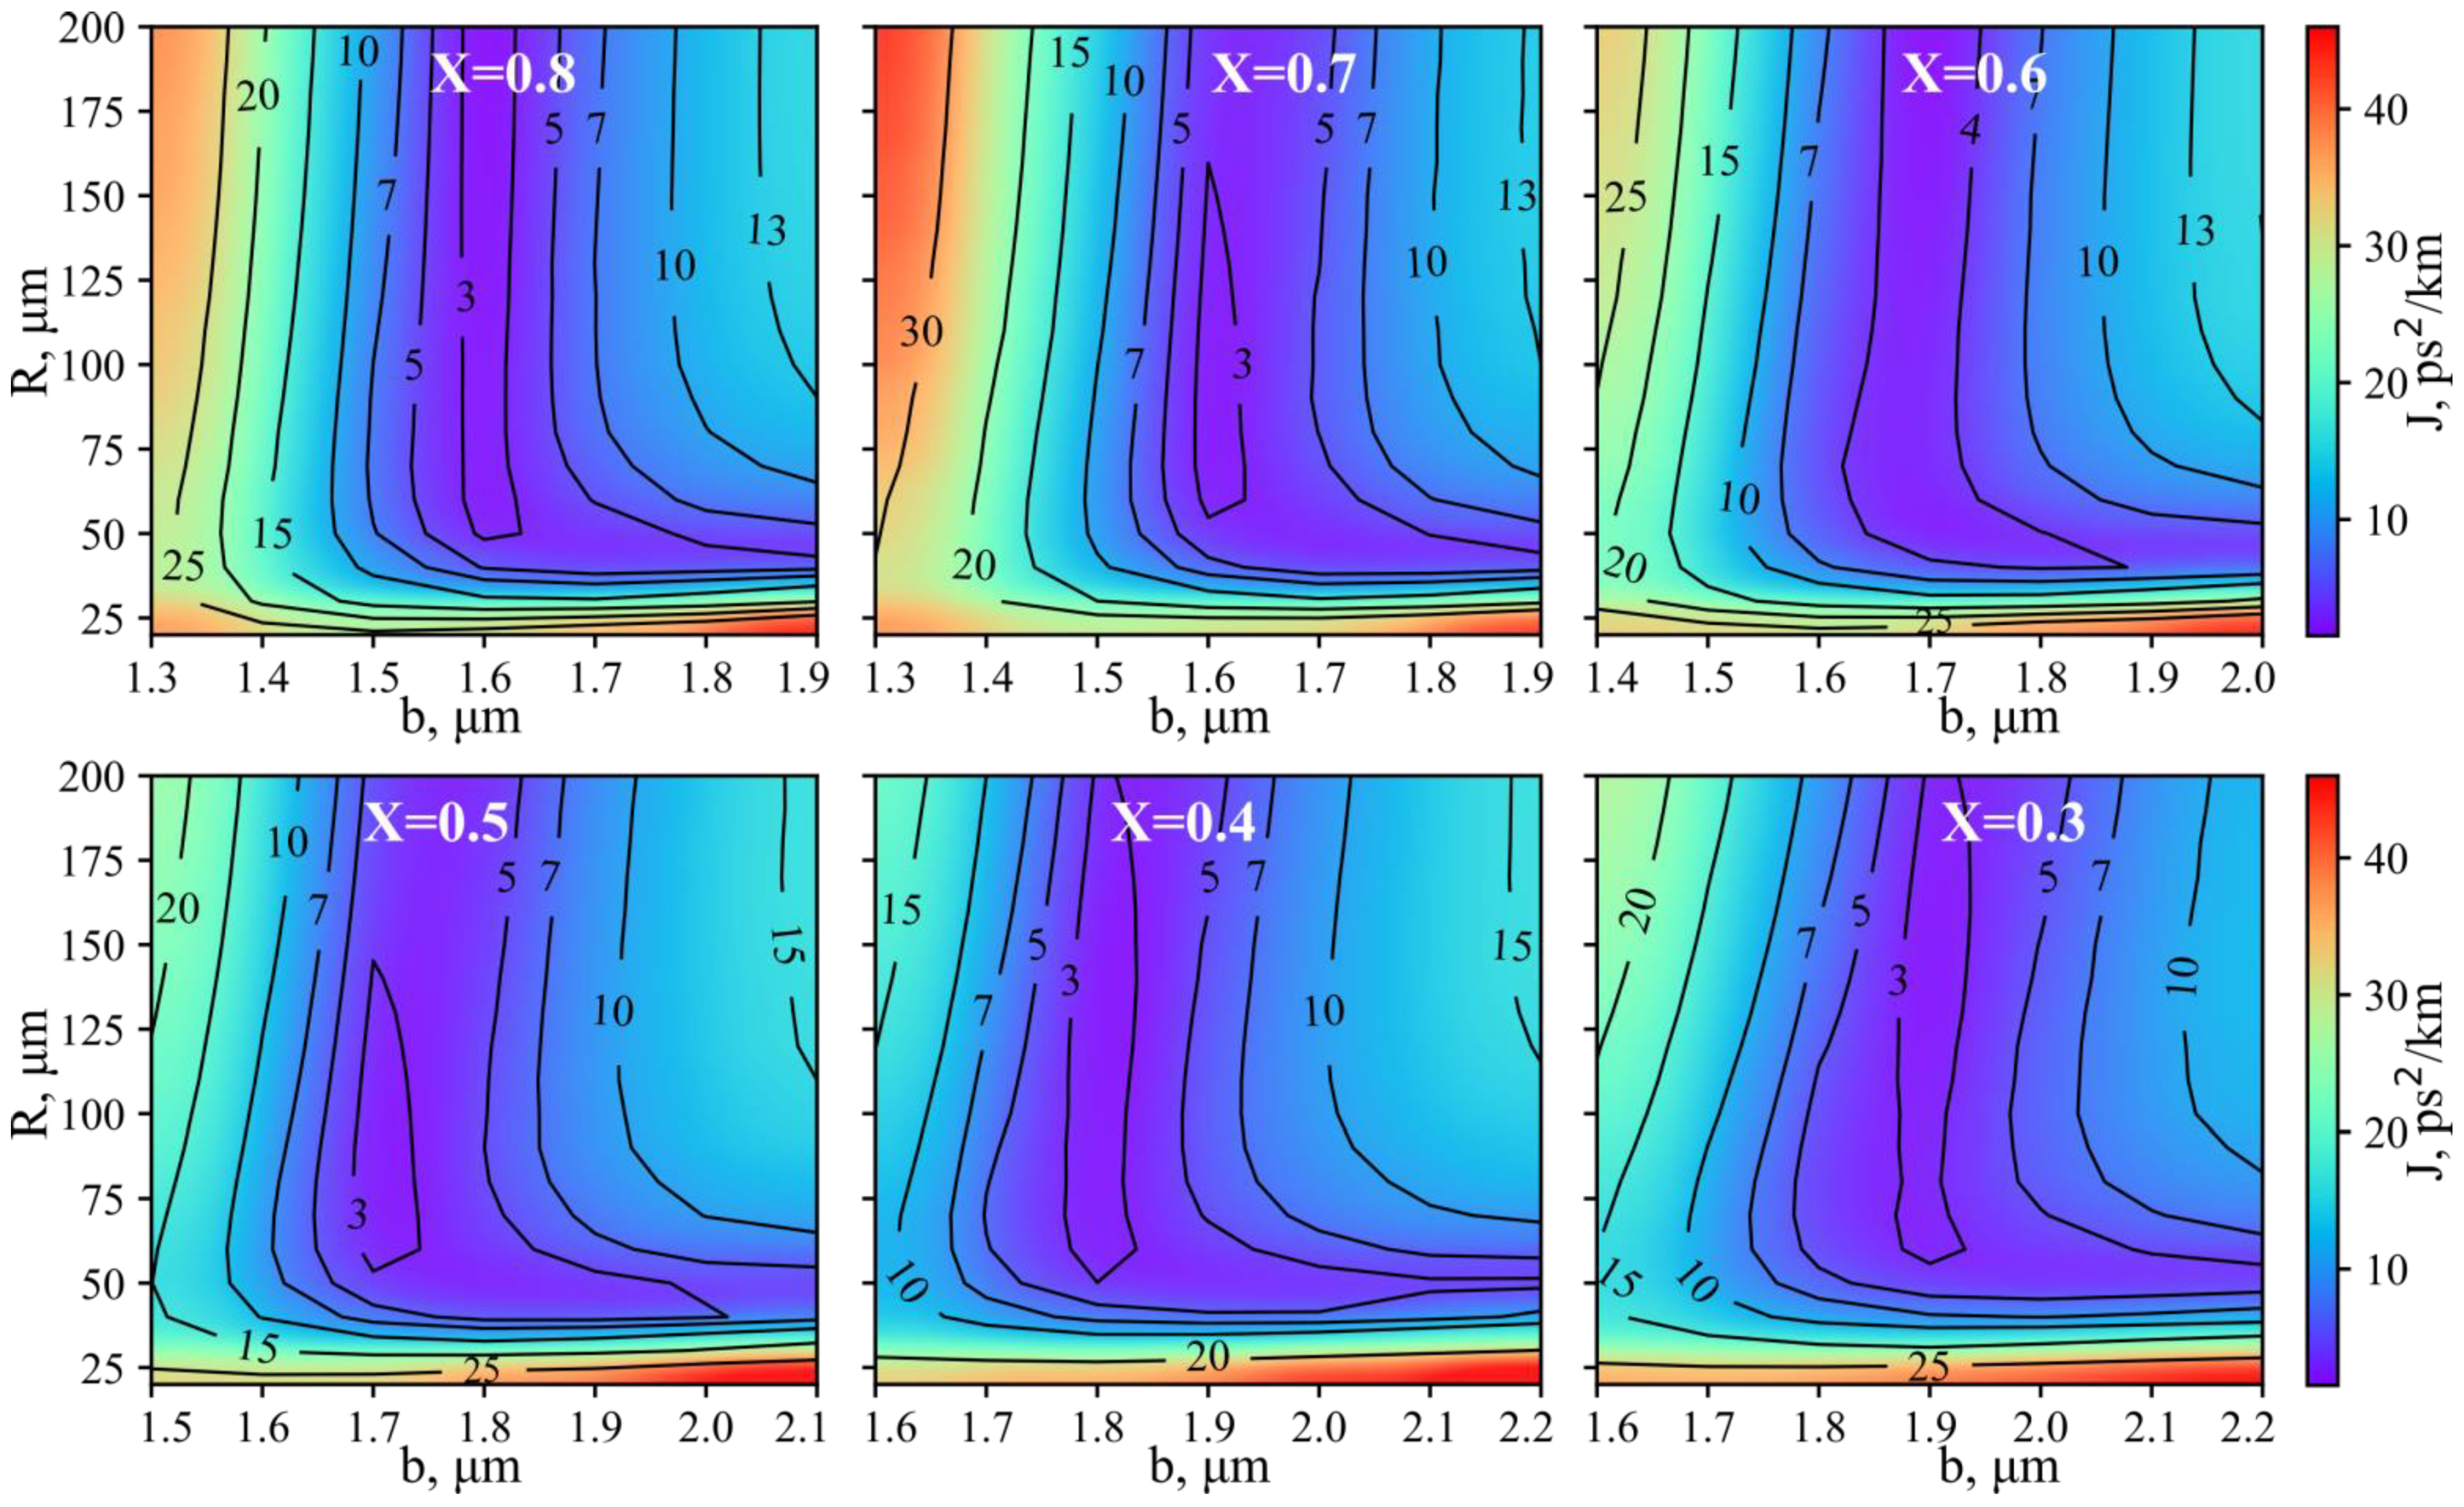
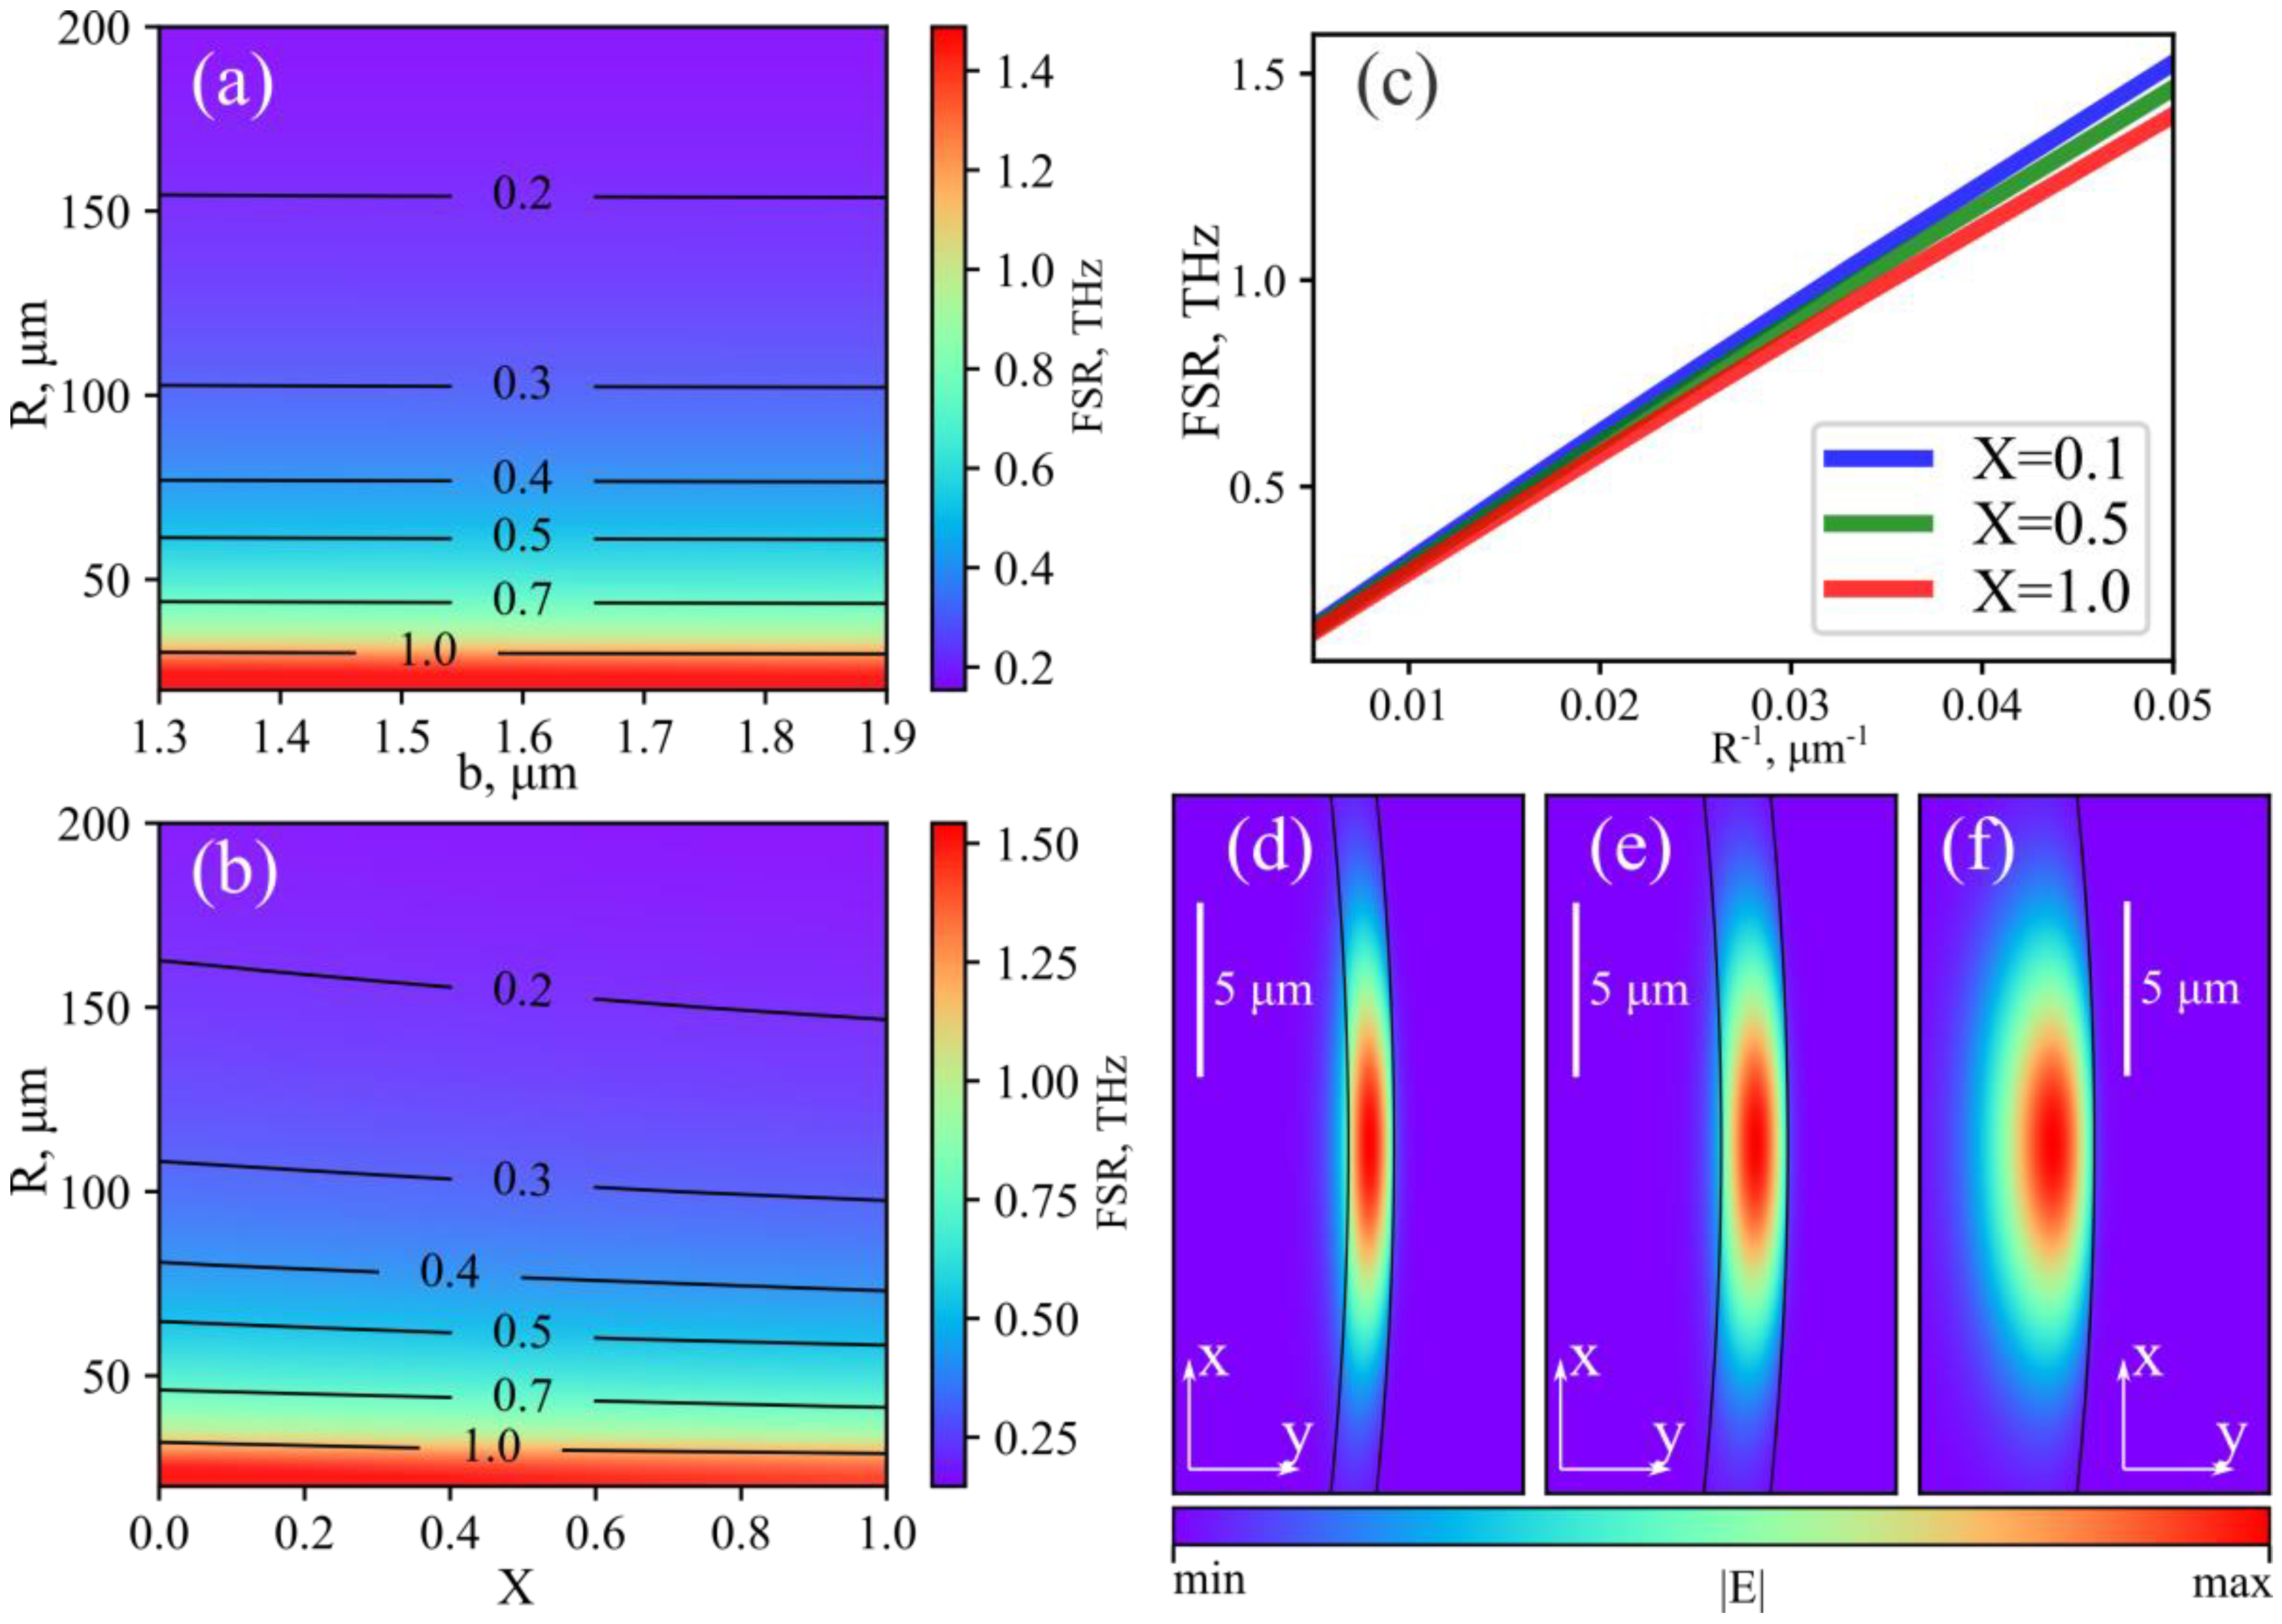
3.1. Dispersion Tailoring

To perform dispersion optimization, we calculated the dispersion curves of the microresonators in the SCL-band (λ = 1.46–1.625 μm) on the parameter grid with the following spacings, dR = 10 μm, db = 0.1 μm, and dX = 0.1, and in parameter ranges, R = 20…200 μm, b = 1…3 μm, and X = 0…1. Using the calculated β2(λ), we searched for the minimum of the deviation function J(X, b, R) (see Equation (6) for more details). We discovered that, for each X = const, function J(b, R) has two regions of local minimal values, I and II, as shown in Figure 2a–c. Region I location almost does not depend on R but is greatly limited by the layer thickness b; for different X, region I is found approximately within the 1.5 μm ≤ b ≤ 2.3 μm range. Region II location significantly varies with R, and b is larger than for region I.
We discovered that changes in the microresonator geometrical parameters in regions I and II correspond to different transformations of dispersion curves: In region I a change in b roughly provides a change in the curve slope, as shown in Figure 2d (see the transformation of the lines with the same pattern); in region II a change in b corresponds to a curve shift, while maintaining the same curve slope, as shown in Figure 2e. Therefore, the flattest dispersion curves are located in region I; region II contains β2(λ) curves with alternating signs and is of no interest for our dispersion tailoring study.
The calculated values of the deviation function J in region I for X that yields the smallest J are provided in Figure 3. The overall minimum value is J = 1.5 ps2/km, and is achieved for X = 0.6, R = 200 μm, b = 1.6 μm, although there are some other parameter combinations that provide J < 2 ps2/km, thus guaranteeing suitable dispersion curves, as shown in Figure 4a. Figure 4a also shows bulk silica and germanate glass dispersion, as well as the best case of a regular germanosilicate microsphere (using data from [30]). For the optimized regular microsphere J ≈ 5 ps2/km, this is significantly larger than in the coated microresonators.
We also investigated the sensitivity of the obtained GVD curves on the parameter perturbations on the example of a microresonator with X = 0.8, R = 180 μm, and b = 1.6 μm. We found that, in order to keep J less than 3 ps2/km, the parameters should be in the following ranges: 50 μm ≤ R ≤ 450 μm, 1.57 μm ≤ b ≤ 1.63 μm, and 0.71 ≤ X ≤ 0.91; the boundary cases are shown in Figure 4b. The GVD is the most sensitive to changes in b and the least sensitive to changes in R; this fact can also be explained by the character of Figure 3 subplots.
The free spectral range (FSR) parameter is essential for many microresonator applications, including telecommunication. FSR can be calculated as the distance between the eigenfrequencies. We evaluated the FSR for the mode closest to λp = 1.55 μm using our eigenfrequency data calculated earlier. We found that, in the studied parameter range, the FSR value almost does not depend on the coating thickness b, as illustrated in Figure 5a for X = 0.5. The overall FSR calculation results are presented in Figure 5b for b = 1.7 μm, neglecting the FSR dependence on b.
The negligible FSR dependence on b can be explained using the approximate resonance condition in terms of the effective refractive index of the mode neff,l:
FSR = f l + 1 f l = c ( l + 1 ) 2 π n e f f ,   l + 1 R c ( l + 1 ) 2 π n e f f ,   l R c 2 π n e f f ,   l R .
Equation (10) shows that the FSR approximately depends only on R and neff,l; moreover, we verified that the FSR is an almost linear function of R−1, as shown in Figure 5c. Therefore, neff,l depends primarily on the layer material parameter X and weakly depends on R and b. This can be explained using the fact that WGMs in the current parameter range are strongly localized in the thin, optically denser microresonator coating, as shown in Figure 5d,e in comparison with the case of a solid GeO2 microsphere, shown in Figure 5f.
The obtained results for dispersion tailoring and FSR calculation can be used to develop a relatively simple optimization method for GVD under strict FSR limitation. This is vital for the development of a wavelength division multiplexed-passive optical network (WDM-PON), since the FSR in these systems should satisfy the condition FSR = N × 100 GHz (where N = 0.125, 0.25, 0.5, 1, 2, 3, …) in accordance with the ITU-T recommendation G.694.1 [41]. Indeed, the optimal parameter range for GVD optimization mainly depends on b and, to a lesser extent, on X, while the FSR does not depend on b. Therefore, the optimization process can be divided into two separate steps: FSR optimization for any b using Figure 5b, resulting in suitable {X, R} pairs, and the subsequent independent GVD optimization involving b and the previously obtained {X, R} pairs.
We also calculated nonlinear coefficients γ using Equation (9); the results are shown in Figure 6 for the microresonator parameters that provide near-optimal dispersion curves.
The obtained theoretical results embrace all important characteristics of the proposed microresonators in the considered parameter range, including GVD, FSR, and nonlinear coefficient. Using this data, we chose some microresonator configurations that ensure optimal GVD and fixed FSR = 200 GHz or FSR = 300 GHz (±1%). The corresponding data and values of the GVD deviation function J, as well as the nonlinear coefficients γ, are shown in Table 1.

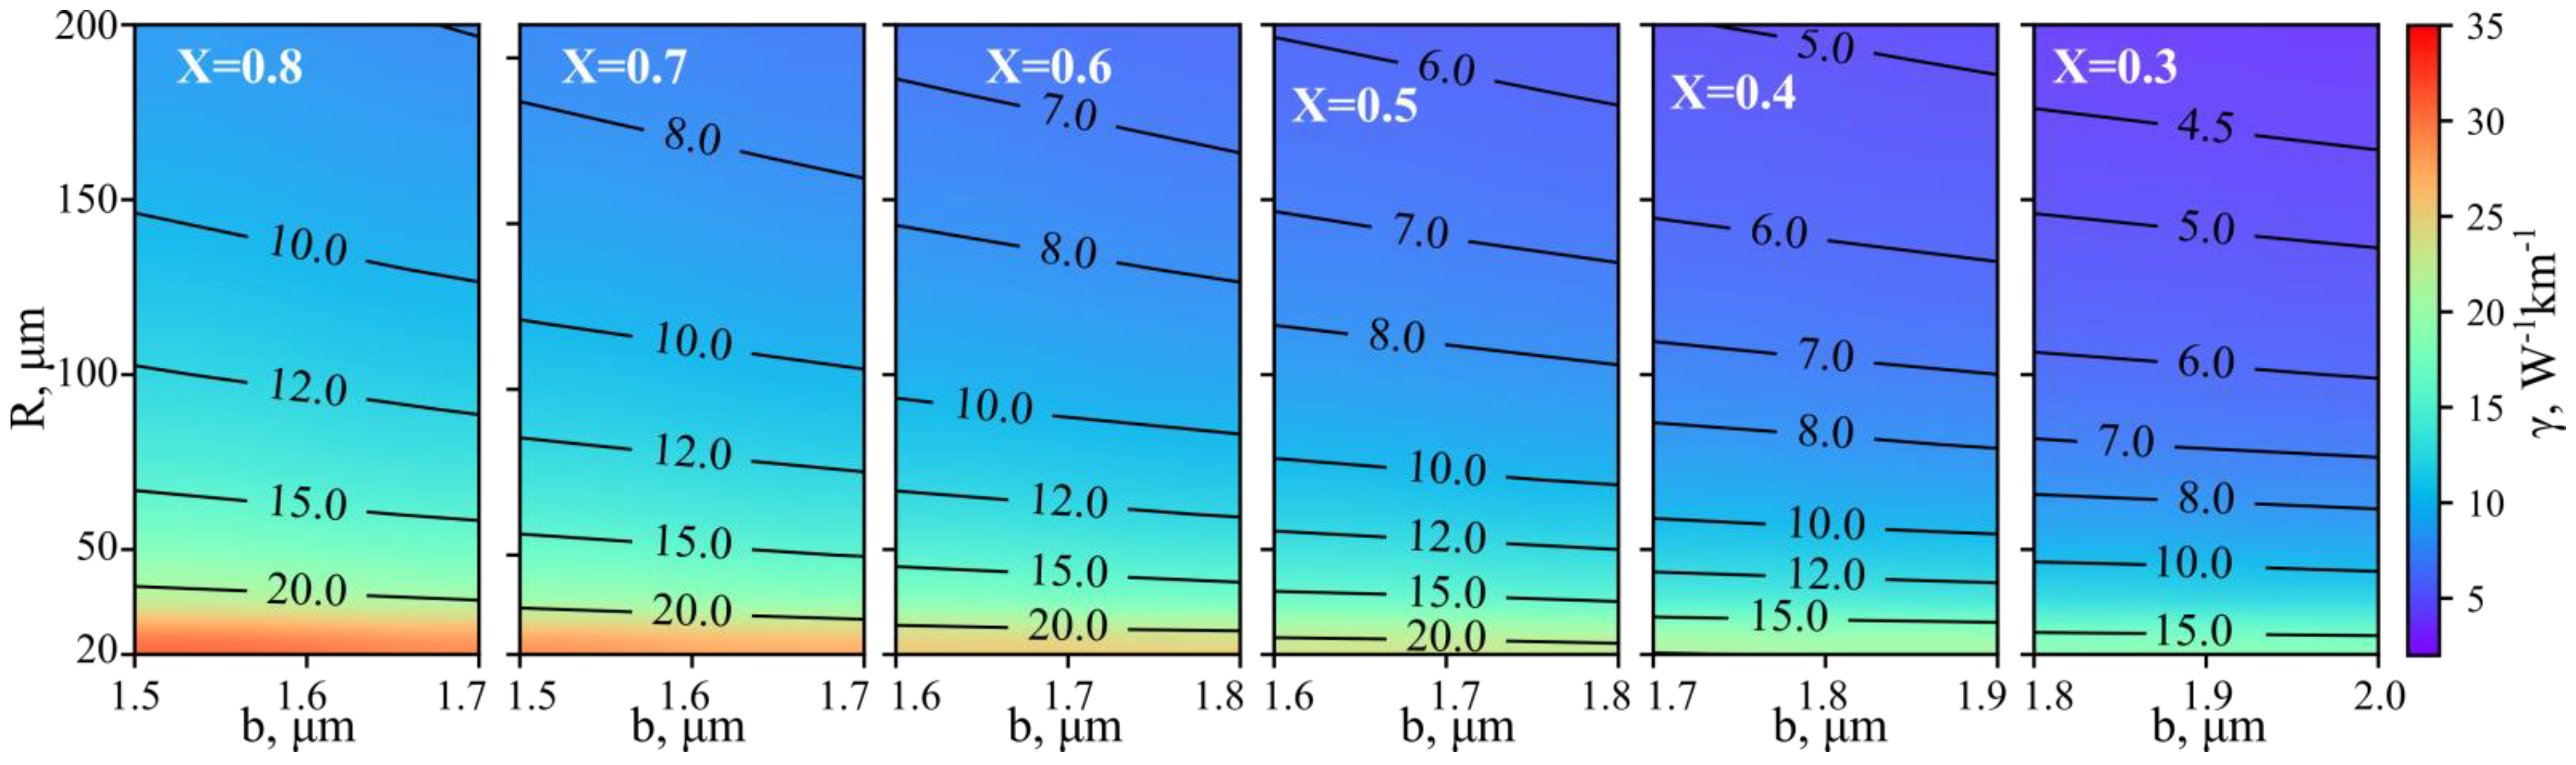
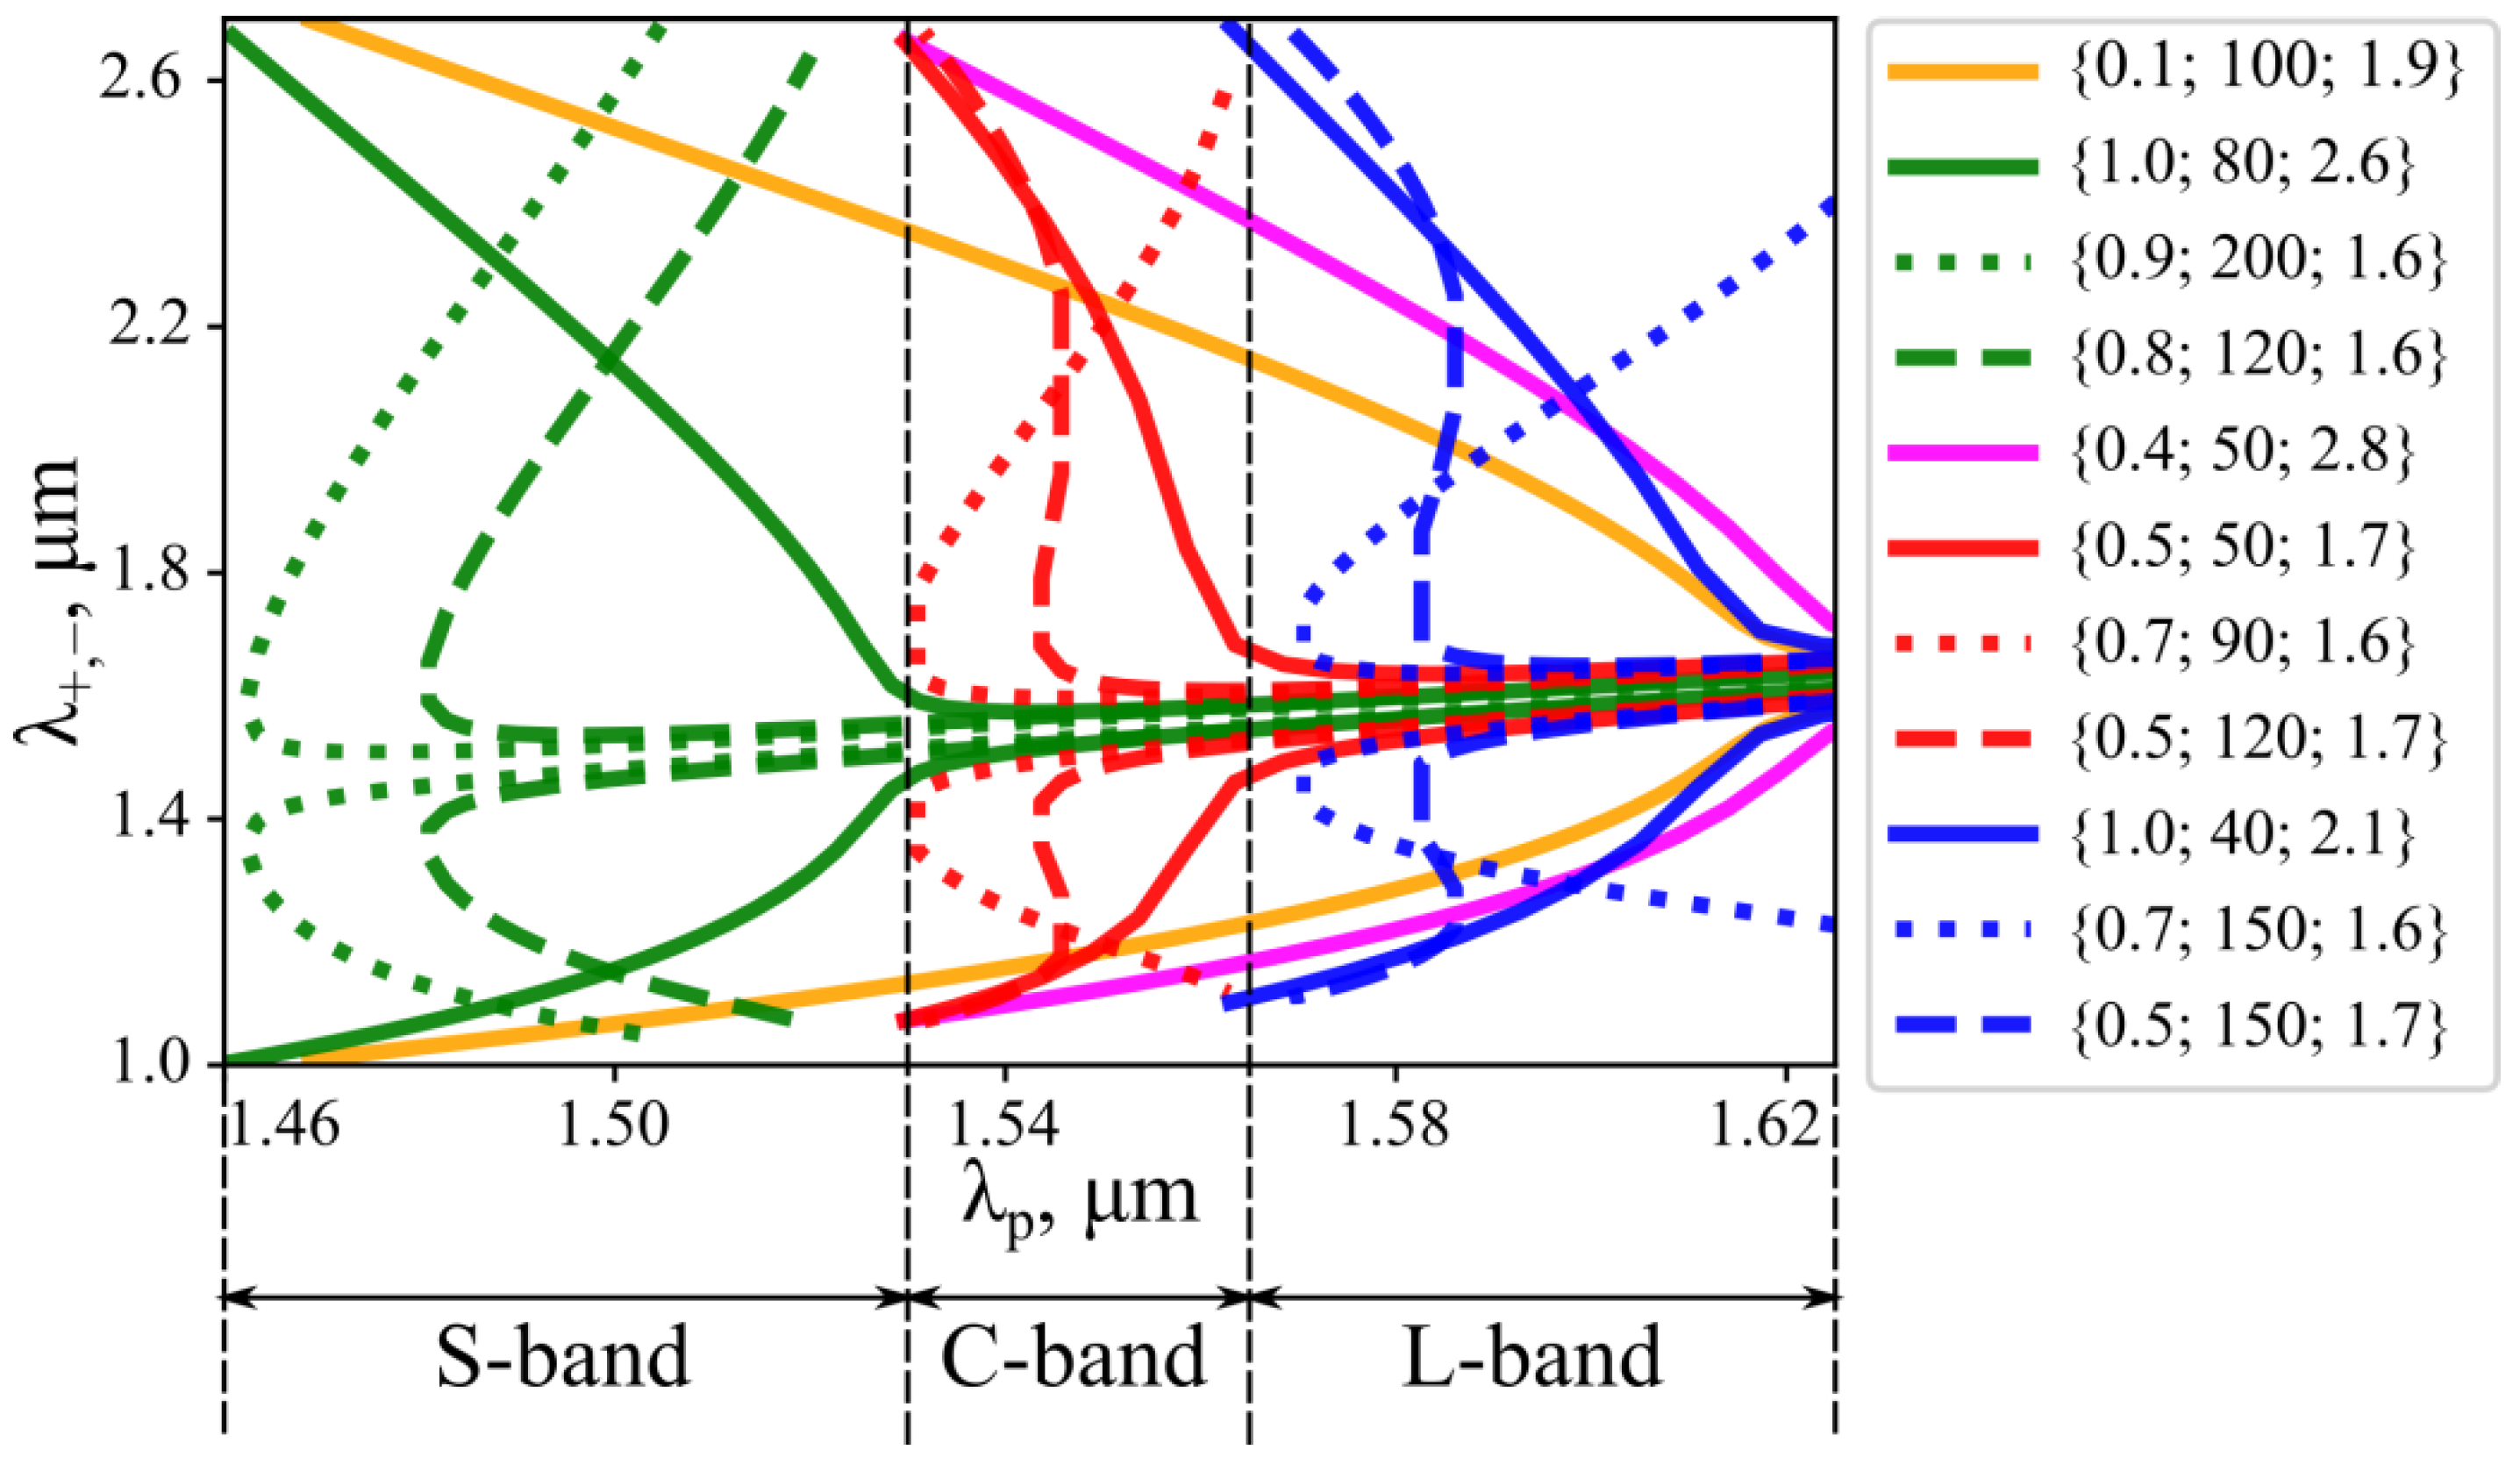
3.2. Four-Wave Mixing

Let us now theoretically analyze the degenerate FWM process in the microresonators of the proposed design using a strong CW pump approximation, as described in Section 2.3. The study of FWM seems very promising, as the uncommon flat dispersion curves obtained in Section 3.2 contribute to smaller dispersion coefficients β2n that yield larger frequency shifts Ω in Equation (7). Therefore, new results are expected in comparison with silica microspheres [36,37]. This could broaden the frequency range of the generated waves–satellites, as well as enhance the tunability of the generated radiation. We studied the FWM process for pump wavelengths in the SCL-band (λp = 1.46–1.625 mm). These pump wavelengths can be easily achieved experimentally with existing narrow-band tunable telecommunication lasers. We calculated the satellite frequencies ω+, = ωp ± Ω from Equation (7) using γ (near λp ≈ 1.55 mm) from Equation (9), P from Equation (8), and the previously calculated GVD data. We set the input pump power Pin = 5 mW, finesse F = 5·104, and frequency detuning Δ0 ~ 0. These values correspond to possible parameters in a real experiment. The satellite wavelengths were also limited by the transparency of the germanosilicate glass λ ≤ 2.7 μm [16]; this condition should be satisfied for both satellites in the pair. We found that for the studied microresonators there were three fundamentally different possible configurations of the phase-matching curves λ+,−(λp), as illustrated in Figure 7.
In the insets in Figure 7a–c the calculated functions β2(λ), β2(λ), and β2(λ) are shown schematically; their behavior greatly determines the character of the phase-matching curves. The case shown in Figure 7a is similar to the silica microsphere case (β2 > 0; β4 < 0); Equation (7) has only one root. The configurations shown in Figure 7b,c cannot be achieved for fundamental modes of a regular silica microsphere in the studied parameter range, as they require β2 < 0; β4 > 0. The configuration in Figure 7c is feasible because of the phase-matching by the dispersion orders higher than the fourth (in this particular case, β6 plays the most important role), which takes place for flat, near-zero GVD curves. In a narrow λp interval it allows for simultaneous generation of up to three satellite pairs, thus making the satellite radiation exceptionally tunable.
To estimate the possible tunability span of the generated satellite frequencies, we introduced a phase-matching curve parameter Δf, which is equal to the difference between the largest and the smallest possible frequency shift in a specific λp range. The calculation results for Δf are shown in Figure 8 for pump wavelengths in the SCL-band for several X values that provide the largest amount of microresonator configurations yielding near-maximum tunability.
It is evident from Figure 8 that for each composition of the microresonator coating there is a limited range of geometric parameters yielding the largest tunability. This parameter range is plateau-like because the chosen pump range is relatively broad, and major changes in the phase-matching curve can gradually occur in the whole SCL-band or only in part of it. Therefore, there are multiple microresonator parameter choices for achieving the best tunability of the FWM-generated satellites for any coating composition. Moreover, it is possible to obtain phase-matching curves optimized for a gradual change in the whole SCL-band or its subbands. Figure 9 shows some calculated phase-matching curves, optimized for different pump ranges: SCL-, S-, CL-, C-, and L-bands separately.
The solid curves in Figure 9 are the phase-matching curves optimized for a gradual change in a certain pump range. Furthermore, as illustrated in Figure 9 with dashed and dotted curves, in the S-, C-, and L-bands we found microresonator configurations that fulfill a phase-matching condition for two or even three pairs of FWM satellites in a significant part of a certain band. Some of these cases led to the largest frequency shift sensitivity and to a change in the pump wavelength. For instance, for a microresonator with X = 0.5, R = 120 μm, and b = 1.7 μm satellite frequency shifts varied from 5.5 THz to 84 THz for the relatively small pump change from λp = 1.562 μm to λp = 1.532 μm, respectively (red dashed curve in Figure 9), thus greatly exceeding achievable tunability for silica microspheres [36] in this parameter range.

4. Discussion

We theoretically investigated optical silica glass microresonators with characteristic sizes of 40–400 μm, coated with a germanosilicate glass ((1 − X)·SiO2X·GeO2) microlayer with a varying relative molar concentration of germanium dioxide X. We proposed, developed, and used the parameter optimization method for achieving small, anomalous, flat group velocity dispersion (GVD) in the SCL-band. Optimal parameter combinations providing FSR = 200 GHz and FSR = 300 GHz for a pump wavelength of 1.55 μm, as well as nonlinear Kerr coefficients, were obtained. We found that microresonators with a microlayer thickness of 1.6 μm and a molar germanium dioxide content ≥0.6 in the layer material are near-optimal for achieving the desired GVD for both investigated FSR values. For FSR = 200 GHz, a silica microsphere radius is advised to be ≈150 μm, while for FSR = 300 GHz the recommended inner radius is ~100 μm.
We also theoretically investigated degenerate four-wave mixing (FWM) processes in the microresonators of the proposed design. We used the strong pump approximation to determine phase-matching conditions for pumping in the SCL-band, with the transparency of the used glass taken into account. We showed that the suggested microresonator design provides exceptional possibilities for tailoring the FWM phase-matching curves, as flat GVD yields larger frequency shifts, and higher-order (>4) dispersion phase-matching starts to play a significant role, as opposed to a regular, solid silica microsphere without coating. We obtained microresonator parameter combinations that gave a gradual change of the generated satellite frequency for the fixed pump wavelength ranges: the SCL-, S-, CL-, C-, and L-bands (as shown in Figure 9). We theoretically found that for some configurations it is possible to satisfy the phase-matching condition for two or even three satellite pairs. Consequently, the satellite frequency shift tunability span can be as high as 78 THz with the pump change as small as 30 nm; it is much larger than for regular silica microspheres without coating [36].

Author Contributions

Conceptualization, M.P.M., A.V.A. and E.A.A.; methodology, M.P.M.; software, M.P.M.; validation, G.L. and M.P.M.; formal analysis, M.P.M.; investigation, M.P.M.; data curation, M.P.M.; writing—original draft preparation, M.P.M.; writing—review and editing, A.V.A. and E.A.A.; visualization, M.P.M.; supervision, E.A.A. All authors have read and agreed to the published version of the manuscript.

Funding

The work is supported by Center of Excellence «Center of Photonics» funded by the Ministry of Science and Higher Education of the Russian Federation, contract № 075-15-2020-906.

Conflicts of Interest

The authors declare no conflict of interest.

References

  1. Suh, M.G.; Yang, Q.F.; Yang, K.Y.; Yi, X.; Vahala, K.J. Microresonator soliton dual-comb spectroscopy. Science 2016, 354, 600–603. [Google Scholar] [CrossRef] [PubMed] [Green Version]
  2. Yu, M.; Okawachi, Y.; Griffith, A.G.; Lipson, M.; Gaeta, A.L. Microresonator-based high-resolution gas spectroscopy. Opt. Lett. 2017, 42, 4442–4445. [Google Scholar] [CrossRef] [Green Version]
  3. Toropov, N.; Cabello, G.; Serrano, M.P.; Gutha, R.R.; Rafti, M.; Vollmer, F. Review of biosensing with whispering-gallery mode lasers. Light. Sci. Appl. 2021, 10, 42. [Google Scholar] [CrossRef] [PubMed]
  4. Zhivotkov, D.; Ristić, D.; Romanova, E.; Ivanda, M. Refractometric gas sensing using a whispering gallery mode microresonator coated with a supra-micron sol-gel layer. Opt. Mater. 2021, 118, 111286. [Google Scholar] [CrossRef]
  5. Brice, I.; Grundsteins, K.; Atvars, A.; Alnis, J.; Viter, R.; Ramanavicius, A. Whispering gallery mode resonator and glucose oxidase based glucose biosensor. Sens. Actuators B Chem. 2020, 318, 128004. [Google Scholar] [CrossRef]
  6. Han, Z.; Fast, S.S.; Klotz, E.; Vatnik, I.D.; Churkin, D.V. Optical filtering with axial whispering gallery modes on the surface of tapered optical fibers. Laser Phys. Lett. 2020, 17, 066201. [Google Scholar] [CrossRef]
  7. Sumetsky, M. SNAP microwave optical filters. Opt. Lett. 2021, 46, 4144–4147. [Google Scholar] [CrossRef] [PubMed]
  8. Pfeifle, J.; Brasch, V.; Lauermann, M.; Yu, Y.; Wegner, D.; Herr, T.; Hartinger, K.; Schindler, P.; Li, J.; Hillerkuss, D.; et al. Coherent terabit communications with microresonator Kerr frequency combs. Nat. Photon. 2014, 8, 375–380. [Google Scholar] [CrossRef] [PubMed] [Green Version]
  9. Braunfelds, J.; Murnieks, R.; Salgals, T.; Brice, I.; Sharashidze, T.; Lyashuk, I.; Ostrovskis, A.; Spolitis, S.; Alnis, J.; Porins, J.; et al. Frequency comb generation in WGM microsphere based generators for telecommunication applications. Quantum Electron. 2020, 50, 1043–1049. [Google Scholar] [CrossRef]
  10. Salgals, T.; Alnis, J.; Murnieks, R.; Brice, I.; Porins, J.; Andrianov, A.V.; Anashkina, E.A.; Spolitis, S.; Bobrovs, V. Demonstration of a fiber optical communication system employing a silica microsphere-based OFC source. Opt. Express 2021, 29, 10903–10913. [Google Scholar] [CrossRef]
  11. Spolitis, S.; Murnieks, R.; Skladova, L.; Salgals, T.; Andrianov, A.V.; Marisova, M.P.; Leuchs, G.; Anashkina, E.A.; Bobrovs, V. IM/DD WDM-PON communication system based on optical frequency comb generated in silica whispering gallery mode resonator. IEEE Access 2021, 9, 66335–66345. [Google Scholar] [CrossRef]
  12. Kippenberg, T.J.; Gaeta, A.L.; Lipson, M.; Gorodetsky, M.L. Dissipative Kerr solitons in optical microresonators. Science 2018, 361, eaan8083. [Google Scholar] [CrossRef] [Green Version]
  13. Ortiz-Ricardo, E.; Bertoni-Ocampo, C.; Maldonado-Terrón, M.; Garcia Zurita, A.; Ramirez-Alarcon, R.; Cruz Ramirez, H.; Castro-Beltrán, R.; U’Ren, A.B. Sub-MHz spectral width photon-pair source based on fused silica microspheres. Photonics Research 2021, 9, 2237–2252. [Google Scholar] [CrossRef]
  14. Chen, J.; Levine, Z.H.; Fan, J.; Migdall, A.L. Frequency-bin entangled comb of photon pairs from a Silicon-on-Insulator micro-resonator. Opt. Express 2011, 19, 1470–1483. [Google Scholar] [CrossRef]
  15. Anderson, M.H.; Lihachev, G.; Weng, W.; Liu, J.; Kippenberg, T.J. Zero-dispersion Kerr solitons in optical microresonators. arXiv 2017, arXiv:2007.14507v2. [Google Scholar]
  16. Dianov, E.M.; Mashinsky, V.M. Germania-based core optical fibers. J. Light. Technol. 2005, 23, 3500–3508. [Google Scholar] [CrossRef]
  17. Fujimaki, M.; Shimoto, S.; Miyazaki, N.; Ohki, Y.; Seol, K.S.; Imamura, K. Effect of annealing on Ge-doped SiO2 thin films. J. Appl. Phys. 1999, 86, 5270. [Google Scholar] [CrossRef]
  18. Quartarone, E.; Mustarelli, P.; Marabelli, F.; Battagliarin, M.; Turato, S. GeO2-doped SiO2 sputtered thin films: Microstructure, stoichiometry, and optical properties. J. Vac. Sci. Technol. 2004, 22, 2234. [Google Scholar] [CrossRef]
  19. Miller, J.W.; Chesaux, M.; Deligiannis, D.; Mascher, P.; Bradley, J.D.B. Low-loss GeO2 thin films deposited by ion-assisted alternating current reactive sputtering for waveguide applications. Thin Solid Films. 2020, 709, 138165. [Google Scholar] [CrossRef]
  20. Khaled, J.; Fujiwara, T.; Ohama, M.; Ikushima, A.J. Generation of second harmonics in Ge-doped SiO2 thin films by ultraviolet irradiation under poling electric field. J. Appl. Phys. 2000, 87, 2137–2141. [Google Scholar] [CrossRef]
  21. Ho, C.K.F.; Pita, K.; Ngo, N.Q.; Kam, C.H. Optical functions of (x)GeO2:(1 − x)SiO2 films determined by multi-sample and multi-angle spectroscopic ellipsometry. Opt. Express 2005, 13, 1049–1054. [Google Scholar] [CrossRef]
  22. Chen, D.-G.; Potter, B.G.; Simmons, J.H. GeO2-SiO2 thin films for planar waveguide applications. J. Non-Cryst. Sol. 1994, 178, 135–147. [Google Scholar] [CrossRef]
  23. Simmons, K.D.; Stegeman, G.I.; Potter, B.G., Jr.; Simmons, J.H. Photosensitivity in germano-silicate sol-gel thin films. J. Non-Cryst. Sol. 1994, 179, 254–259. [Google Scholar] [CrossRef]
  24. Potter, B.G., Jr.; Ochoa, R.; Chen, D.G.; Simmons, J.H. Raman scattering investigation of xGeO2-(1 − x)SiO2 planar waveguides. Opt. Lett. 1992, 17, 1349–1351. [Google Scholar] [CrossRef]
  25. Savchenkov, A.A.; Ilchenko, V.S.; Handley, T.; Maleki, L. Ultraviolet-assisted frequency trimming of optical microsphere resonators. Opt. Lett. 2003, 28, 649–650. [Google Scholar] [CrossRef]
  26. Inga, M.; Fujii, L.; Filho, J.M.C.S.; Palhares, J.H.Q.; Ferlauto, A.S.; Marques, F.C.; Alegre, T.P.M.; Wiederhecker, G. Alumina coating for dispersion management in ultra-high Q microresonators. APL Photonics 2020, 5, 116107. [Google Scholar] [CrossRef]
  27. Li, B.B.; Wang, Q.Y.; Xiao, Y.F.; Jiang, X.F.; Li, Y.; Xiao, L.; Gong, Q. On chip, high-sensitivity thermal sensor based on high-Q polydimethylsiloxane-coated microresonator. Appl. Phys. Lett. 2010, 96, 251109. [Google Scholar] [CrossRef]
  28. Han, M.; Wang, A. Temperature compensation of optical microresonators using a surface layer with negative thermo-optic coefficient. Opt. Lett. 2007, 32, 1800–1802. [Google Scholar] [CrossRef]
  29. Eroglu, D.; Kulah, H. Quality Factor Enhancement of Lateral Microresonators in Liquid Media by Hydrophobic Coating. J. Microelectromech. Syst. 2011, 20, 1068–1070. [Google Scholar] [CrossRef]
  30. Anashkina, E.A.; Sorokin, A.A.; Marisova, M.P.; Andrianov, A.V. Development and numerical simulation of spherical microresonators based on SiO2-GeO2 germanosilicate glasses for generation of optical frequency combs. Quantum Electron. 2019, 49, 371–376. [Google Scholar] [CrossRef]
  31. Riesen, N.; Zhang, W.Q.; Monro, T.M. Dispersion in silica microbubble resonators. Opt. Lett. 2016, 41, 1257–1260. [Google Scholar] [CrossRef] [PubMed]
  32. Anashkina, E.A.; Marisova, M.P.; Sorokin, A.A.; Andrianov, A.V. Numerical Simulation of Mid-Infrared Optical Frequency Comb Generation in Chalcogenide As2S3 Microbubble Resonators. Photonics 2019, 6, 55. [Google Scholar] [CrossRef] [Green Version]
  33. Agha, I.H.; Okawachi, Y.; Gaeta, A.L. Theoretical and experimental investigation of broadband cascaded four-wave mixing in high-Q microspheres. Opt. Express 2009, 17, 16209–16215. [Google Scholar] [CrossRef] [PubMed]
  34. Fleming, J.W. Dispersion in GeO2-SiO2 glasses. Appl. Opt. 1984, 23, 4486. [Google Scholar] [CrossRef] [PubMed]
  35. Teraoka, I.; Arnold, S. Whispering-gallery modes in a misrosphere coated with a high-refractive index layer: Polarization-dependent sensitivity enhancement of the resonance-shift sensor and TE–TM resonance matching. J. Opt. Soc. Am. B 2007, 24, 653–659. [Google Scholar] [CrossRef] [Green Version]
  36. Sayson, N.L.B.; Webb, K.E.; Coen, S.; Erkintalo, M.; Murdoch, S.G. Widely tunable optic parametric oscillation in a Kerr microresonator. Opt. Lett. 2017, 42, 5190–5193. [Google Scholar] [CrossRef] [Green Version]
  37. Anashkina, E.A.; Marisova, M.P.; Salgals, T.; Alnis, J.; Lyashuk, I.; Leuchs, G.; Spolitis, S.; Bobrovs, V.; Andrianov, A.V. Optical frequency combs generated in silica microspheres in the telecommunication C-, U-, and E-bands. Photonics 2021, 8, 345. [Google Scholar] [CrossRef]
  38. Hansson, T.; Wabnitz, S. Dynamics of microresonator frequency comb generation: Models and stability. Nanophotonics 2016, 5, 231–243. [Google Scholar] [CrossRef] [Green Version]
  39. Mägi, E.C.; Fu, L.B.; Nguyen, H.C.; Lamont, M.R.E.; Yeom, D.I.; Eggleton, B.J. Enhanced Kerr nonlinearity in sub-wavelength diameter As2Se3 chalcogenide fiber tapers. Opt. Express 2007, 15, 10324–10329. [Google Scholar] [CrossRef]
  40. Yatsenko, Y.; Mavritsky, A. D-scan measurement of nonlinear refractive index in fibers heavily doped with GeO2. Opt. Lett. 2007, 32, 3257–3259. [Google Scholar] [CrossRef] [Green Version]
  41. ITU-T Recommendation G.694.1, Spectral Grids for WDM Applications: DWDM Frequency Grid, International Telecommunication Union, Telecommunication Standardization Sector of ITU. 2012, pp. 1–7. Available online: https://www.itu.int/itu-t/recommendations/rec.aspx?rec=11482&lang=en (accessed on 23 October 2021).
Figure 1. (a) Schematic of the proposed microresonator near the power coupling fiber taper; (b,c) Spatial distribution of the absolute value of electric field in the fundamental TE mode in the (x,y) and (y,z) planes, respectively; (b,c) share the same colormap.
Photonics 08 00473 g001
Figure 2. (ac) Calculated values of the GVD deviation function J(b,R) for different GeO2 content in the layer: (a) X = 1.0, (b) X = 0.5, (c) X = 0.2; figures (ac) share the same colormap. (d,e) Calculated dispersion curves for different microresonator parameters: X = 1.0, R = 60 μm (solid lines); X = 0.5, R = 60 μm (dashed lines); X = 1.0, R = 160 μm (dotted lines), color legend is shown separately for (d,e).
Photonics 08 00473 g002
Figure 3. Calculated values of the GVD deviation function J in region I. Figures in the same row share the same colormap.
Photonics 08 00473 g003
Figure 4. (a) Several optimized dispersion curves yielding J < 2 ps2/km in comparison with bulk silica glass (solid black), bulk germanate glass (gray), and regular germanosilicate microsphere with X = 0.1, R = 130 μm (dotted black); (b) GVD curves for parameter perturbations providing J < 3 ps2/km on the example of a microresonator with X = 0.8, R = 180 μm, and b = 1.6 μm (black curve). Microresonator parameters are shown as follows: {X; R in μm; b in μm}.
Photonics 08 00473 g004
Figure 5. (a) Calculated FSR as a function of b and R for X = 0.5; (b) Calculated FSR as a function of X and R; (c) Calculated FSR as a function of R−1 for different X; (df) Electric field absolute value distribution for microresonators with X = 1.0, R = 100 μm, and b = 1.3 μm (d), b = 1.9 μm (e), and regular GeO2 microsphere of R = 100 μm (f).
Photonics 08 00473 g005
Figure 6. Calculated nonlinear coefficient γ in the parameter range that provides near-optimal GVD curves. All figures share the same colormap.
Photonics 08 00473 g006
Figure 7. Possible configurations of the phase-matching curves (blue) and schematic plots of β2 (red), β4 (green), and β6 (black) as functions of λ. Microresonator parameters: (a) X = 0.8, R = 70 μm, b = 2.7 μm; (b) X = 0.8, R = 200 μm, b = 1.6 μm; (c) X = 0.5, R = 140 μm, b = 1.7 μm.
Photonics 08 00473 g007
Figure 8. Calculated values of the FWM satellites’ tunability span Δf (in THz) for pump wavelengths in the SCL-band. Data are shown for several X that provide wide parameter ranges where near-maximum Δf is achieved. All figures share the same colormap.
Photonics 08 00473 g008
Figure 9. A few phase-matching curves optimized for FWM generation in different pump wavelength ranges: SCL-band (orange curve), S-band (green curves), CL-band (magenta curve), C-band (red curves), and L-band (blue curves). The upper branches correspond to λ. Microresonator parameters are shown as {X; R in μm; b in μm}.
Photonics 08 00473 g009
Table 1. Parameters and characteristics of the optimal microresonators for achieving flat, near-zero GVD curves in SCL-band and FSR = 200 GHz or FSR = 300 GHz for λp ≈ 1.55 μm.
XR, μmb, μmFSR, GHzJ, ps2/kmγ, W−1km−1
0.71501.6200.92.88.7
0.81501.6199.01.79.5
0.71001.6300.42.210.7
0.81001.6297.62.011.7
Publisher’s Note: MDPI stays neutral with regard to jurisdictional claims in published maps and institutional affiliations.

