Broadband Terahertz Spectroscopy of Phonon-Polariton Dispersion in Ferroelectrics


Division of Materials Science, University of Tsukuba, Tsukuba, Ibaraki 305-8573, Japan
Photonics 2018, 5(4), 55; https://doi.org/10.3390/photonics5040055
Submission received: 7 November 2018
/
Revised: 28 November 2018
/
Accepted: 28 November 2018
/
Published: 3 December 2018
(This article belongs to the Special Issue Terahertz Photonics)
Abstract
:Electromagnetic waves at frequencies below the X-ray region strongly couple to the optical vibrational modes in a solid. These coupled excitations have been called phonon polaritons. The relationship of the polariton frequency versus the polariton wavevector shows a remarkable dispersion, especially in the vicinity of the transverse and longitudinal optical mode frequencies. The significant frequency dependence enables valuable applications such as a tunable terahertz radiation source. The polariton dispersion relations of technologically important dielectric and ferroelectric crystals were reviewed in the broad terahertz range using terahertz time-domain spectroscopy, far-infrared spectroscopy, and Raman scattering spectroscopy.
1. Introduction
A polariton is defined as the strong coupling between a photon and other quasiparticles [1,2]. The mixed elementary excitations between photons and excitons were studied by Hopfield [2]. Optical vibrational modes also strongly couple to light waves at frequencies below the X-ray region, and the mixed excitation is called a phonon polariton [3,4]. Phonon polaritons are technologically important for applications such as a tunable Raman laser, a tunable terahertz (THz) radiation source [5,6]. The significant frequency versus wavevector dispersion relationship of phonon polaritons contributes to basic materials science to clarify the vibrational and relaxational dynamics of condensed matters in a broadband terahertz range, such as soft optic modes, critical slowing down of the lattice instability of crystalline materials, and boson peaks related to the medium range order of vitreous materials.
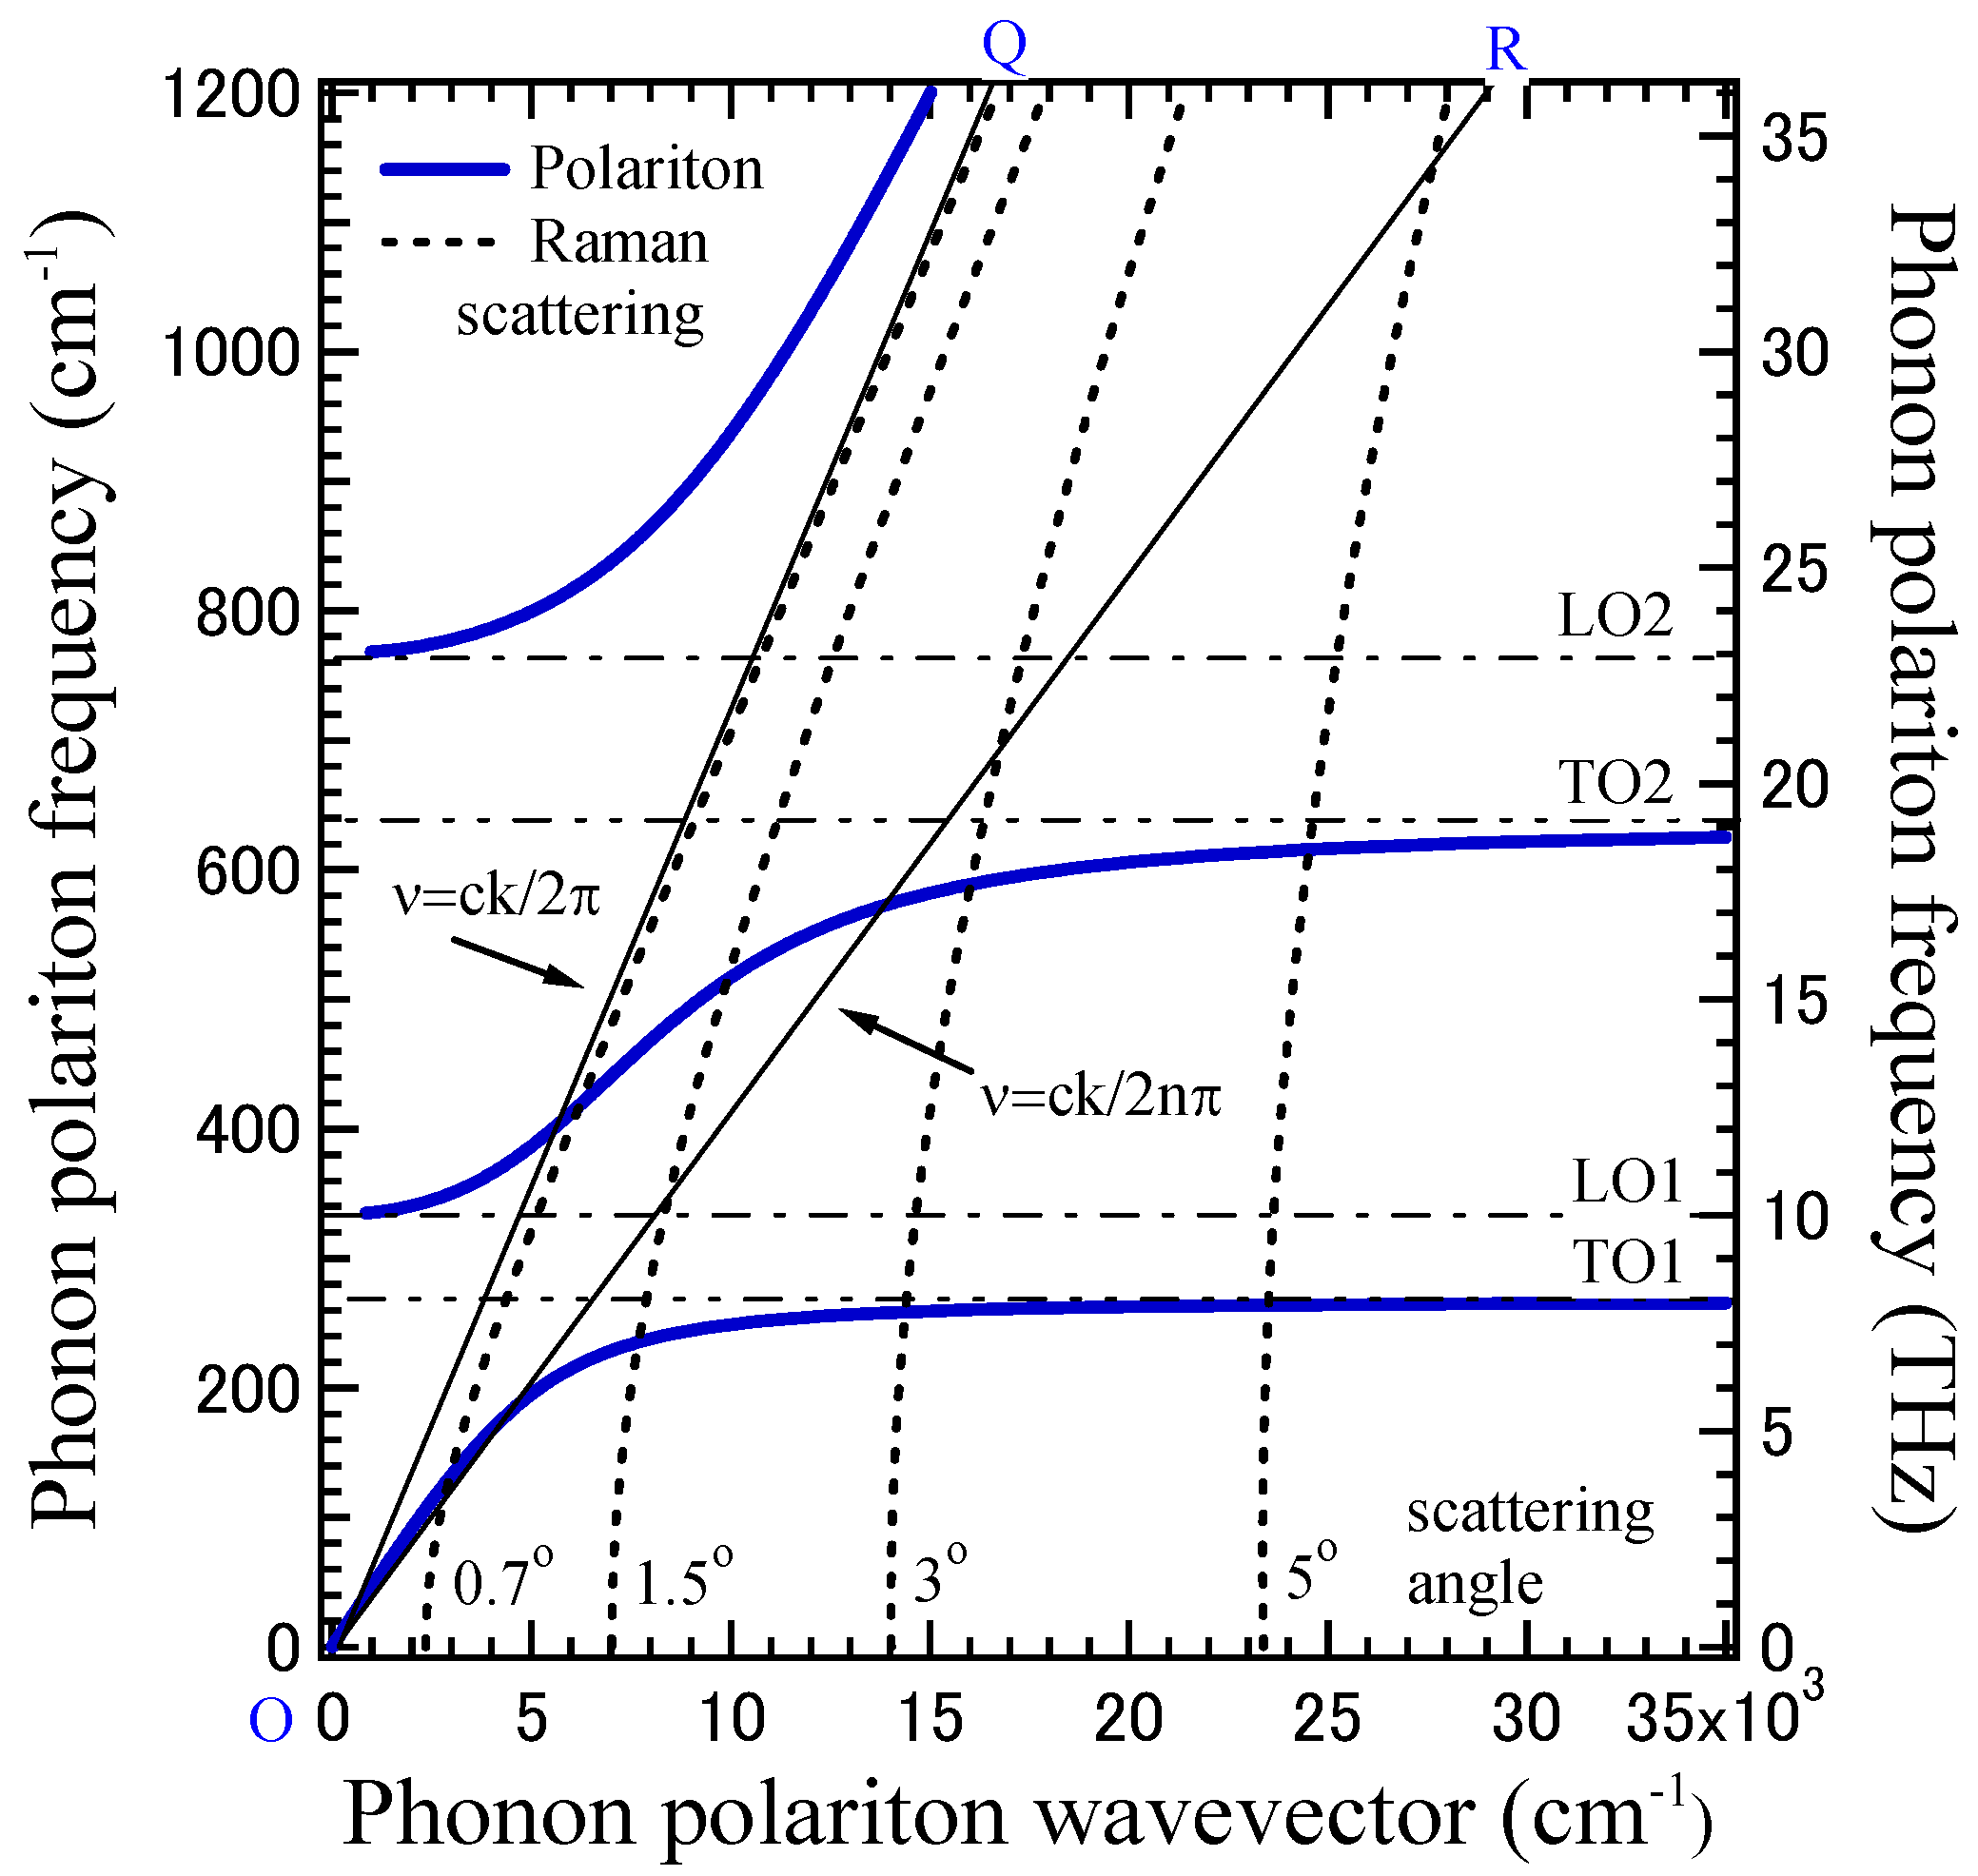
According to Huang’s analysis [3], the dispersion relation of the polariton is given by the equation, ε(k,ν) = c2k2/(2πν)2, where ν, k, c, and ε(k,ν) are the frequency, wavevector, light velocity, and dielectric constant, respectively. Figure 1 shows the polariton dispersion relation when two infrared active optical modes exist, where νTO1 = 200 cm−1, νLO1 = 230 cm−1, νTO2 = 660 cm−1, and νLO2 = 830 cm−1. (TO and LO denote transverse optic and longitudinal optic, respectively.) When the polariton wavevector k goes to zero, the lower branch tends to ν = ck/2π (OR in Figure 1), where ε(0) is the dielectric constant at the lowest frequency limit, and the middle and upper branches tend to ν = νLO1 and ν = νLO2, respectively. When the polariton wavevector k goes to infinity, the lower and middle branches tend to ν = νTO1 and ν = νTO2, respectively, whereas the upper branch tends to ν = ck/2π (OQ in Figure 1), where ε(∞) is the dielectric constant at the highest frequency limit.
Up to the present, many observations of phonon polaritons have mainly been reported by forward Raman scattering experiments [4,5,7]. In Raman scattering, as the conservation law of wavevectors holds,
where k, ki, and ks are the wavevectors of the polariton, incident light, and scattered light, respectively, and ν, νi, and νs are the frequencies of the polariton, incident light, and scattered light, respectively. The magnitude of the polariton wavevector k is given by the magnitude of the wavevectors of the incident light ki, scattered light ks, and the scattering angle θ between them:
k2 = ki2+ks2 − 2kikscosθ.
The polariton dispersion relationship has been studied through measurement of the Raman scattering spectra as a function of the scattering angle θ [5,7]. For an observation of the polariton related to a diagonal Raman tensor component, the polarization planes of the incident and scattered light are parallel, and the observation of small polariton wavevectors is possible. For example, the A1(z) symmetry phonon polariton is observed through the diagonal Raman tensor component Rcc for the point group C3v. The Raman scattering spectra of the A1(z) symmetry phonon polariton can be measured at the forward scattering geometry, a(cc)a + ∆b, where ∆b means the small deviation of the direction from the a axis to the b axis. The magnitude of the polariton wavevector k with A1(z) symmetry is given by
where λi and λs are the wavelengths of the incident and scattered light, respectively, and ne is the refractive index of the extraordinary ray. According to Equation (2), observation of the polariton down to k = 0 is possible if the intense elastic scattering is well removed during the measurement. In Figure 1, the dotted lines show the observable region of the polaritons of a diagonal Raman tensor component by forward Raman scattering experiments, and it is impossible to observe the upper and lower k regions of the middle branches. Only infrared spectroscopy can cover all the regions of the polariton dispersion curves.
k2 = (2πne/λi)2 + (2πne/λs)2 − 2(2πne)2/λiλs cosθ ≈ 8π2ne2(1 – cosθ)/λi2 ≈ 4π2ne2θ2/λi2, for k <<1,
However, for observation of the polariton related to an off-diagonal Raman tensor component, the polarization planes of the incident and scattered light are orthogonal, and the observation of small polariton wavevectors is impossible [8]. For example, the E(x,y) symmetry polariton was observed through the off-diagonal Raman tensor component Rcb. The Raman scattering spectra were measured at the forward scattering geometry, a(cb)a + ∆b. The magnitude of the polariton wavevector with E(x,y) symmetry is given by
where no and ne are the refractive indices of the ordinary and extraordinary rays, respectively, and λi and λs are the wavelengths of the incident and scattered light, respectively. Generally, no ≠ ne, and this birefringence, ∆n = no − ne, causes the lowest limit of the observable k. Actually, when the scattering angle = 0, then the lowest value of kmin is given by
k2 = (2πne/λi)2 + (2πno/λs)2 − 2(2πne/λi)(2πno/λs)cosθ,
kmin2 = {2πne/λi − 2πno/λs}2 ≈ 4π2(∆n)2λi2 ≠ 0.
Therefore, it is impossible to observe the dispersion of the polariton branch of the lowest-frequency mode down to k = 0 by Raman scattering. In the case of a polariton study of the B1(x) symmetry of a ferroelectric KNbO3 crystal related to an off-center Raman tensor component at the forward scattering geometry b(ca)b + ∆c, the lowest-frequency limit was about 190 cm−1 for the lowest scattering angle of 0.6°, where a, b, and c are the orthorhombic coordinates [9]. According to such a condition, Raman scattering and impulsive stimulated Raman scattering have limitations in the region of polariton dispersions [10,11,12].
In contrast, far-infrared and infrared (IR) spectroscopies can cover all the regions of the polariton dispersion. These spectroscopies are convenient tools in investigating vibrational properties such as lattice modes, impurity modes, and low-energy excitations such as soft modes, boson peaks, polaritons, and excitons in various crystalline and glassy materials. Coherent terahertz generation using a femtosecond pulse laser is a new technique in enabling the unique determination of a complex dielectric constant without using the Kramers–Kronig transformation or multimode fitting. Therefore, terahertz time domain spectroscopy (THz-TDS) has become a powerful tool for vibrational and dynamical properties in the THz region [13]. The maximum observable frequency of THz-TDS is a few THz, and it is difficult to observe all TO modes. Another new technique for a broadband THz study is far-infrared spectroscopic ellipsometry, where the maximum frequency is about 20 THz [14].
2. THz Dynamics of Ferroelectrics Studied by THz-TDS
2.1. THz-TDS
Far-infrared spectra give valuable information for the lattice vibrations of crystalline materials and the localized vibrations of a medium range order in noncrystalline materials. However, traditional far-infrared spectroscopy using FTIR spectroscopy with incoherent light sources has two disadvantages. One is the very weak intensity of the light sources, and the signal-to-noise ratio of the transmission and reflection spectrum at frequencies below 100 cm−1 is poor. Another disadvantage is that it measures only a reflectance or transmittance spectrum by the lack of coherence of light sources. Therefore, the determination of the real and imaginary parts of a dielectric constant has the uncertainty caused by a Kramers–Kronig transformation. Actually, the discrepancy of the mode frequency of a ferroelectric soft mode has been reported in BaTiO3 between far-IR and hyper-Raman scattering. In contrast, recently the generation of a coherent terahertz wave radiation has become possible by recent progress in a femtosecond pulse laser. The combination of the compact photoconductive antennas driven by femtosecond laser pulses enables terahertz time-domain spectroscopy [15]. By the measurement of both the amplitude and phase of the transmitted terahertz waves of the time-gated coherent nature, the accurate determination of both the real and imaginary parts of a dielectric constant in a terahertz range is possible. THz-TDS enables the studies of various kinds of dispersion relations of elementary excitations in condensed matter. For example, the dispersion curves of the electromagnetic waves related to photonic band structure have been determined by the measurement of the phase delay as a function of the incident frequency [16]. As for the dispersion relation of phonon polaritons, it is also possible to measure the phase delay by the polaritons [17].
2.2. Bismuth Titanate
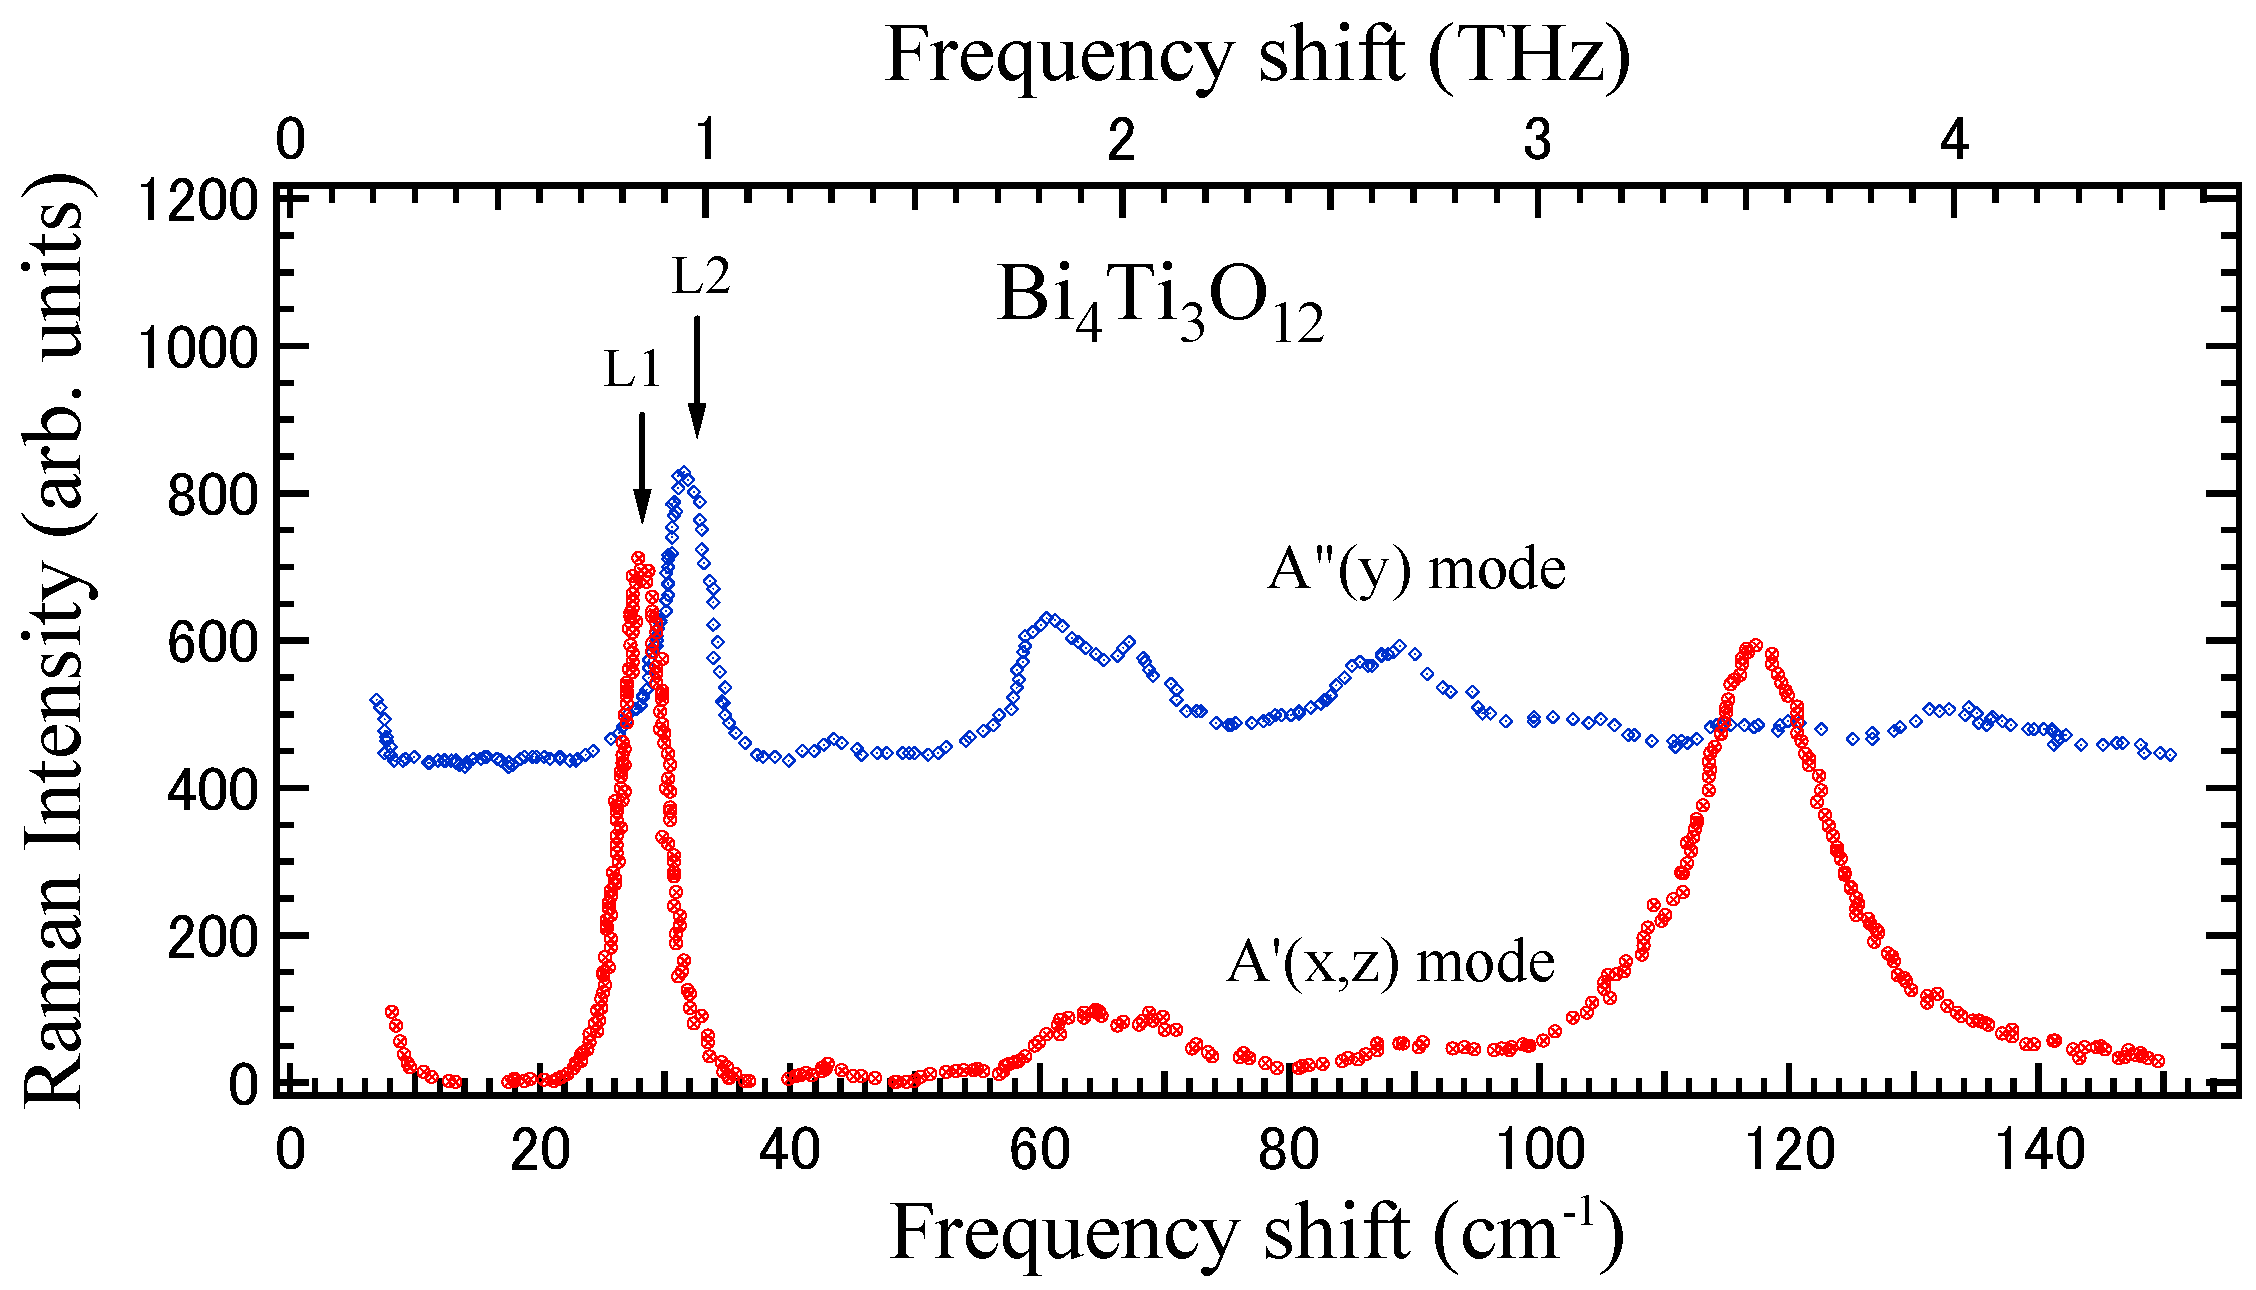
Ferroelectric random access memory (FeRAM) has attracted much attention. Bi4Ti3O12 (BIT) with a bismuth layered structure is one of the most important key materials for FeRAM due to its low fatigue for polarization switching. The crystal system of BIT is monoclinic with the point group m at room temperature. It undergoes a ferroelectric phase transition at the Curie temperature TC = 948 K, and a high-temperature paraelectric phase is tetragonal with the point group 4/mmm. In a ferroelectric phase, the clear evidence of a displacive nature has been reported [18]. The underdamped soft optic mode has been observed by Raman scattering at 28 cm−1 and at room temperature. This soft mode showed remarkable softening toward the TC upon heating from room temperature, and its damping factor significantly increased toward the TC. In the polar monoclinic phase, the optical phonon modes (the A’(x,z) and A”(y) modes) were both infrared and Raman-active, where a mirror plane was perpendicular to the crystallographic y axis. The soft optic mode had the A’(x,z) symmetry in which the coordinate z was parallel to the c axis. The Raman scattering spectra of the optical modes with A’(x,z) and A”(y) symmetries are shown in Figure 2. The intense peak at 28 cm−1 observed in the A’(x,z) spectrum (L1 in Figure 2) was a ferroelectric soft mode. In the A”(y) spectrum, the lowest-frequency TO mode was observed at 32 cm−1 (L2 in Figure 2). These lowest TO modes, denoted by L1 and L2, were strongly coupled to a photon, as shown in Figure 3.
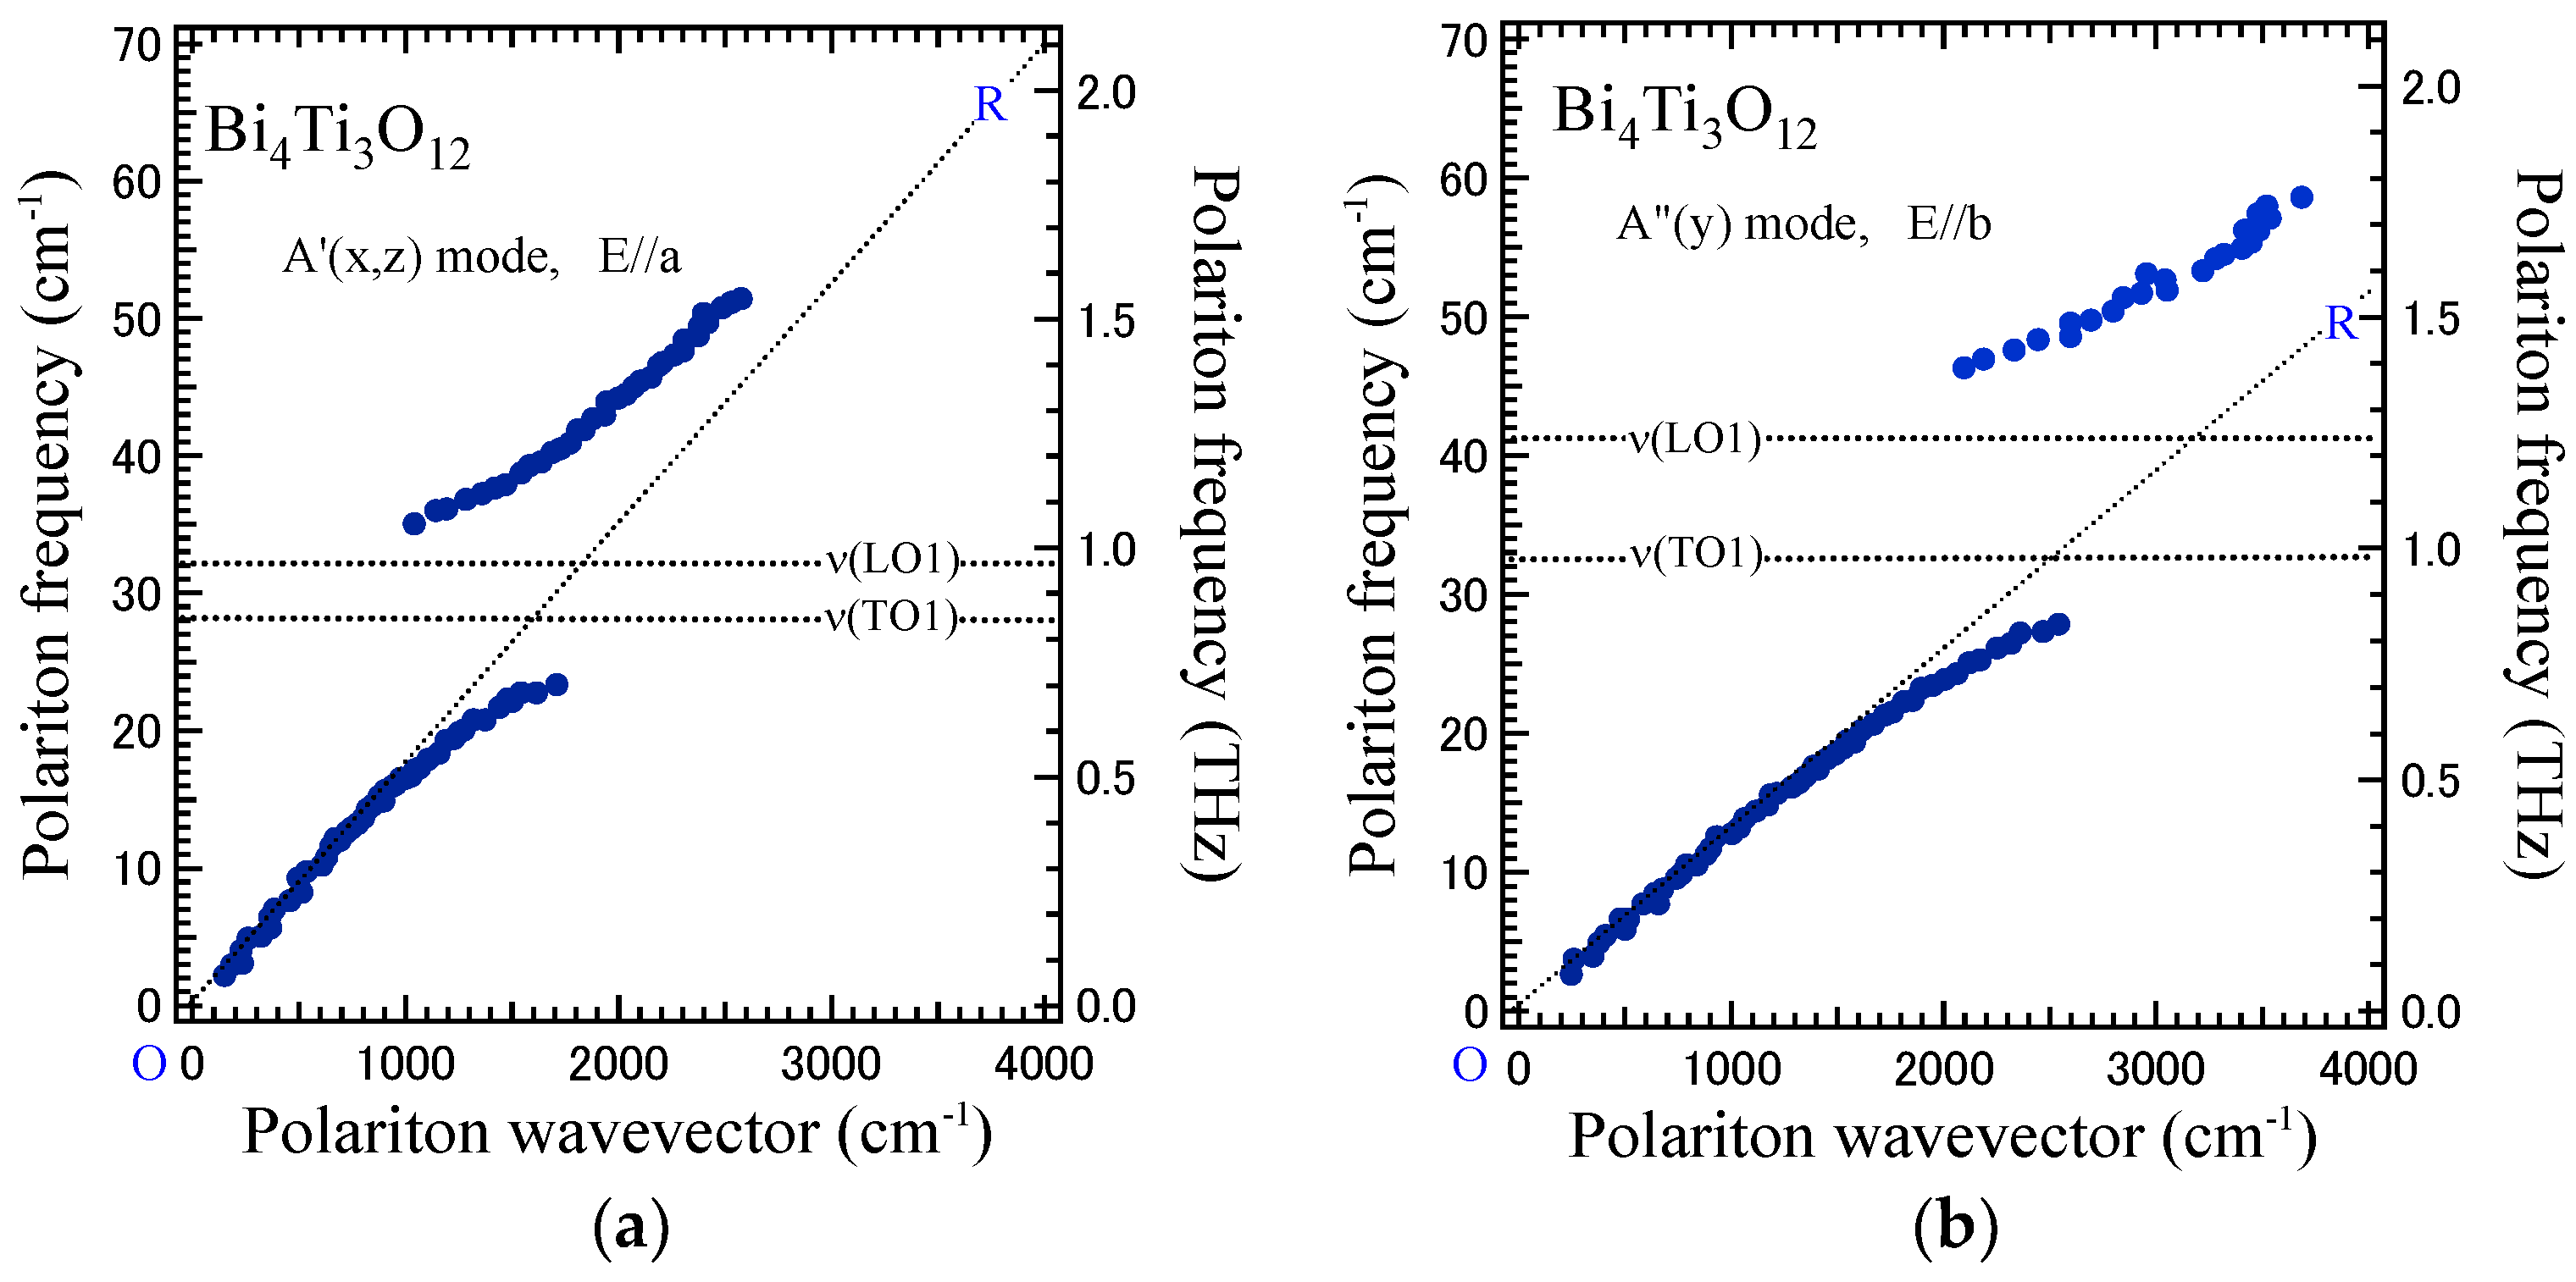
For a discussion on the lattice instability of ferroelectric materials, the study of the lowest-frequency infrared active modes is very important. Since the Curie temperature of BIT is much higher than room temperature, the dielectric constant is relatively small at room temperature. We observed the transmission spectra of the c-plate of a BIT crystal by using THz-TDS. The A’(x,z) and A”(y) modes were infrared active in the ferroelectric phase and could be observed for the light polarization parallel to the a axis (E//a) and b axis (E//b). Anti-crossing curves were observed near the longitudinal optic (LO)-TO gap in the relation between the phase delay and the frequency. Such an anti-crossing behavior indicated the dispersion relation of the phonon polariton. For the determination of the dispersion relation of phonon polaritons, the wavevector k(ν) of a phonon polariton using a phase delay was calculated as a function of the polariton frequency ν using the following equation,
where c, d, and n(ν) are the light velocity, the thickness of a sample, and the real part of a refractive index of a sample, respectively. Figure 3a,b shows the dispersion relations of phonon polaritons with the A’(x,z) and A”(y) modes. These polariton dispersions have been discussed using a factorized dielectric constant derived by Kurosawa [19].
φ = {k(ν) − 2πν/c}d, k(ν) = 2πνn(ν)/c,
The crystal structure of BIT is a monoclinic system at room temperature. Therefore, ε(ν) is anisotropic, and we studied εa(ν) and εb(ν) using the light polarization parallel to the a axis (E//a) and b axis (E//b), respectively. From the measurements of two polarization directions, two different low-frequency polariton branches with A’(x,z) and A”(y) symmetries were clearly observed down to 3 cm−1, as shown in Figure 3a,b. This is the first observation of the dispersion relation of phonon polaritons by the use of THz-TDS.
2.3. Barium Zirconate
When the tolerance factor of oxide crystals with a perovskite structure is more than 1.0, spontaneous polarization generally appears, and in most cases ferroelectricity is observed. However, when the tolerance factor is close to 1.0, quantum paraelectricity is observed. Barium zirconate (BaZrO3 (BZO)) with a perovskite structure is such a quantum paraelectric crystal. It has many technologically important properties such as a high lattice constant, a high melting point, a low thermal expansion coefficient, low dielectric loss, and low thermal conductivity. Therefore, BZO is a technologically important material for many kinds of applications. However, the structural instability and symmetry lowering of cubic BZO are still unknown, and many theoretical and experimental studies have been recently reported [20]. Different from most perovskite oxide ferroelectrics, BZO does not undergo any structural phase transition at ambient pressure, and thus its cubic symmetry is believed to be invariant down to 2 K [21]. Upon cooling from high temperatures, its dielectric constant gradually increases, while it does not diverge down to 0 K. The reciprocal dielectric constant goes to zero toward a negative temperature. Therefore, BZO belongs to incipient ferroelectrics, and all the optic modes are Raman-inactive.
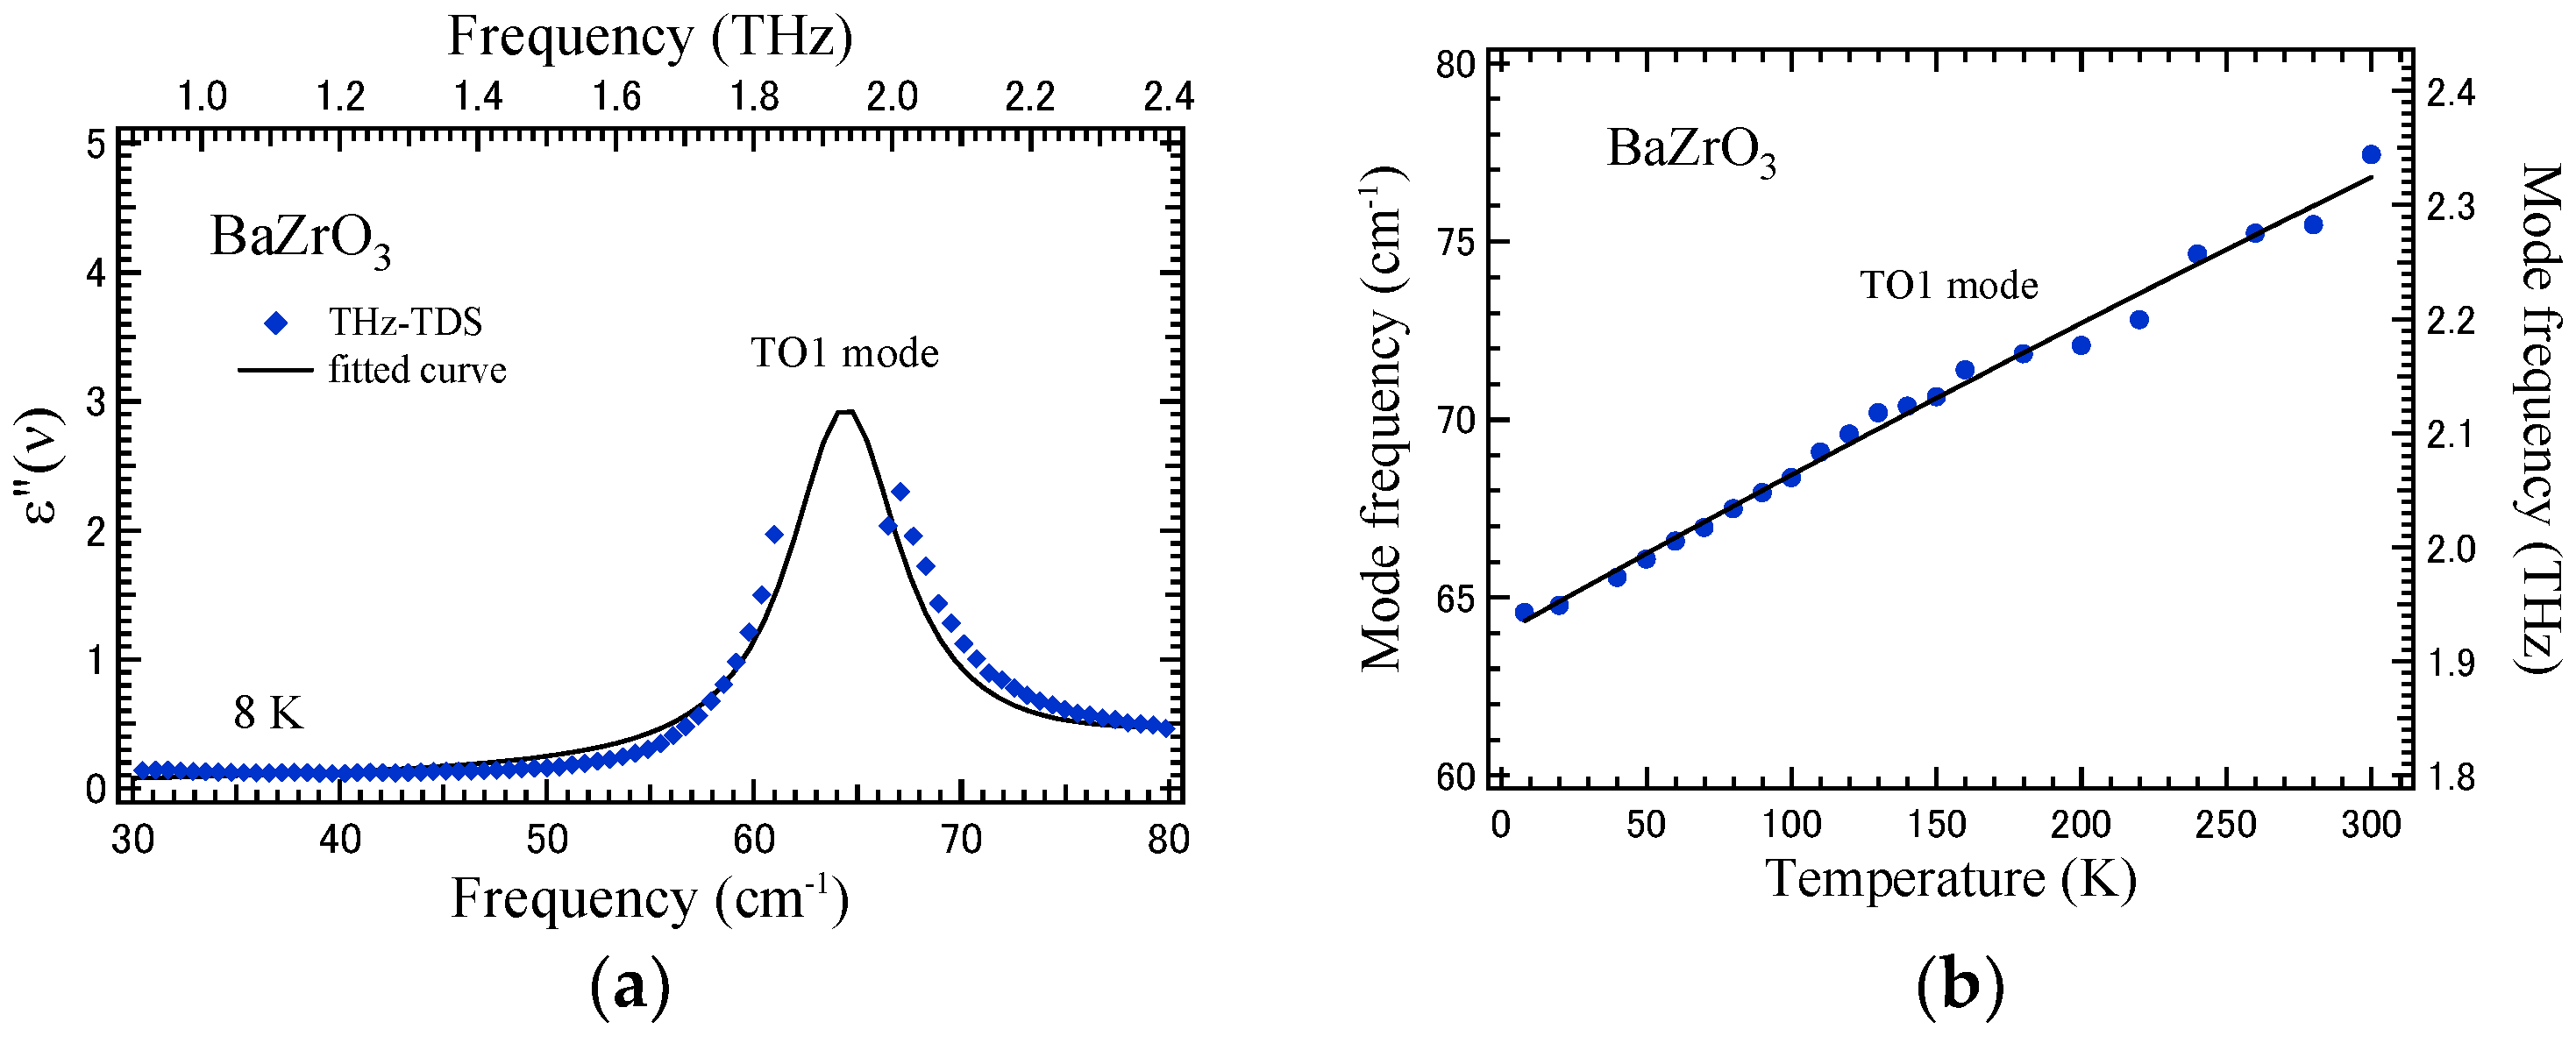
In this THz-TDS study, the real and imaginary parts of a dielectric constant were determined for a BZO single crystal at 8 K, and the imaginary part is shown in Figure 4a [22,23]. The dielectric constant was fitted by two damped harmonic oscillators to determine the mode frequency, dielectric strength, and the damping constant of two TO modes. The lowest-frequency TO1 mode was clearly observed at about 65 cm−1. The phonon frequency of the second-lowest-frequency TO2 mode was determined to be 125 cm−1, which was in agreement with the results of recent reflectivity measurements [24] and first-principles calculations [25]. The loss function Im(1/ε) was also calculated to determine the longitudinal optic mode frequency from the observed dielectric constant. The noticeable LO-TO splitting was not observed near 65 cm−1, whereas the LO2 mode appeared at around 222 cm−1. The remarkable softening of the TO1 mode frequency was found upon cooling, as shown in Figure 4b. Since the soft optic mode in a paraelectric phase is always Raman-inactive by the existence of a center of symmetry, far-IR studies are very important for observing a ferroelectric soft mode.
The polariton dispersion relation of the lowest-frequency soft optic TO1 mode of BaZrO3 was determined at 8 K [23]. The remarkable resonance of polariton dispersion near the TO1 and LO1 mode frequencies was not observed, whereas the linear relation between the polariton wavevector and the polariton frequency nearly held below the TO1 mode frequency. In a theoretical study of ferroelectrics with strong anharmonicity, the resonances of polariton dispersion occurred by the cross-anharmonic couplings between different normal-mode lattice vibrations. However, such a strong anharmonic coupling between the soft mode and other optical modes was not observed in a BaZrO3 crystal reflecting the quantum paraelectric nature.
3. Polariton Dispersion Studied by Far-IR Spectroscopy
3.1. Far-IR Spectroscopy
Ferroelectric soft modes are infrared-active in both the paraelectric and ferroelectric phases, whereas they are Raman-active only in the ferroelectric phase. Therefore, far-IR spectroscopy is the most powerful method to observe a soft mode in a paraelectric phase. Another method for observing Raman-inactive modes is hyper-Raman scattering, which is higher-order Raman scattering. Its selection rule is different from Raman scattering. However, in hyper-Raman experiments, the high-intensity exciting laser pulses frequently cause optical damage in a sample, and hyper-Raman scattering cannot be observed. Thus, only purely transparent samples were studied. The problem for far-IR spectroscopy is the analysis using the Kramers–Kronig transformation for the limited frequency range or multimode fitting. For a soft mode of BaTiO3 in a paraelectric phase, the result by far-IR spectroscopy using a conventional FTIR spectrometer reported the stop of softening of the Cochran mode at about 60 cm−1 and 100 °C above the Curie temperature, TC = 130 °C [26]. In contrast, a study using hyper-Raman scattering observed the softening of a soft mode toward TC at least down to 11 cm−1 [27]. This significant discrepancy in the results between far-IR spectroscopy and hyper-Raman scattering has been considered in the problem of the analysis of overdamped modes in FTIR measurements. The ferroelectric instability of BaTiO3 originated from not only the displacive, but also the order-disorder nature related to the eight-site model of the Ti ion at the B-site in an oxygen octahedron of the perovskite structure of which the tolerance factor is more than 1.0. The order-disorder nature caused the remarkable frequency dispersion of the dielectric constant near the low-frequency limit of the FTIR measurement. In contrast, the tolerance factor of quantum paraelectric SrTiO3 with a perovskite structure was 1.0, and it meant an ideally packed structure. Therefore, the rattling of the Ti ions at the B-site was well suppressed, and the order-disorder nature was negligible. Therefore, it is possible to determine a reliable dielectric constant by a standard FTIR measurement.
However, for ferroelectrics with an order-disorder nature or disordered structure, such as the congruent LiNbO3, the determination of a dielectric constant without using the Kramers–Kronig transformation is necessary. To determine a reliable dielectric constant, a far-infrared spectroscopic ellipsometry (FIRSP) system has been developed through the combination of a far-infrared spectrometer and ellipsometry [14]. FIRSP is a combination between a Michelson interferometer and an ellipsometer with a rotating analyzer. A far-infrared spectrum is measured by the light source of a high-pressure mercury lamp and the detector of an Si bolometer unit. The reflected light from a sample to be observed is elliptically polarized, and the p- and s-polarized lights are separately measured using a rotating wire grid analyzer. With FIRSP, the accurate determination of the real and imaginary parts of a dielectric constant without any uncertainty is possible in the frequency range from 40 to 700 cm−1. In most cases, the frequency range of most optical modes of ABO3-type oxide ferroelectrics is in this frequency range, and therefore it is certain that FIRSP is a powerful experimental method to study the broadband dispersion relation of the phonon polariton.
3.2. Strontium Titanate
Similarly to BZO, the tolerance factor of strontium titanate (SrTiO3 (STO)) with a perovskite structure is 1.0. STO is known as the typical quantum paraelectric, and ferroelectric instability is suppressed by quantum fluctuations at very low temperatures [28]. The point group symmetry is a cubic mm with the center of symmetry at room temperature. The optical vibrational modes at the Г point of the Brillouin zone are 3T1u + T2u, and all the optical modes are Raman-inactive. The T2u modes are called silent modes. Only the 3T1u modes are infrared-active and hyper-Raman-active. Therefore, the study of the 3T1u modes is possible using infrared spectroscopy, including THz-TDS and hyper-Raman scattering. The lowest-frequency T1u modes have been studied using far-IR spectroscopy [29] and THz-TDS [30,31,32].
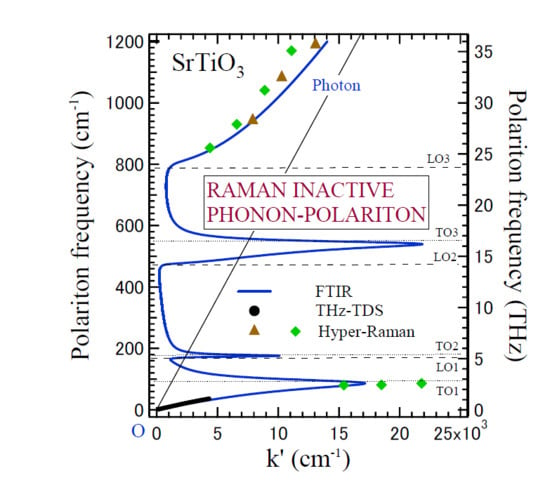
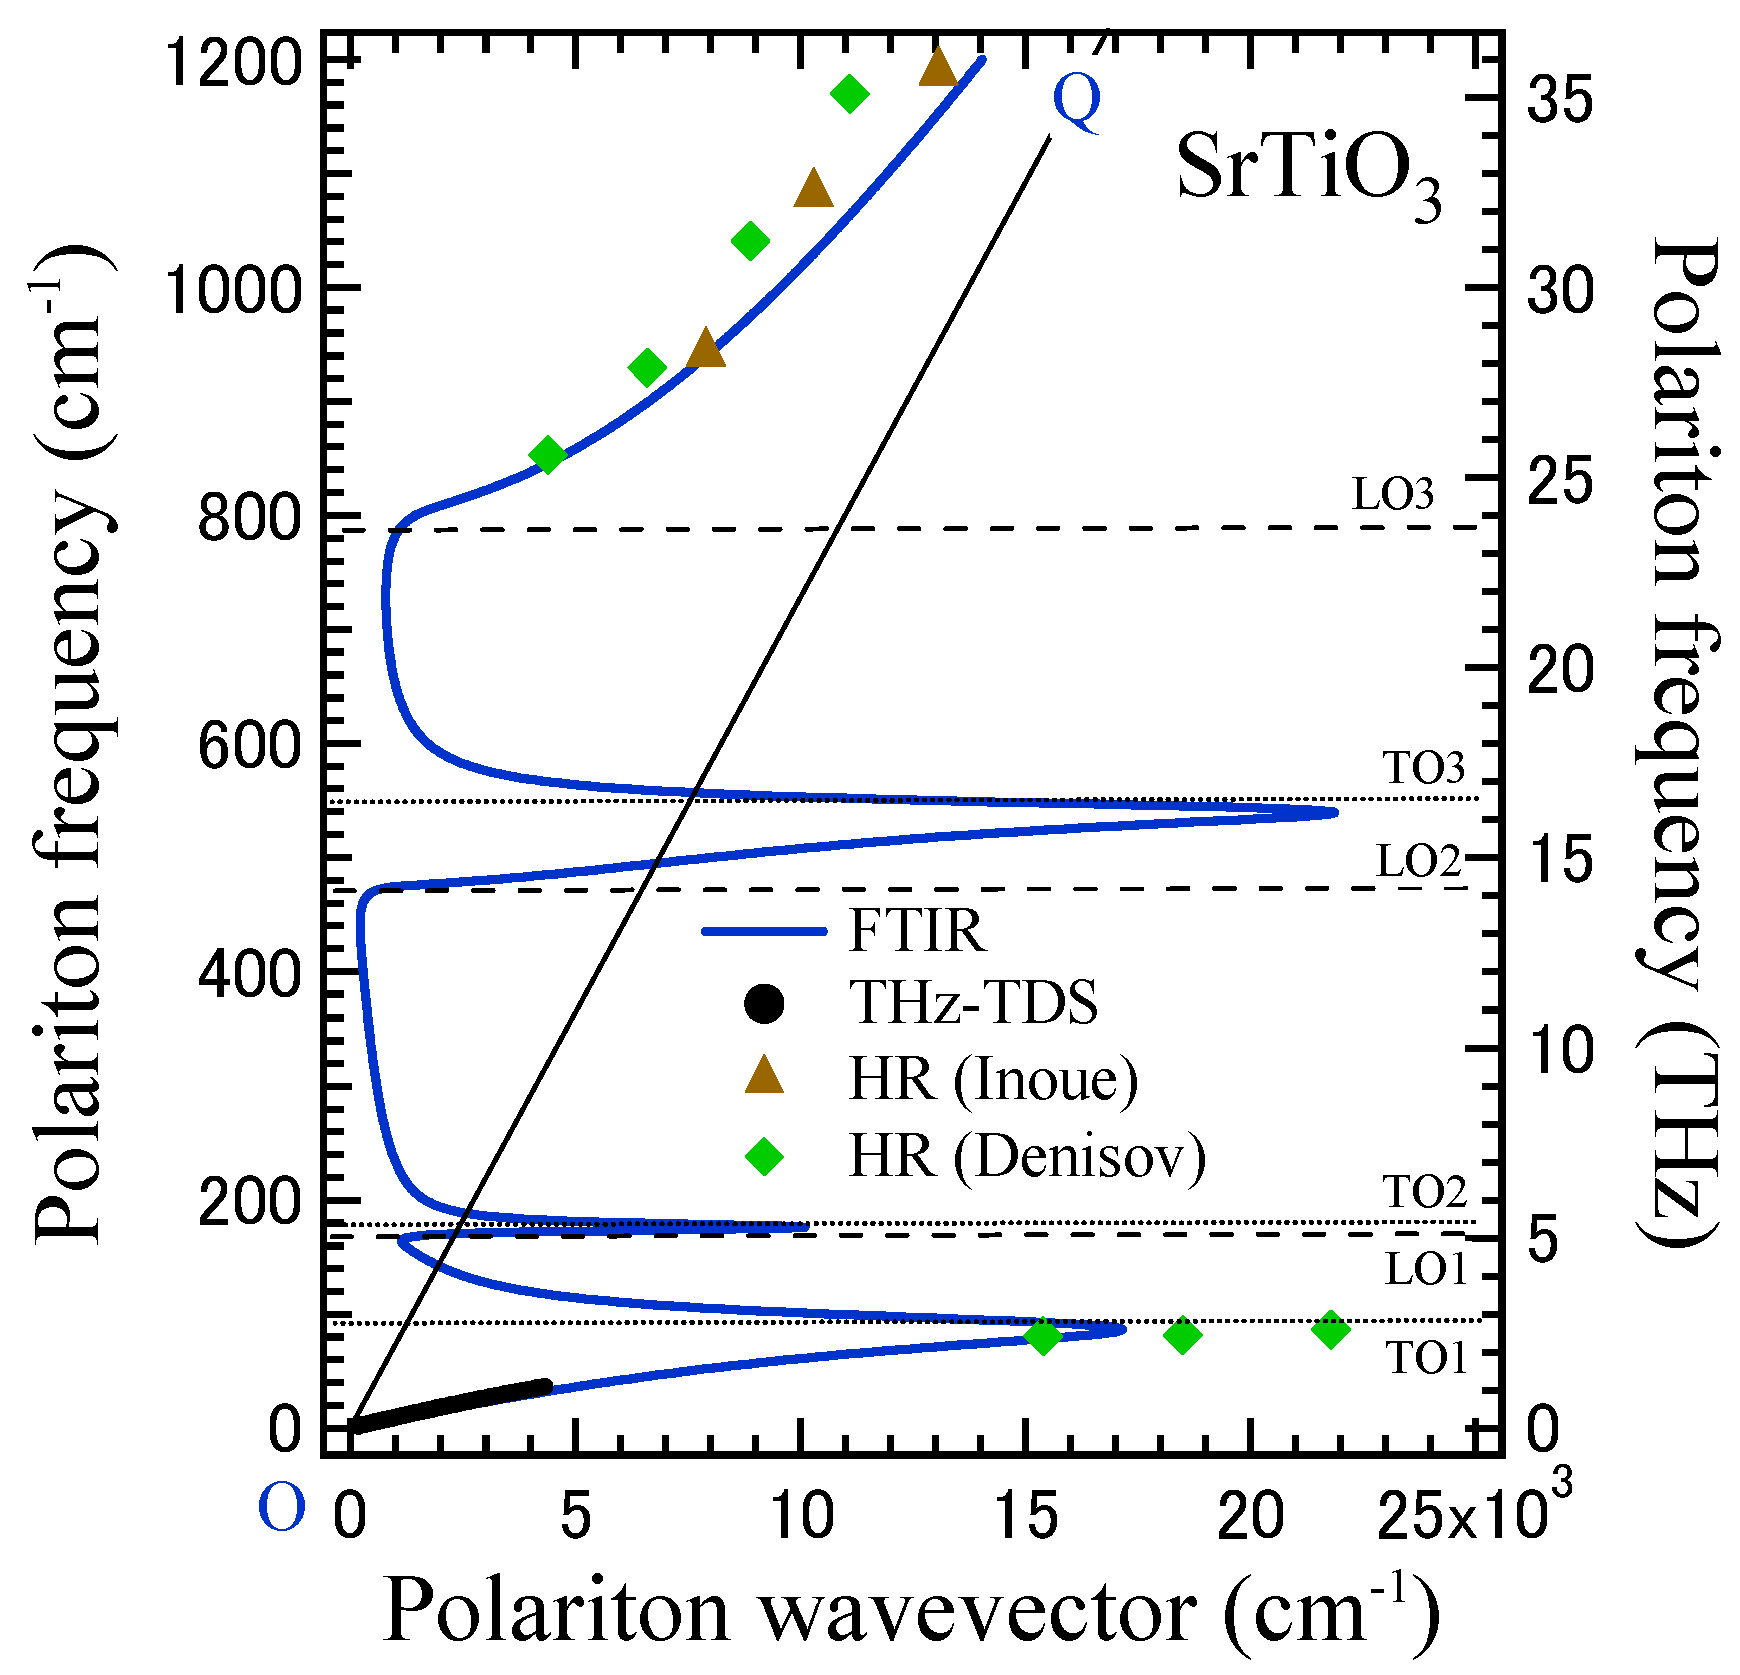
For the study of the polariton dispersion relation of the three T1u modes, the infrared reflectivity spectrum of a [001] STO plate was measured in the range from 30 to 1200 cm−1 [33]. Figure 5 shows the dispersion relation of the phonon polariton of the T1u symmetry, determined by the infrared spectrum. The anti-crossing of a dispersion curve was clearly observed near the lowest TO mode frequency, νTO1 = 87 cm−1. The dispersion relation of a phonon polariton was also investigated by hyper-Raman scattering measurements using a forward scattering geometry by Denisov et al. [34] and Inoue et al. [35]. For a comparison with the results of infrared spectroscopy, their results of hyper-Raman scattering [34,35] are also plotted in Figure 5. Inoue et al. observed only the highest-frequency polariton dispersion, higher than the highest-frequency LO mode [35]. Denisov et al. observed both the lowest-frequency dispersion curve, lower than the lowest TO mode frequency νTO1 = 87 cm−1, and the highest-frequency dispersion curve, higher than the highest LO mode frequency νLO3 = 788 cm−1 [34]. The polariton dispersion relations determined by the hyper-Raman scattering measurement in the frequency range below 87 cm−1 and above 788 cm−1 [34,35] were in agreement, within experimental uncertainty, with the results of the infrared reflection measurement [33].
For the forward scattering geometry of the hyper-Raman scattering experiment, the conservation law held among the wave vectors of an incident , scattered light , and polariton :
where νi and νs are the frequencies of the incident laser light and the scattered light from a sample to be observed, respectively. The frequencies of ν = 2νi − νs and νs are approximately equal to the double of νi. According to Equation (7), the dispersion relation was observable only in a quite limited region due to the birefringence between the refractive indices of the fundamentals of an incident light and the second harmonic wavelengths of scattered light. Observation of a low-frequency polariton with a small was especially impossible due to this birefringence, and therefore hyper-Raman scattering of phonon polaritons was not suitable to study the soft mode related to lattice instability.
3.3. Lithium Niobate
The ferroelectricity of lithium niobate (LiNbO3 (LN)) with an ilmenite structure was discovered by Matthias and Remeika in 1949 [36]. Currently, LN is the most technologically important ferroelectric crystal, with significant functional properties. In particular, its colossal piezoelectric, electro-optic, and nonlinear optical coefficients have been applied to various devices such as SAW (surface acoustic wave) filters, SHG (second harmonic generation) converters, tunable solid lasers, and THz generators [37,38]. LN undergoes a ferroelectric transition from a paraelectric phase with the space group Rc into a ferroelectric one with R3c at TC = 1483 K, which depends on the ratio between the lithium and niobium contents. A spontaneous polarization appears along the c axis [39,40].
The vibrational properties of LN have been extensively studied using IR spectroscopy, Raman scattering, and theoretical calculations in relation to lattice dynamics at room temperature and the lattice instability of a ferroelectric phase transition. In a ferroelectric phase at room temperature, the symmetry of the optical modes at the Г point of a reciprocal lattice space is given by
where the A1 and E modes correspond to Raman- and infrared-active polar phonons, whereas the A2 modes are silent modes that are Raman- and infrared-inactive.
4A1 + 9E + 5A2,
In 1966, Axe and O’Kanne measured the IR reflection spectra from 100 to 2000 cm−1 and determined the frequency of eight E and four A1 modes [41]. For example, they reported the lowest A1(TO) mode at 187 cm−1. In 1967, Barker and Loudon studied the E and A1 modes using IR and Raman spectroscopies. In their study, the lowest A1(TO) mode was observed at 252 cm−1 by Raman spectroscopy and at 248 cm−1 by IR spectroscopy. To date, although many vibrational measurements have been reported, these results remain controversial [42,43,44,45,46,47]. Recently, theoretical studies of the optical modes based on first-principles calculations have been reported. In 2000, Caciuc et al. reported the lowest A1(TO) mode at 208 cm−1 [48], whereas in 2002, Veithen and coworkers reported the lowest A1(TO) mode at 243 cm−1 [49,50]. The study by Sanna et al. indicated the lowest A1(TO) mode at 239 cm−1 [51]. Therefore, the calculated values in the theoretical studies were also controversial.
In the ferroelectric phase of lithium niobate with a rhombohedral 3m point group, nine E(x) symmetry modes were infrared- and Raman-active. However, previous IR measurements have indicated eight TO modes, and some mode frequencies are controversial [41,43,47]. For example, Barker and Loudon reported that the E(TO6) frequency is 431 cm−1 [43], which is inconsistent with the result of first-principles calculations [48,49,50,51]. Other infrared spectroscopic studies did not observe E(TO6) [41,47]. Previous Raman studies reported eight to nine modes [42,43,44,45], and some mode frequencies were different from the results of recent theoretical calculations [49,50,51].
Therefore, it is necessary to determine reliable mode frequencies by an appropriate IR measurement technique. Up to the present, generally high-dielectric materials have shown very high reflectivity in the THz region. In the study of low-frequency modes, only the reflectance spectra have been analyzed by the Kramers–Kronig relation to determine the complex dielectric constant of a sample to be observed. However, such analyses require some assumptions that can cause problems for the determination of the complex dielectric constant. In fact, the Kramers–Kronig transformation requires accurate knowledge of the reflectance over a wide frequency range and extrapolation beyond it. For disordered materials, which show dielectric dispersions such as defects-induced relaxation, it is difficult to determine both the real and imaginary parts of a complex permittivity in the THz region only by the reflectance spectra [14].
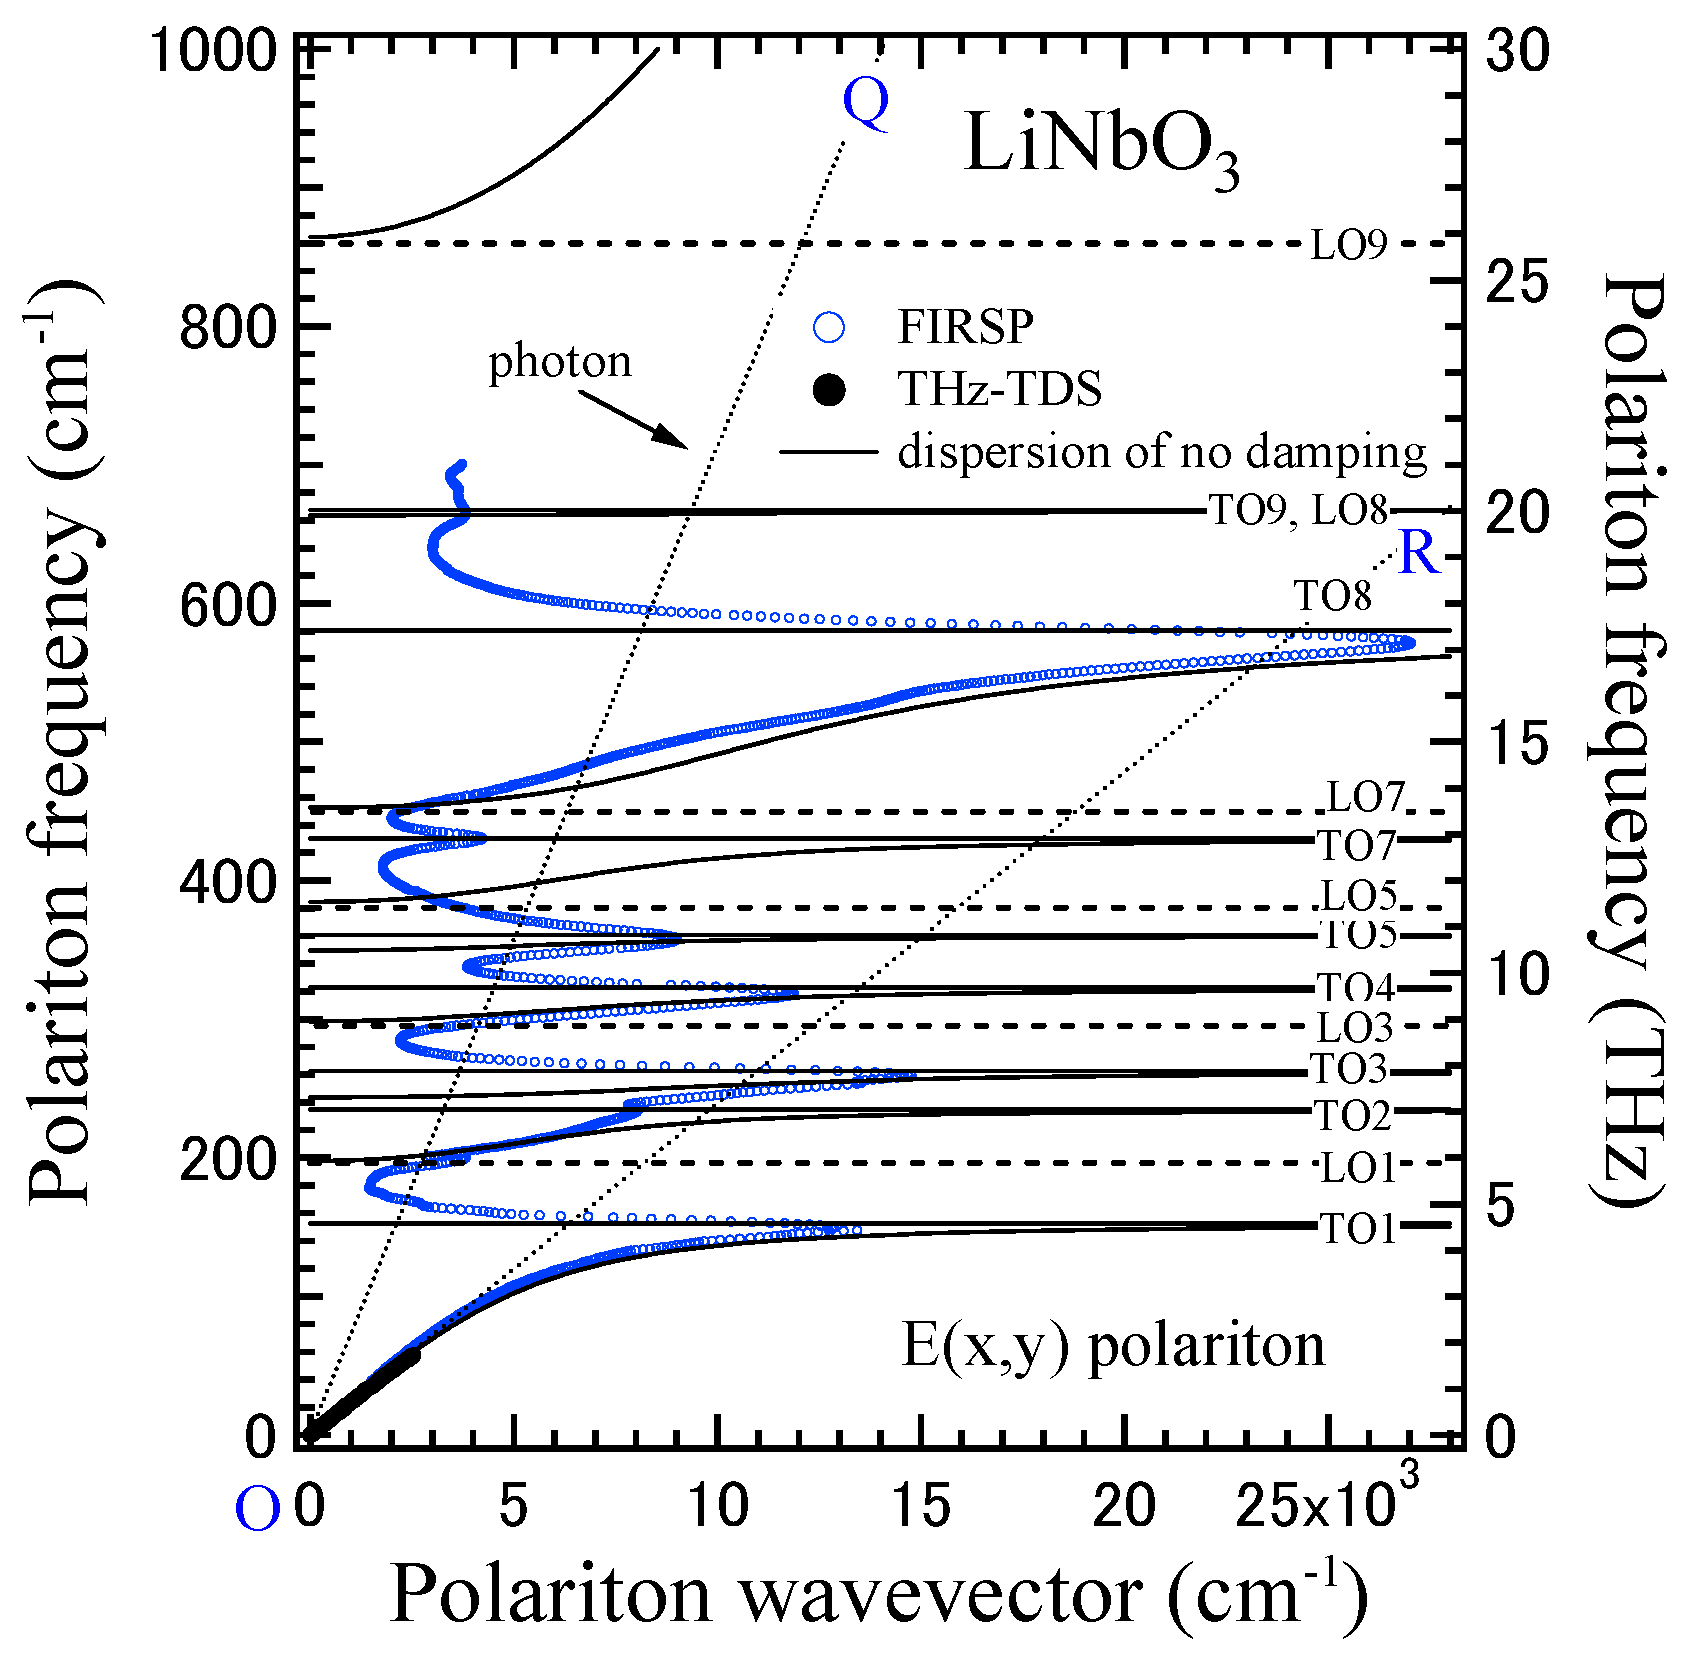
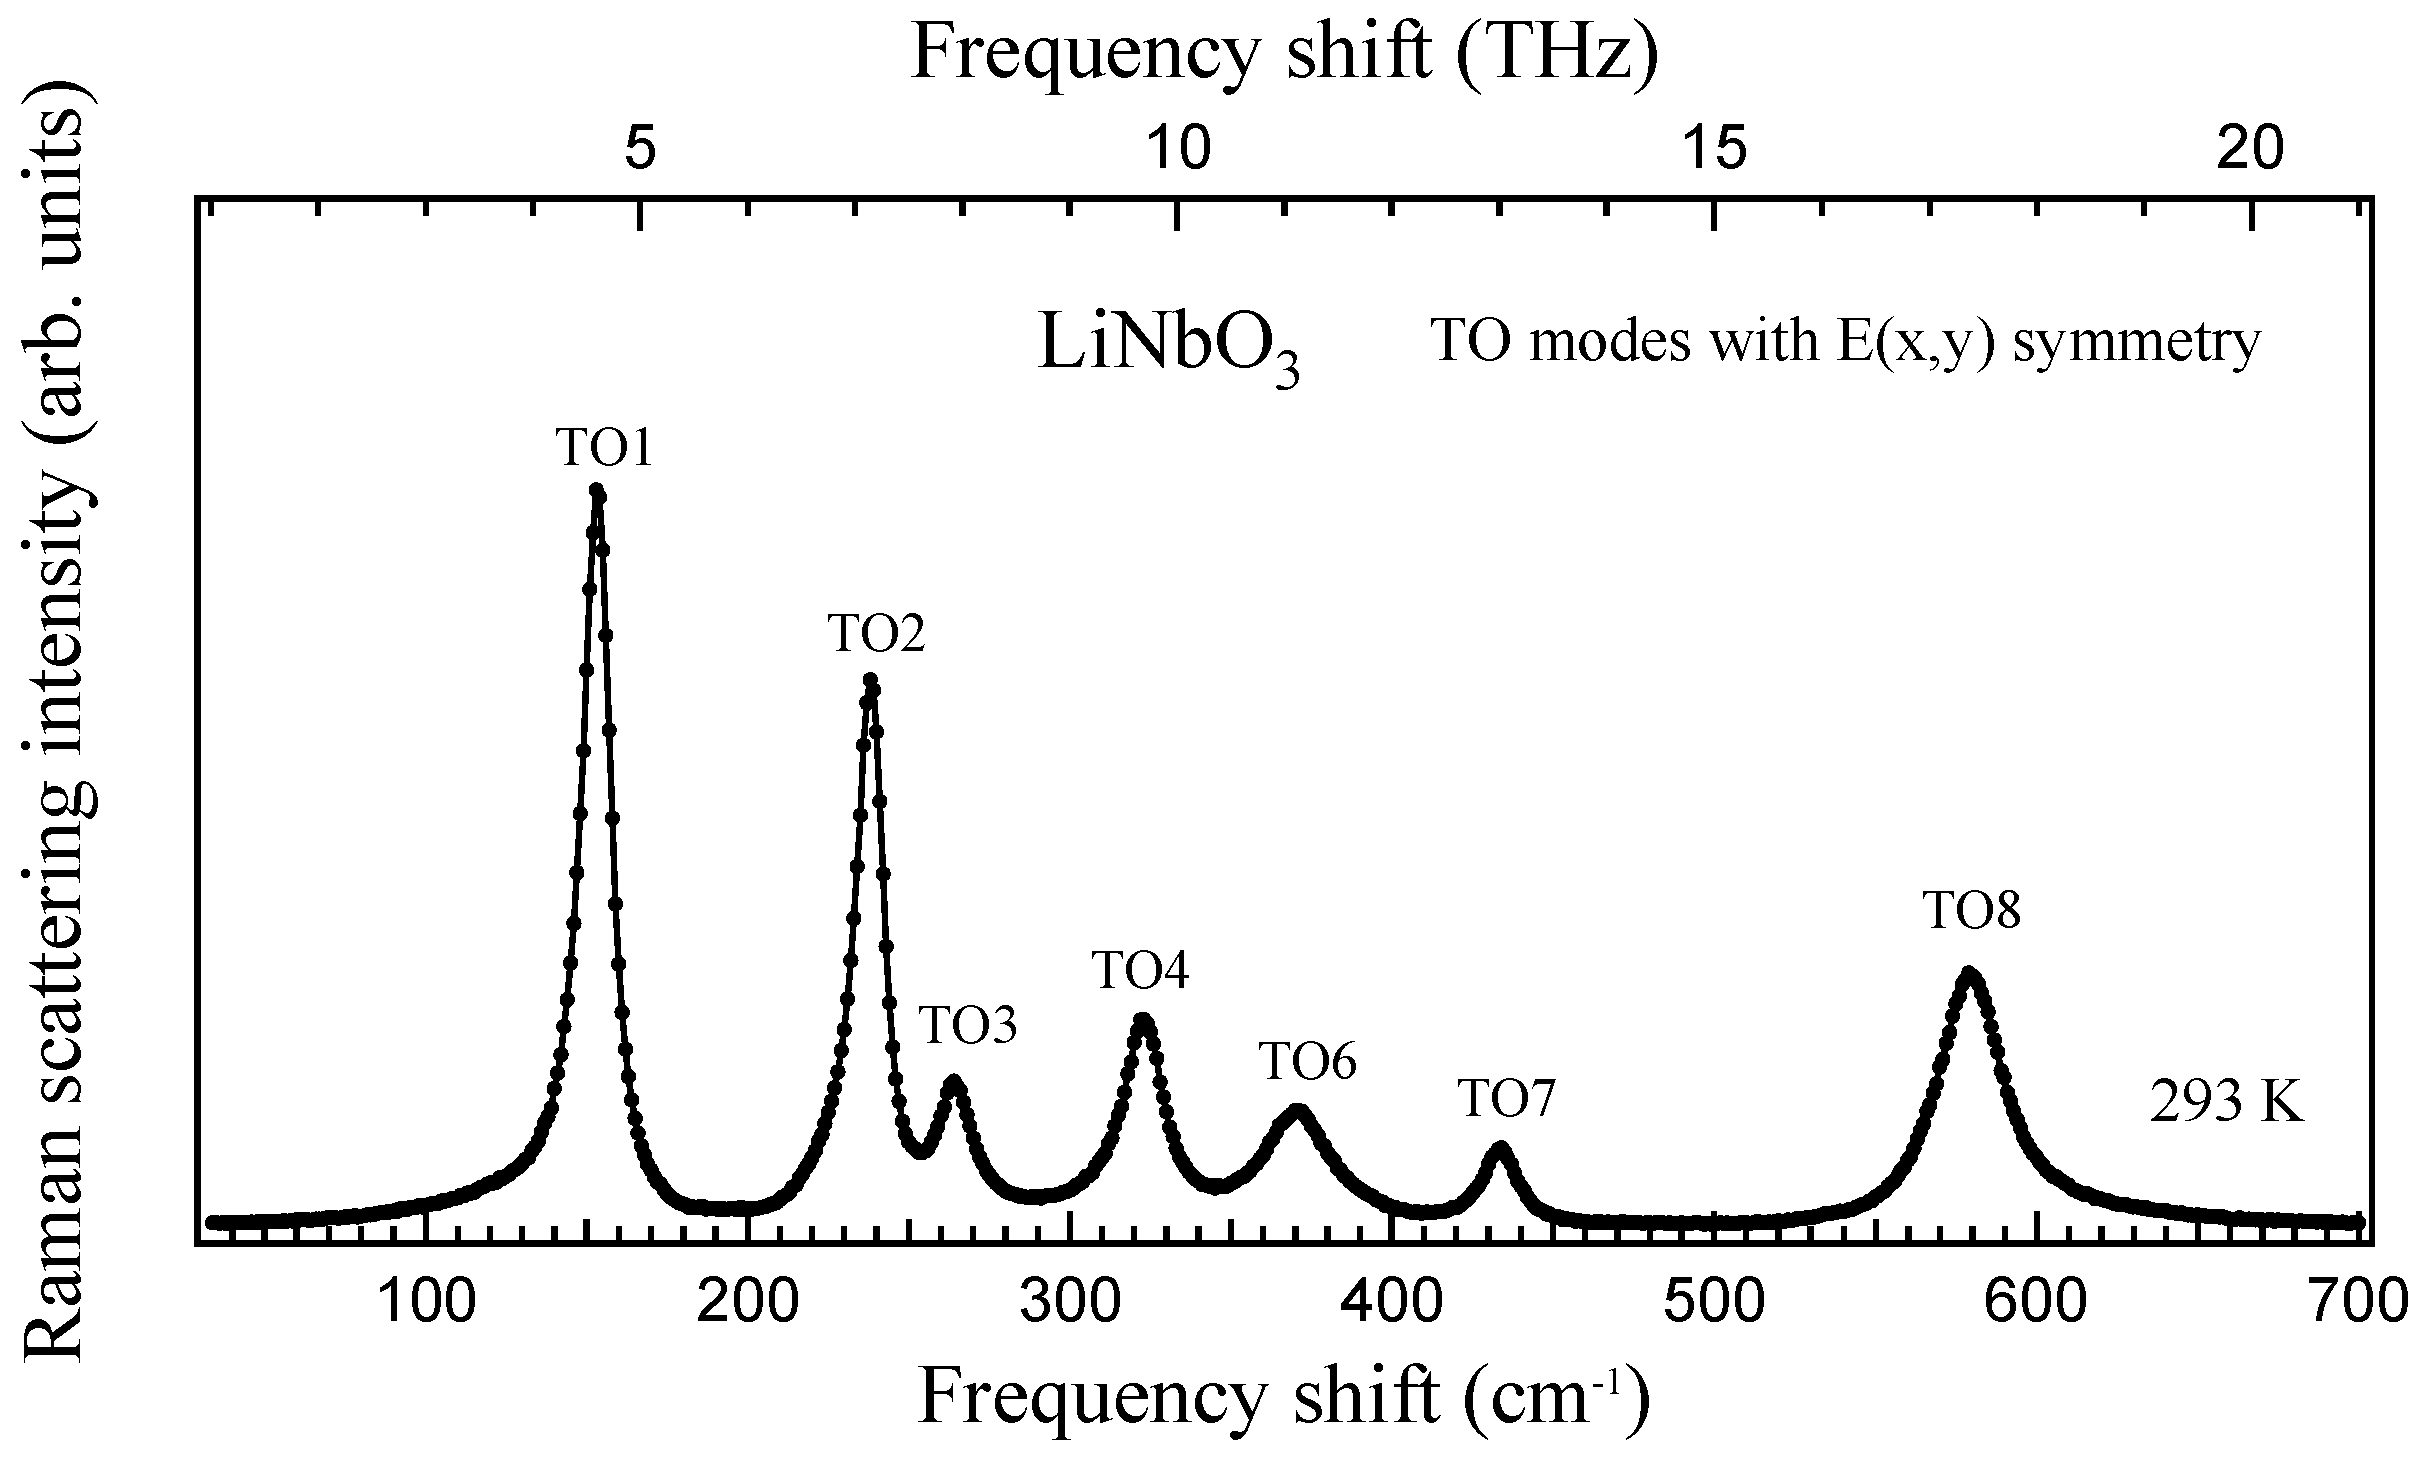
In the present study, the IR spectra were measured by the ellipsometric technique using a FIRSP system. The polariton dispersion relations of the E modes were determined as shown in Figure 6 [52]. The results of the THz-TDS are also plotted in Figure 6 for the low-frequency region [53]. For such a low-frequency region, the relatively high birefringence in the visible region made me unable to observe the forward Raman scattering of polaritons with E(x,y) symmetry using Equation (5). Except for the E(TO6) mode, eight modes were clearly observed, and their frequencies were in good agreement with those in [47], within experimental uncertainty. As a complementary measurement, Raman scattering spectra were obtained at backward scattering geometry, as shown in Figure 7 [52]. The E(TO6) mode was clearly observed in a Raman spectrum, as shown in Figure 7 [52], whereas the E(TO5) and E(TO9) modes were not observed due to the very low scattering intensity. The present Raman result was in agreement with those in [47,51], within experimental accuracy. By combining FIRSP and Raman scattering measurements, all nine E(x) symmetry modes were successfully observed. The values observed by FIRSP and Raman scattering, and those of the theoretical calculations [51], were in agreement with recent Raman studies [47,51] and recent first-principles calculations [49,50,51].
4. Summary
Electromagnetic waves at frequencies below the X-ray region strongly couple to the optical vibrational modes in a solid. These coupled excitations have been called phonon polaritons. The terahertz and far-infrared spectroscopic studies of the dispersion relations of phonon polaritons in dielectric and ferroelectric crystals were reviewed. The polariton dispersion relations of a ferroelectric soft optic mode in ferroelectric bismuth titanate crystals with a polar bismuth layered structure, the Raman-inactive soft mode in quantum paraelectric barium zirconate crystals with a cubic nonpolar perovskite structure, the polariton dispersion relations of the Raman-inactive optical modes of quantum paraelectric strontium titanate crystals with a cubic nonpolar perovskite structure, and the low-frequency optical modes of ferroelectric lithium niobate crystals with a polar ilmenite structure were reviewed in the broad terahertz range using terahertz time-domain spectroscopy, far-infrared spectroscopy, far-infrared spectroscopic ellipsometry, and Raman scattering spectroscopy.
Funding
This study was supported in part by JSPS KAKENHI Grant Number JP17K05030.
Acknowledgments
The author thanks T. Nakamura, M. Wada Takeda, M. Maczka, T. Tsurumi, S. Nishizawa, H. Kitahara, Y. Ike, T. Mori, and T. Hoshina for their collaboration and discussions.
Conflicts of Interest
The author declares no conflicts of interest.
References
- Fano, F. Atomic Theory of electromagnetic interactions in dense materials. Phys. Rev. 1956, 103, 1202–1218. [Google Scholar] [CrossRef]
- Hopfield, J.J. Theory of the Contribution of Excitons to the Complex Dielectric Constant of Crystals. Phys. Rev. 1958, 112, 1555–1567. [Google Scholar] [CrossRef]
- Born, M.; Huang, K. Dynamical Theory of Crystal Lattices; Oxford University Press: Oxford, UK, 1954. [Google Scholar]
- Henry, C.H.; Hopfield, J.J. Raman scattering by polaritons. Phys. Rev. Lett. 1965, 15, 964–966. [Google Scholar] [CrossRef]
- Claus, R.; Merten, L.; Brandmüller, J. Light Scattering by Phonon-Polaritons; Springer: Berlin, Germany, 1975. [Google Scholar]
- Kawase, K.; Sato, M.; Taniuchi, T.; Ito, H. Coherent tunable THz-wave generation from LiNbO3 with monolithic grating coupler. Appl. Phys. Lett. 1996, 68, 2483–2485. [Google Scholar] [CrossRef]
- Barjker, A.S.; Loudon, R. Response Functions in the Theory of Raman Scattering by Vibrational and Polariton Modes in Dielectric Crystals. Rev. Mod. Phys. 1972, 44, 18–47. [Google Scholar] [CrossRef]
- Kojima, S.; Maczka, M. Broadband Phonon-Polariton Dispersion Relation of Ferroelectric LiTaO3 Crystals. Ferroelectrics 2018. Unpublished work. [Google Scholar]
- Fukumoto, T.; Okamoto, A.; Hattori, T.; Mitsuishi, A. Light scattering by polariton modes of KNbO3 in orthorhombic phase. Solid State Commun. 1975, 17, 427–431. [Google Scholar] [CrossRef]
- Kojima, S.; Nakamura, T. Observations of low-frequency phonon-polariton in barium sodium niobate. Jpn. J. Appl. Phys. 1980, 19, L609–L611. [Google Scholar] [CrossRef]
- Kojima, S. Low frequency phonon polaritons in several ferroelectrics. Ferroelectrics 1981, 37, 677–680. [Google Scholar] [CrossRef]
- Dougherty, T.P.; Wiederrecht, G.P.; Nelson, K.A. Impulsive stimulated Raman scattering experiments in the polariton regime. J. Opt. Soc. Am. B 1992, 9, 2179–2189. [Google Scholar] [CrossRef]
- Kojima, S.; Shibata, T.; Igawa, H.; Mori, T. Broadband terahertz time-domain spectroscopy: Crystalline and glassy drug materials. IOP Conf. Ser. Mater. Sci. Eng. 2014, 54, 012001. [Google Scholar] [CrossRef]
- Hoshina, T.; Kanehara, K.; Takeda, H.; Tsurumi, T. Terahertz dielectric response of single-domain BaTiO3 measured by far-infrared spectroscopic ellipsometry. Jpn. J. Appl. Phys. 2014, 53, 09PD03. [Google Scholar] [CrossRef]
- Van Exter, M.; Grischkowsky, D. Optical and electronic properties of doped silicon from 0.1 to 2 THz. Appl. Phys. Lett. 1998, 56, 1694–1696. [Google Scholar] [CrossRef]
- Wada, M.; Doi, Y.; Inoue, K.; Haus, J.W.; Yuan, Z. A simple-cubic photonic lattice in silicon. Appl. Phys. Lett. 1997, 70, 2966–2968. [Google Scholar] [CrossRef]
- Kojima, S.; Tsumura, N.; Takeda, M.W.; Nishizawa, S. Far-infrared phonon-polariton dispersion probed by terahertz time-domain spectroscopy. Phys. Rev. B 2003, 67, 035102. [Google Scholar] [CrossRef]
- Kojima, S.; Shimada, S. Soft mode spectroscopy of bismuth titanate single crystals. Physica B 1996, 219–220, 617–619. [Google Scholar] [CrossRef]
- Kurosawa, T. Polarization Waves in Solids. J. Phys. Soc. Jpn. 1961, 16, 1298–1308. [Google Scholar] [CrossRef]
- Dobal, P.S.; Dixit, A.; Katiyar, R.S.; Yu, Z.; Guo, R.; Bhalla, A.S. Micro-Raman scattering and dielectric investigations of phase transition behavior in the BaTiO3–BaZrO3 system. J. Appl. Phys. 2001, 89, 8085–8091. [Google Scholar] [CrossRef]
- Akbarzadeh, A.R.; Kornev, I.; Malibert, C.; Bellaiche, L.; Kiat, J.M. Combined theoretical and experimental study of the low-temperature properties of BaZrO3. Phys. Rev. B 2005, 72, 205104. [Google Scholar] [CrossRef]
- Helal, M.A.; Mori, T.; Kojima, S. Softening of infrared-active mode of perovskite BaZrO3 proved by terahertz time-domain spectroscopy. Appl. Phys. Lett. 2015, 106, 182904. [Google Scholar] [CrossRef] [Green Version]
- Helal, M.A.; Mori, T.; Kojima, S. Terahertz time-domain spectroscopy and Raman scattering studies of incipient ferroelectric BaZrO3. Ferroelectrics 2016, 499, 107–114. [Google Scholar] [CrossRef] [Green Version]
- Nuzhnyy, D.; Petzelt, J.; Savinov, M.; Ostapchuk, T.; Bovtun, V.; Kempa, M.; Hlinka, J.; Buscaglia, V.; Buscaglia, M.T.; Nanni, P. Broadband dielectric response of Ba(Zr,Ti)O3 ceramics: From incipient via relaxor and diffuse up to classical ferroelectric behavior. Phys. Rev. B 2012, 86, 014106. [Google Scholar] [CrossRef]
- Evarestov, R.A. Hybrid density functional theory LCAO calculations on phonons in Ba(Ti,Zr,Hf)O3. Phys. Rev. B 2011, 83, 014105. [Google Scholar] [CrossRef]
- Luspin, Y.; Servoin, J.L.; Gervais, F. Soft mode spectroscopy in barium titanate. J. Phys. C 1980, 13, 3761–3773. [Google Scholar] [CrossRef]
- Presting, H.; Sanjurjo, J.A.; Vogt, H. Mode softening in cubic BaTiO3 and the problem of its adequate description. Phys. Rev. 1983, 28, 6097–6099. [Google Scholar] [CrossRef]
- Muller, K.A.; Burkard, H. SrTiO3: An intrinsic quantum paraelectric below 4 K. Phys. Rev. B 1979, 19, 3593–3602. [Google Scholar] [CrossRef]
- Spitzer, W.G.; Miller, R.C.; Kleinman, D.A.; Howarth, L.E. Far Infrared Dielectric Dispersion in BaTiO3, SrTiO3, and TiO2. Phys. Rev. 1962, 126, 1710–1721. [Google Scholar] [CrossRef]
- Kanehara, K.; Hoshina, T.; Takeda, H.; Tsurumi, T. Measurement of ionic polarization of SrTiO3 single crystal by far-infrared spectroscopic ellipsometry. Appl. Phys. Lett. 2014, 105, 042901. [Google Scholar] [CrossRef]
- Matsumoto, N.; Fujii, T.; Kageyama, K.; Takagi, H.; Nagashima, T.; Hangyo, M. Measurement of the Soft-Mode Dispersion in SrTiO3 by Terahertz Time-Domain Spectroscopic Ellipsometry. Jpn. J. Appl. Phys. 2002, 48, 19KC11. [Google Scholar]
- Kojima, S.; Mori, T. Terahertz time-domain spectroscopy of Raman inactive phonon-polariton in strontium titanate. Ferroelectrics 2016, 499, 100–106. [Google Scholar] [CrossRef] [Green Version]
- Kojima, S.; Maczka, M. Raman inactive phonon-polariton dispersion in quantum paraelectric SrTiO3 crystals studied by FTIR. Ferroelectrics 2018, 524, 1–8. [Google Scholar] [CrossRef]
- Denisov, V.N.; Mavrin, B.N.; Podobedev, V.B.; Sterin, K.E. Hyper Raman scattering by polaritons in centrally symmetric SrTiO3 crystal. JETP Lett. 1980, 31, 102–105. [Google Scholar]
- Inoue, K.; Asai, N.; Samejima, T. Observation of the phonon polariton in the centrosymmetric crystal of SrTiO3 by Hyper Raman scattering. J. Phys. Soc. Jpn. 1980, 48, 1787–1788. [Google Scholar] [CrossRef]
- Matthias, B.T.; Remeika, J.P. Ferroelectricity in the ilmenite structure. Phys. Rev. 1949, 76, 1886–1887. [Google Scholar] [CrossRef]
- Bazzan, M.; Fontana, M. Preface to Special Topic: Lithium Niobate Properties and Applications: Reviews of Emerging Trends. Appl. Phys. Rev. 2015, 2, 040501. [Google Scholar] [CrossRef] [Green Version]
- Lee, A.J.; Pask, H.M. Cascaded stimulated polariton scattering in a Mg:LiNbO3 terahertz laser. Optics Express. 2015, 23, 8687. [Google Scholar] [CrossRef] [PubMed]
- Niizeki, N.; Yamada, T.; Toyoda, H. Growth Ridges, Etched Hillocks, and Crystal Structure of Lithium Niobate. Jpn. J. Appl. Phys. 1967, 6, 318–327. [Google Scholar] [CrossRef]
- Abrahams, S.C.; Levinstein, H.J.; Reddy, J.M. Ferroelectric lithium niobate. 4. Single crystal neutron diffraction study at 24 °C. J. Phys. Chem. Solids 1966, 27, 1013–1018. [Google Scholar] [CrossRef]
- Axe, J.D.; O’Kane, D.F. Infrared dielectric dispersin of LiNbO3. Appl. Phys. Lett. 1966, 9, 58–60. [Google Scholar] [CrossRef]
- Schaufele, R.F.; Weber, M.J. Raman Scattering by Lithium Niobate. Phys. Rev. 1966, 152, 705–708. [Google Scholar] [CrossRef]
- Barker, A.S., Jr. Loudon, R. Dielectric Properties and Optical Phonons in LiNbO3. Phys. Rev. 1967, 158, 433–445. [Google Scholar] [CrossRef]
- Kaminow, I.P.; Johnston, W.D., Jr. Quantitative Determination of Sources of the Electro-Optic Effect in LiNbO3 and LiTaO3. Phys. Rev. 1967, 160, 519–522. [Google Scholar] [CrossRef]
- Claus, R.; Borstel, G.; Wiesendanger, E.; Steffan, L. Assignments of Optical Phonon Modes in LiNbO3. Phys. Rev. B 1972, 6, 4878–4879. [Google Scholar] [CrossRef]
- Kojima, S. Composition variation of optical phonon damping of lithium niobate crystals. Jpn. J. Appl. Phys. 1993, 32, 4373–4376. [Google Scholar] [CrossRef]
- Margueron, S.; Bartasyte, A.; Glazer, A.M.; Simon, E.; Hlinka, J.; Gregora, I.; Gleize, J. Resolved E-symmetry zone-center phonons in LiTaO3 and LiNbO3. J. Appl. Phys. 2012, 111, 104105. [Google Scholar] [CrossRef]
- Caciuc, V.; Postnikov, A.V.; Borstel, B. Ab initio structure and zone-center phonons in LiNbO3. Phys. Rev. B 2000, 61, 8806–8813. [Google Scholar] [CrossRef]
- Veithen, M.; Ghosez, P. First-principles study of the dielectric and dynamical properties of lithium niobate. Phys. Rev. B 2002, 65, 214302. [Google Scholar] [CrossRef]
- Hermet, P.; Veithen, M.; Ghosez, P. First-principles calculations of the nonlinear optical susceptibilities and Raman scattering spectra of lithium niobate. J. Phys. Condens. Matter 2007, 19, 456202. [Google Scholar] [CrossRef]
- Sanna, S.; Neufeld, S.; Rusing, M.; Berth, G.; Zrenner, A.; Schmidt, W.G. Raman scattering efficiency in LiTaO3 and LiNbO3 crystals. Phys. Rev. B 2015, 91, 224302. [Google Scholar] [CrossRef]
- Kojima, S.; Kanehara, K.; Hoshina, T.; Tsurumi, T. Optical phonons and polariton dispersions of congruent LiNbO3 studied by far-infrared spectroscopic ellipsometry and Raman scattering. Jpn. J. Appl. Phys. 2016, 55, 10TC02. [Google Scholar] [CrossRef]
- Kojima, S.; Kitahara, H.; Wada Takeda, M.; Nishizawa, S. Terahertz time domain spectroscopy of phonon-polaritons in ferroelectric lithium niobate crystals. Jpn. J. Appl. Phys. 2002, 41, 7033–7037. [Google Scholar] [CrossRef]
Figure 1.
Dispersion relation of a phonon polariton with two optical modes. The line of OR denotes ν = ck/2π. The line of OQ denotes ν = ck/2π. The dotted lines show the observable region of the forward Raman scattering with a fixed scattering angle.
Figure 1.
Dispersion relation of a phonon polariton with two optical modes. The line of OR denotes ν = ck/2π. The line of OQ denotes ν = ck/2π. The dotted lines show the observable region of the forward Raman scattering with a fixed scattering angle.

Figure 2.
Low-frequency Raman spectra of a Bi4Ti3O12 crystal for the modes with A’(x,z) and A”(y) symmetries [18].
Figure 2.
Low-frequency Raman spectra of a Bi4Ti3O12 crystal for the modes with A’(x,z) and A”(y) symmetries [18].

Figure 3.
Low-frequency polariton dispersion relations for (a) A’(x,z) and (b) A”(y) modes of a Bi4Ti3O12 crystal [17]. The line of OR denotes ν = ck/2π
Figure 3.
Low-frequency polariton dispersion relations for (a) A’(x,z) and (b) A”(y) modes of a Bi4Ti3O12 crystal [17]. The line of OR denotes ν = ck/2π

Figure 4.
(a) The imaginary part of a dielectric constant at 8 K. The TO1 mode was observed at 65 cm−1. (b) Temperature dependence of the Raman-inactive soft mode of a BaZrO3 crystal [22,23].

Figure 5.
Polariton dispersion relations on real parts of the polariton wavevector of an SrTiO3 crystal. TOj (j = 1,2,3) and longitudinal optic (LO)j (j = 1,2,3) denote the three TO and three LO modes of the T1u symmetry, respectively [33]. The line of OQ denotes ν = ck/2π. The results of FTIR [33] and THz-TDS [32] are shown by the solid line and the closed circles, respectively. The values of the hyper-Raman scattering reported in [34,35] are shown by the closed triangles and closed diamonds for comparison to the FTIR values.

Figure 6.
Dispersion relation of phonon polaritons of an LiNbO3 crystal with E(x) symmetry. The open circles and closed circles denote the observed values by FIRSP [52] and THz-TDS [53], respectively. The line of OQ denotes ν = ck/2π. The line of OR denotes ν = ck/2π. Dotted lines denote the calculated dispersion with no damping.

Figure 7.
Raman scattering spectrum of E(x,y) symmetry modes of an LiNbO3 crystal [52].
Figure 7.
Raman scattering spectrum of E(x,y) symmetry modes of an LiNbO3 crystal [52].

© 2018 by the author. Licensee MDPI, Basel, Switzerland. This article is an open access article distributed under the terms and conditions of the Creative Commons Attribution (CC BY) license (http://creativecommons.org/licenses/by/4.0/).
Share and Cite
MDPI and ACS Style
Kojima, S. Broadband Terahertz Spectroscopy of Phonon-Polariton Dispersion in Ferroelectrics. Photonics 2018, 5, 55. https://doi.org/10.3390/photonics5040055
AMA Style
Kojima S. Broadband Terahertz Spectroscopy of Phonon-Polariton Dispersion in Ferroelectrics. Photonics. 2018; 5(4):55. https://doi.org/10.3390/photonics5040055
Chicago/Turabian StyleKojima, Seiji. 2018. "Broadband Terahertz Spectroscopy of Phonon-Polariton Dispersion in Ferroelectrics" Photonics 5, no. 4: 55. https://doi.org/10.3390/photonics5040055
Note that from the first issue of 2016, this journal uses article numbers instead of page numbers. See further details here.