Article

Effects of Excitation Angle on Air-Puff-Stimulated Surface Acoustic Wave-Based Optical Coherence Elastography (SAW-OCE)

Centre of Medical Engineering and Technology, University of Dundee, Dundee DD1 4HN, UK
*
Author to whom correspondence should be addressed.
Photonics 2024, 11(3), 254; https://doi.org/10.3390/photonics11030254
Submission received: 2 February 2024 / Revised: 6 March 2024 / Accepted: 7 March 2024 / Published: 12 March 2024
(This article belongs to the Special Issue OCT Technology Advances and Their Applications in Disease Studies)

Abstract

:
Increased stiffness of tissues has been recognised as a diagnostic feature of pathologies. Tissue stiffness characterisation usually involves the detection of tissue response from mechanical stimulation. Air-puff optical coherence elastography (OCE) can generate impulse surface acoustic waves (SAWs) on tissue surface without contact and evaluate the mechanical properties of tissue. This study endeavours to explore the optimal excitation angle for air-puff OCE, a parameter that lacks standardisation at present, by investigating the relationship between the frequency bandwidth and peak-to-peak signal-to-noise ratio (SNR) of SAWs for different excitation angles (relative to the normal surface) of air-puff on the sample, from 5° to 85°, with an interval of 5° applied on the phantom. Due to the unevenness of human hands, 20°, 45° and 70° angles were employed for human skin (10 healthy adults). The results show that a smaller excitation angle could produce higher wave frequency bandwidth; a 5° angle generated an SAW with 1747 Hz frequency bandwidth, while an 85° angle produced an SAW with 1205 Hz. Significant differences were not shown in peak-to-peak SNR comparison between 5° and 65° on the phantom, but between 65° and 85° at the excitation position, a reduction of 48.6% was observed. Furthermore, the group velocity of the SAWs was used to evaluate the bulk Young’s modulus of the human tissue. The outcomes could provide essential guidance for air-puff-based elastography studies in clinical applications and future tissue research.

1. Introduction

Numerous abnormalities in tissues lead to alterations in their mechanical characteristics. For example, in cancer research, the mean Young’s modulus of malignant breast masses is 2.02 times higher than that of benign ones [1]. In dermatology, the mean Young’s modulus of hands with scleroderma is 51% higher than that of healthy hand tissues [2]. Malignant melanoma (MM) of the skin accounts for 65% of all skin cancer deaths, but it is generally curable with early detection and surgical excision [3]. Precise estimation of the Young’s modulus of tissue has the potential to evaluate pathological status [4,5,6] for early diagnosis. Elasticity measurement and elastography are techniques used to aid clinicians in the differential diagnosis, localisation and monitoring of lesions [7,8,9].
Optical coherent tomography (OCT) is a non-invasive, non-contact, real-time image method utilizing the principle of interferometry between backscattered light and a reference signal [10] that can achieve 2–10 μ m resolution and 1–3 mm tissue depth. OCE inherits the advantages of OCT, such as high-resolution, fast and potentially non-contact features [11,12,13]. By comparing with other elastography techniques, such as magnetic resonance elastography (MRE) and ultrasound elastography (USE), OCE can deliver measurements with higher resolution at a scale which is more closely associated with the morphology of diseases [14,15]. OCE is of great significance for the early diagnosis and monitoring of diseases as it can detect mechanical differences between tumour tissue and normal tissue to identify abnormal status [7,8,9].
Differently from previous research, Li et al. combined a phase-sensitive optical coherence tomography (PhS-OCT) system with a surface acoustic wave (SAW) method to provide the elastography of samples [16]. Since PhS-OCT can measure tissue deformation by successive B-scans, the propagation of induced impulse SAWs could be captured [17]. Surface acoustic wave optical coherence elastography (SAW-OCE) leverages the propagation characteristics of SAWs to quantify the mechanical properties of soft tissues [18]. Transient SAWs contain broad-frequency components; the high-frequency components penetrate the superficial depth of the tissue, while the lower-frequency components penetrate the deeper depth of the tissue [19]. Thus, SAW elastography has advantages in analysis of the Young’s modulus of layered solid samples [20]. With higher peak-to-peak signal-to-noise ratio (SNR) [4,21,22], better extraction of wave information and more accurate calculation of SAW velocities can be achieved [23]. Among OCE technologies, wave-based OCE uses different stimulation methods, e.g., shaker [24], ring actuator [25], nanobomb [26], transducer [27] and air-puff [28,29], to induce mechanical wave propagation in tissue. The stimulated mechanical waves that can be detected by OCT systems and then analyse the Young’s modulus distribution [30,31,32]. The features of SAWs are determined by both the intrinsic properties of the material and the stimulation system. Specifically, the maximum frequency of SAW depends on the sample properties and stimulation system setup [33]. Soft materials (such as soft tissues and silicone) exhibit a narrower frequency range (0-kHz) and a higher amplitude range than hard materials, i.e., plastic and metal (with a frequency range of 0-MHz). For soft tissue, the maximum frequency bandwidth is kHz, and stimuli with a broader frequency bandwidth are able to reveal full SAWs for analysis [33].
The air-puff system has the unique advantage of a non-contact nature; it is widely used in clinical applications, particularly in the fields of ophthalmology [11,34], soft tissue [29,35,36] and cardiology [37]. Even though there are a limited number of studies about the applications of air-puff system-based tissue stiffness measurements, the excitation distance, excitation angle and excitation pressure of air-puff system all affect the amplitude of SAWs [28]. The distance between the sample and the air-puff outlet, and different solenoid voltages all have influences on the air-puff pressure profile [38]. The diameter and cross-sectional area of the jet beam from the air-puff nozzle change according to different horizontal distances [39].
So far, the impact of the air-puff excitation angle on wave characteristics of tissue has yet to be explored. However, previous studies have not standardised the stimulating angle. An angle of 34° relative to the normal surface was chosen by Wang et al. as the excitation angle to generate surface waves to explore the properties of phantoms [28]. An angle of 15° relative to the normal sample of the air-puff system was applied by Wang et al. to detect soft-tissue tumours [29]. Singh et al. selected an incident angle of ~30° for an air-pulse system that was applied to evaluate the changes in mechanical properties of the cornea after UV-induced collagen cross-linking (CXL) [22]. Zhang et al. applied a 45° angle to investigate the impact of corneal cell–matrix interactions on corneal stromal model viscoelasticity [40]. The normal of the sample surface (0°) was also employed in some research [12,41,42,43,44] to investigate the excited angles of air-puff system application. To study the spatial deformation spreading (SDS) produced by air puffs to measure the shear elastic anisotropy of transversely isotropic tissue, a 0° angle was used to ensure normal homogeneous excitation, so the airstream was excited perpendicularly to the tissue [43]. Also, since the focal point of the air-puff was not covered by the scanning range, the excitation position was therefore not considered for the research [42]. As in ophthalmology, this provides better wave propagation uniformity in radial directions [12,41]. One research that could achieve the optical beam was collinear with the direction of the air-puff to allow the light to pass the commercial non-contact tonometer chamber through an optical window [44]. Some research applied the air-puff in the applications without mentioning any description and details about excitation angle [11,34,35,36,37,45,46,47,48,49].
This study aims to investigate the optimal excitation angle of the air-puff system by evaluating the wave frequency bandwidth and peak-to-peak SNR of SAWs signal on phantom and human skin, this will benefit the further air-puff system research and application. The group velocity could be calculated by the SAWs signal to evaluate the Young’s modulus of human skin. The outcomes can potentially provide essential standardisation, resulting in higher-quality signals for future tissue research.

2. Materials and Methods

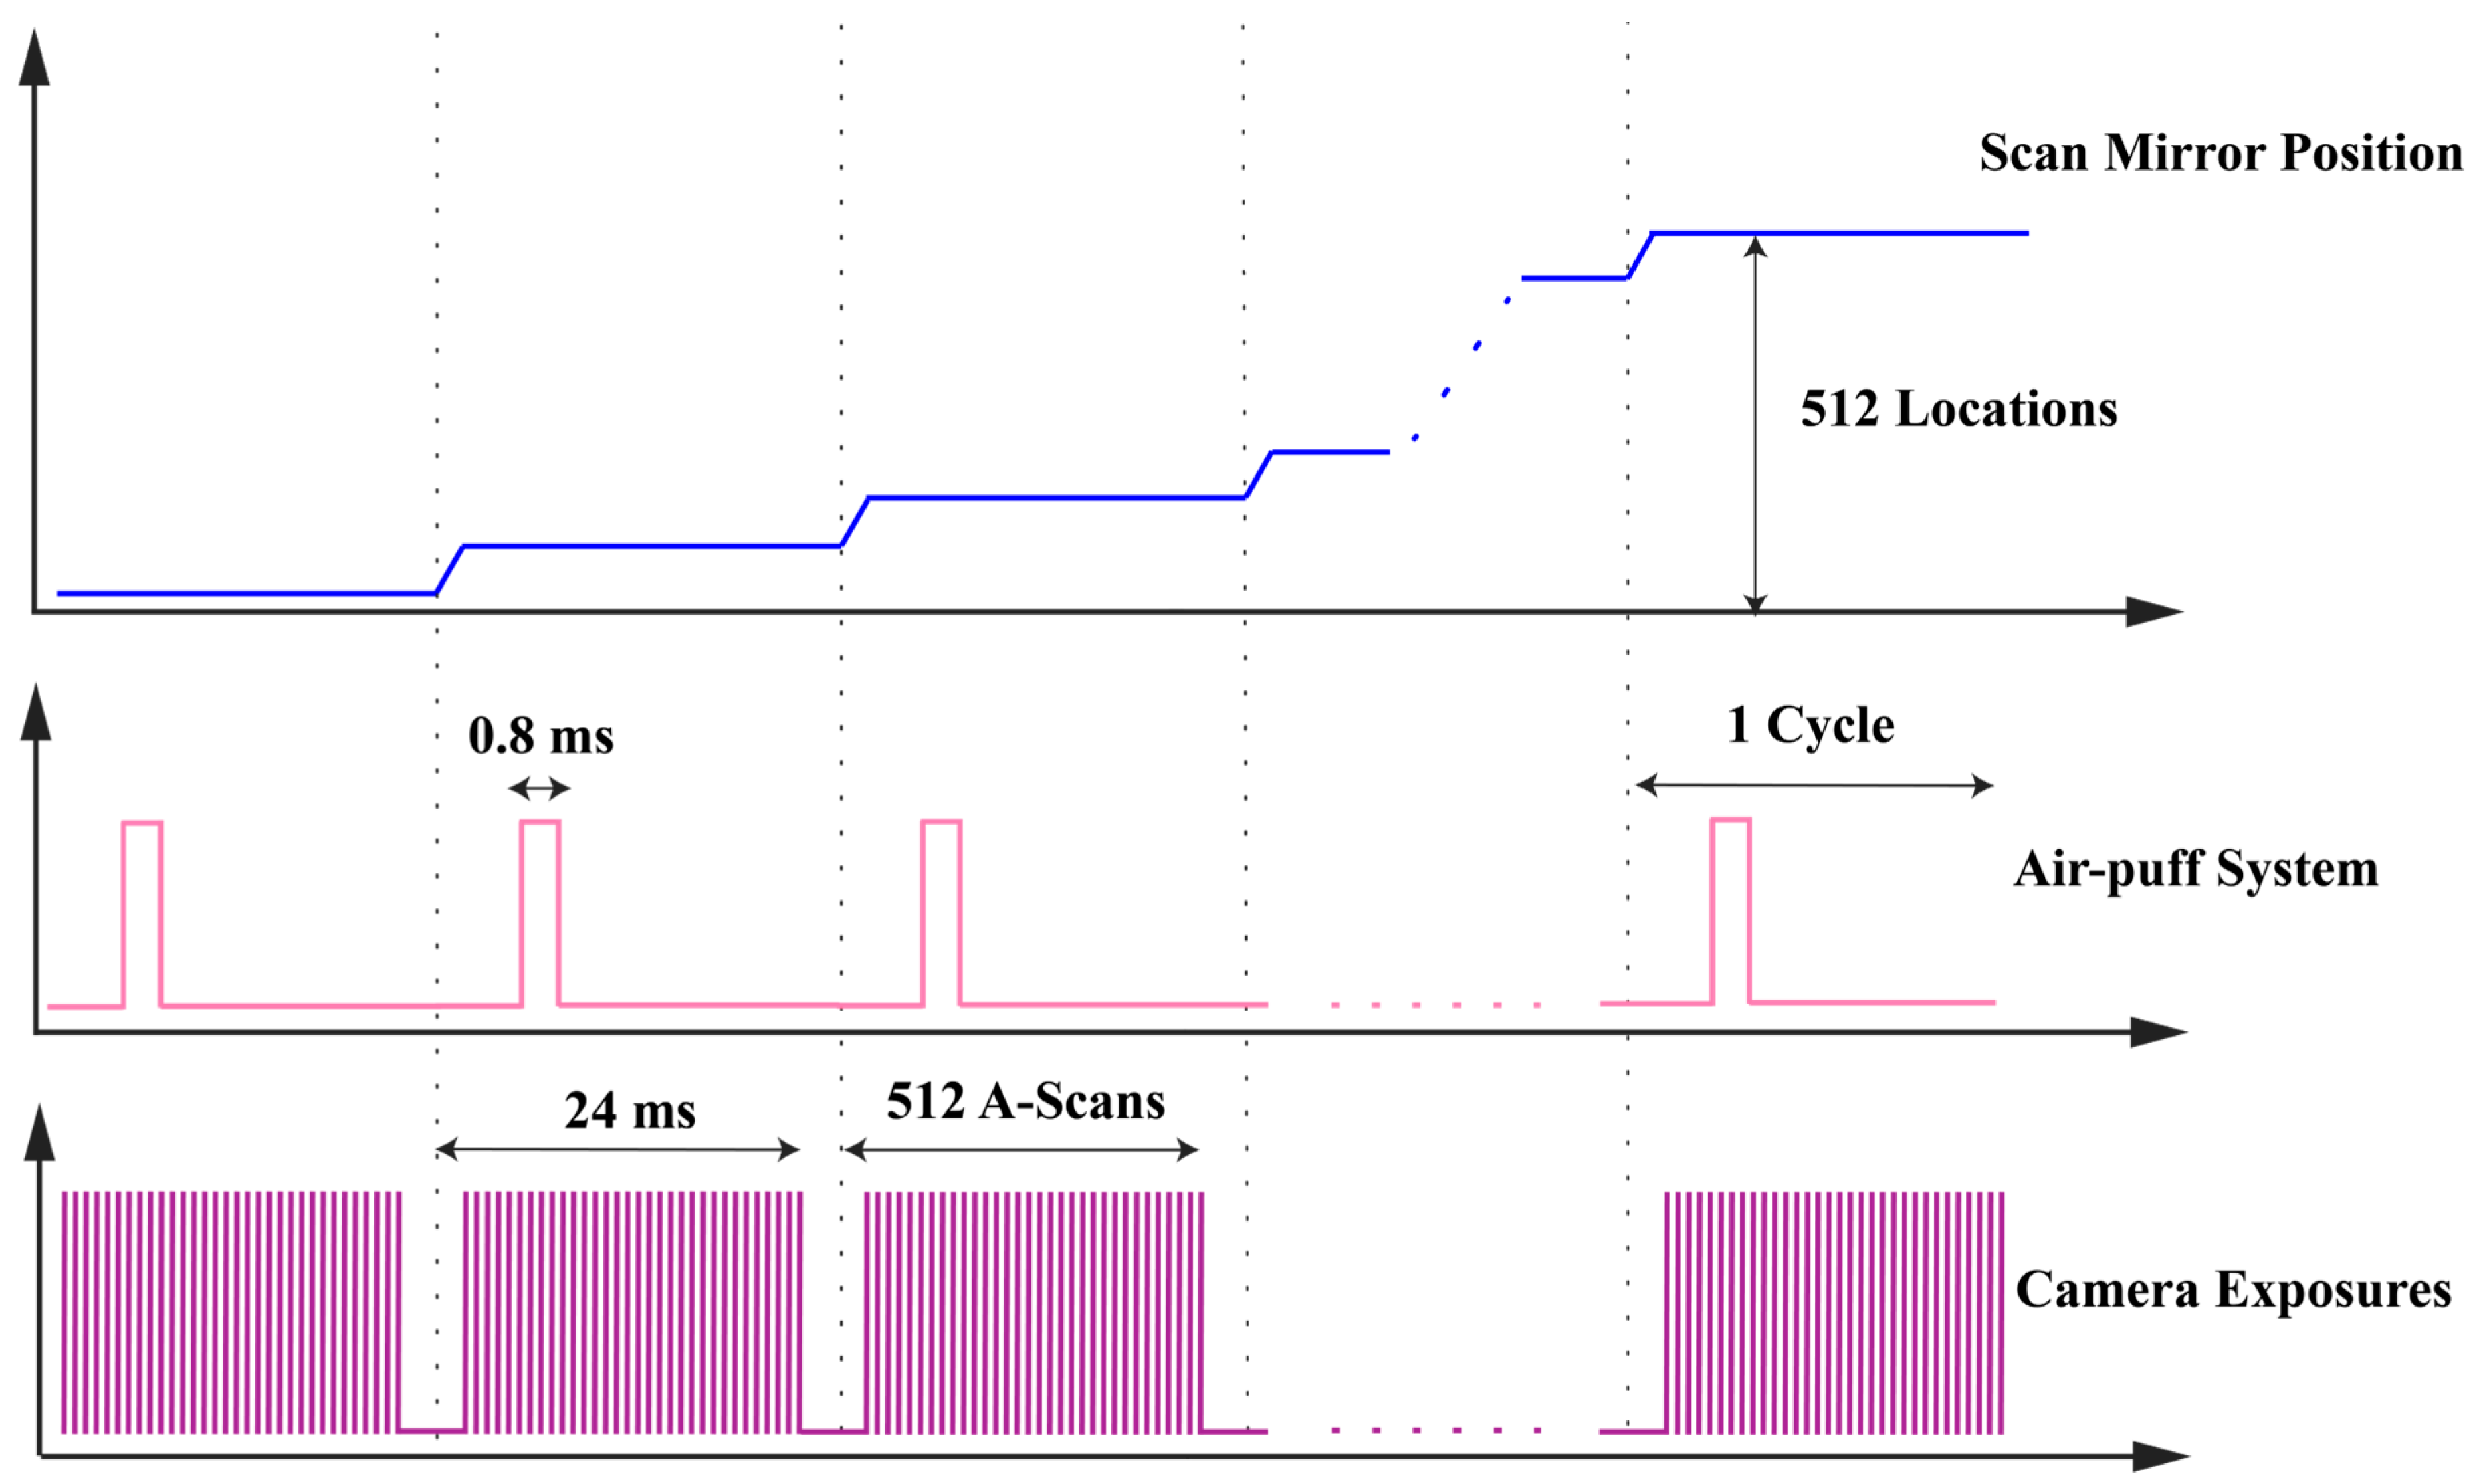
2.1. Air-Puff Stimulation System and PhS-Optical Coherence Tomography

A customised air-puff system was built to stimulate the sample surface to generate the SAW. An air-puff system consists of an air gate, air compressor, custom circuit, power supply and waveform generator as the major parts to deliver the air-puff on the sample surface. The duration time of air blowing for each pulse was ~0.8 ms with a bandwidth of 1250 Hz. The air-puff system was synchronised with the PhS-OCT system through the terminal block (BNC-2110, NI, National Instruments, Austin, TX, USA). The custom circuit was triggered by the waveform generator (33220A, Keysight Technologies Inc., Santa Rosa, CA, USA), the driven signal was 60 Hz square wave, with a peak-to-peak voltage amplitude ( V p p ) of 5 volts, the offset value ( V d c ) is +2.5 volts and the duty cycle of the wave was 50%.
The position of the needle was accurately adjusted by a 3D-translation stage which was set to the left of the sample station. A continuous rotation mount (CR1/M, Thorlabs Inc., Newton, NJ, USA) was chosen to rotate the sample station to achieve different stimulation angles. The outlet of the air-puff stream was delivered from a flat edge end needle port (Weller KDS2312P, Rapid Electronics Limited, Essex, UK) with an internal diameter of 0.4 mm. A protector nozzle was covered with the needle end for human skin data scanning safety issues. To avoid the phase wrapping, the position between the needle tip and the sample surface was fixed to ~1.25 mm as the outlet pressure from the air tube of the air compressor was 90 mbar which was measured by a digital manometer (Traceable, Cole-Parmer Instrument Company Ltd., Cambridgeshire, UK).
The SAWs generated by the air-puff system were detected via the PhS-OCT system shown in Figure 1. The PhS-OCT system utilized a spectral-domain optical coherence tomography (SD-OCT) architecture, comprising a broadband laser source, a circulator, a coupler (beam splitter), a reference arm, a sample arm, a spectrometer, and a computer. The PhS-OCT system has been used to measure tissue deformation using phase changes between successive B-scans. This method achieves extremely high sensitivity in characterising the deformation of tissue [17,50].
For the imaging scanning protocol (as shown in Figure 2), in this study, the x-scan mirror of the galvo-mirror system was employed for 2D cross-section images.
An A-scan described the information of depth of the detected sample. M-scan was multiple A-scans related to the time. In the current system employed in this study, an M-scan consisted of 512 A-scans. And one B-scan included 512 M-scans. Furthermore, the dataset obtained through M-B mode PhS-OCT offers a significantly enhanced lateral resolution compared to the specific location approach [19]. The timing schematic of SAW imaging scanning protocol is shown in Figure 3 below.
The PhS-OCT system included a broadband laser source with 1310 nm central wavelength and spectral bandwidth of 85 nm, donating the axial resolution of the current PhS-OCT system is 8.88 μ m in theory with the physical sampling distance is 4.68 μ m / p i x e l . Also, based on the principle of the Michelson interferometer, 90% light source was transmitted to the sample arm and the rest of the 10% light source was transported to the reference arm. The A-line rate was 20,730 Hz in this study. In the sample arm section of the current PhS-OCT system, the focal length of the objective lens is 50 mm, therefore, the lateral resolution is 16 μ m in the air and the physical sampling distance is 11.72 μ m / p i x e l . The transverse distance range was 6 mm.
All SAWs were detected and recorded by the customised LabVIEW interface (version 2017, NI, National Instruments, Austin, TX, USA) and saved in the lab PC for data processing.

2.2. Experimental Samples

2.2.1. Silicone Phantom

EcoflexTM 00-30 type silicone (Smooth on, Inc., Macungie, Pennsylvania, USA) were prepared based on the technical specification of Smooth on company and was fabricated in the mould with sizes of 65   m m × 65   m m × 13   m m . The thickness of the silicone phantom was approximate to 13 mm. The appropriate amount of silicone-specific white pigment was added during the silicone phantom fabrication to improve scattering. Three repeat scans were applied to the silicone phantom for the experiment.

2.2.2. Participant Recruitment

To further investigate the performance of different excitation angles in the in-vivo human skin, 10 healthy volunteers age range from 21 to 30 years old participated in this study. Two scanning positions (back of hand and palm) were selected for the experiment, with three scanning repeats for each position. This study obtained an approval letter from the School of Science and Engineering Research Ethics Committee of the University of Dundee. According to the requirements of the ethics approval, all volunteers who participated in this study signed the consent form and data collection form before the data collection.

2.3. Air-Puff-Stimulated SAW Characterization and Evaluation

To evaluate the results to investigate the optimal excitation angle, two post-processing methods were used for the data analysis. The first method was to compare the signal decay to a tenth of the spectral bandwidth (−20 dB) as the threshold frequency. As lower frequency (longer wavelength) surface waves can propagate deeper into the tissue, a wider bandwidth means more high-frequency waves are contained, and thus, the wider the frequency coverage of the wave from low to high frequencies. The second method was to evaluate the peak-to-peak SNR. The attenuation of the signal intensity of the SAW generated by different excitation angles would also produce differences and the peak-to-peak SNR of different positions can be calculated, which was expressed using the peak-to-peak signal amplitude ( S i g n a l p 2 p ) relative to the peak-to-peak noise amplitude ( N o i s e p 2 p ), which based on the following equation:
S N R = 20 l o g 10 S i g n a l p 2 p N o i s e p 2 p ,
The SAW group velocity was computed through the division of the specific distance between two neighbouring positions by the time interval of the detected energy peaks of the SAW, which represented as C R , provides insights into the mechanical characteristics of the material. An approximation can be made to establish a relationship between the C R and the tissue elasticity, which could be expressed as below [28,51]:
C R = 0.87 + 1.12 ν 1 + ν E 2 ρ 1 + ν ,
where ν denotes Poisson’s ratio, E represents Young’s modulus, and ρ is the mass density of the sample.
All scanning data from the PhS-OCT system were analysed by MATLAB (R2022b, The MathWorks, Inc., Natick, MA, USA).

3. Results

3.1. Data Analysis for Phantom Experiment

Before any exploration, the air-puff-stimulated SAW-OCE needs to verify the feasibility and reliability of the experiment by measuring the silicone phantom with tensile test as the golden standard. The tensile machine (Tinius Olsen H5KS material test machine) was employed for testing the silicone phantom. The comparison results are shown below in Table 1.
The bandwidth comparison in tissue-mimicking silicone phantom at the excitation position in different stimulated angles is shown in Figure 4.
In Figure 4, from 5° to 85°, the overall trend of the curve was characterised by a gradual decrease, the wave frequency bandwidth was 1747 Hz at 5°, and it decreased by 31.3% when the excitation angle was 85°. Notably, the excitation angle at 5° exhibits the widest bandwidth. After 70°, the bandwidth of the excitation position exhibits a steep and abrupt decline.
Utilizing tissue-mimicking silicone phantom as the sample, from 5° to 85°, the peak-to-peak SNR of the surface wave was computed based on the data analysis which is shown in Figure 5. Focusing on five selected angles for comparison, it was observed that the peak-to-peak SNR values at 5°, 25° and 45° did not show a significant difference during the wave propagating. However, the peak-to-peak SNR of excitation angle declined 48.6% from 5° to 85° excitation angle.

3.2. Data Analysis for In-Vivo Human Skin Experiment

Due to the diversity and variability of volunteers, the uneven nature of human hands and the movement during the scanning of humans, based on two scanning positions from healthy volunteers, three selected excitation angles (20°, 45° and 70° relative to the normal surface) were applied (Figure 6).
The bandwidth at excitation position comparison in human skin experiment is demonstrated in Figure 7 below.
The bandwidth at the excitation position exhibits a decreasing trend in the palm and the back of the hand with the excitation angle varies from 20° to 70°, Specifically, the SAW bandwidth of the palm decreased from 1112 Hz to 593 Hz (by 46.7%). Similarly, the SAW bandwidth of the back of the hand decreased from 1369 Hz to 1109 Hz (by 19%).
The scanning position from Figure 8A–C was on the back of the volunteer’s hand, and the scan position from Figure 8D–F was at the palm of the volunteer’s hand. The observation reveals that, at an angle of 20°, the wave exhibits a more extensive wave propagation with the slowest intensity attenuation. Conversely, at 70°, the wave experiences a shorter propagation distance and a faster intensity decay.
The peak-to-peak SNR comparison from the volunteer’s data of three selected angles (20°, 45° and 70° relative to the normal surface) is shown in Figure 9. Among the three different excitation angles, the wave generated at a smaller angle, such as 20° excitation angle, demonstrated a superior peak-to-peak SNR intensity with 27.03 dB and 20.52 dB for the back of the hand and palm separately.
In Figure 9, from 20° to 70° excitation angle at the palm, the peak-to-peak SNR was decreased by 25.4% at the excitation position and 27.4% as the wave propagates 2.3 mm. At the back of the hand, 6.7% and 21.7% of peak-to-peak SNR were declined at the excitation position and 2.3 mm position, separately.

3.3. Young’s Modulus Measurement of In-Vivo Human Skin

The combination of the air-puff system and PhS-OCT system has realised the advantages of a no-contact, non-invasive, easy-to-control and safe-to-human OCE technique to measure the Young’s modulus of human skin. The average group velocity of palm and back of the hand from 10 healthy volunteers were 7.23 m/s and 3.7 m/s, respectively.
In Table 2, the bulk Young’s modulus of the two scanning positions in human skin was calculated based on the group velocities with 20° excitation angle and also compared with the reference paper value for corroboration. 0.45 and 1060 k g / m 3 were assumed as the value of Poisson’s ratio and density for the palm and back of the hand in this research [16].

4. Discussion

In this paper, the optimal excitation angle of air-puff was evaluated by comparing the bandwidth at the excitation position and peak-to-peak SNR of SAWs. The SAWs were stimulated by excitation angles from 5° to 85° with an interval of 5° on a silicone phantom then applied three selected angles on in-vivo human skin.
By analysing Figure 4, a reduction was indicated in the bandwidth of the SAWs at the excitation positions, resulting in the information on the superficial layer could not be detected [19]. In comparison between excitation angles 5° and 85° relative to the normal surface, the airstream generated at a 5° angle was easier to focus on and produced a more intense SAW, which resulted in the stimulated SAW containing a wider frequency component range. Conversely, a larger excitation angle with respect to the normal surface (85°) was easier to diverge for the airstream and thus the wave frequency bandwidth contained fewer frequency components. By comparing the wave frequency bandwidth at the excitation position, a smaller excitation angle, such as 5° is the optimal excitation angle to produce SAW containing more frequency components. Other research has applied 0°, but their experiments did not involve and investigate the information about the excitation position, therefore, 0° was not included in this study. Moreover, the laser would be blocked and the information of bandwidth at the excitation position cannot be explored if 0° applied as the excitation angle.
In Figure 5, as the signal intensity of the wave decreased with the SAW propagation due to environmental background noise, a cut-off noise threshold was needed to be calculated to distinguish between the main wave and the noise.
For the in-vivo human skin study, the volunteers’ bandwidth comparison at excitation angle (Figure 7) demonstrated the same decreasing trend as Figure 4, illustrating a smaller excitation angle could produce SAWs with broader bandwidth. The SAWs with higher SNR could lead to a more precise evaluation of the group velocity [23], also, Young’s modulus of the sample could be estimated accurately. Regarding the peak-to-peak SNR analysis in Figure 8 and Figure 9, SAWs induced by 70° air-puff stimulation had a lower peak-to-peak SNR. This posed a disadvantageous scenario for subsequent Young’s modulus estimation. Therefore, insufficient wave peak-to-peak SNR will potentially lead to substantial errors in calculating the group velocity.
The Young’s modulus calculation in in-vivo human skin at different excitation angles obtained similar results for both scanning positions. However, the standard deviation tended to be larger at 70°. This was attributed to the low peak-to-peak SNR of SAWs at this angle. This might result in errors when extracting SAWs and calculating group velocity, leading to less accurate results. Results of 20° as the external excitation angle in human skin experiment were obtained (Table 2). To validate the accuracy of the results, the values of the Young’s modulus at palm and back of hand were compared with the literature value. The value of the Young’s modulus derived by Zhou et al. was based on the weighted average of the phase velocities for different layers thickness [18]. Zhang et al. estimated the Young’s modulus from the wave speed [52]. The ultrasound method was employed in the research of Wakhlu et al. for elastography investigation [2]. By comparing the results in Table 2, the values of this research were on the same order of magnitude as the reference values in the literature. The standard deviation of silicone phantom (Table 1) was small (1.35 kPa) but the discrepancies in human skin experiments (Table 2) was high (42 kPa for the palm and 22 kPa for the back of the hand). However, it was a possibility that the differences in the values are related to a variety of factors such as the age of the volunteers, the direction of the experimental measurements, individual differences in skin layer structure, gender of volunteers, hydrated or dehydrated skin and other possible factors [18,53,54,55]. The Young’s modulus of skin would increase as the water content of the stratum corneum decreases and with the ageing of volunteers [53,55]. In the future, increasing the number of volunteers to increase sample numbers will be considered. Also, the phase velocity dispersion curve will be obtained for calculating Young’s modulus for different layers of human skin.

5. Conclusions

The selection of the optimum excitation angle is crucial to obtain more detailed information about the surface of the sample. The optical excitation angle was found through the experiment on tissue-mimicking silicone phantoms and in-vivo human skin. The results demonstrated that small angles relative to normal surface, such as 5° included more frequency components which could obtain information from superficial layers to deeper layers, meanwhile, the wave can propagate farther with a high peak-to-peak SNR intensity value. By optimising the excitation angle, the ability to gain a more comprehensive understanding of the biomechanical properties of the tissue surface is critical to further research in dermatology, ophthalmology and so forth.

Author Contributions

Methodology, Z.F., W.J. and C.L.; software, Z.F. and Y.Z.; validation, Z.F. and W.W.; formal analysis, Z.F.; investigation, Z.F., W.J. and W.W.; resources, C.L.; writing—original draft preparation, Z.F.; writing—review and editing, Z.F., Y.Z. and C.L.; visualization, Z.F.; supervision, C.L. and Z.H.; project administration, Z.F., C.L. and Z.H.; funding acquisition, C.L. and Z.H. All authors have read and agreed to the published version of the manuscript.

Funding

This research received no external funding.

Institutional Review Board Statement

The study was conducted in accordance with the Declaration of Helsinki, and approved by the Institutional Review Board (or Ethics Committee) of the School of Science and Engineering Research Ethics Committee of the University of Dundee (Application Number: UOD-SSREC-RPG-BioEng-2022-002 and date of approval: 19/04/2023).

Informed Consent Statement

Informed consent was obtained from all subjects involved in the study. Written informed consent has been obtained from the patient(s) to publish this paper.

Data Availability Statement

The data presented in this study are available on request from the corresponding author. Due to ethical restrictions reasons, the data are not accessed publicly.

Conflicts of Interest

The authors declare no conflicts of interest.

References

  1. Wu, H.; Liang, W.; Jiao, Y.; Song, H.; Peng, Q.; Luo, H.; Zhang, Y.; Xu, J.; Dong, F. A Preliminary Comparative Study of Young’s Modulus Versus Shear Modulus in the Diagnosis of Breast Cancer. Ultrasound Q. 2019, 35, 88–92. [Google Scholar] [CrossRef] [PubMed]
  2. Wakhlu, A.; Chowdhury, A.; Mohindra, N.; Tripathy, S.; Misra, D.; Agarwal, V. Assessment of extent of skin involvement in scleroderma using shear wave elastography. Indian J. Rheumatol. 2017, 12, 194. [Google Scholar]
  3. Cummins, D.L.; Cummins, J.M.; Pantle, H.; Silverman, M.A.; Leonard, A.L.; Chanmugam, A. Cutaneous Malignant Melanoma. Mayo Clin. Proc. 2006, 81, 500–507. [Google Scholar] [CrossRef]
  4. Song, S.; Huang, Z.; Nguyen, T.-M.; Wong, E.Y.; Arnal, B.; O’Donnell, M.; Wang, R.K. Shear modulus imaging by direct visualization of propagating shear waves with phase-sensitive optical coherence tomography. J. Biomed. Opt. 2013, 18, 121509. [Google Scholar] [CrossRef] [PubMed]
  5. Srivastava, A.; Verma, Y.; Rao, K.D.; Gupta, P.K. Determination of Elastic Properties of Resected Human Breast Tissue Samples Using Optical Coherence Tomographic Elastography: Elastic Properties of Breast Tissues. Strain 2011, 47, 75–87. [Google Scholar] [CrossRef]
  6. Schmitt, J.M. OCT elastography: Imaging microscopic deformation and strain of tissue. Opt. Express. 1998, 3, 199. [Google Scholar] [CrossRef] [PubMed]
  7. Singh, M.; Han, Z.; Li, J.; Vantipalli, S.; Aglyamov, S.R.; Twa, M.D.; Larin, K.V. Quantifying the effects of hydration on corneal stiffness with noncontact optical coherence elastography. J. Cataract Refract. Surg. 2018, 44, 1023–1031. [Google Scholar] [CrossRef]
  8. Zhu, J.; He, X.; Chen, Z. Acoustic radiation force optical coherence elastography for elasticity assessment of soft tissues. Appl. Spectrosc. Rev. 2019, 54, 457–481. [Google Scholar] [CrossRef]
  9. Kennedy, K.M.; Ford, C.; Kennedy, B.F.; Bush, M.B.; Sampson, D.D. Analysis of mechanical contrast in optical coherence elastography. J. Biomed. Opt. 2013, 18, 121508. [Google Scholar] [CrossRef]
  10. Syed, S.H.; Larin, K.V.; Dickinson, M.E.; Larina, I.V. Optical coherence tomography for high-resolution imaging of mouse development in utero. J. Biomed. Opt. 2011, 16, 046004. [Google Scholar] [CrossRef]
  11. Jin, Z.; Chen, S.; Dai, Y.; Bao, C.; Ye, S.; Zhou, Y.; Wang, Y.; Huang, S.; Wang, Y.; Shen, M.; et al. In vivo noninvasive measurement of spatially resolved corneal elasticity in human eyes using Lamb wave optical coherence elastography. J. Biophotonics 2020, 13, e202000104. [Google Scholar] [CrossRef]
  12. Lan, G.; Aglyamov, S.R.; Larin, K.V.; Twa, M.D. In Vivo Human Corneal Shear-wave Optical Coherence Elastography. Optom. Vis. Sci. 2021, 98, 58–63. [Google Scholar] [CrossRef]
  13. Mulligan, J.A.; Untracht, G.R.; Chandrasekaran, S.N.; Brown, C.N.; Adie, S.G. Emerging Approaches for High-Resolution Imaging of Tissue Biomechanics With Optical Coherence Elastography. IEEE J. Sel. Top. Quantum Electron. 2016, 22, 246–265. [Google Scholar] [CrossRef]
  14. Popescu, D.P.; Choo-Smith, L.-P.; Flueraru, C.; Mao, Y.; Chang, S.; Disano, J.; Sherif, S.; Sowa, M.G. Optical coherence tomography: Fundamental principles, instrumental designs and biomedical applications. Biophys. Rev. 2011, 3, 155–169. [Google Scholar] [CrossRef] [PubMed]
  15. Kennedy, B.F.; Kennedy, K.M.; Sampson, D.D. A Review of Optical Coherence Elastography: Fundamentals, Techniques and Prospects. IEEE J. Sel. Top. Quantum Electron. 2014, 20, 272–288. [Google Scholar] [CrossRef]
  16. Li, C.; Guan, G.; Cheng, X.; Huang, Z.; Wang, R.K. Quantitative elastography provided by surface acoustic waves measured by phase-sensitive optical coherence tomography. Opt. Lett. 2012, 37, 722–724. [Google Scholar] [CrossRef]
  17. Wang, R.K.; Kirkpatrick, S.; Hinds, M. Phase-sensitive optical coherence elastography for mapping tissue microstrains in real time. Appl. Phys. Lett. 2007, 90, 164105. [Google Scholar] [CrossRef]
  18. Zhou, K.; Feng, K.; Li, C.; Huang, Z. A Weighted Average Phase Velocity Inversion Model for Depth-Resolved Elasticity Evaluation in Human Skin In-Vivo. IEEE Trans. Biomed. Eng. 2021, 68, 1969–1977. [Google Scholar] [CrossRef]
  19. Zhou, K.; Le, N.; Huang, Z.; Li, C. High-intensity-focused ultrasound and phase-sensitive optical coherence tomography for high resolution surface acoustic wave elastography. J. Biophotonics 2018, 11, e201700051. [Google Scholar] [CrossRef]
  20. Yang, C.; Xiang, Z.; Li, Z.; Nan, N.; Wang, X. Optical coherence elastography to evaluate depth-resolved elasticity of tissue. Opt. Express 2022, 30, 8709. [Google Scholar] [CrossRef]
  21. Liu, G.; Zhang, Y.; Wang, Y.; Ai, S.; Zhu, Y.; Shi, G.; Han, X.; Zhao, Y.; Yang, H.; He, X. Point-to-point optical coherence elastography using a novel phase velocity method. Opt. Lasers Eng. 2023, 163, 107489. [Google Scholar] [CrossRef]
  22. Singh, M.; Li, J.; Vantipalli, S.; Wang, S.; Han, Z.; Nair, A.; Aglyamov, S.R.; Twa, M.D.; Larin, K.V. Noncontact Elastic Wave Imaging Optical Coherence Elastography for Evaluating Changes in Corneal Elasticity Due to Crosslinking. IEEE J. Sel. Top. Quantum Electron. 2016, 22, 266–276. [Google Scholar] [CrossRef]
  23. Nguyen, T.M.; Arnal, B.; Song, S.; Huang, Z.; Wang, R.K.; O’Donnell, M. Shear wave elastography using amplitude-modulated acoustic radiation force and phase-sensitive optical coherence tomography. J. Biomed. Opt. 2015, 20, 16001. [Google Scholar] [CrossRef]
  24. Li, R.; Du, Z.; Qian, X.; Li, Y.; Martinez-Camarillo, J.-C.; Jiang, L.; Humayun, M.S.; Chen, Z.; Zhou, Q. High resolution optical coherence elastography of retina under prosthetic electrode. Quant. Imaging Med. Surg. 2020, 11, 918–927. [Google Scholar] [CrossRef]
  25. Kennedy, B.F.; Hillman, T.R.; McLaughlin, R.A.; Quirk, B.C.; Sampson, D.D. In vivo dynamic optical coherence elastography using a ring actuator. Opt. Express 2009, 17, 21762–21772. [Google Scholar] [CrossRef]
  26. Liu, C.H.; Nevozhay, D.; Schill, A.; Singh, M.; Das, S.; Nair, A.; Han, Z.; Aglyamov, S.; Larin, K.V.; Sokolov, K.V. Nanobomb optical coherence elastography. Opt. Lett. 2018, 43, 2006. [Google Scholar] [CrossRef]
  27. Razani, M.; Mariampillai, A.; Sun, C.; Luk, T.W.H.; Yang, V.X.D.; Kolios, M.C. Feasibility of optical coherence elastography measurements of shear wave propagation in homogeneous tissue equivalent phantoms. Biomed. Opt. Express 2012, 3, 972–980. [Google Scholar] [CrossRef]
  28. Wang, S.; Larin, K.V.; Li, J.; Vantipalli, S.; Manapuram, R.K.; Aglyamov, S.; Emelianov, S.; Twa, M.D. A focused air-pulse system for optical-coherence-tomography-based measurements of tissue elasticity. Laser Phys. Lett. 2013, 10, 075605. [Google Scholar] [CrossRef] [PubMed]
  29. Wang, S.; Li, J.; Manapuram, R.K.; Menodiado, F.M.; Ingram, D.R.; Twa, M.D.; Lazar, A.J.; Lev, D.C.; Pollock, R.E.; Larin, K.V. Noncontact measurement of elasticity for the detection of soft-tissue tumors using phase-sensitive optical coherence tomography combined with a focused air-puff system. Opt Lett. 2012, 37, 5184–5186. [Google Scholar] [CrossRef] [PubMed]
  30. Larin, K.V.; Sampson, D.D. Optical coherence elastography—OCT at work in tissue biomechanics [Invited]. Biomed. Opt. Express 2017, 8, 1172–1202. [Google Scholar] [CrossRef] [PubMed]
  31. Kirby, M.A.; Pelivanov, I.; Song, S.; Ambrozinski, Ł.; Yoon, S.J.; Gao, L.; Li, D.; Shen, T.T.; Wang, R.K.; O’donnell, M. Optical coherence elastography in ophthalmology. J. Biomed. Opt. 2017, 22, 121720–121728. [Google Scholar] [CrossRef] [PubMed]
  32. Zaitsev, V.Y.; Matveyev, A.L.; Matveev, L.A.; Sovetsky, A.A.; Hepburn, M.S.; Mowla, A.; Kennedy, B.F. Strain and elasticity imaging in compression optical coherence elastography: The two-decade perspective and recent advances. J. Biophotonics 2021, 14, e202000257. [Google Scholar] [CrossRef]
  33. Li, C.; Song, S.; Guan, G.; Wang, R.K.; Huang, Z. Frequency dependence of laser ultrasonic SAW phase velocities measurements. Ultrasonics 2013, 53, 191–195. [Google Scholar] [CrossRef] [PubMed]
  34. Wang, S.; Larin, K.V. Noncontact depth-resolved micro-scale optical coherence elastography of the cornea. Biomed. Opt. Express 2014, 5, 3807–3821. [Google Scholar] [CrossRef] [PubMed]
  35. Han, Z.; Li, J.; Singh, M.; Wu, C.; Liu, C.-H.; Wang, S.; Idugboe, R.; Raghunathan, R.; Sudheendran, N.; Aglyamov, S.R.; et al. Quantitative methods for reconstructing tissue biomechanical properties in optical coherence elastography: A comparison study. Phys. Med. Biol. 2015, 60, 3531–3547. [Google Scholar] [CrossRef]
  36. Han, Z.; Singh, M.; Aglyamov, S.R.; Liu, C.H.; Nair, A.; Raghunathan, R.; Wu, C.; Li, J.; Larin, K.V. Quantifying tissue viscoelasticity using optical coherence elastography and the Rayleigh wave model. J. Biomed. Opt. 2016, 21, 090504. [Google Scholar] [CrossRef]
  37. Vekilov, D.P.; Singh, M.; Aglyamov, S.R.; Larin, K.V.; Grande-Allen, K.J. Mapping the spatial variation of mitral valve elastic properties using air-pulse optical coherence elastography. J. Biomech. 2019, 93, 52–59. [Google Scholar] [CrossRef]
  38. Curatolo, A.; Birkenfeld, J.S.; Martinez-Enriquez, E.; Germann, J.A.; Muralidharan, G.; Palací, J.; Pascual, D.; Eliasy, A.; Abass, A.; Solarski, J.; et al. Multi-meridian corneal imaging of air-puff induced deformation for improved detection of biomechanical abnormalities. Biomed. Opt. Express 2020, 11, 6337–6355. [Google Scholar] [CrossRef]
  39. Hashimoto, I. Trigeminal evoked potentials following brief air puff: Enhanced signal-to-noise ratio. Ann. Neurol. 1988, 23, 332–338. [Google Scholar] [CrossRef]
  40. Zhang, Y.; Zhou, K.; Feng, Z.; Feng, K.; Ji, Y.; Li, C.; Huang, Z. Viscoelastic properties’ characterization of corneal stromal models using non-contact surface acoustic wave optical coherence elastography (SAW-OCE). J. Biophotonics 2022, 15, e202100253. [Google Scholar] [CrossRef]
  41. Lan, G.; Gu, B.; Larin, K.V.; Twa, M.D. Clinical Corneal Optical Coherence Elastography Measurement Precision: Effect of Heartbeat and Respiration. Transl. Vis. Sci. Technol. 2020, 9, 3. [Google Scholar] [CrossRef]
  42. Lan, G.; Singh, M.; Larin, K.V.; Twa, M.D. Common-path phase-sensitive optical coherence tomography provides enhanced phase stability and detection sensitivity for dynamic elastography. Biomed. Opt. Express 2017, 8, 5253–5266. [Google Scholar] [CrossRef]
  43. Zvietcovich, F.; Singh, M.; Ambekar, Y.S.; Aglyamov, S.R.; Twa, M.D.; Larin, K.V. Micro Air-Pulse Spatial Deformation Spreading Characterizes Degree of Anisotropy in Tissues. IEEE J. Sel. Top. Quantum Electron. 2021, 27, 6800810. [Google Scholar] [CrossRef]
  44. Jiménez-villar, A.; Mączyńska, E.; Cichański, A.; Wojtkowski, M.; Kałużny, B.J.; Grulkowski, I. High-speed OCT-based ocular biometer combined with an air-puff system for determination of induced retraction-free eye dynamics. Biomed. Opt. Express 2019, 10, 3663–3680. [Google Scholar] [CrossRef] [PubMed]
  45. Han, Z.; Aglyamov, S.R.; Li, J.; Singh, M.; Wang, S.; Vantipalli, S.; Wu, C.; Liu, C.H.; Twa, M.D.; Larin, K.V. Quantitative assessment of corneal viscoelasticity using optical coherence elastography and a modified Rayleigh–Lamb equation. J. Biomed. Opt. 2015, 20, 020501. [Google Scholar] [CrossRef] [PubMed]
  46. Li, J.; Wang, S.; Singh, M.; Aglyamov, S.; Emelianov, S.; Twa, M.D.; Larin, K.V. Air-pulse OCE for assessment of age-related changes in mouse cornea in vivo. Laser Phys. Lett. 2014, 11, 065601. [Google Scholar] [CrossRef]
  47. Li, J.; Wang, S.; Manapuram, R.K.; Singh, M.; Menodiado, F.M.; Aglyamov, S.; Emelianov, S.; Twa, M.D.; Larin, K.V. Dynamic optical coherence tomography measurements of elastic wave propagation in tissue-mimicking phantoms and mouse cornea in vivo. J. Biomed. Opt. 2013, 18, 121503. [Google Scholar] [CrossRef] [PubMed]
  48. Wu, C.; Singh, M.; Liu, C.-H.; Han, Z.; Li, J.; Raghunathan, R.; Larin, K.V. Assessing the changes in the biomechanical properties of the crystalline lens induced by cold cataract with air-pulse OCE. In Proceedings of the 5th International Scientific Conference New Operational Technologies, Tomsk, Russia, 21–25 September 2015; p. 020003. Available online: https://pubs.aip.org/aip/acp/article/805544 (accessed on 6 March 2024).
  49. Singh, M.; Wu, C.; Liu, C.-H.; Li, J.; Schill, A.; Nair, A.; Larin, K.V. Phase-sensitive optical coherence elastography at 15 million A-Lines per second. Opt. Lett. 2015, 40, 2588–2591. [Google Scholar] [CrossRef] [PubMed]
  50. Wang, R.K.; Nuttall, A.L. Phase-sensitive optical coherence tomography imaging of the tissue motion within the organ of Corti at a subnanometer scale: A preliminary study. J. Biomed. Opt. 2010, 15, 056005. [Google Scholar] [CrossRef] [PubMed]
  51. James, F.D. Wave Propagation in Structures: Spectral Analysis Using Fast Discrete Fourier Transforms; Springer: New York, NY, USA, 1997. [Google Scholar]
  52. Zhang, X.; Osborn, T.G.; Pittelkow, M.R.; Qiang, B.; Kinnick, R.R.; Greenleaf, J.F. Quantitative assessment of scleroderma by surface wave technique. Med. Eng. Phys. 2011, 33, 31–37. [Google Scholar] [CrossRef]
  53. Zhao, Y.; Feng, B.; Lee, J.; Lu, N.; Pierce, D.M. A multi-layered model of human skin elucidates mechanisms of wrinkling in the forehead. J. Mech. Behav. Biomed. Mater. 2020, 105, 103694. [Google Scholar] [CrossRef] [PubMed]
  54. Frier, W.; Abdouni, A.; Pittera, D.; Georgiou, O.; Malkin, R. Simulating Airborne Ultrasound Vibrations in Human Skin for Haptic Applications. IEEE Access 2022, 10, 15443–15456. [Google Scholar] [CrossRef]
  55. Hara, Y.; Masuda, Y.; Hirao, T.; Yoshikawa, N. The relationship between the Young’s modulus of the stratum corneum and age: A pilot study. Skin Res. Technol. 2013, 19, 339–345. [Google Scholar] [CrossRef] [PubMed]
Figure 1. Schematic diagram of PhS-OCT system with air-puff system. NI, National Instrument; DAQ, data acquisition; PhS-OCT, phase-sensitive optical coherence tomography SAW detection system.
Photonics 11 00254 g001
Figure 2. Illustration of air-puff-stimulated SAW-OCE imaging scanning protocol.
Photonics 11 00254 g002
Figure 3. Timing schematic of air-puff-stimulated SAW-OCE imaging scanning protocol.
Photonics 11 00254 g003
Figure 4. Bandwidth comparison at excitation position from 5° to 85° with an interval of 5° applied on silicone phantom.
Photonics 11 00254 g004
Figure 5. Peak-to-peak SNR comparison from 5° to 85° with an interval of 20° applied on silicone phantom.
Photonics 11 00254 g005
Figure 6. Experiment set-up for: (A) silicone phantom experiment; (B) human-skin experiment (the excitation angles were labelled with θ1 = 5°, θ2 = 20°).
Photonics 11 00254 g006
Figure 7. All volunteers’ bandwidth comparison at excitation position for 20°, 45° and 70° angles on palm and back of hand.
Photonics 11 00254 g007
Figure 8. A representative SAW propagation from a healthy volunteer’s skin sites of back of hand and palm, with three selected excitation angles. Back of hand: (A) 20°; (B) 45°; (C) 70°; Palm: (D) 20°; (E) 45°; (F) 70°.
Photonics 11 00254 g008
Figure 9. Peak-to-peak SNR comparison from a healthy volunteer’s skin sites of back of hand and palm, with three selected excitation angles of 20°, 45° and 70°.
Photonics 11 00254 g009
Table 1. Comparison of Young’s modulus of silicone phantom obtained from tensile test and air-puff-stimulated SAW-OCE.
MethodYoung’s Modulus (kPa)
Tensile Test81.35 ± 2.14
Air-puff-stimulated SAW-OCE83.65 ± 1.35
Table 2. The comparison of bulk Young’s modulus in this research and in the literature.
Palm
ResearchNumbers of subjectsAge rangeYoung’s modulus (kPa)MethodStimulation System
This research1021–30164 ± 42SAW-OCEAir-puff
Zhou [18]1122–36212 ± 78Depth-resolved SAW-OCEPiezoelectric actuator
Zhang [52]3046–61108 ± 48SAW elastographyMechanical shaker
Back of hand
ResearchNumbers of subjectsAge rangeYoung’s modulus (kPa)MethodStimulation System
This research1021–3041 ± 22SAW-OCEAir-puff
Zhou [18]1122–3629 ± 8Depth-resolved SAW-OCEPiezoelectric actuator
Wakhlu [2]1629–5311–23Ultrasound elastographyMechanical shaker
Disclaimer/Publisher’s Note: The statements, opinions and data contained in all publications are solely those of the individual author(s) and contributor(s) and not of MDPI and/or the editor(s). MDPI and/or the editor(s) disclaim responsibility for any injury to people or property resulting from any ideas, methods, instructions or products referred to in the content.

