1. Introduction
Gas pressure sensing is a high-demand application of optical fiber sensors in the industrial and environmental monitoring fields [
1,
2]. There has been an increase in interest in their research due to the devices’ compact size, high sensitivity, and electromagnetic interference immunity [
3].
Different configurations have been employed for pressure sensing applications, including fiber gratings and interferometers like Mach–Zehnder (MZI), Sagnac (SI), and Fabry–Perot (FPI). Pressure sensors based on fiber gratings generally present low sensitivities [
4], while MZI- [
5] and SI-based [
6] sensors require complex manufacturing operations. The mechanism of a diaphragm-based pressure sensor is based on variations of the cavity length, whereas for open cavities, it relies on variations of the refractive index (RI). Fiber-tip FPIs based on diaphragms possess limited durability and operation stability due to the creep behavior of the thin diaphragm structure [
2], only operating in limited gas-pressure ranges [
7]. The mechanical deformations of the diaphragm hinder the general linearity, repeatability, and resilience of the sensors [
7]. Therefore, a diaphragm-free pressure sensor is desirable.
Sensors based on open cavities, which are therefore diaphragm-free, have been developed, including FPI-based [
7,
8] and antiresonant (AR)-based [
1,
3] sensors. These pressure sensors have extended measurement ranges owing to their different principle of operation, which is rooted in the relationship between the gas pressure and the RI variation [
8]. Nevertheless, this principle is also affected by temperature, decreasing the gas-pressure sensitivity of FPI- and AR-based sensors with increasing temperatures. Therefore, temperature compensation is required when measuring gas pressure [
2].
The miniaturization of optical sensors has also brought about photonic integrated circuits, more specifically, micro-ring resonators. This technology has showcased a very high sensitivity to pressure and temperature: 2.77 nm/GPa in a pressure range of 0–10 GPa [
9] and 49.77 nm/MPa in a range of 3–9 MPa [
10], and 2.9 nm/°C in a range of 0–50 °C [
11]. Their low power requirements and fast response to environmental changes places them as highly competitive sensing technologies. However, they have complex fabrication processes, with a relatively high cost, delicate nature, and challenging optical alignment and provide inaccurate measurements for extreme pressure and temperature.
To compensate for cross-sensitivity issues verified in conventional optical fiber sensors, another cascaded sensor can be added, increasing the system complexity and total sensing length. Alternatively, by adopting a hybrid sensor where, in a single structure, the independent and simultaneous measurement of multiple parameters can be made, the fiber sensor thus presents a simpler configuration, working principle, and fabrication technique, overall miniaturizing the sensor [
12].
Hybrid sensors have been investigated for multi-parameter measurements using cascaded fiber Bragg gratings and dual-cavity FPIs [
3,
13]. With a sensor based on FPI and AR mechanisms in a sandwich structure made of a single mode fiber (SMF) and a silica capillary tube (SCT–SMF), dual-parameter measurements in a single cavity can be achieved [
2].
The microchannels that act as an open cavity for pressure sensing in previous studies have often been fabricated by expensive equipment, such as femtosecond laser micromachining [
1,
2]. Using this technique, Hou et al. attained a gas-pressure AR-based sensor [
1], while Gao et al. achieved a hybrid sensor for self-temperature-calibrated gas-pressure detection [
2]. Other techniques include using C-shaped fibers, butt-coupling [
14], as well as focused ion beam milling [
15]. Furthermore, Yang et al. fabricated open-air cavities with a clever method by fusion splicing an SMF with an SCT [
3]. Additionally, He et al. developed a hybrid sensor for pressure and temperature measurements by splicing an SCT between an SMF and another SCT with a smaller inner diameter [
16]. A different method for a lateral access hole through the fiber wall in photonic crystal fibers (PCFs) was demonstrated that utilized a fusion splicer and application of pressure, though great deformation was introduced around the hole [
17]. As such, it is desired to apply the innovative low-cost side hole method in a capillary-based fiber for pressure detection as it is able to achieve an open cavity without resorting to expensive equipment or cascading another capillary.
In this article, a diaphragm-free hybrid fiber sensor for the simultaneous measurement of pressure and temperature based on an SCT with access channels is proposed. The sensor is composed of a section of SCT spliced between two fibers, creating two interferometers that occur simultaneously: FPI and AR guidance. The access channels were fabricated via two methods, acting as a micro gas inlet. The bubble-based method was found to have higher visibility in the FPI and AR spectra than the thin-core SCT method, while granting the sensor greater versatility. The interferometric phenomena allowed the discrimination of the parameters under study.
2. Operation Principle
The configuration of the proposed hybrid fiber sensor is based on a sandwich structure where a section of an SCT is spliced between two fibers. This SCT was fabricated at the Leibniz Institute of Photonic Technology, in Jena, Germany. Considering an SMF–SCT–SMF configuration, the SCT has an inner diameter, 2
r, of 57 ± 2 μm and an outer diameter of ~125 µm, as seen in
Figure 1a. The SCT length and cladding thickness are denoted as
L and
d, respectively. The RIs of the silica cladding and hollow core are denoted as
and
, respectively, while the RIs of the SMF core and cladding are designated as
and
, respectively. At 1550 nm, the RIs are approximately
[
2,
18].
FP interferometry occurs when two high-reflectance parallel surfaces are placed a certain distance,
L, from one another, resulting in a multiple reflection mechanism. For the configuration used, the interfaces correspond to the
M1 and
M2 mirrors in the capillary and the FPI is formed along the axial direction. The peak wavelength of the FPI is expressed as [
2]:
where
m is a positive integer that corresponds to the resonance order. Its free spectral range (FSR) is given by:
For a certain capillary length above a certain critical value,
Lc [
19], due to a lower RI of the core compared to the cladding RI, the AR reflecting optical waveguide mechanism is verified wherein light is coupled into the cladding, forming an FP cavity defined by the
M3 and
M4 interfaces along the radial direction [
20]. For the AR wavelengths, i.e., wavelengths that do not satisfy the resonant condition, destructive interference occurs, and light will be reflected within the resonator, refracted back and fully confined in the capillary core. However, for resonant wavelengths, constructive interference will take place, meaning that the FP resonator is highly transparent for these wavelengths and light does not reflect in the air–silica interface. Instead, it will escape the resonator and leak out from the cladding to the outside of the fiber, as shown in
Figure 1b, resulting in a low transmission intensity part of the spectrum [
21].
The lossy dip occurs when the wavelength meets the resonant condition of the cladding, expressed as [
1]:
where
m is the resonance order. Its FSR is given by:
The FPI pressure sensitivity can be derived from (1) as:
The pressure sensitivity of the AR component of this sensor is an accumulation of three factor contributions: (i) the RI variation in the hollow core,
, (ii) the structural deformation of the silica cladding,
, and (iii) the RI change of the silica cladding as a result of the deformation in (ii) due to the strain-optic effect,
. The AR pressure sensitivity, derived from (3), is given by:
The RI of air depends on pressure (
P) and temperature (
T) according to Édlen’s equation as a first approximation [
1]:
Therefore, an increase in pressure results in an increase in . Considering nm and a temperature of 25 °C, the first term of (5) results in a sensitivity of the FPI of 4.089 nm/MPa. Similarly, the value of , considering nm, was obtained as −3.78 nm/MPa.
Concerning the values of
and
, it is required to calculate the structural deformation and strain distributions over the silica cladding. Assuming a single layer model with an inner and outer radius,
and
, one can analyze the elasticity of the SCT. Across the cladding region, the stress expression can be written as [
1]:
where
A,
C, and
D are constants. The strain tensor for the silica cladding can, therefore, be obtained by substituting (8) into the Hooke’s law, obtaining [
22]:
where
and
are Young’s modulus and the Poisson’s ratio of fused silica, which correspond to 73 GPa and 0.17 arb. un., respectively [
23]. Generically, the pressure in the outer cladding corresponds to
, while the pressure at the inner cladding is
. The boundary conditions are, thereby, given by:
where the values of
and
of the SCT used in this work are 34 μm and 62.5 μm, respectively. These conditions are a consequence of the sensor being fixed at both ends, nullifying the effect of the pressure applied from the two ends of the sensor, which results in a minimal pressure-induced longitudinal strain,
[
1]. Therefore, the constant values are:
Considering the closed sensor configuration,
and
; whereas, for open sensors
and
, as depicted in
Figure 2. The pressure effect in the hole is not considered for this study.
The stress and strain distributions on the silica cladding can, then, be obtained for both configurations. In
Figure 3a, the radial and azimuthal strain distributions for the cladding region,
and
, respectively, are plotted for an applied pressure of 0.4 MPa. Similarly, in
Figure 3b, the radial displacement,
, of the cladding region is plotted for an applied pressure of 0.4 MPa.
Greater strain can be observed in open sensors, although in both configurations, the shift is positive in azimuthal strain and negative in radial strain, increasing towards the inner cladding. The maximum displacement of open sensors is 0.73 nm, while for closed ones, it is 0.54 nm, displaying greater displacement near the outer cladding.
The RI variation that is consequential from the strain-optic effect of the aforementioned displacement can be obtained as:
where
and
are the strain-optic tensors for fused silica, corresponding to 0.121 and 0.27, respectively [
24]. The RI variation given in
Figure 3c reveals that the longitudinal component does not vary across the cladding region and that the azimuthal strain pertains to a low shift. The radial RI change is the most significant out of the three components for this configuration, with the highest value at the inner cladding of −8.55 × 10
−6 RIU for open sensors and −5.89 × 10
−6 RIU for closed sensors.
The final pressure sensitivity of the AR component for an open sensor with one access channel can, finally, be calculated by substituting the acquired values into (6). When the pressure level is raised to 0.4 MPa, considering again that , is ~0.0846 nm/MPa and is approximately −0.0447 nm/MPa. The total value of for this configuration is, therefore, approximately −3.74 nm/MPa.
In closed sensors, the core RI will remain constant considering that there is no gas inlet in the fiber, meaning pressure inside the air cavity will not vary. The value of in this configuration is ~0.0621 nm/MPa and the value of is approximately −0.0308 nm/MPa, for a total value of of ~0.0313 nm/MPa.
As a response to an applied temperature rise, materials suffer an expansion, given by the thermal expansion coefficient (TEC), and a RI variation, given by the thermo-optic coefficient (TOC). For silica, these coefficients are ~5.56 × 10
−7/°C and ~8.6 × 10
−6/°C, respectively [
25]. On the other hand, the FPI cavity is made of air, whose RI practically does not vary with temperature. Therefore, the FPI sensitivity to temperature is expected to be low. Given that in (3), there is a dependence on
and
, not only is the AR sensitivity positive, but it is also much greater than the FPI sensitivity.
where
and
are the silica’s TEC and TOC, respectively. Considering
nm and
nm, values of ~0.86 pm/°C and ~26.7 pm/°C were respectively obtained for FPI and AR.
3. Materials and Methods
Two configurations were developed depending on the access channel method. Generally, a sandwich configuration was employed where a section of the SCT was spliced between two fibers. The splices were performed in the manual mode of the Fujikura FMS-40S fusion splicer with a power of 15 bits (arbitrary unit) and an arc time of 500 ms whilst applying an offset in order not to compromise the capillary. Note that the parameters in the automatic mode are 20 bits and 2000 ms, respectively.
In an effort to grant the sensor responsiveness to pressure, access channels were instilled in the fiber that allow gas entrance through the channel into the structure. This was developed in two distinctive manners.
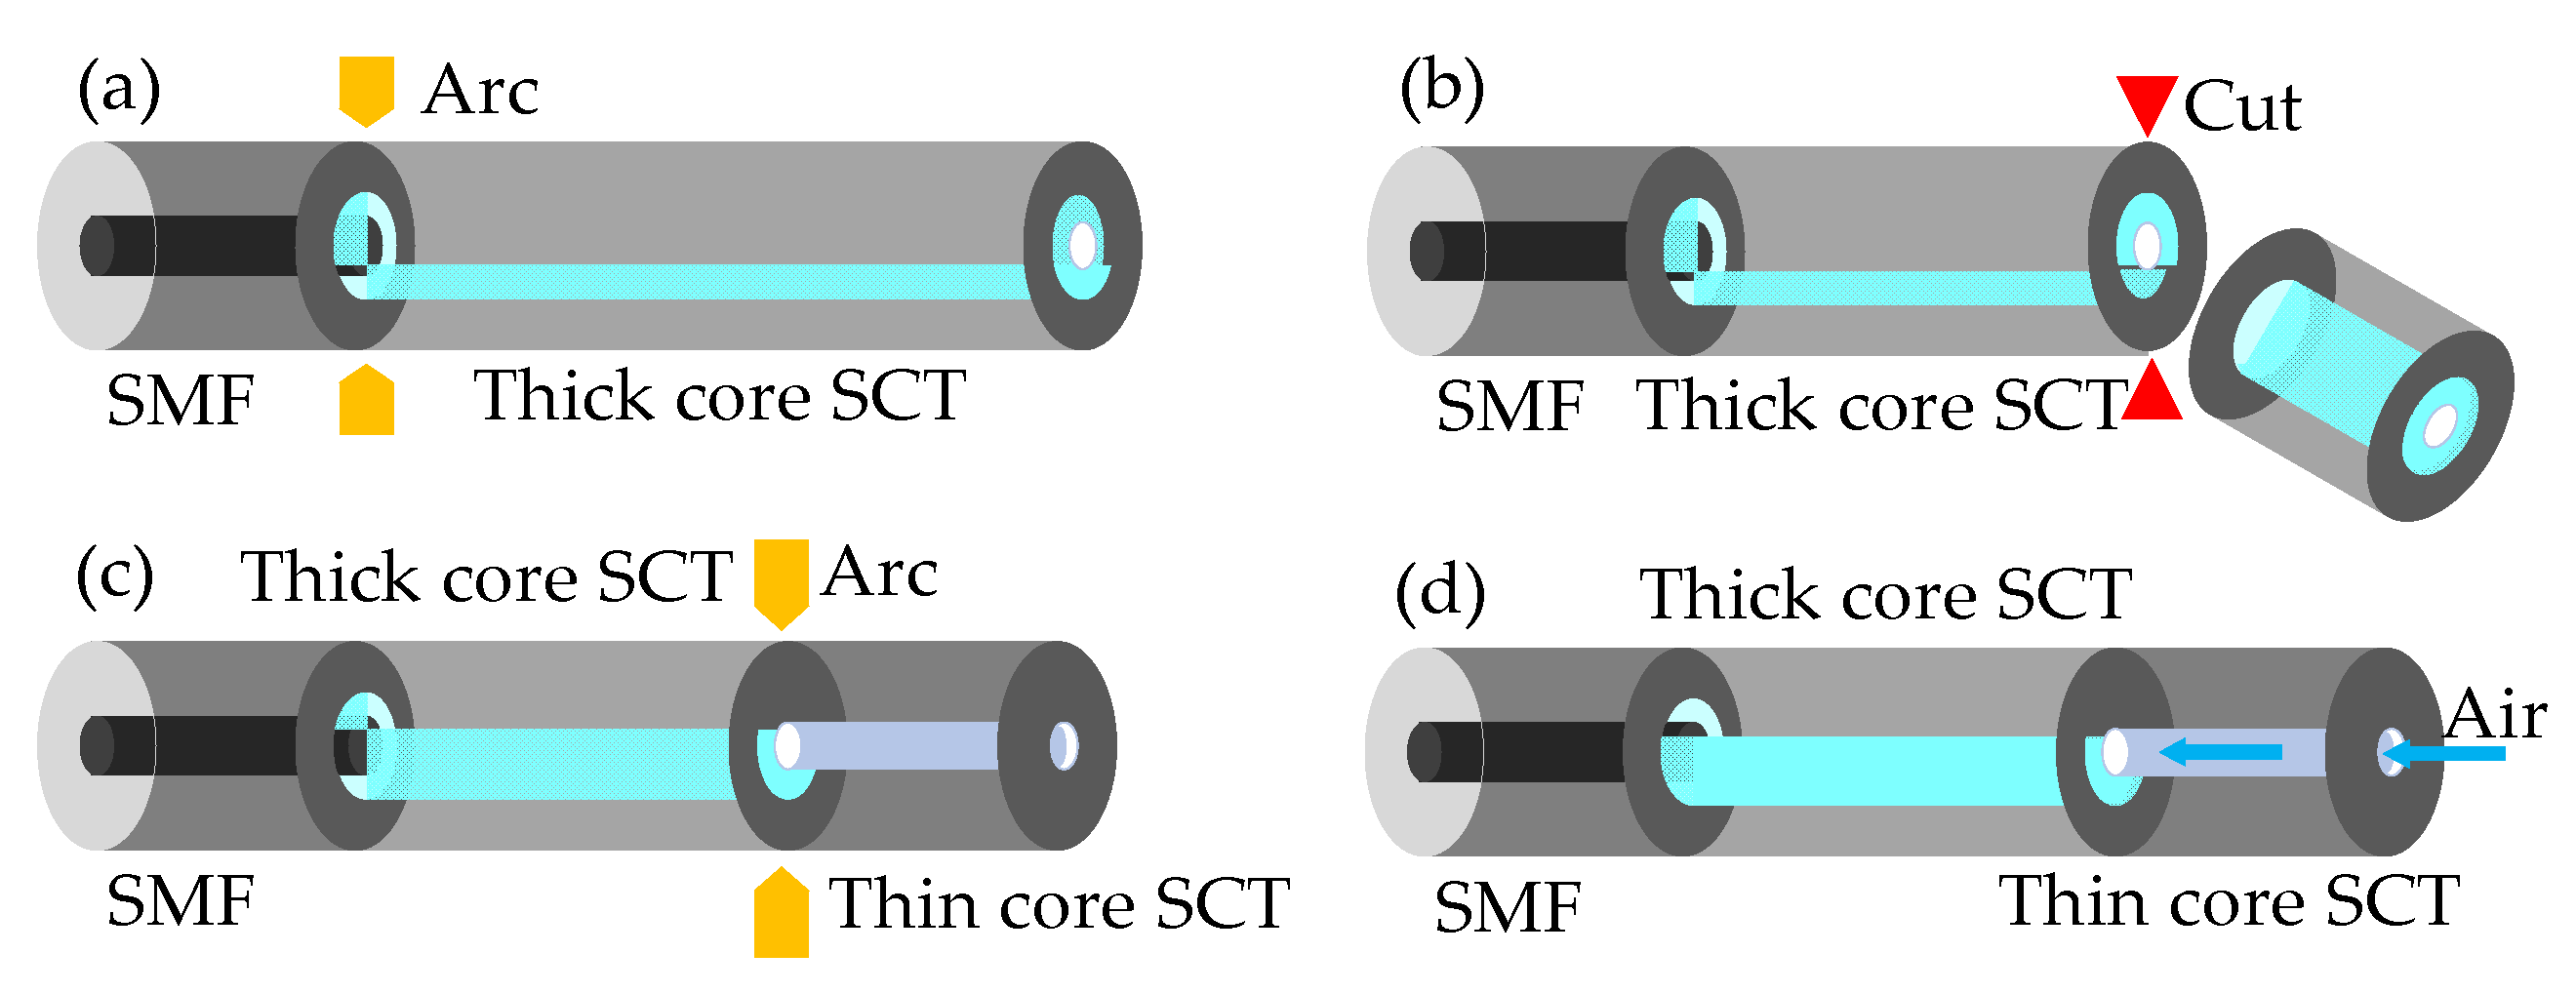
One method involved splicing the SCT between an SMF (Corning, SMF-28) and another capillary of a different inner diameter, as shown in
Figure 4a–d. Hence, the access channel is located on the free end of the second capillary in its hollow core. For clarity, the sensing head will hereafter be denominated as the thick-core SCT, whereas the second capillary will be denoted as the thin-core SCT or simply the capillary, when referring to the access method. The thin-core SCT used for this work has a diameter of ~20 μm. This small inner diameter was chosen so that it does not interfere with the mirror defined by the interface between the SCTs, while being sufficiently large to avoid collapse during fusion splicing. The diameter of the thick-core SCT was chosen as a compromise between the size of the core and the thickness of the cladding. Firstly, the large size of the core aims for greater interactions between the propagating light and the air molecules for pressure detection. Secondly, the thickness of the capillary is also relevant for the excitement of AR guidance [
16], thus fulfilling the hybrid role of the sensor.
The other method is the instillment of a bubble in the SCT. For this method, the sensing head was spliced between two SMFs, as shown in
Figure 5. This bubble is an air cavity that is achieved in the fusion splicer by performing several successive arcs on the capillary whilst under pressure. For this purpose, the parameters used in the manual mode were a power of 20 bits with a first arc of 1300 ms and re-arcs of 700 ms, under a pressure of approximately 270 mbar. These parameters were chosen empirically and established through trial-and-error experiments.
Firstly, a long segment of the SCT is placed in the fusion splicer, and one end is glued with UV curable resin to a 0.3 mm PTFE tube connected to a microfluidic electronic pressure sensor from Bartels
TM controlled by an Arduino. The other end is glued to a PTFE tube connected to a syringe, whose piston compression increases the pressure in the SCT. Once the desired pressure is achieved, the electric arc discharges can be employed (
Figure 5a). The first arc locally heats up the fiber, causing it to expand in the electrode’s area. As the expansion persists, the pressure in the capillary causes the fiber to tear up and a bubble appears, creating a micro gas inlet into the capillary (
Figure 5b). With each subsequent re-arc, the bubble attains a rounder, more spherical shape, and the fiber stretches and becomes straighter, without strain. This process is repeated until the desired shape is obtained (
Figure 5c).
The first method described has been applied in several fiber sensors previously reported; however, the bubble development method has never been employed in an SCT to the best of our knowledge [
16,
26,
27]. Even though Duan et al. have created a microbubble in an SMF via fusion splicing, it worked as an air cavity in the fiber core [
28]. The side-hole technique employed by Cordeiro et al. was a proof of concept in PCFs that resulted in high fiber expansion around the hole, and no measurand characterization was performed [
17].
Figure 6 shows the microscopic view of several short sensors based on the sandwich configuration.
Figure 6a reveals a closed SCT with a length of 609 μm. In
Figure 6b, the 645 μm long SCT contains a bubble that acts as an access channel. Its top view is shown in the inset, with an approximate diameter of 45 ± 5 µm. In
Figure 6c, the access channel was achieved by splicing a 547 μm long thick-core SCT between an SMF and a thin-core SCT. Sensors with lengths that range from hundreds of microns to a few millimeters were fabricated. It was found that enhanced performances were achieved for the longer sensors, not only towards their spectral results, but also their pressure and temperature responses, particularly due to the creation of better conditions for the AR guidance.
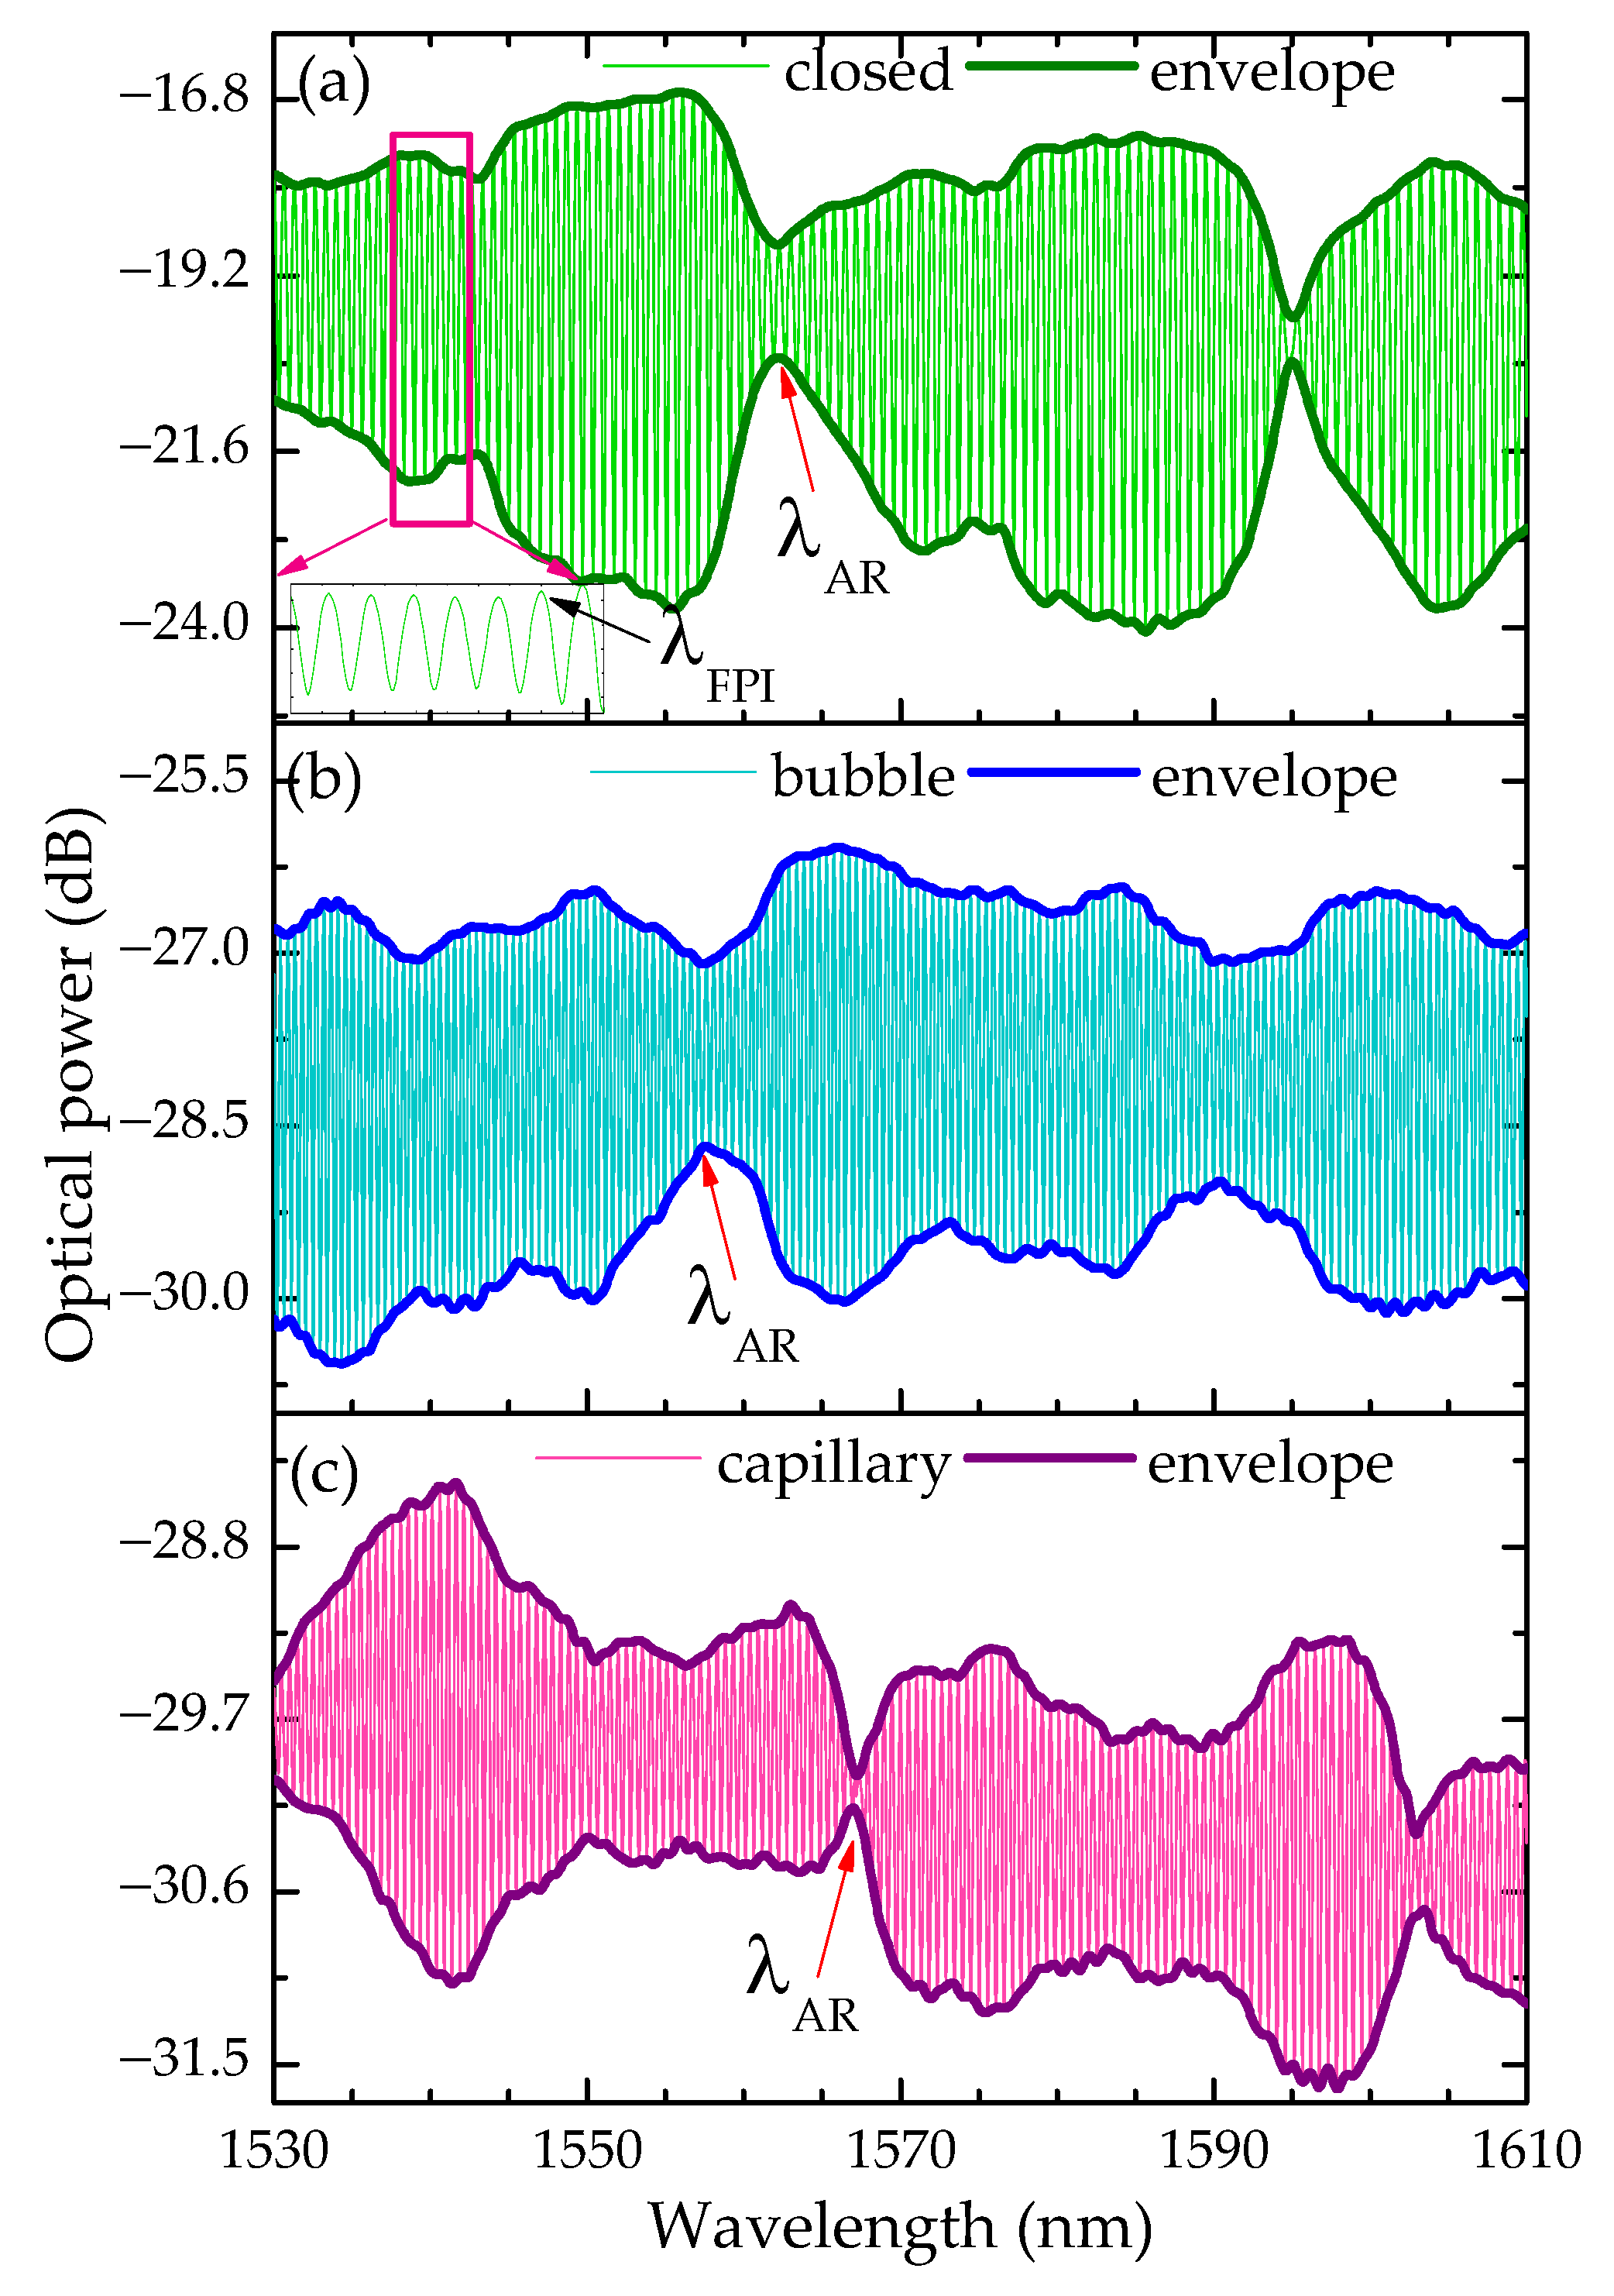
Spectral analysis was performed in a reflection configuration that is comprised of a broadband light source (BBS) emitting on the C + L band with a wavelength range of 1530–1610 nm. It connects to an optical circulator, which propagates light to the sensor and sends it back to an optical spectrum analyzer (OSA, Anritsu, model MS9740A) with a 0.05 nm resolution. The reflection spectra of the ~2 mm sensors with 0 and 1 access channels (with a bubble or a thin-core SCT) were obtained, as depicted in
Figure 7.
Two signals with different oscillation frequencies can be seen simultaneously in the reflection spectrum. The high-frequency oscillation corresponds to the FPI, which is modulated by the AR, a low-frequency oscillation defined by periodic lossy dips. The latter is extracted from the spectrum through usage of an envelope analysis tool, as depicted by the darker upper and lower lines that circumvent the spectrum. This phenomenon arises due to the sensing head length being above critical, corresponding to ~300 µm for the SCT used in this work. The antiresonant peaks should theoretically occur at the same wavelengths when considering the same SCT; however, this is not verified. This is due to deformation of the capillary when instilling the bubble, as well as imperfections in the uniformity along the length of the SCT during its fabrication. Both factors influence the resonance conditions, shifting the AR peak in the spectrum as seen in
Figure 7. Additionally, there is a slight AR peak shift between the closed and thin-core SCT sensors, which could be due to the aforementioned uniformity imperfections in the SCT during its fabrication, as well as a possible slight collapse of the thick-core SCT cladding when spliced with the thin-core SCT.
Different amplitudes can be verified in the reflection spectra of the sensors depending on the type of access channel present. The visibility of the reflection spectrum corresponds to where and are the maximum and minimum optical powers of the peak with highest amplitude. The average visibility of closed sensors is 68%, whereas for open sensors it is 26% in thin-core-SCT-based sensors and 45% in bubble-based sensors. Indeed, the highest visibility is observable for the sensors without an access channel, as these elements add perturbances to the waveguides. The lower visibility of the thin-core SCT sensors when compared with the bubble-based sensors is explained by the interface between the SCTs with a thick core and thin core, which results in lower quality mirrors for the FPI when compared with a splice between an SCT and an SMF. Thus, the bubble method showcases a benefit in this regard.
Similar to the effect evidenced in the FPI visibility, a decrease in this quantity can be seen for the AR spectrum in its low-frequency oscillations given by the envelope of the access-channel-based sensors contrasted against the closed sensors. The introduction of an irregular element in the cladding affects the AR propagation, resulting in an envelope with a lower amplitude, as well as being less shapely than that of a closed sensor.
4. Results and Discussion
The gas-pressure response of the proposed sensor was studied. The sensors monitored this measurand in a closed chamber that was fabricated in-house. The experimental setup, shown in
Figure 8, included a chamber with a valve system. One valve was attached to a compressed gas system that enabled air entrance, increasing pressure, while the other allowed the air to escape the chamber, decreasing its pressure. The chamber was connected to an electronic pressure and temperature reading system through the KOLIBRI software desktop.
Pressure measurements between 0 and 0.4 MPa were made at room temperature with steps of 0.05 MPa, wherein the resolution of the electronic pressure sensor is 0.0001 MPa. The sensors used for pressure characterization included closed (without an access channel: FPI0 and AR0) and open sensors (with a bubble: FPIb and ARb; with a thin-core SCT: FPIc and ARc).
In
Figure 9, it is visible that the closed sensor is insensitive to pressure for both FPI and AR. For open sensors, the FPI showcases a shift towards longer wavelengths (red shift) while the AR component shows a shift towards shorter wavelengths (blue shift). The obtained sensitivities are summarized in
Table 1.
It can be seen that the pressure response of the access-channel-based sensors with a bubble vs. a thin-core SCT was found to attain similar results with high linearity, hence validating both access channel methods for pressure detection. The sensitivities obtained experimentally are consistent with the theoretical sensitivities calculated in
Section 2, with slight deviations that may be due to the approximations previously considered. This is particularly true for the closed sensor, as the wavelength shift is below the resolution limit, and the linearity achieved is not sufficiently high to determine the sensitivities with precision.
The experimental setup for temperature measurements involved a Peltier cooler and a thermocouple placed on a dissipation block, connected to a temperature controller (Thorlabs (Newton, NJ, USA), TED350) with a resolution of 0.1 °C. The sensors monitored increases in temperature, and increments of 5 °C within the range of 20–80 °C were performed under atmospheric pressure.
It is visible in
Figure 10 that the AR underwent a red shift, with much greater sensitivity than that of the FPI. The latter was positive on the closed sensor and negative on the open sensors; however, it is practically insensitive for both configurations. The attained sensitivities are shown in
Table 2.
The deviations evidenced between the theoretical and experimentally attained sensitivities may be caused by the approximations previously considered. Furthermore, the attained results are comparable with those found in the literature [
29]. The presence of an access channel might enable the entrance of colder air in the fiber that is outside the influence of the Peltier cooler, whereby the temperature detection results are influenced. A numerical model for describing thermal transport using fractional calculations could be used for the proposed sensor, describing in detail the distribution of temperature in the fiber sensor when using the temperature calibration system for this work [
30]. It falls, however, outside of the scope of this work. This issue would possibly be overcome by using a climatic chamber where the entirety of the fiber sensor is under the same temperature environment.
From
Table 3, the sensitivities attained for this sensor are comparable with those in the literature. In particular, the FPI and AR sensitivities are within the range of those achieved in previous works, therefore verifying the credibility of the bubble access channel fabrication method.
When a pressure (
P) and temperature (
T) variation occurs in the surrounding environment, the reflection spectrum of the sensor will shift accordingly. Considering this shift pertains to a direct linear variation, the wavelength shifts of the FPI and AR can be expressed as:
where
is the sensitivity of the studied interferometer,
(FPI or AR), of the corresponding measurand,
(pressure or temperature). Thus, the total wavelength shift of each interferometer is the sum of the shifts for each measurand. Since the sensitivities of the interferometers were different for both parameters, a hybrid application of the bubble-based sensor can be made for the simultaneous measurement of pressure and temperature by tracing the wavelength shift of each interferometer and solving the following matrix:
By calculating the inverse matrix, the variation of pressure and temperature for the bubble- and capillary-based sensors is, therefore, given by:
where
is the determinant of the inverse matrix. Note that the units of the sensitivities are in nm/MPa and nm/°C for pressure and temperature, respectively. The resolution measurement of these parameters can be assessed by fixing pressure while varying temperature and keeping temperature fixed whilst changing pressure. Using (18a,b), the ideal and experimentally obtained values of pressure and temperature can be compared.
From
Figure 11, a great perpendicularity between both parameters is evident, highlighting a very linear response in the pressure component, whilst the temperature output displays a maximum deviation of ~3 °C, arising from the different orders of magnitude of the pressure and temperature sensitivities. The standard deviation of each parameter gives the resolution of the simultaneous measurements for the sensors, which were calculated to be ±3.01 × 10
−4 MPa and ±1.86 °C for pressure and temperature, respectively, for the bubble sensor and ±6.32 × 10
−4 MPa and ±1.38 °C for the capillary sensor.
Summarizing the performance of the access channel methods, it was found that the spectra amplitude of both the FPI and AR is significantly greater in the bubble-based sensors than the thin-core-based ones. Additionally, similar pressure and temperature sensitivities and resolutions were attained for both methods. The fact that an access channel was achieved in the SCT without substituting any part of the SMF–SCT–SMF configuration grants this structure greater flexibility than the one comprised of a thin-core SCT. On the one hand, the bubble-based sensor is a cheaper configuration than the thin core-SCT method, and the SMF and its length play no part in the working mechanism of the sensor. On the other hand, the bubble-based sensors possess a configuration that can be employed in a transmission scheme, yielding greater versatility in this sensing design contrasted with the thin-core-SCT-based sensors.


