Deep Compressed Super-Resolution Imaging with DMD Alignment Error Correction

Abstract
:1. Introduction
2. Materials and Methods
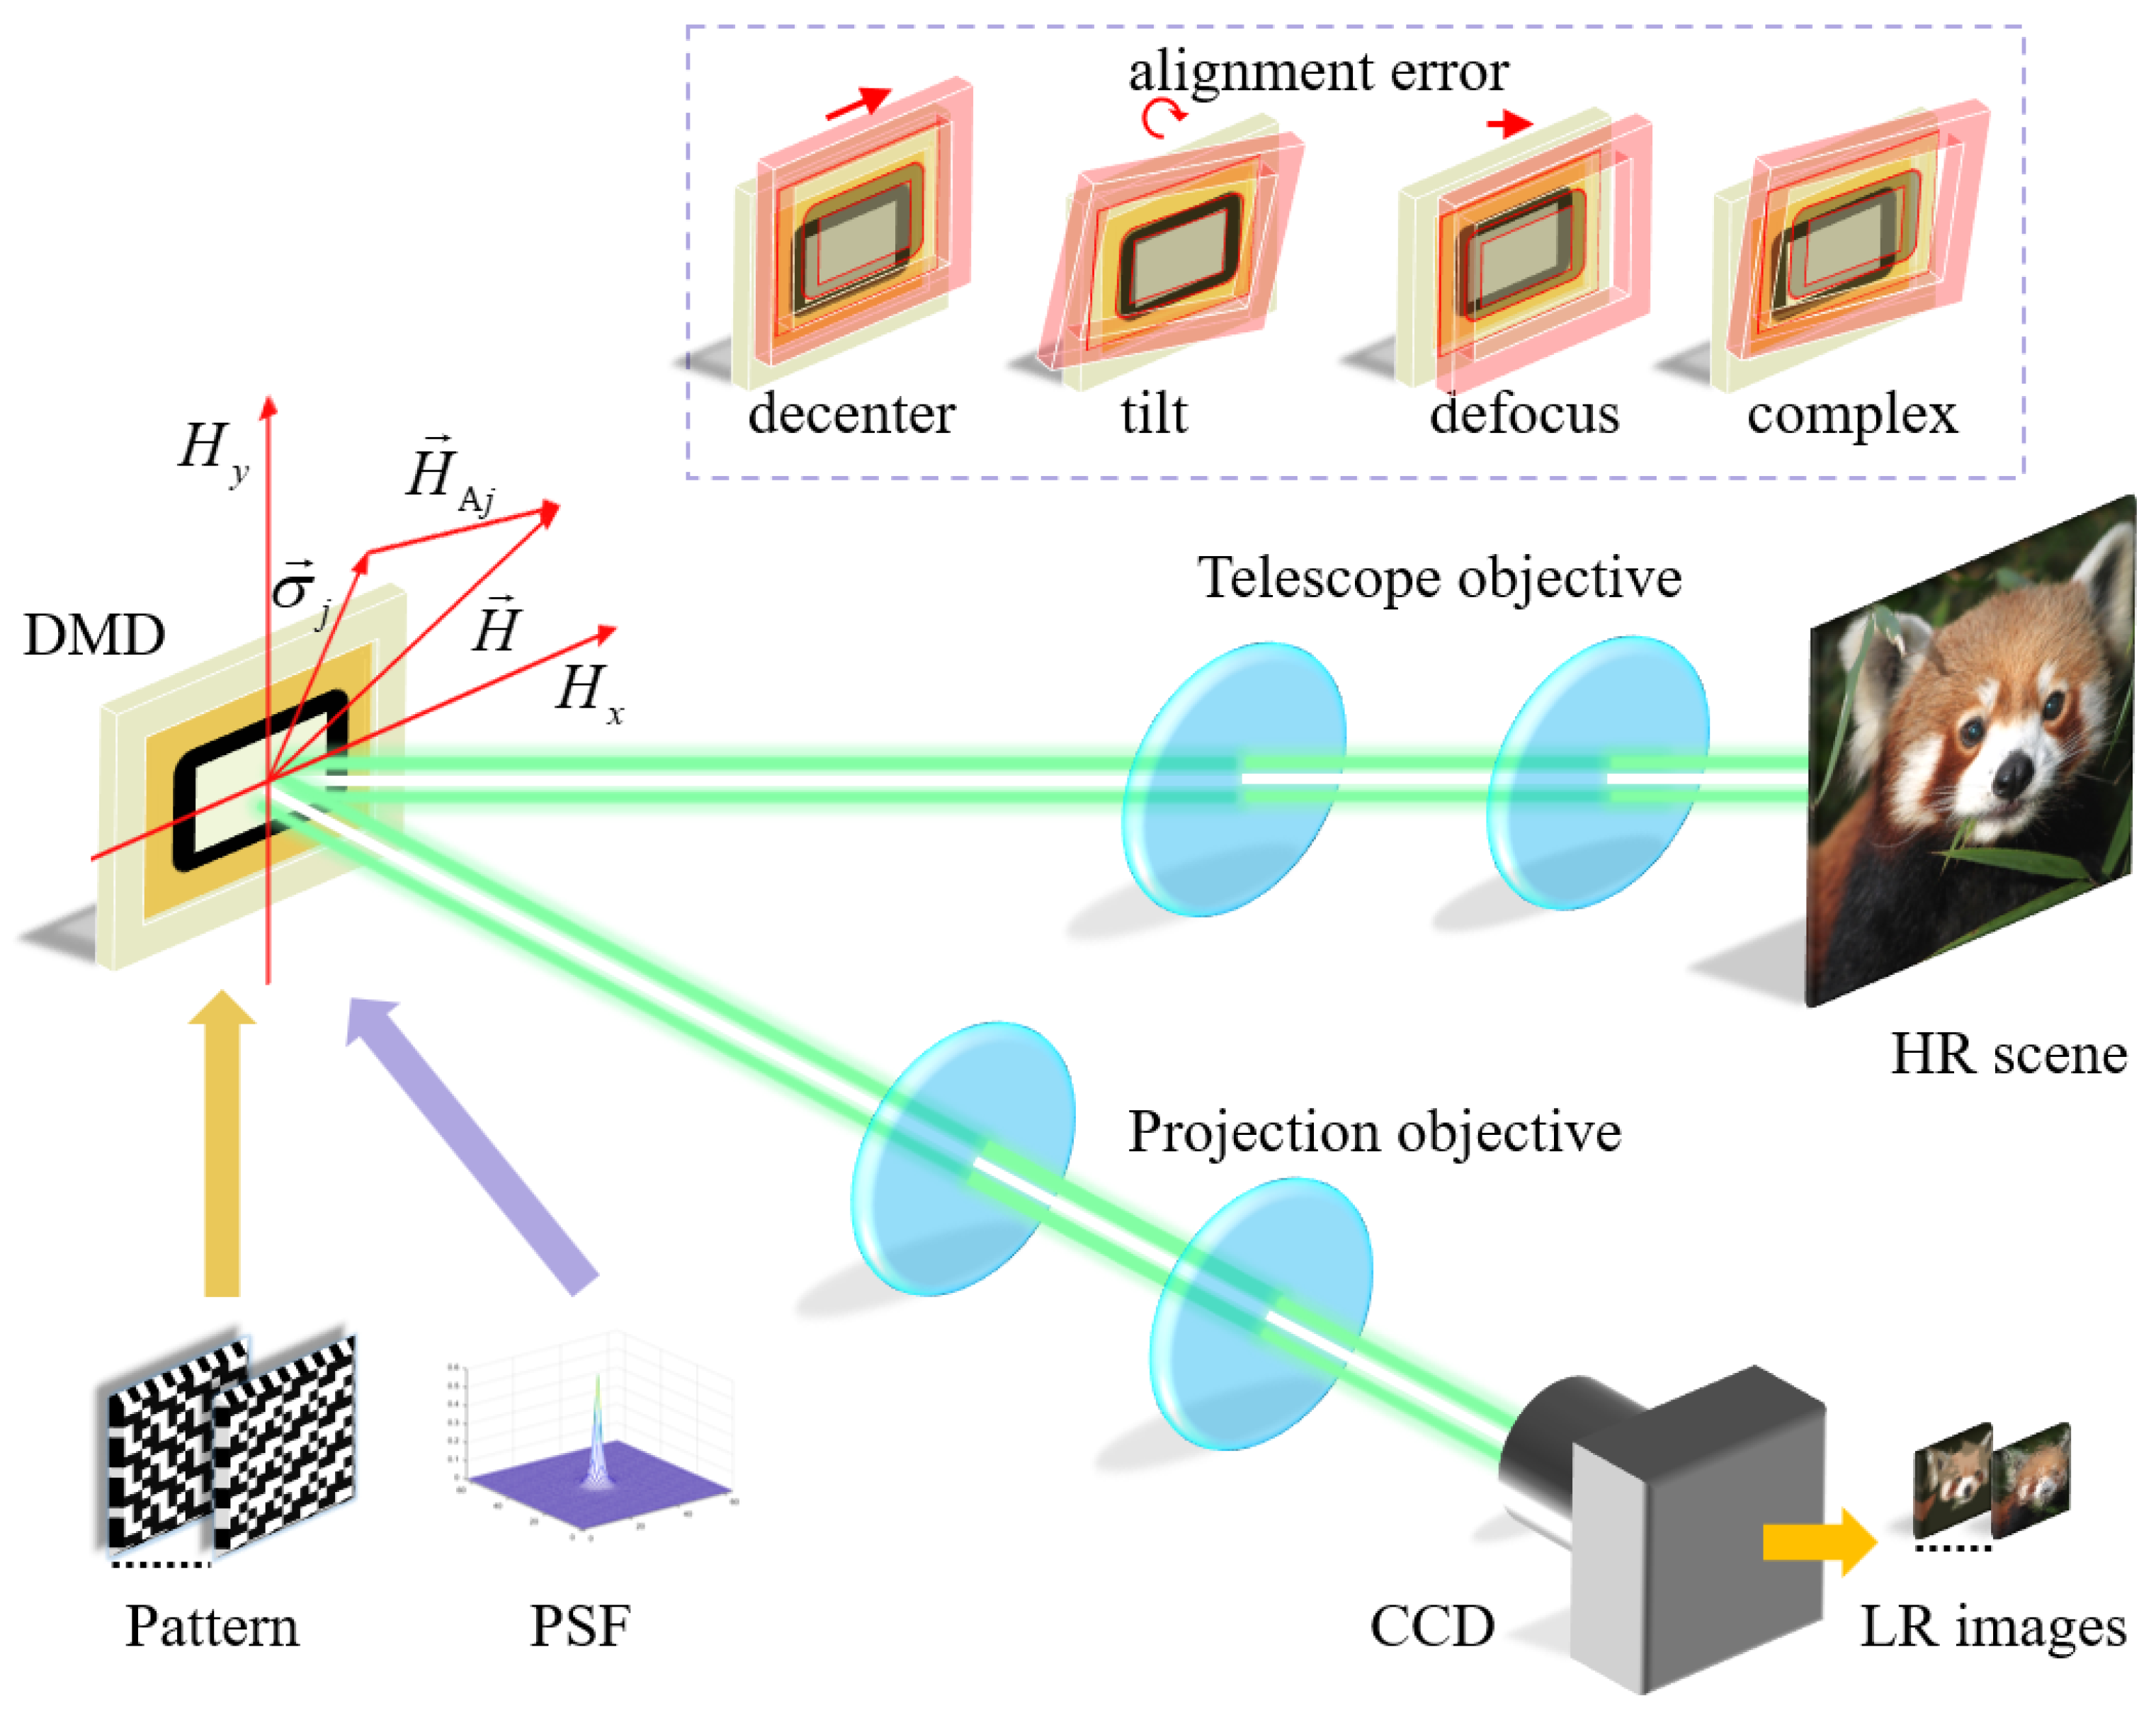
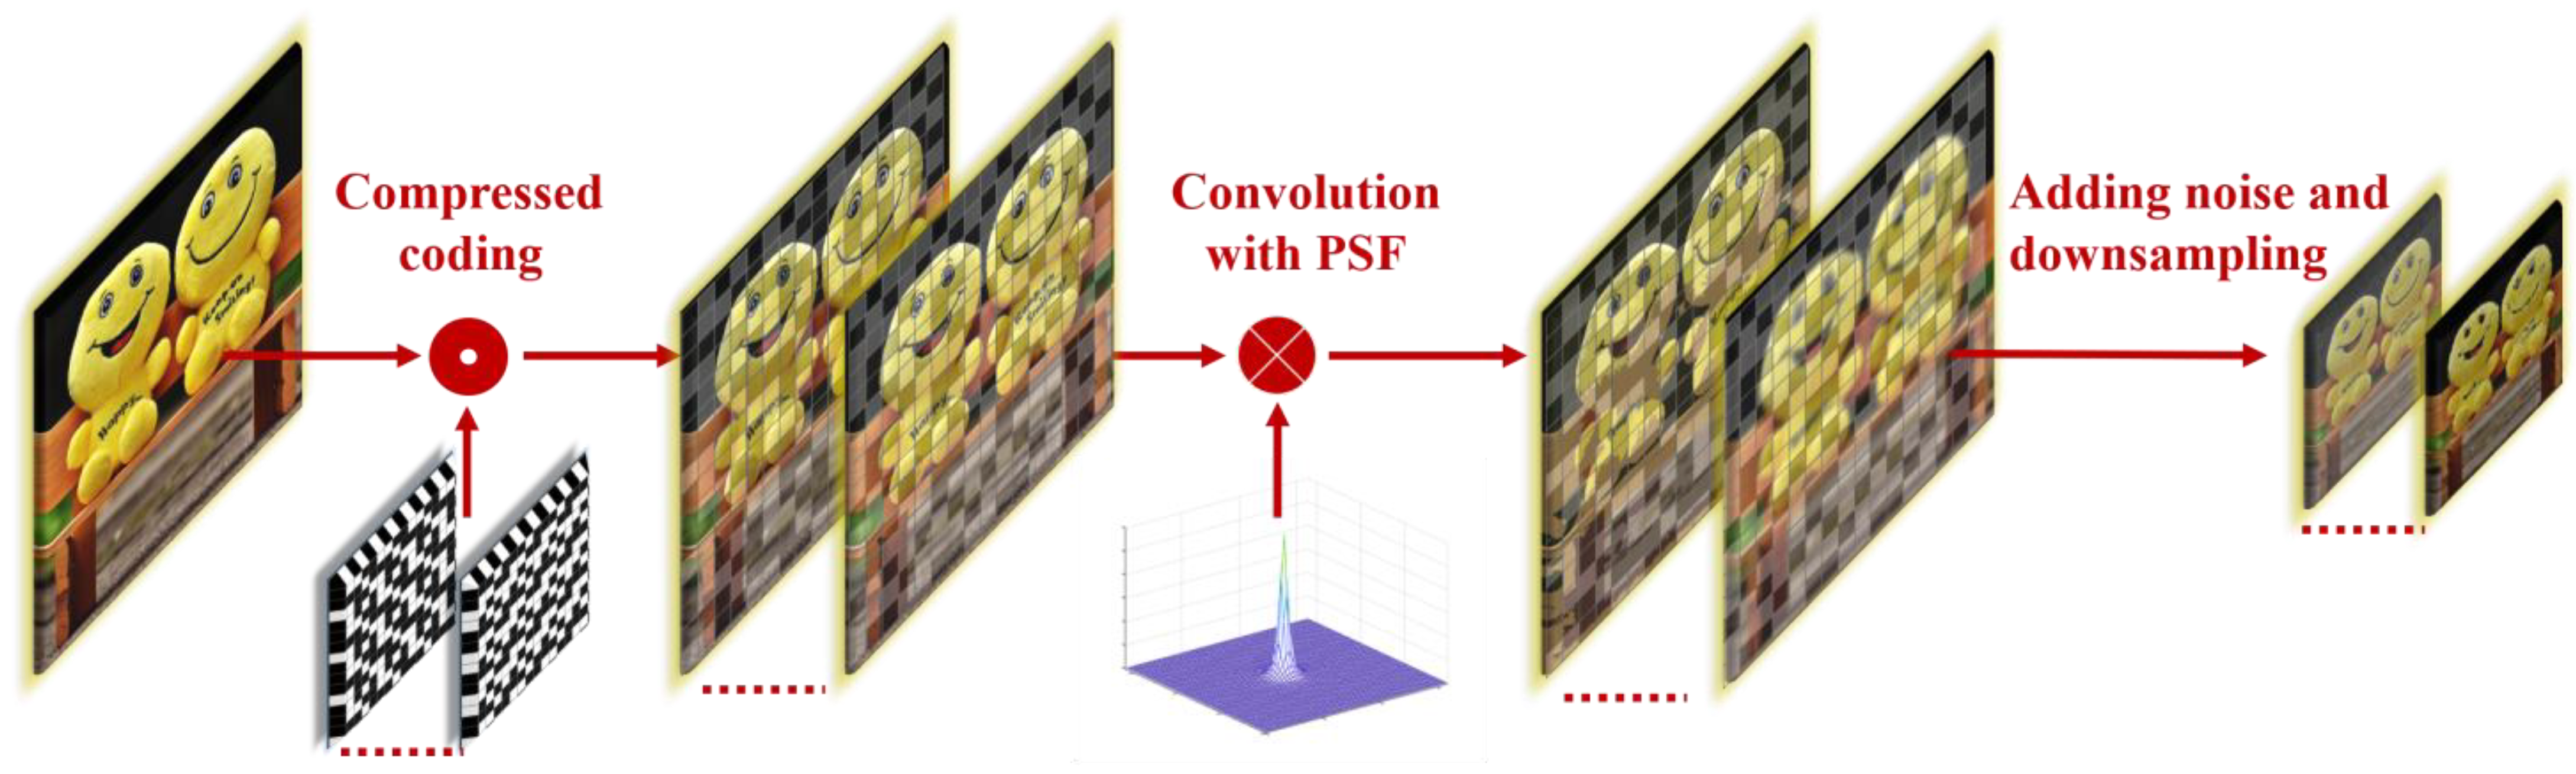
2.1. Block-Wise Compressed Imaging System with DMD
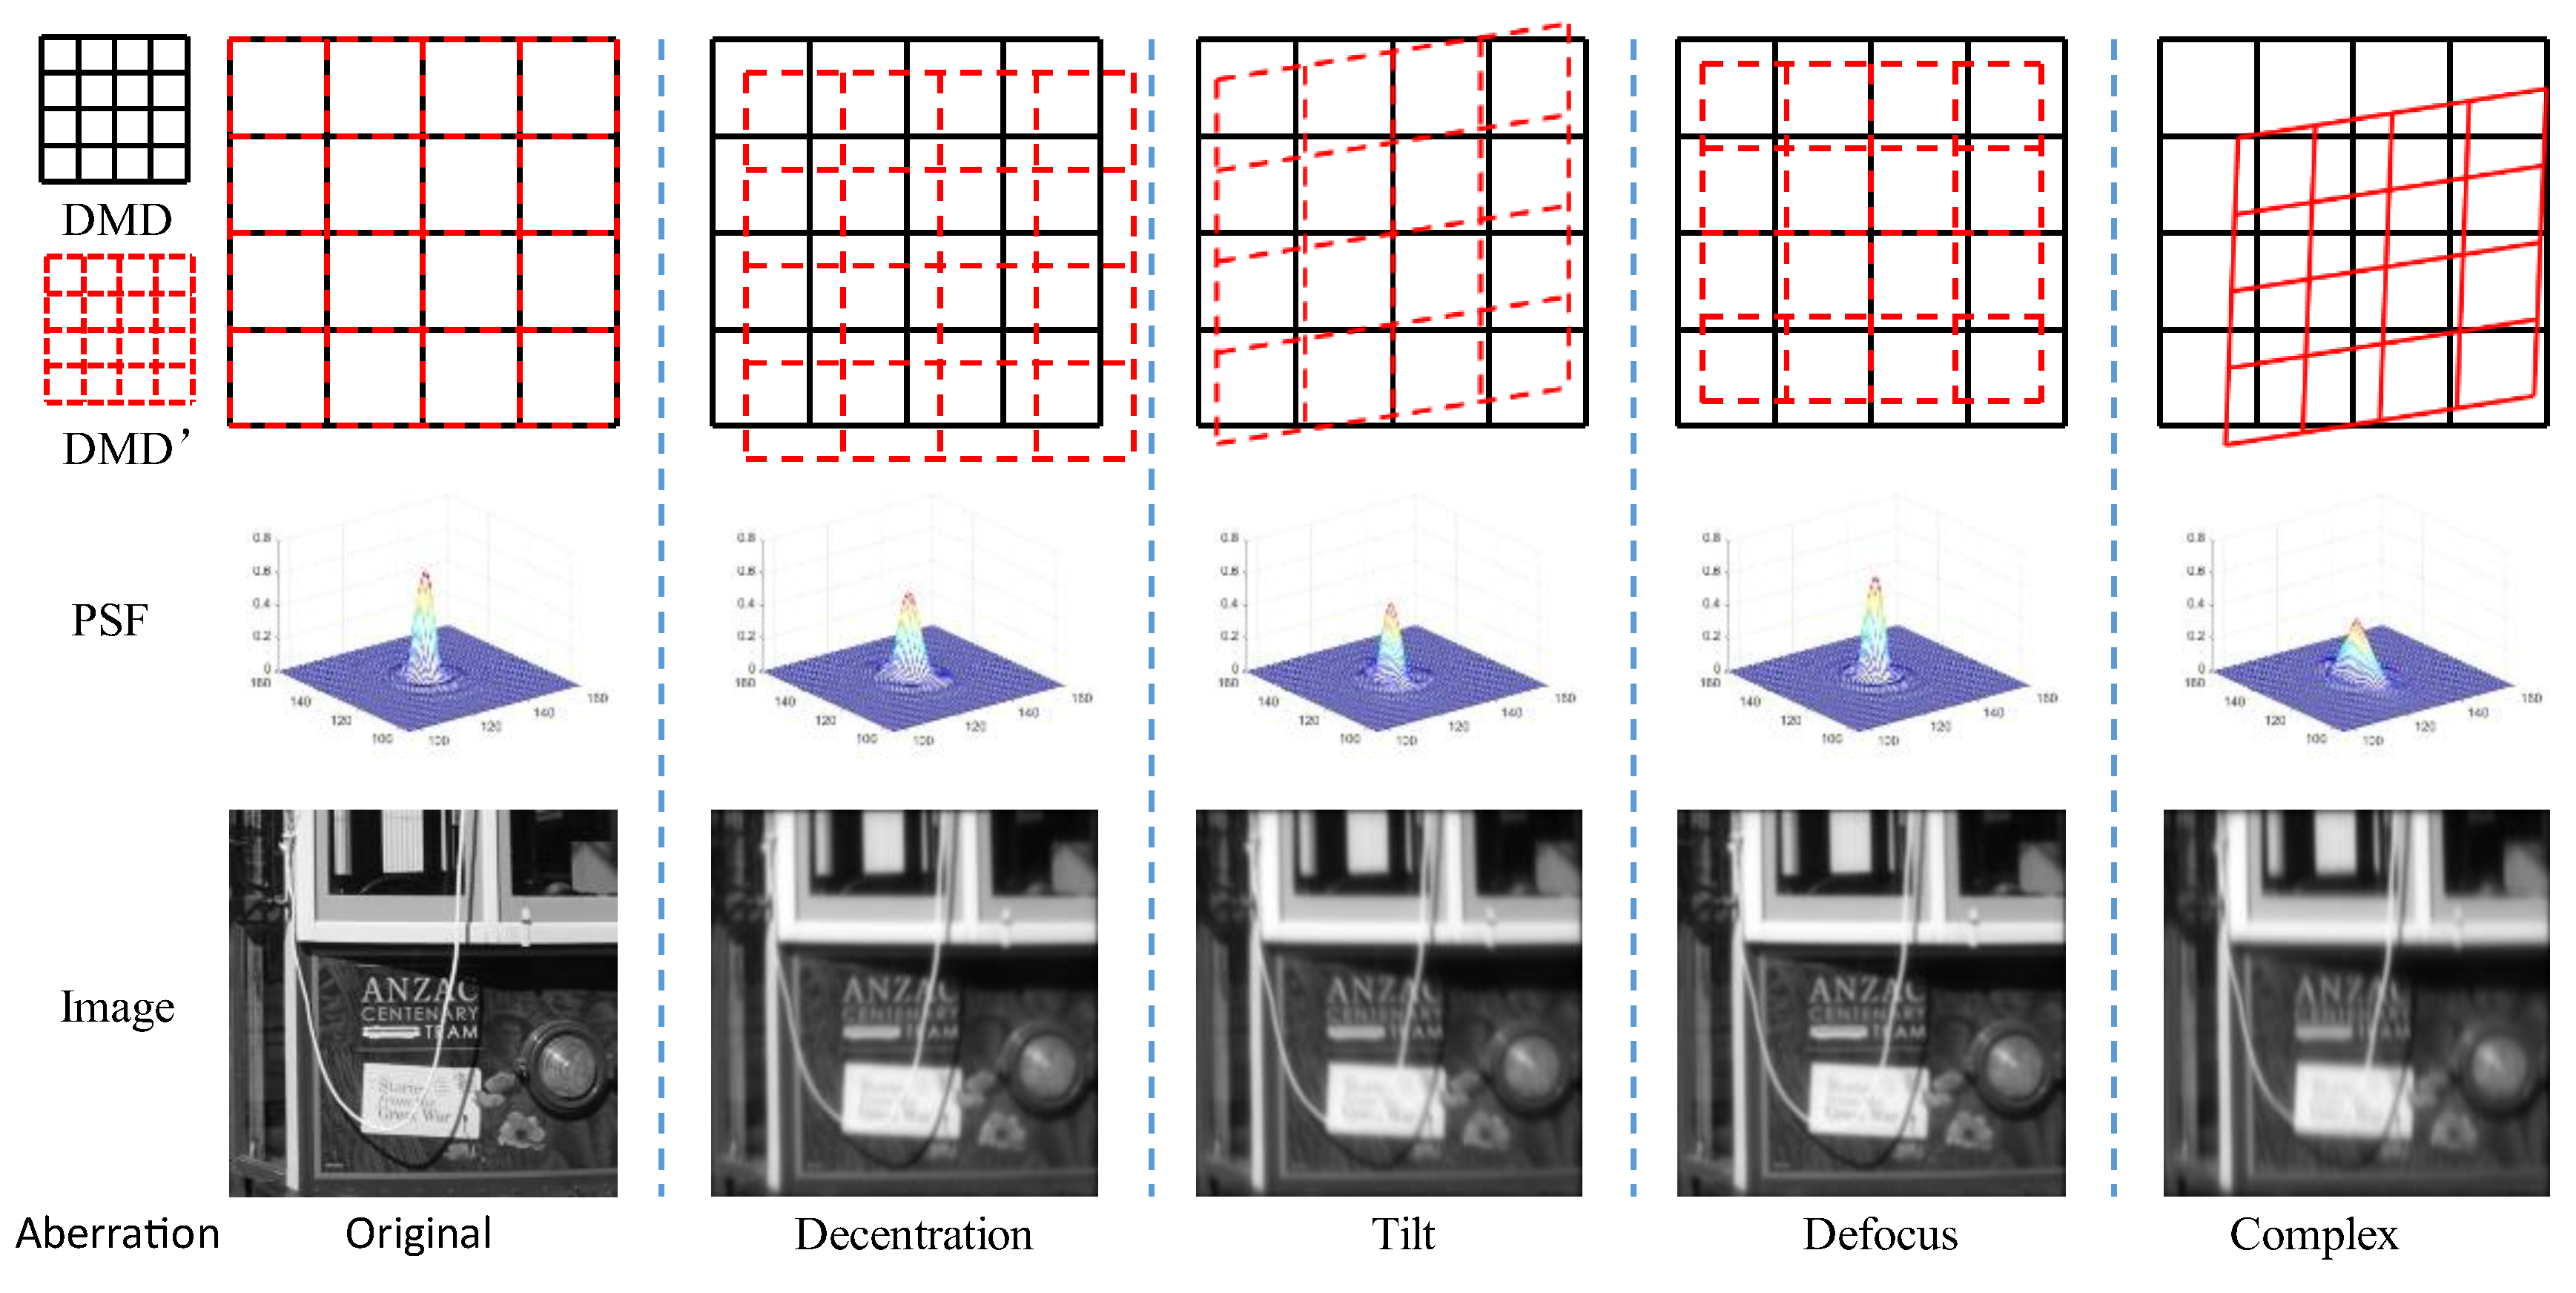
2.2. Effect of Alignment Error on Compressed Imaging
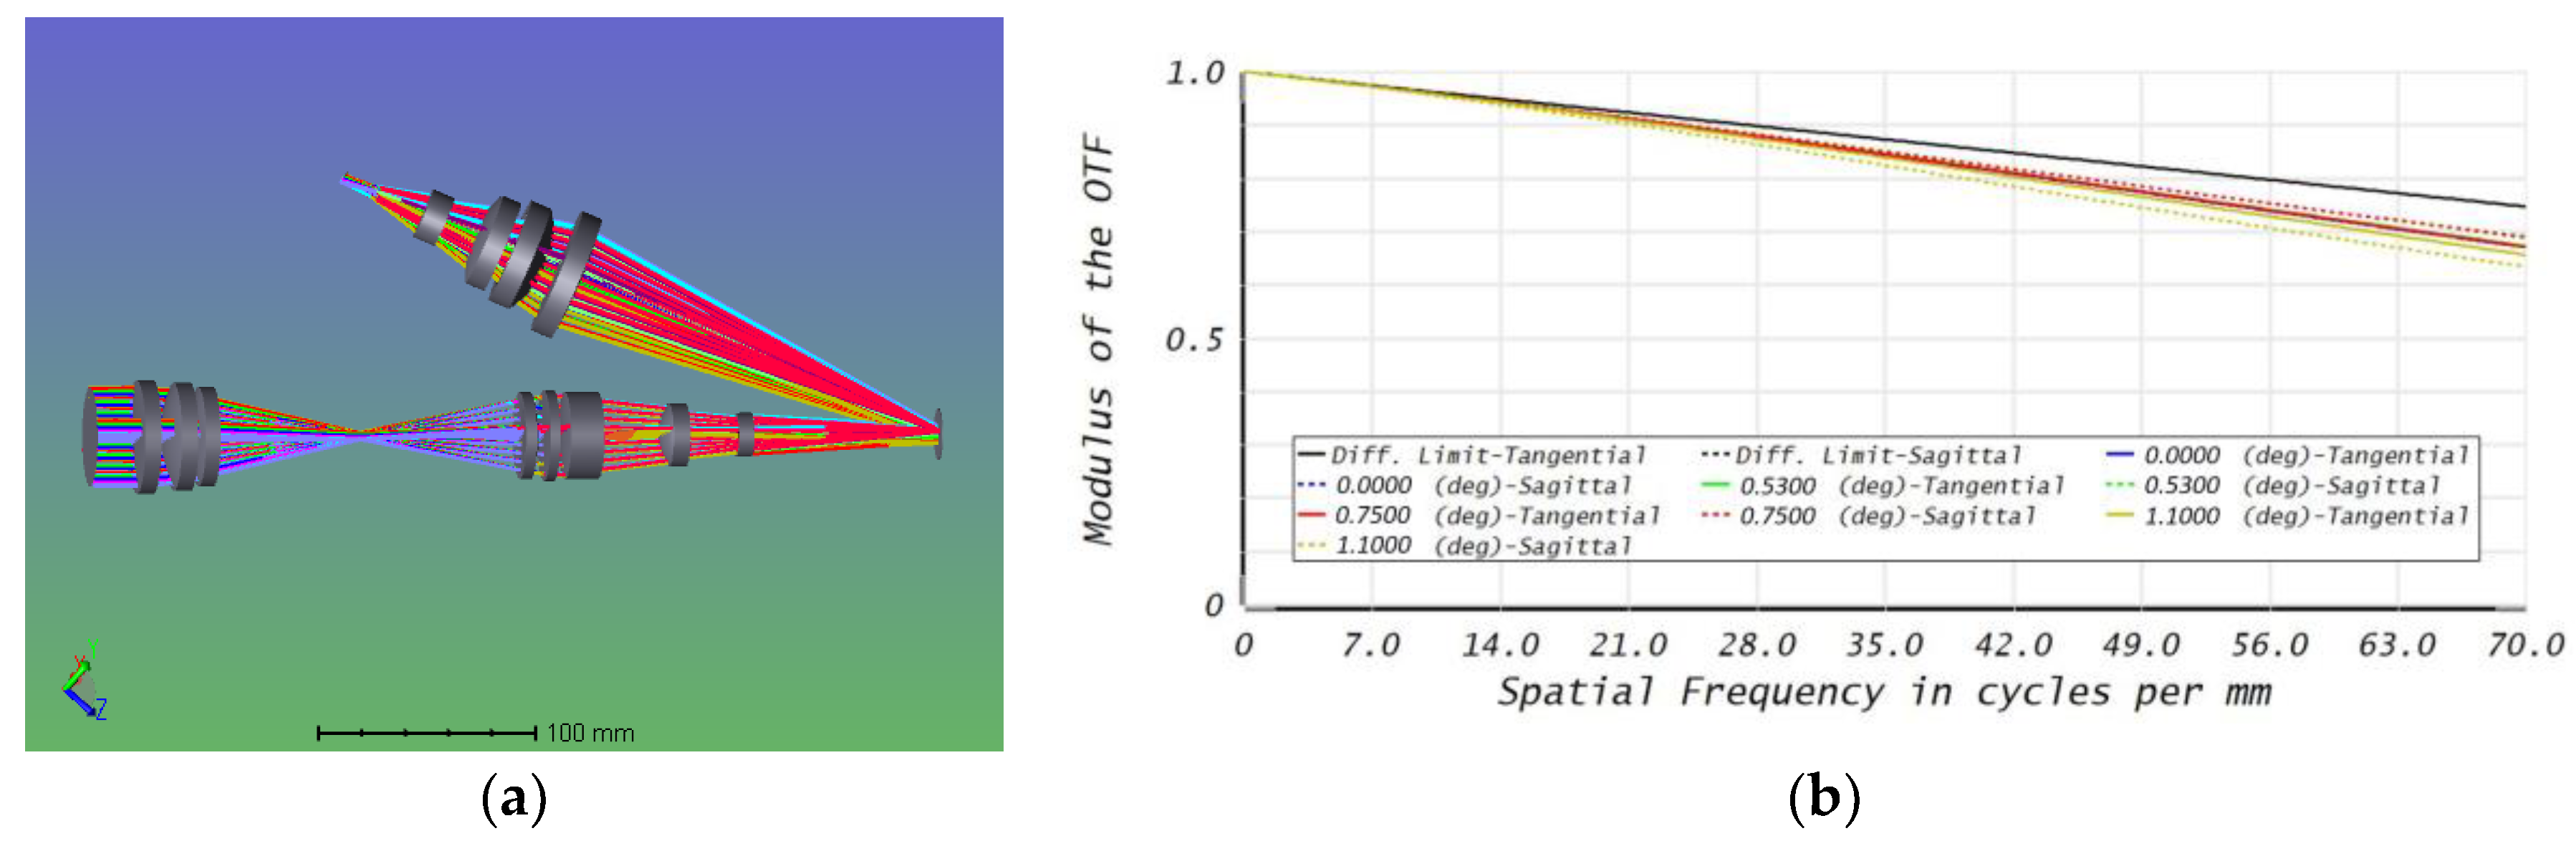
2.3. Optical System Design
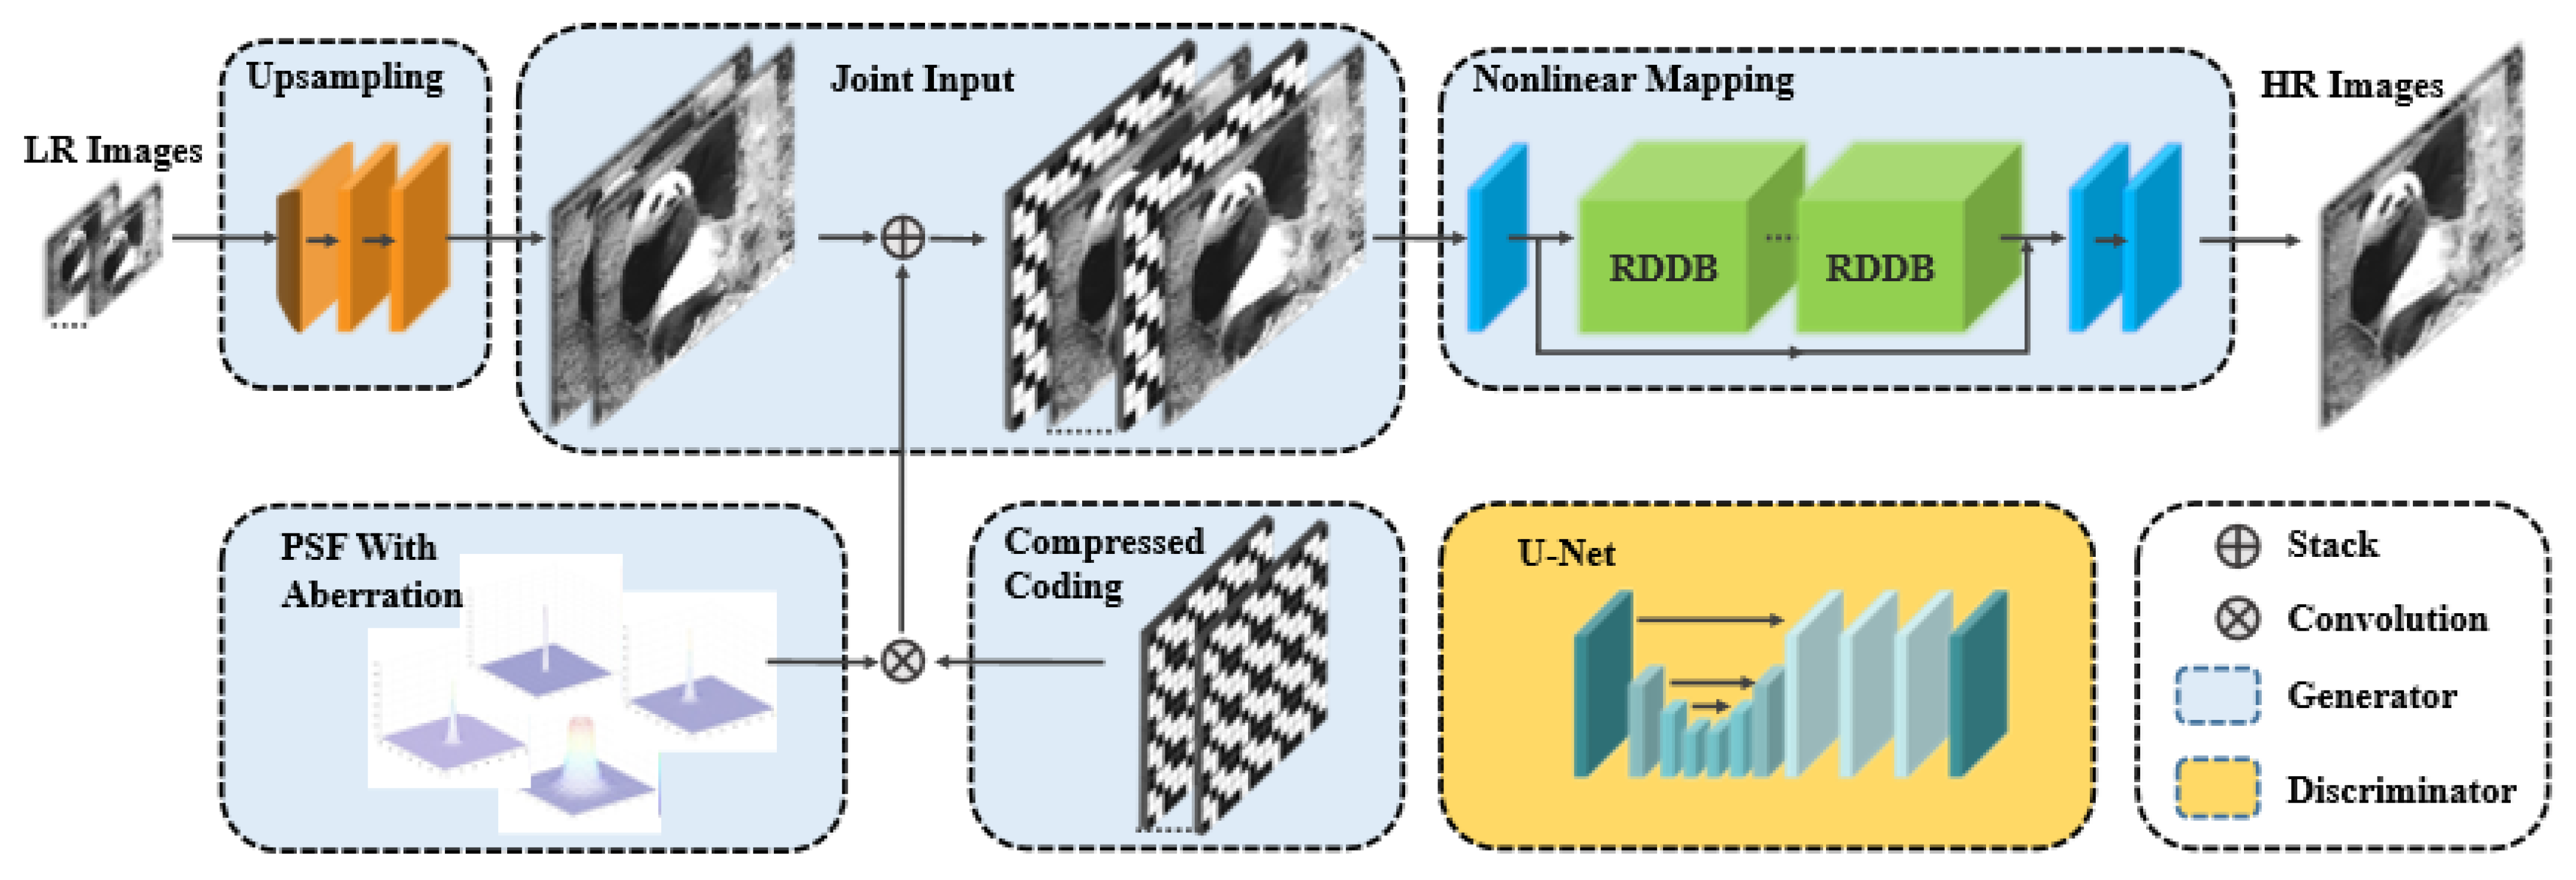
2.4. Super-Resolution Reconstruction Network
2.5. Training Data
3. Results
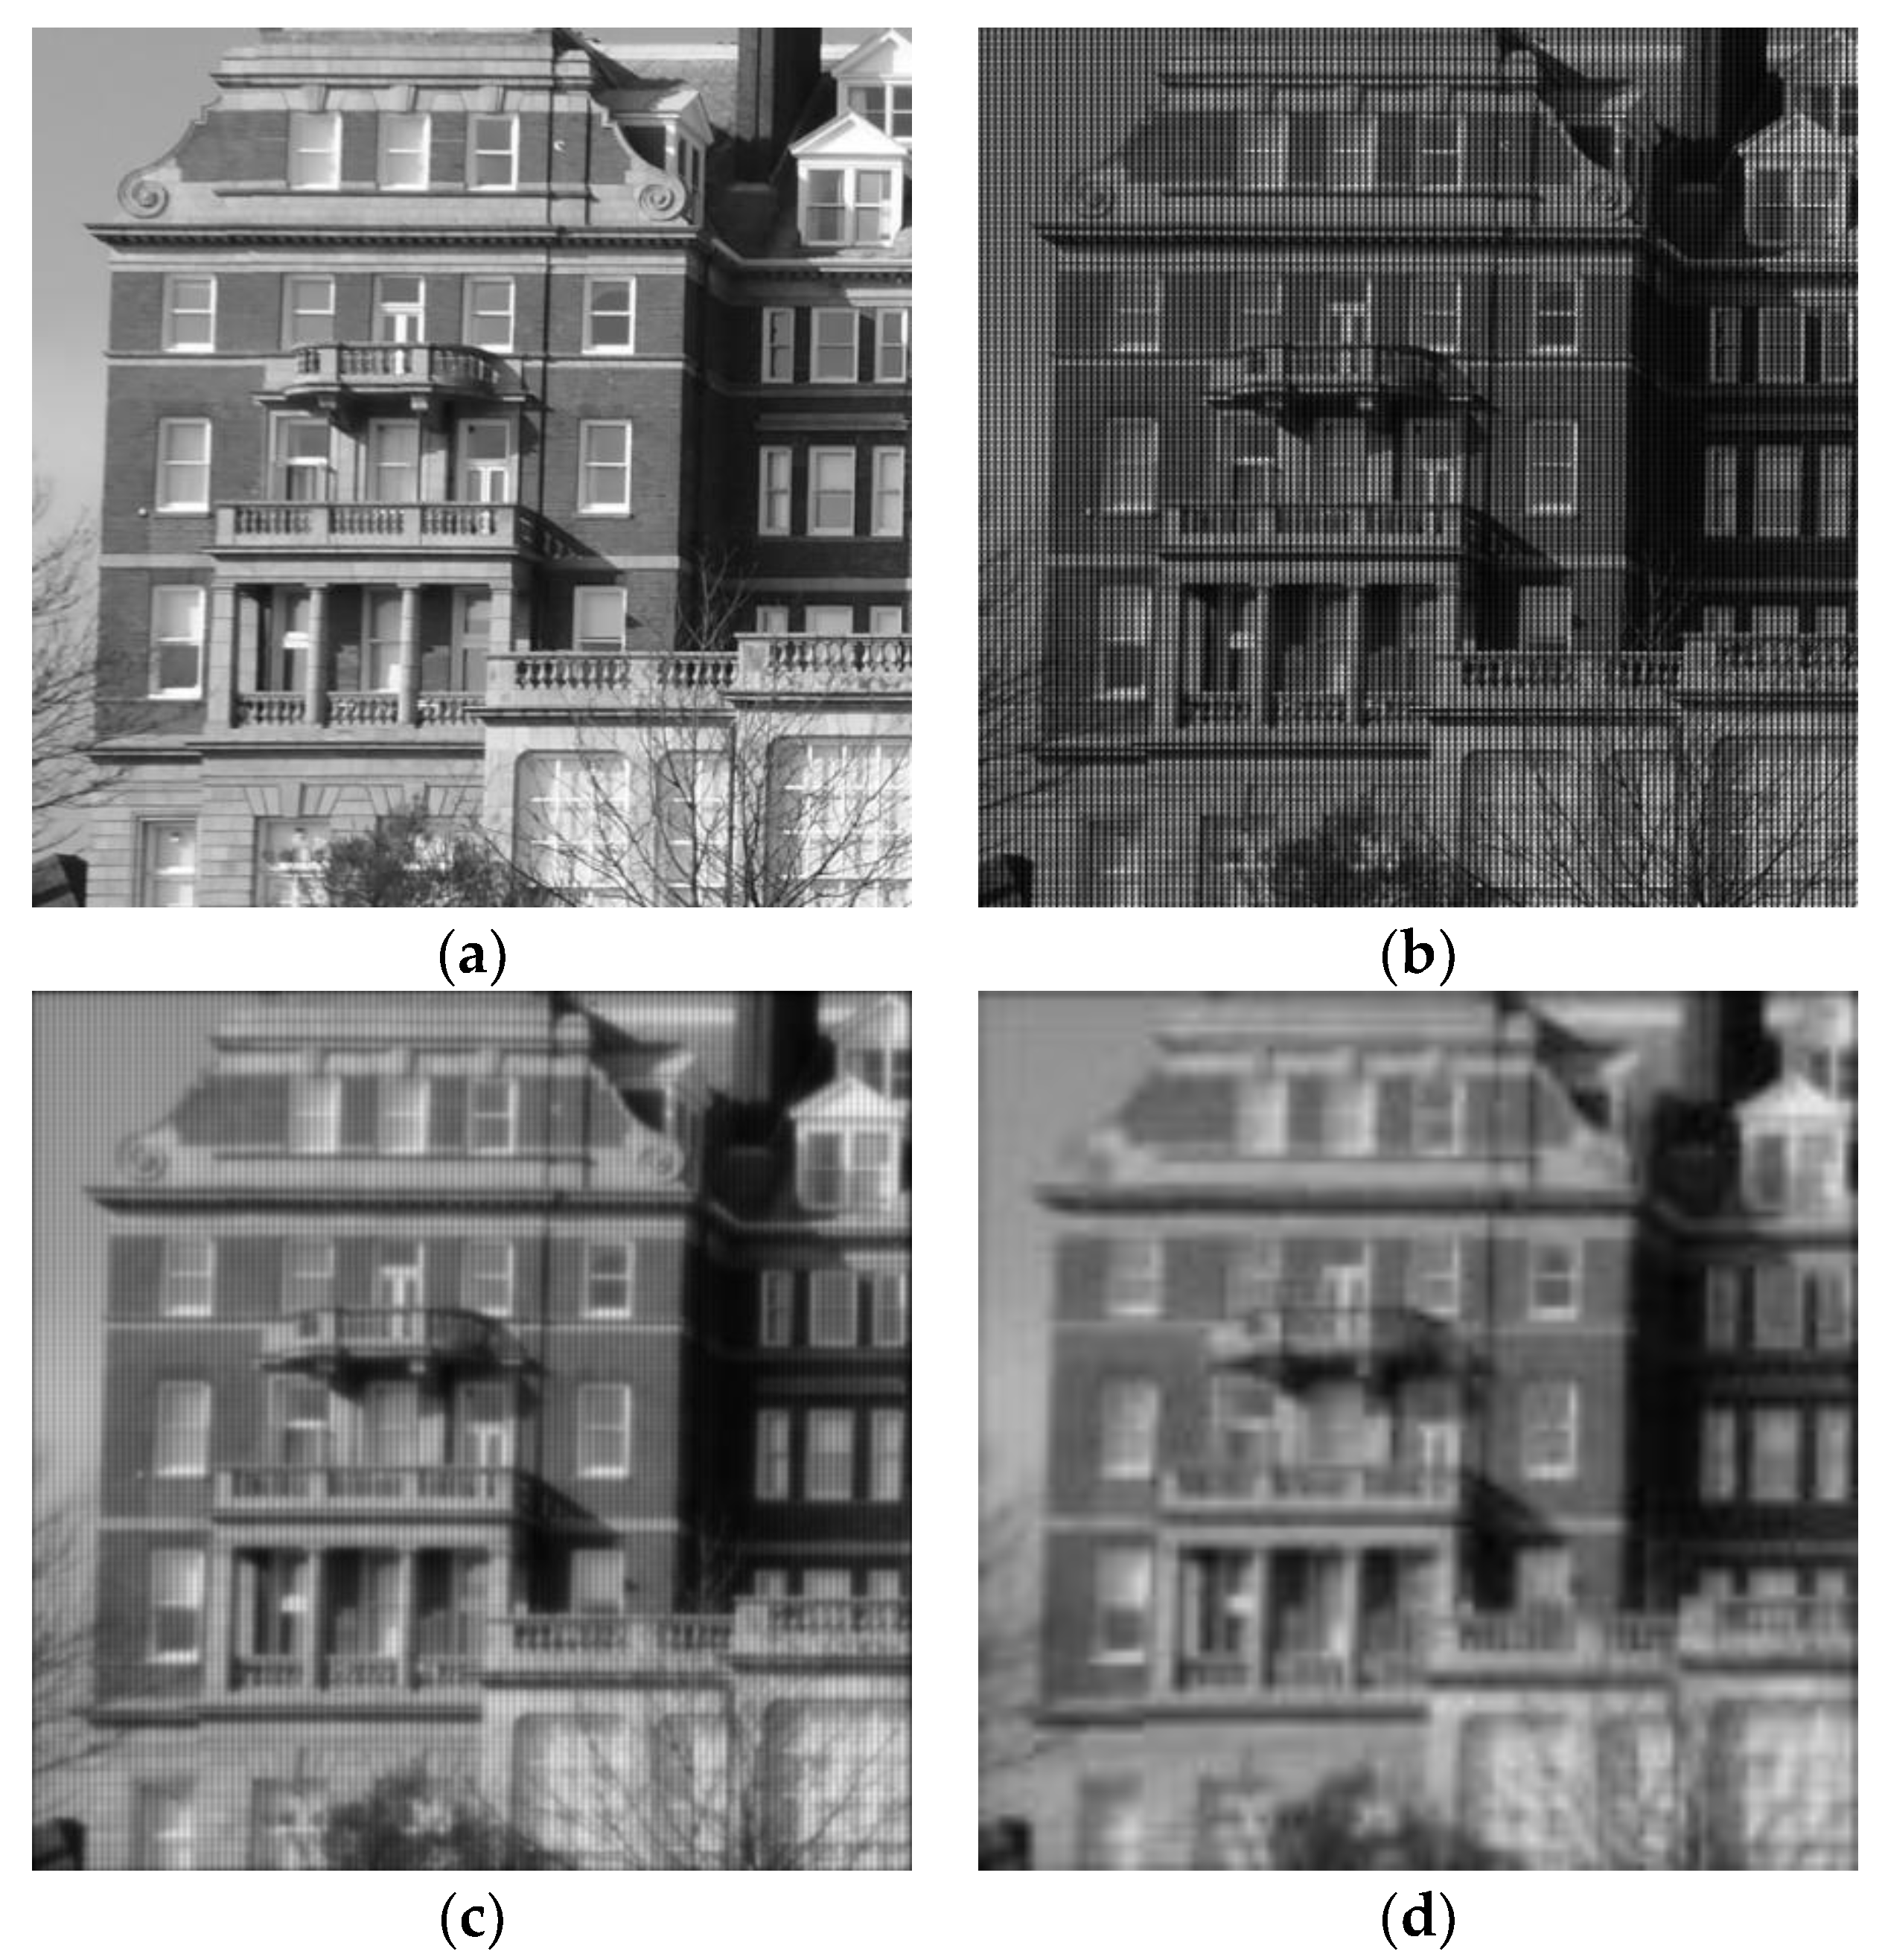
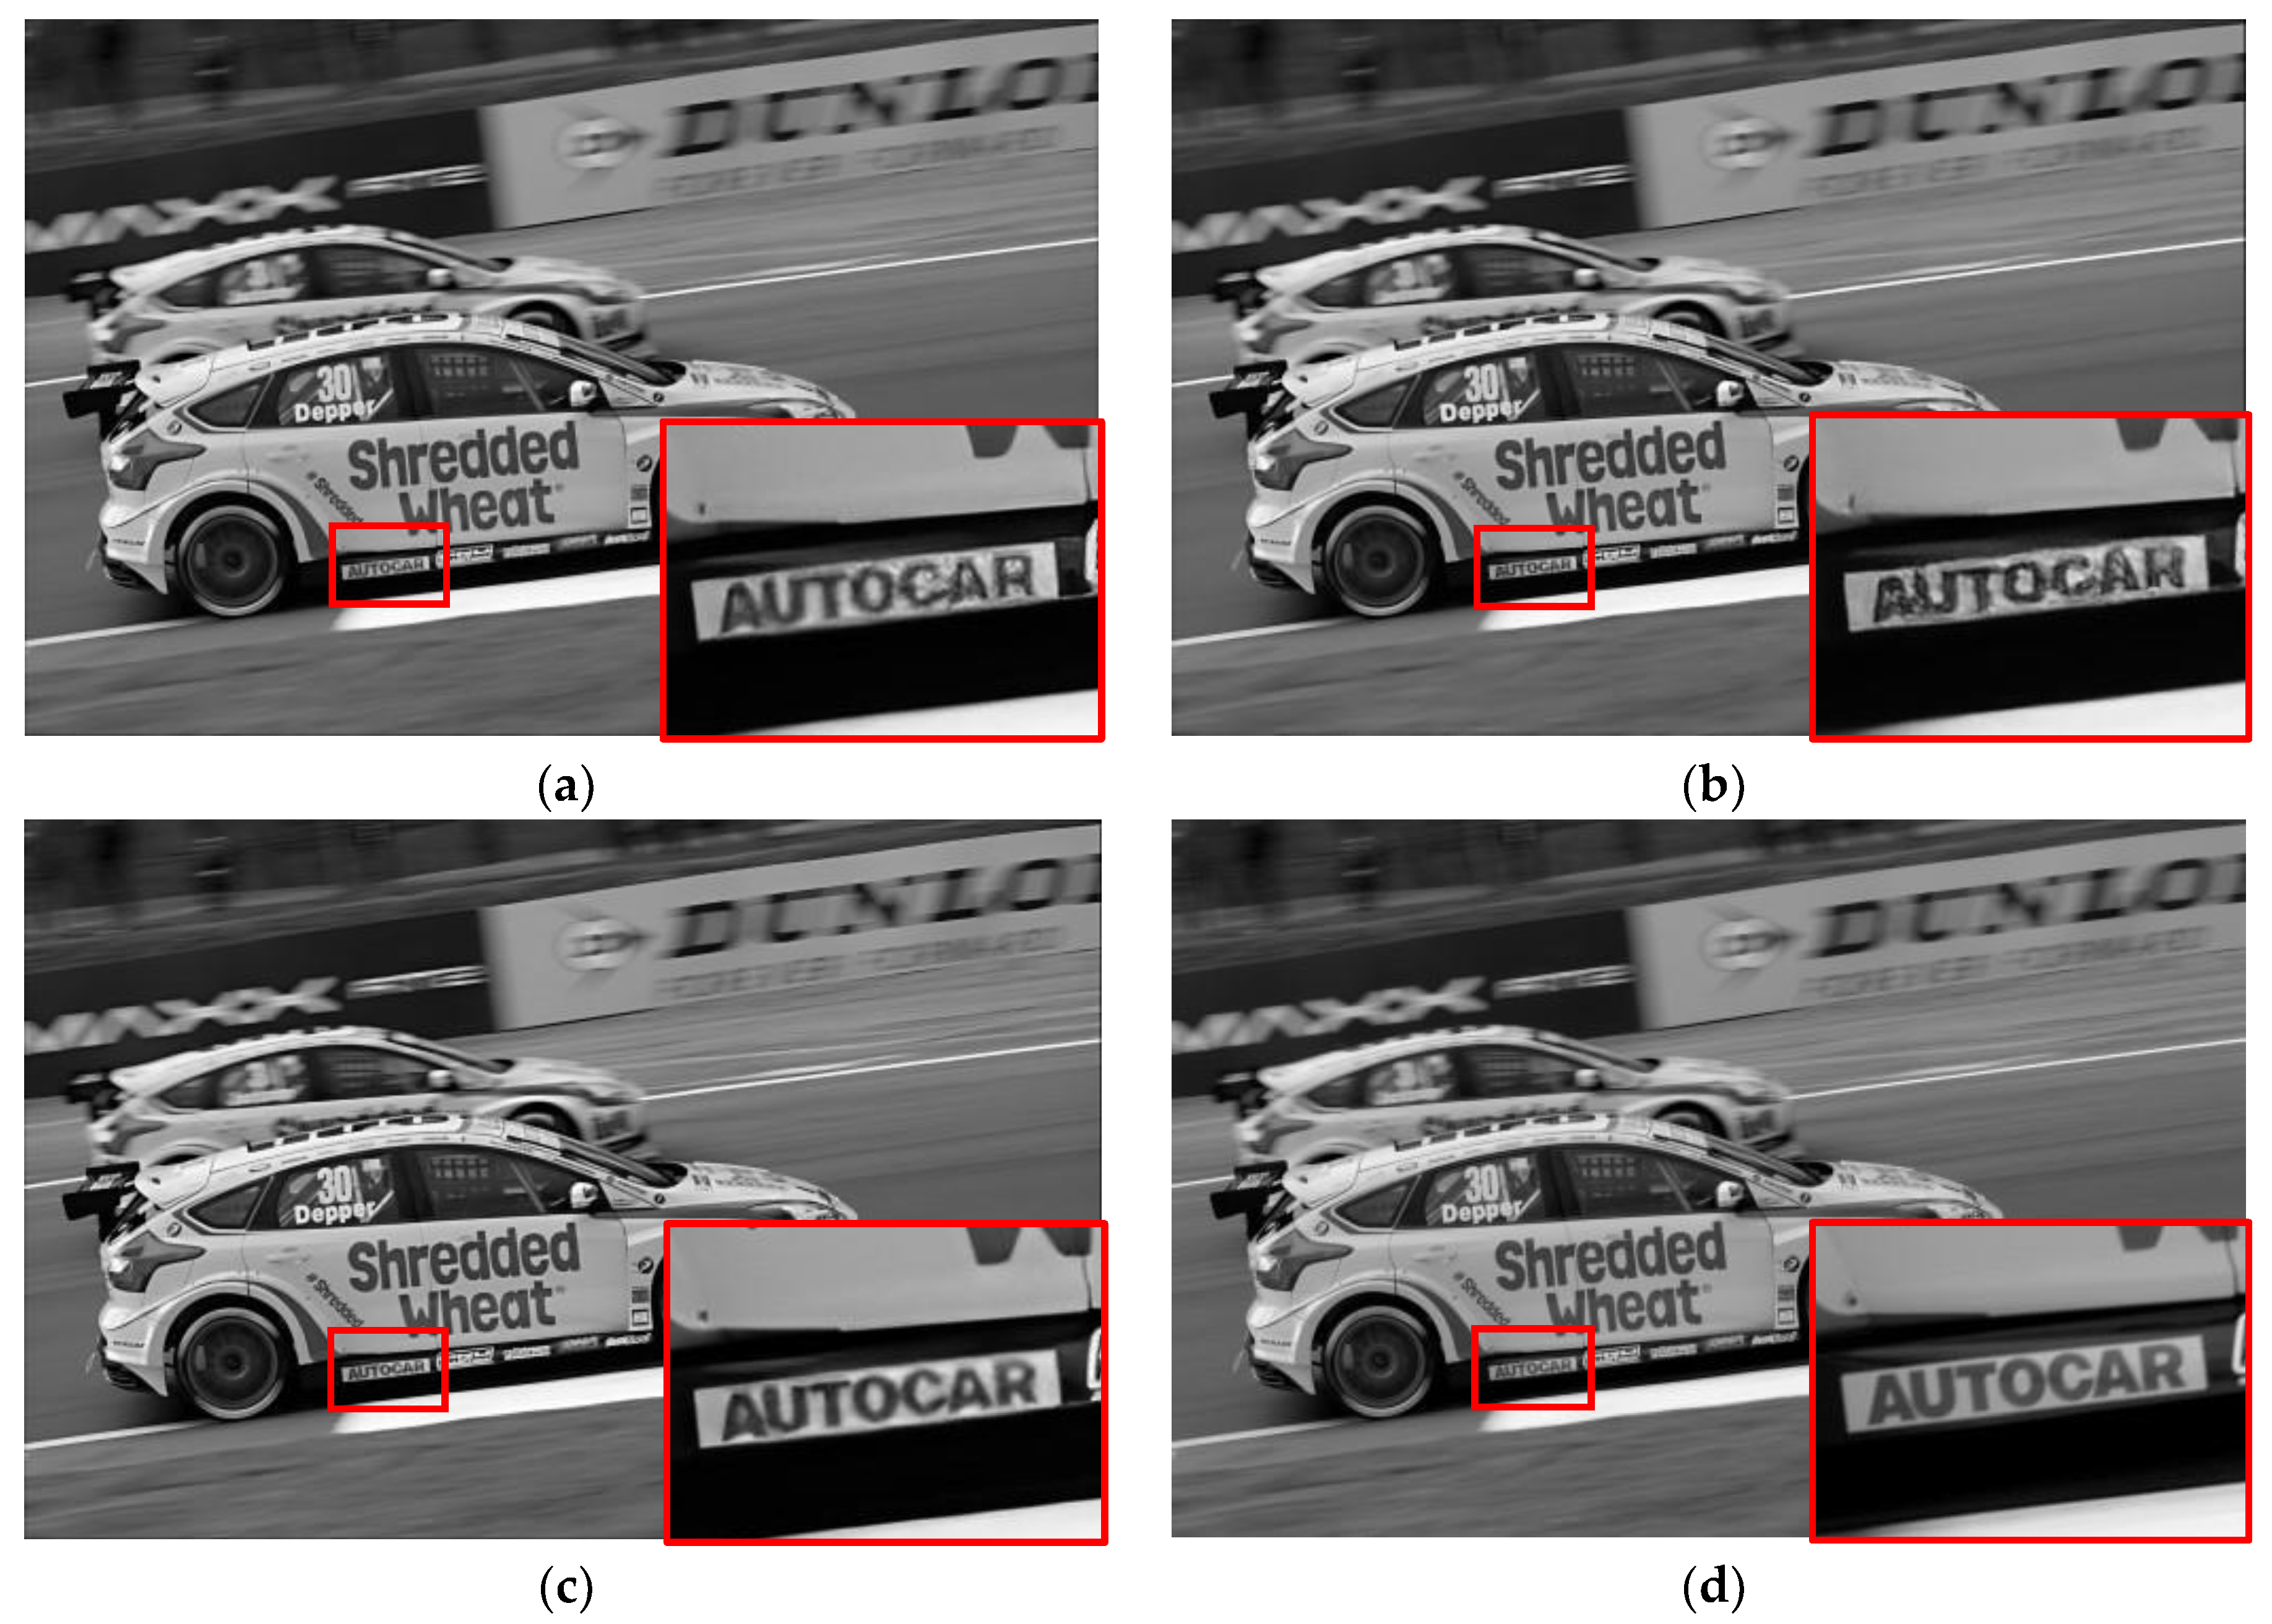
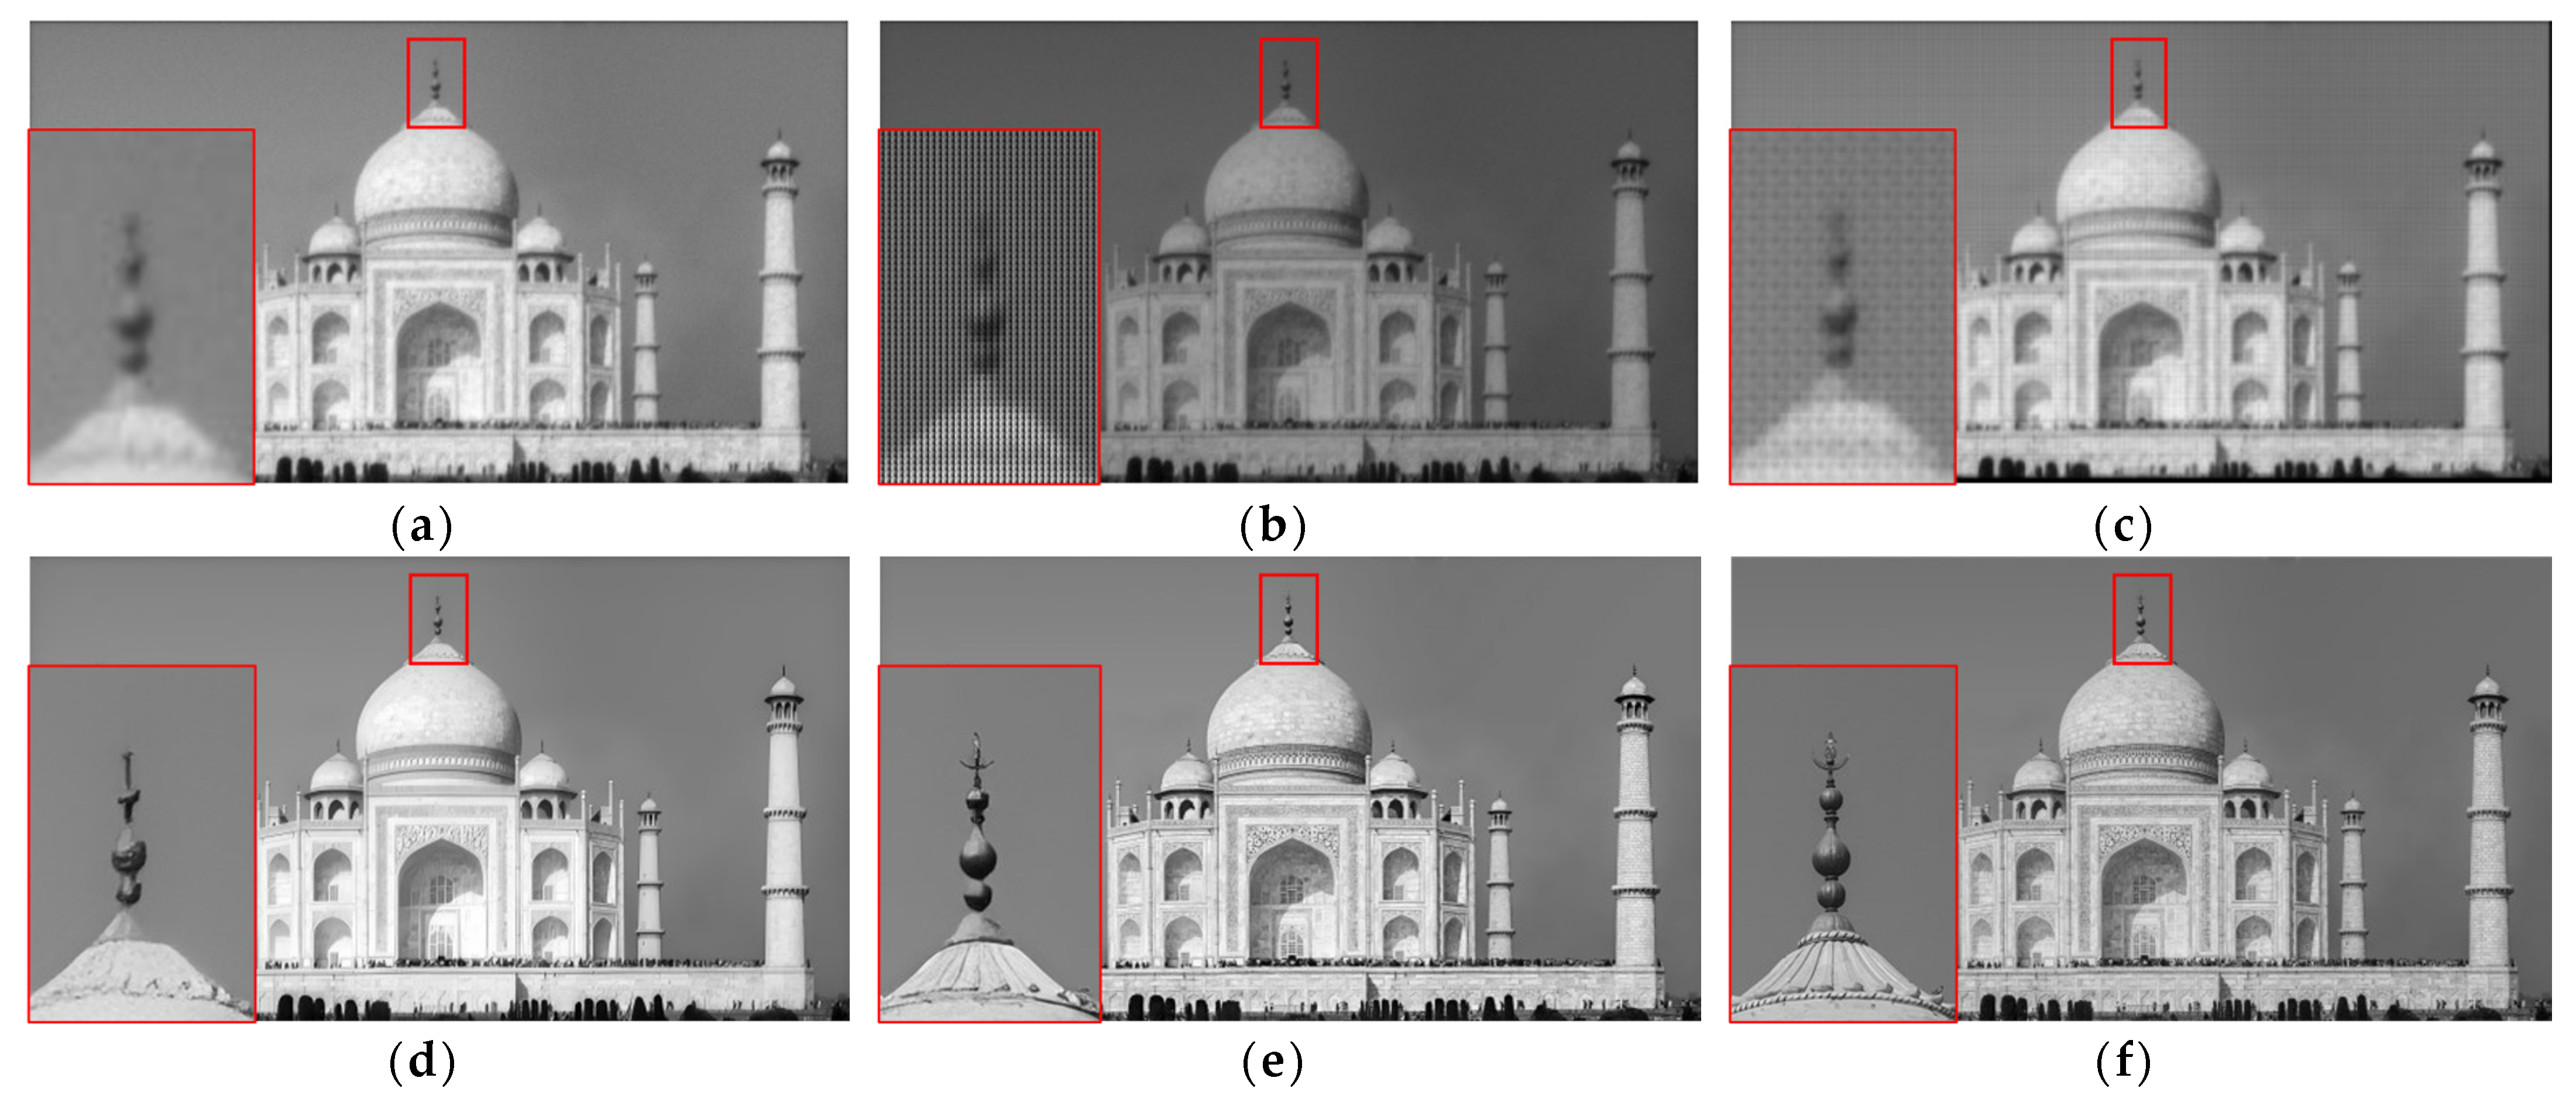
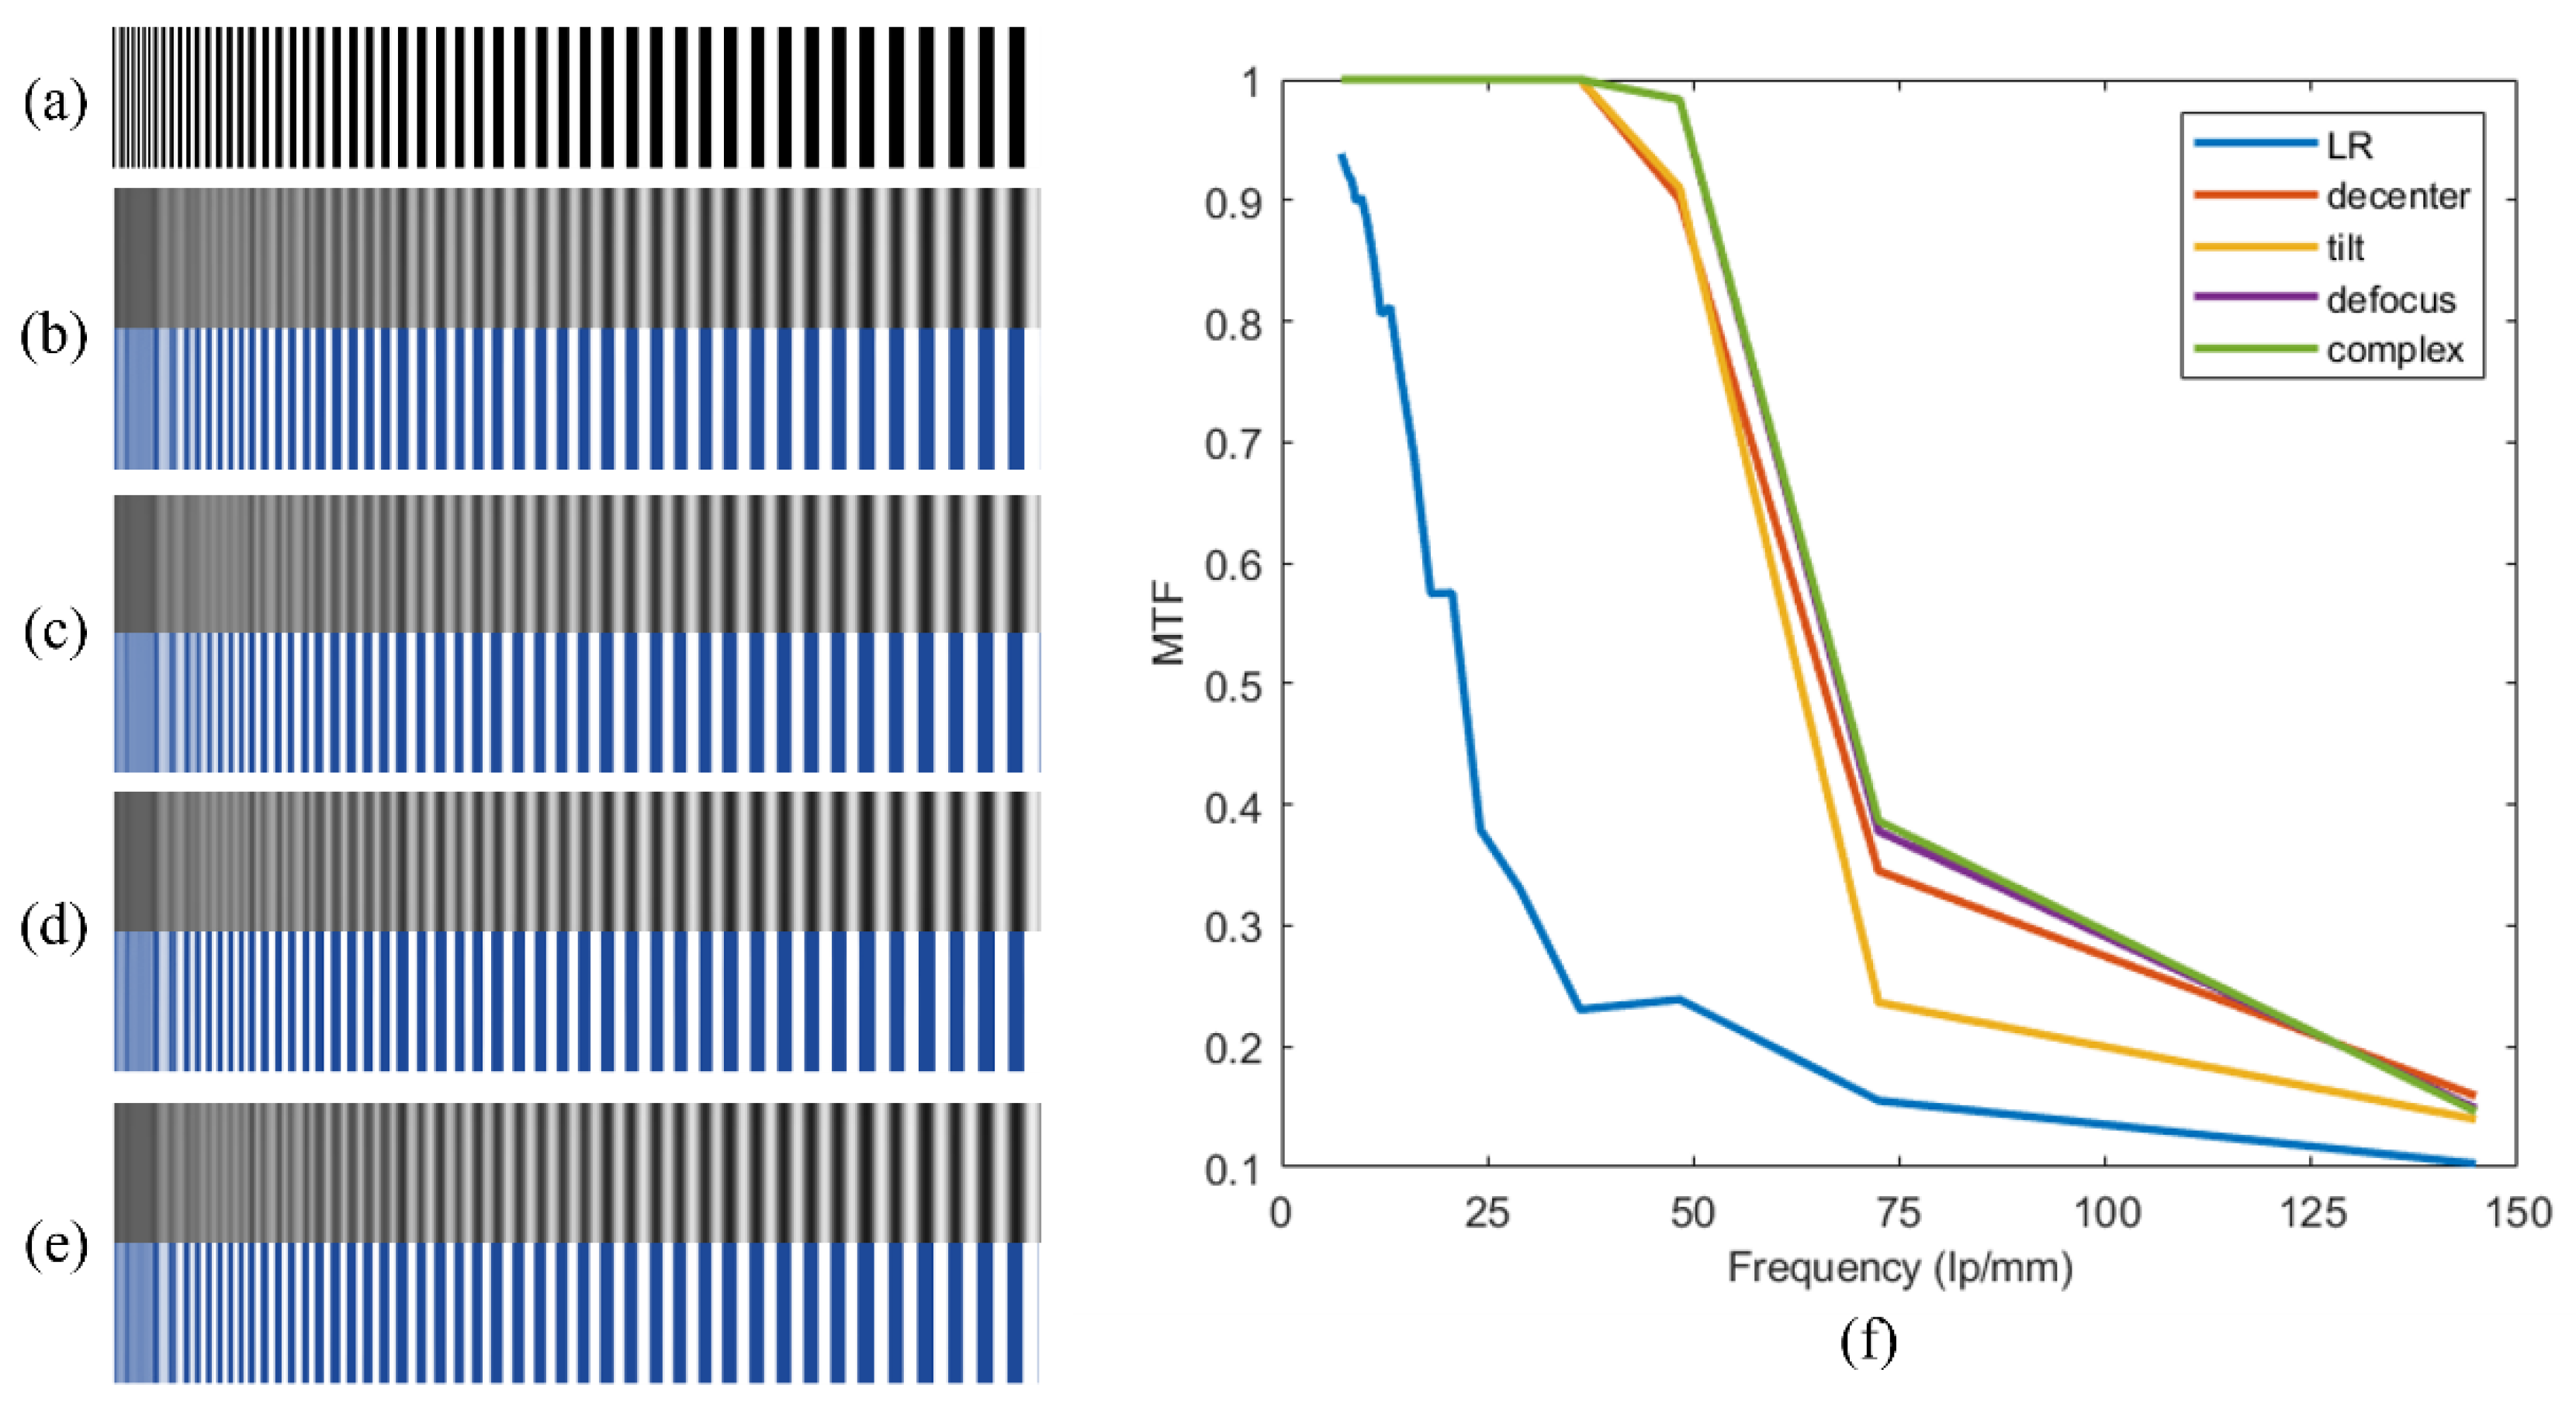
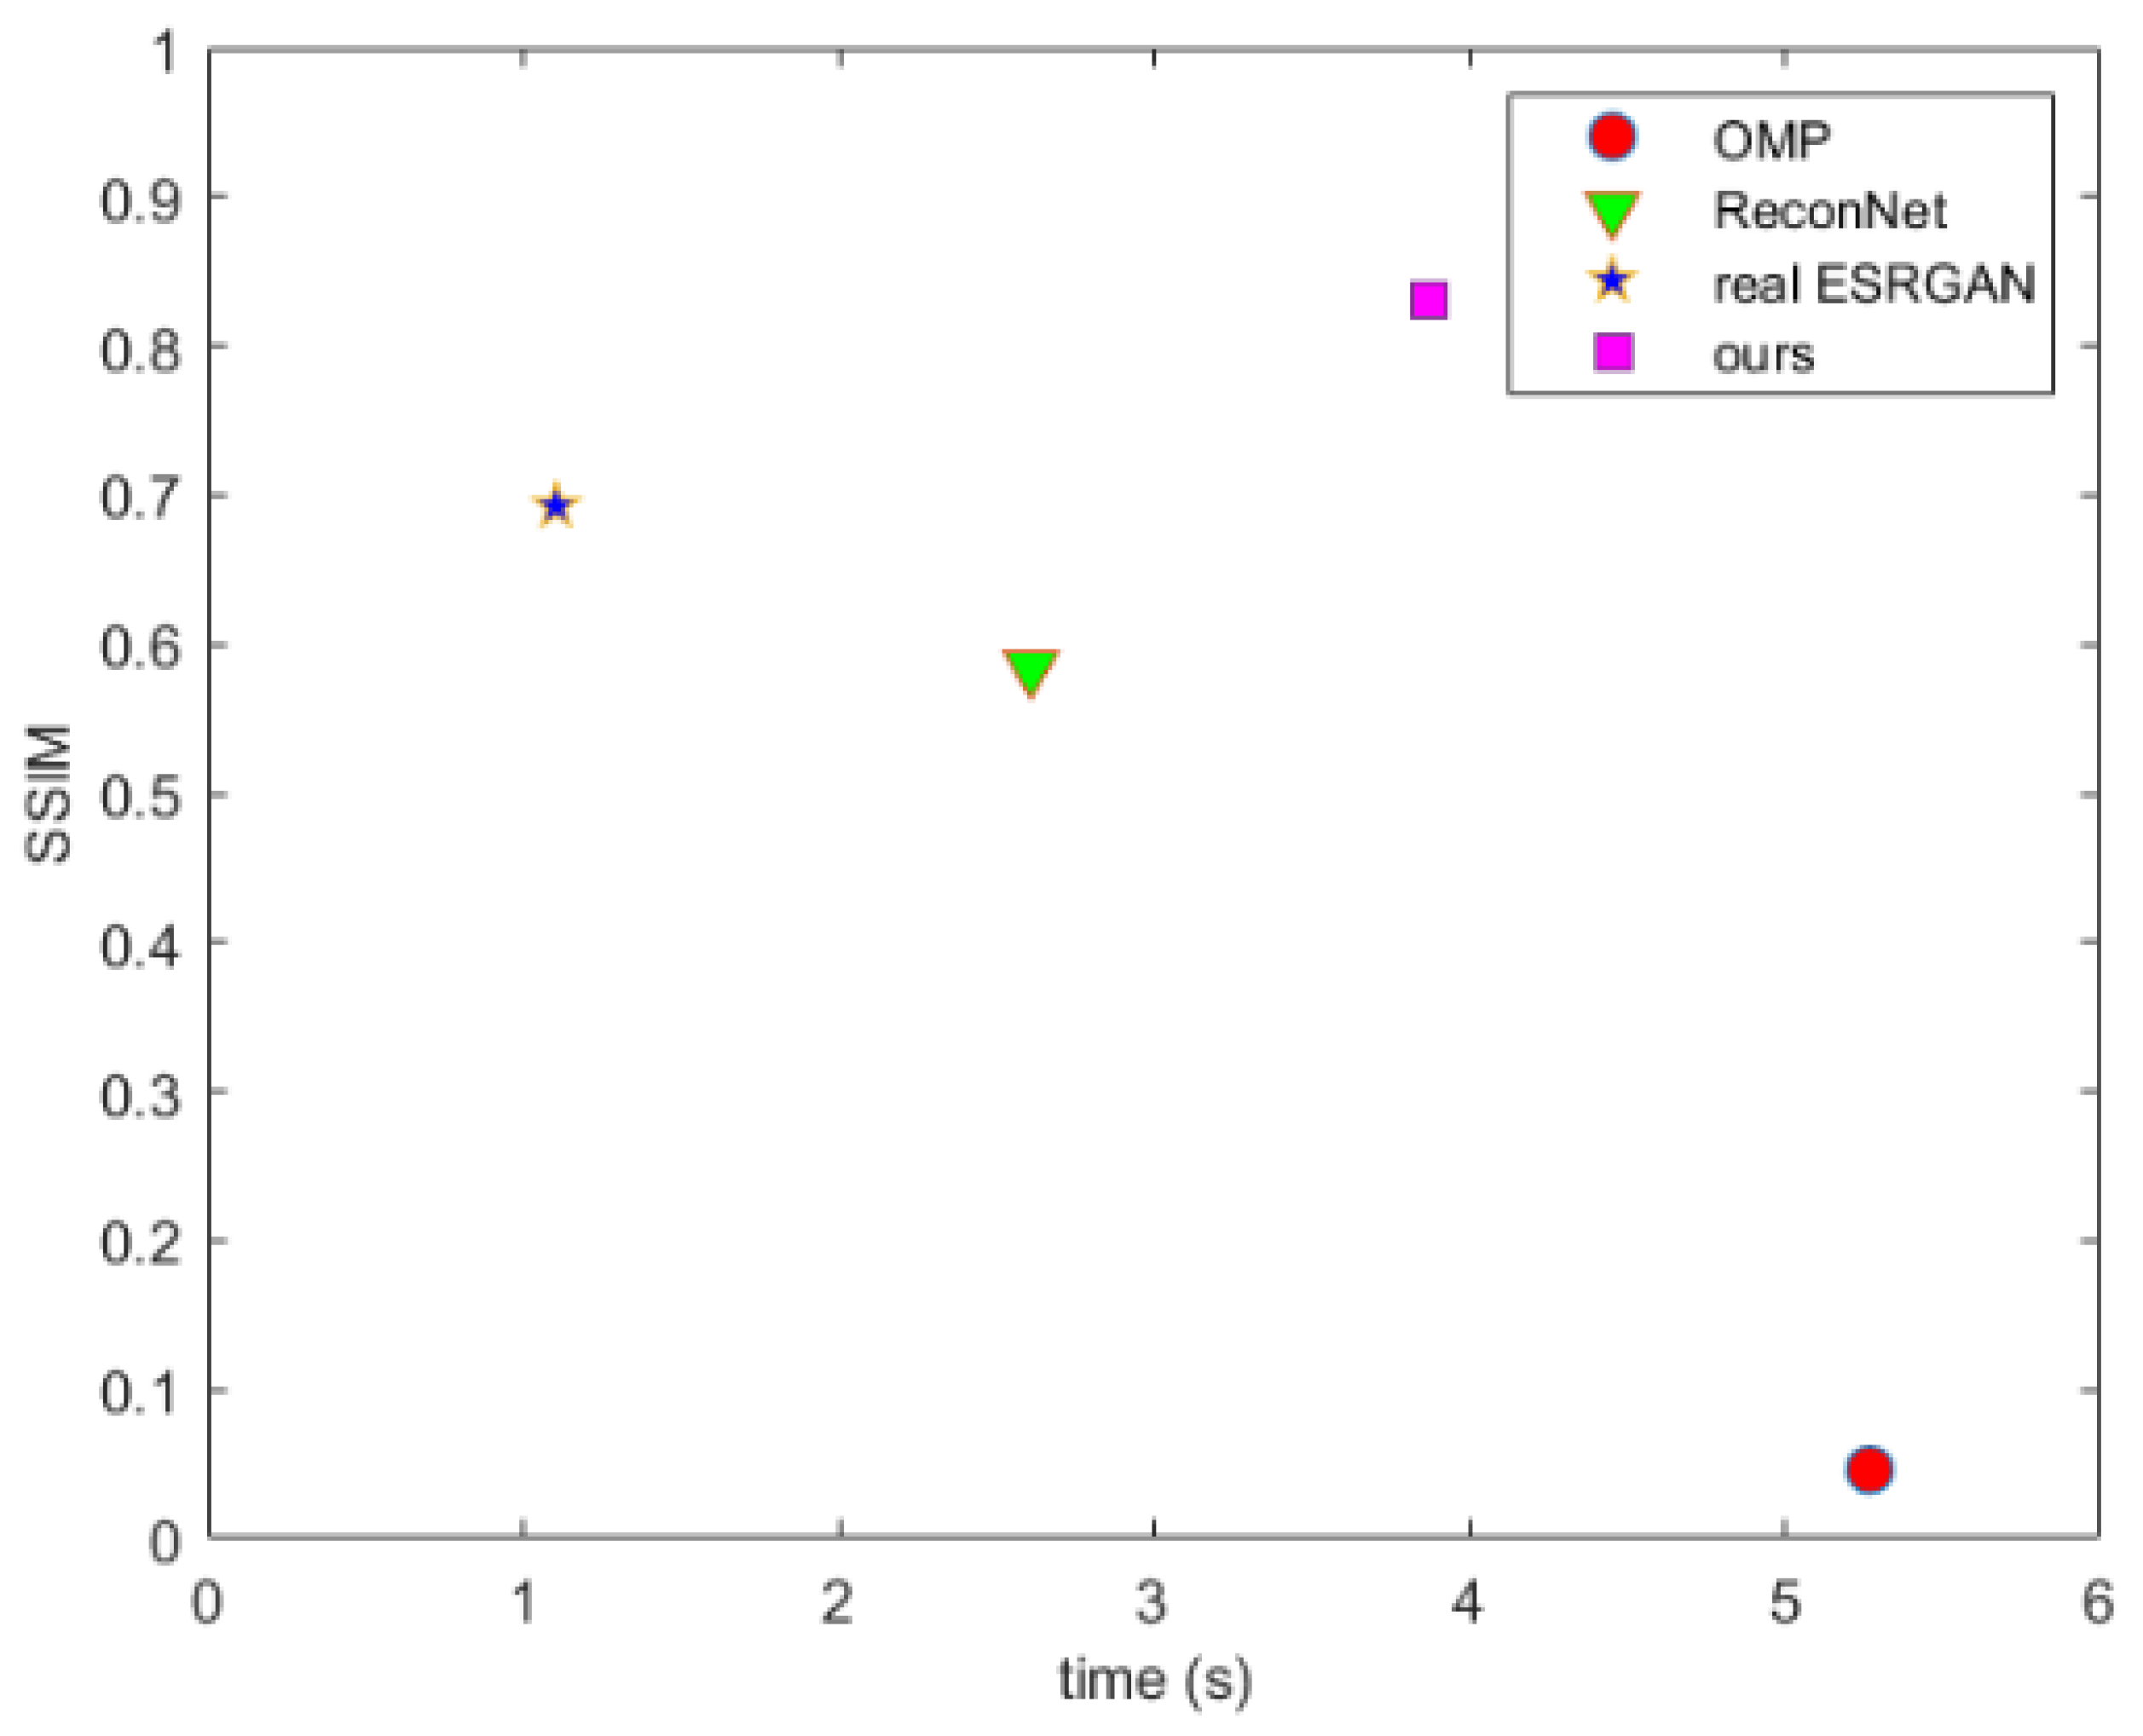
3.1. Simulation
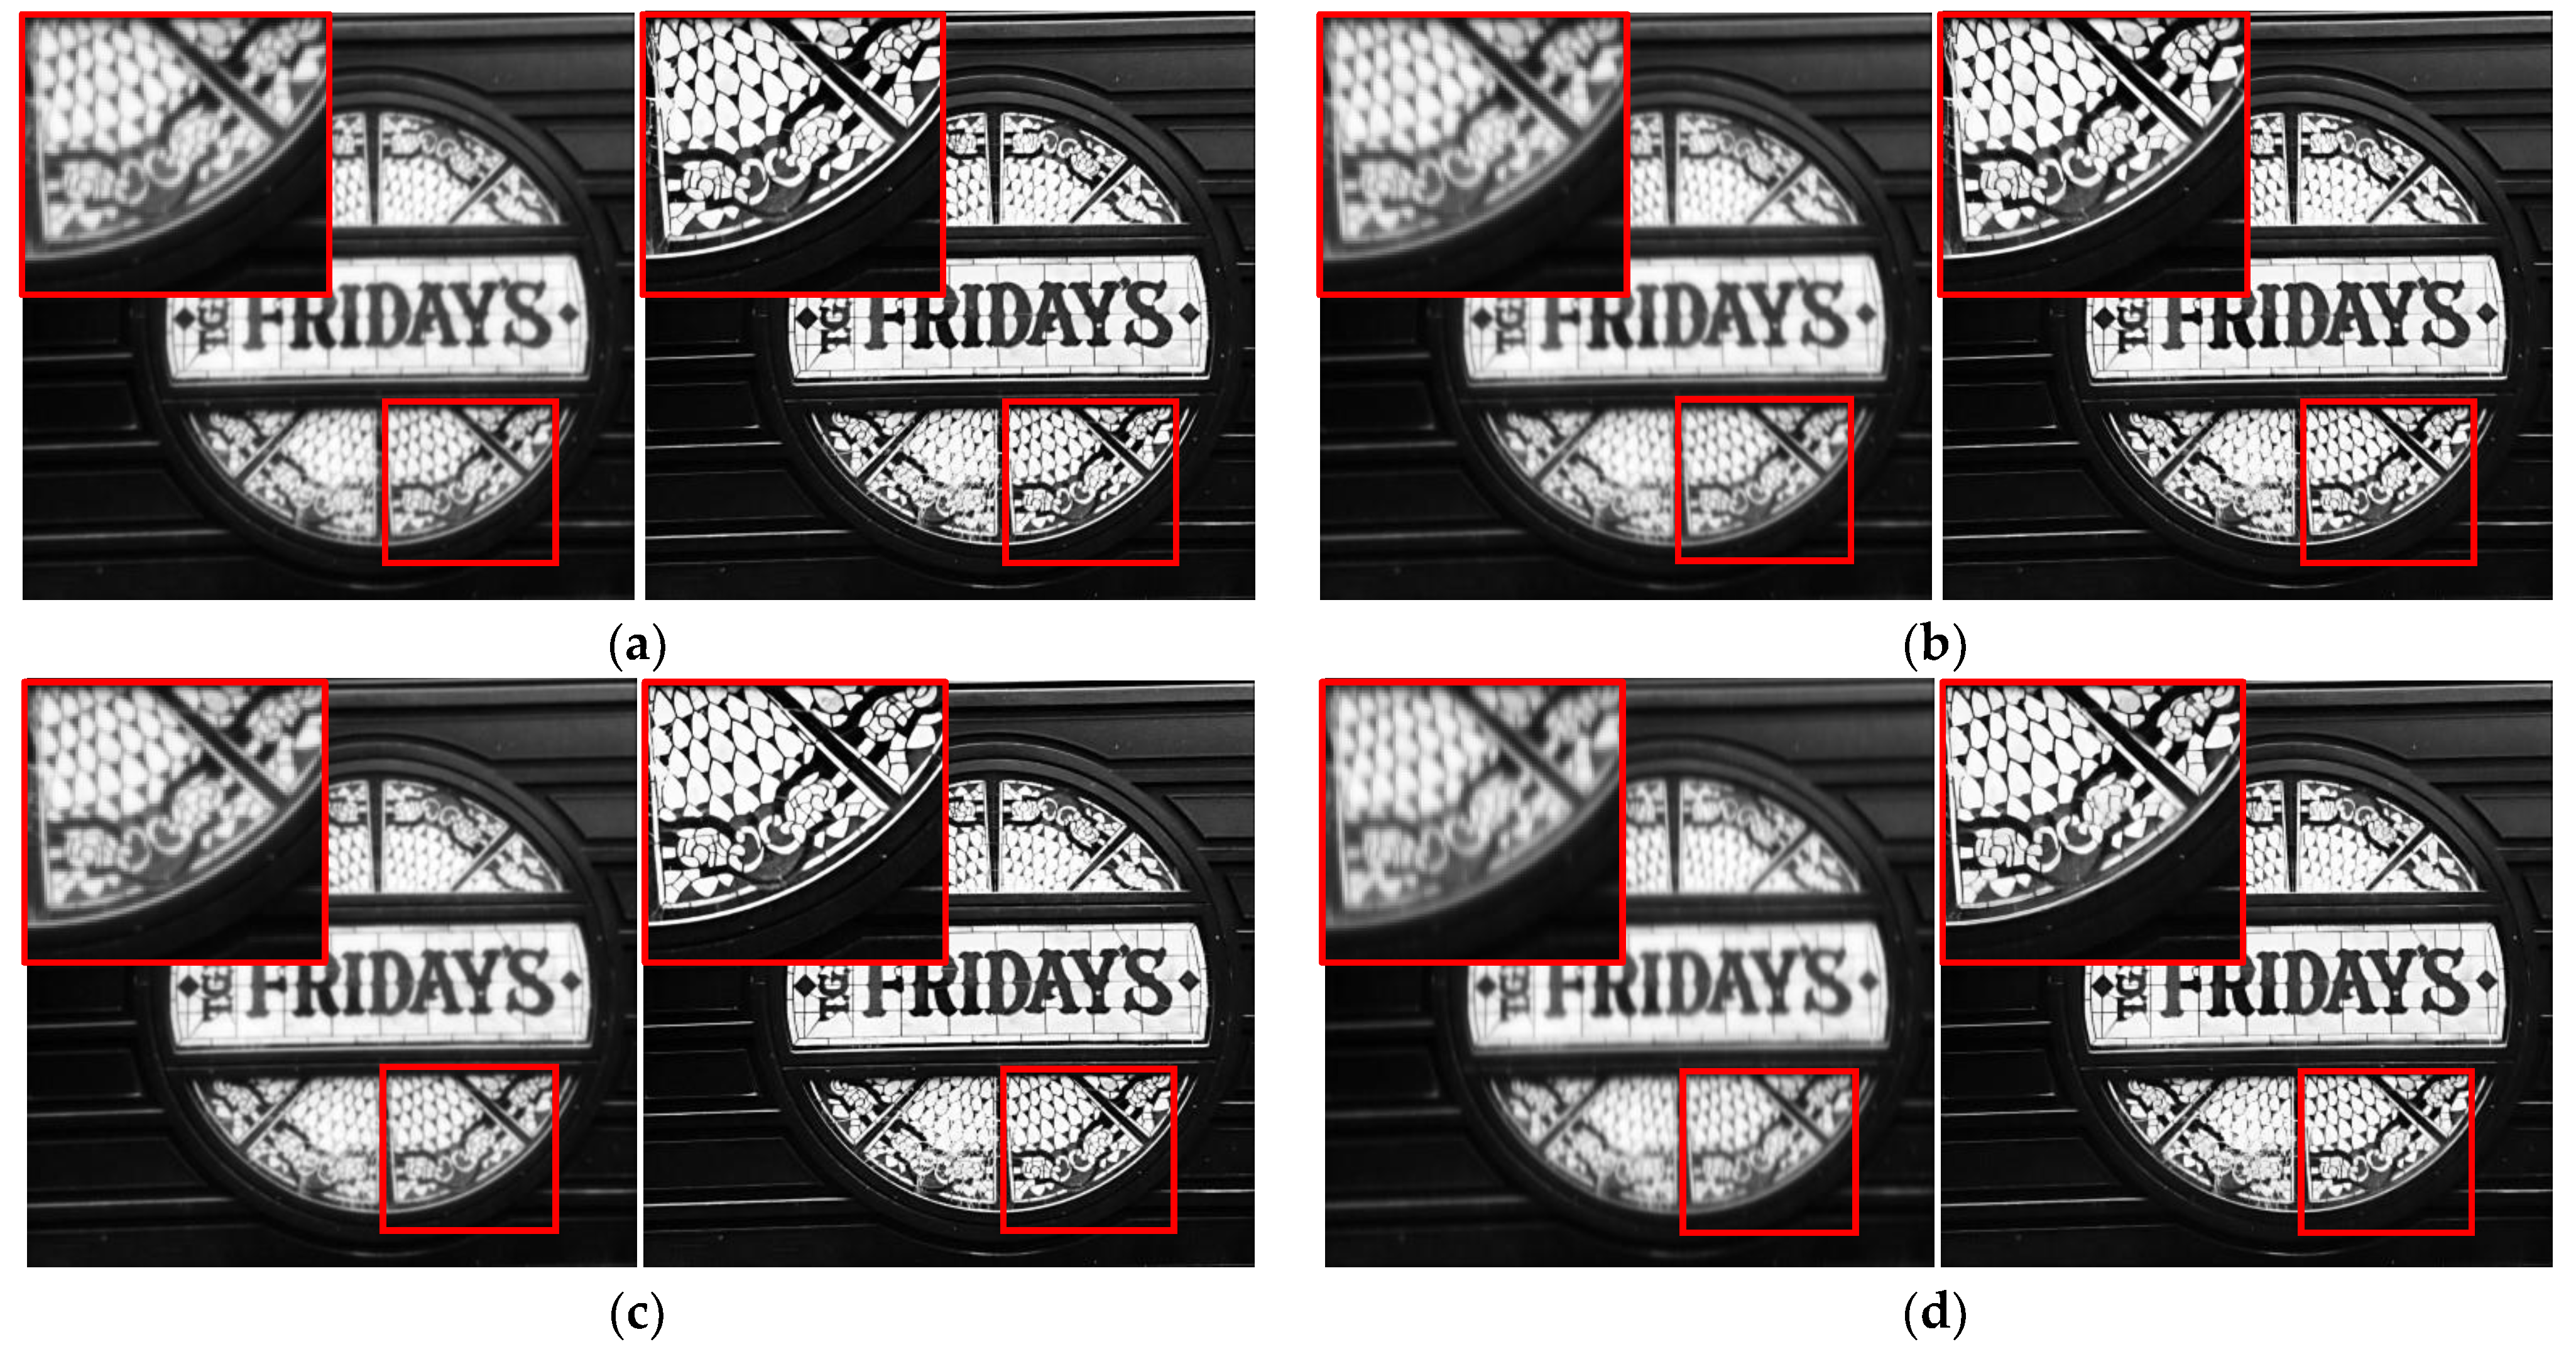
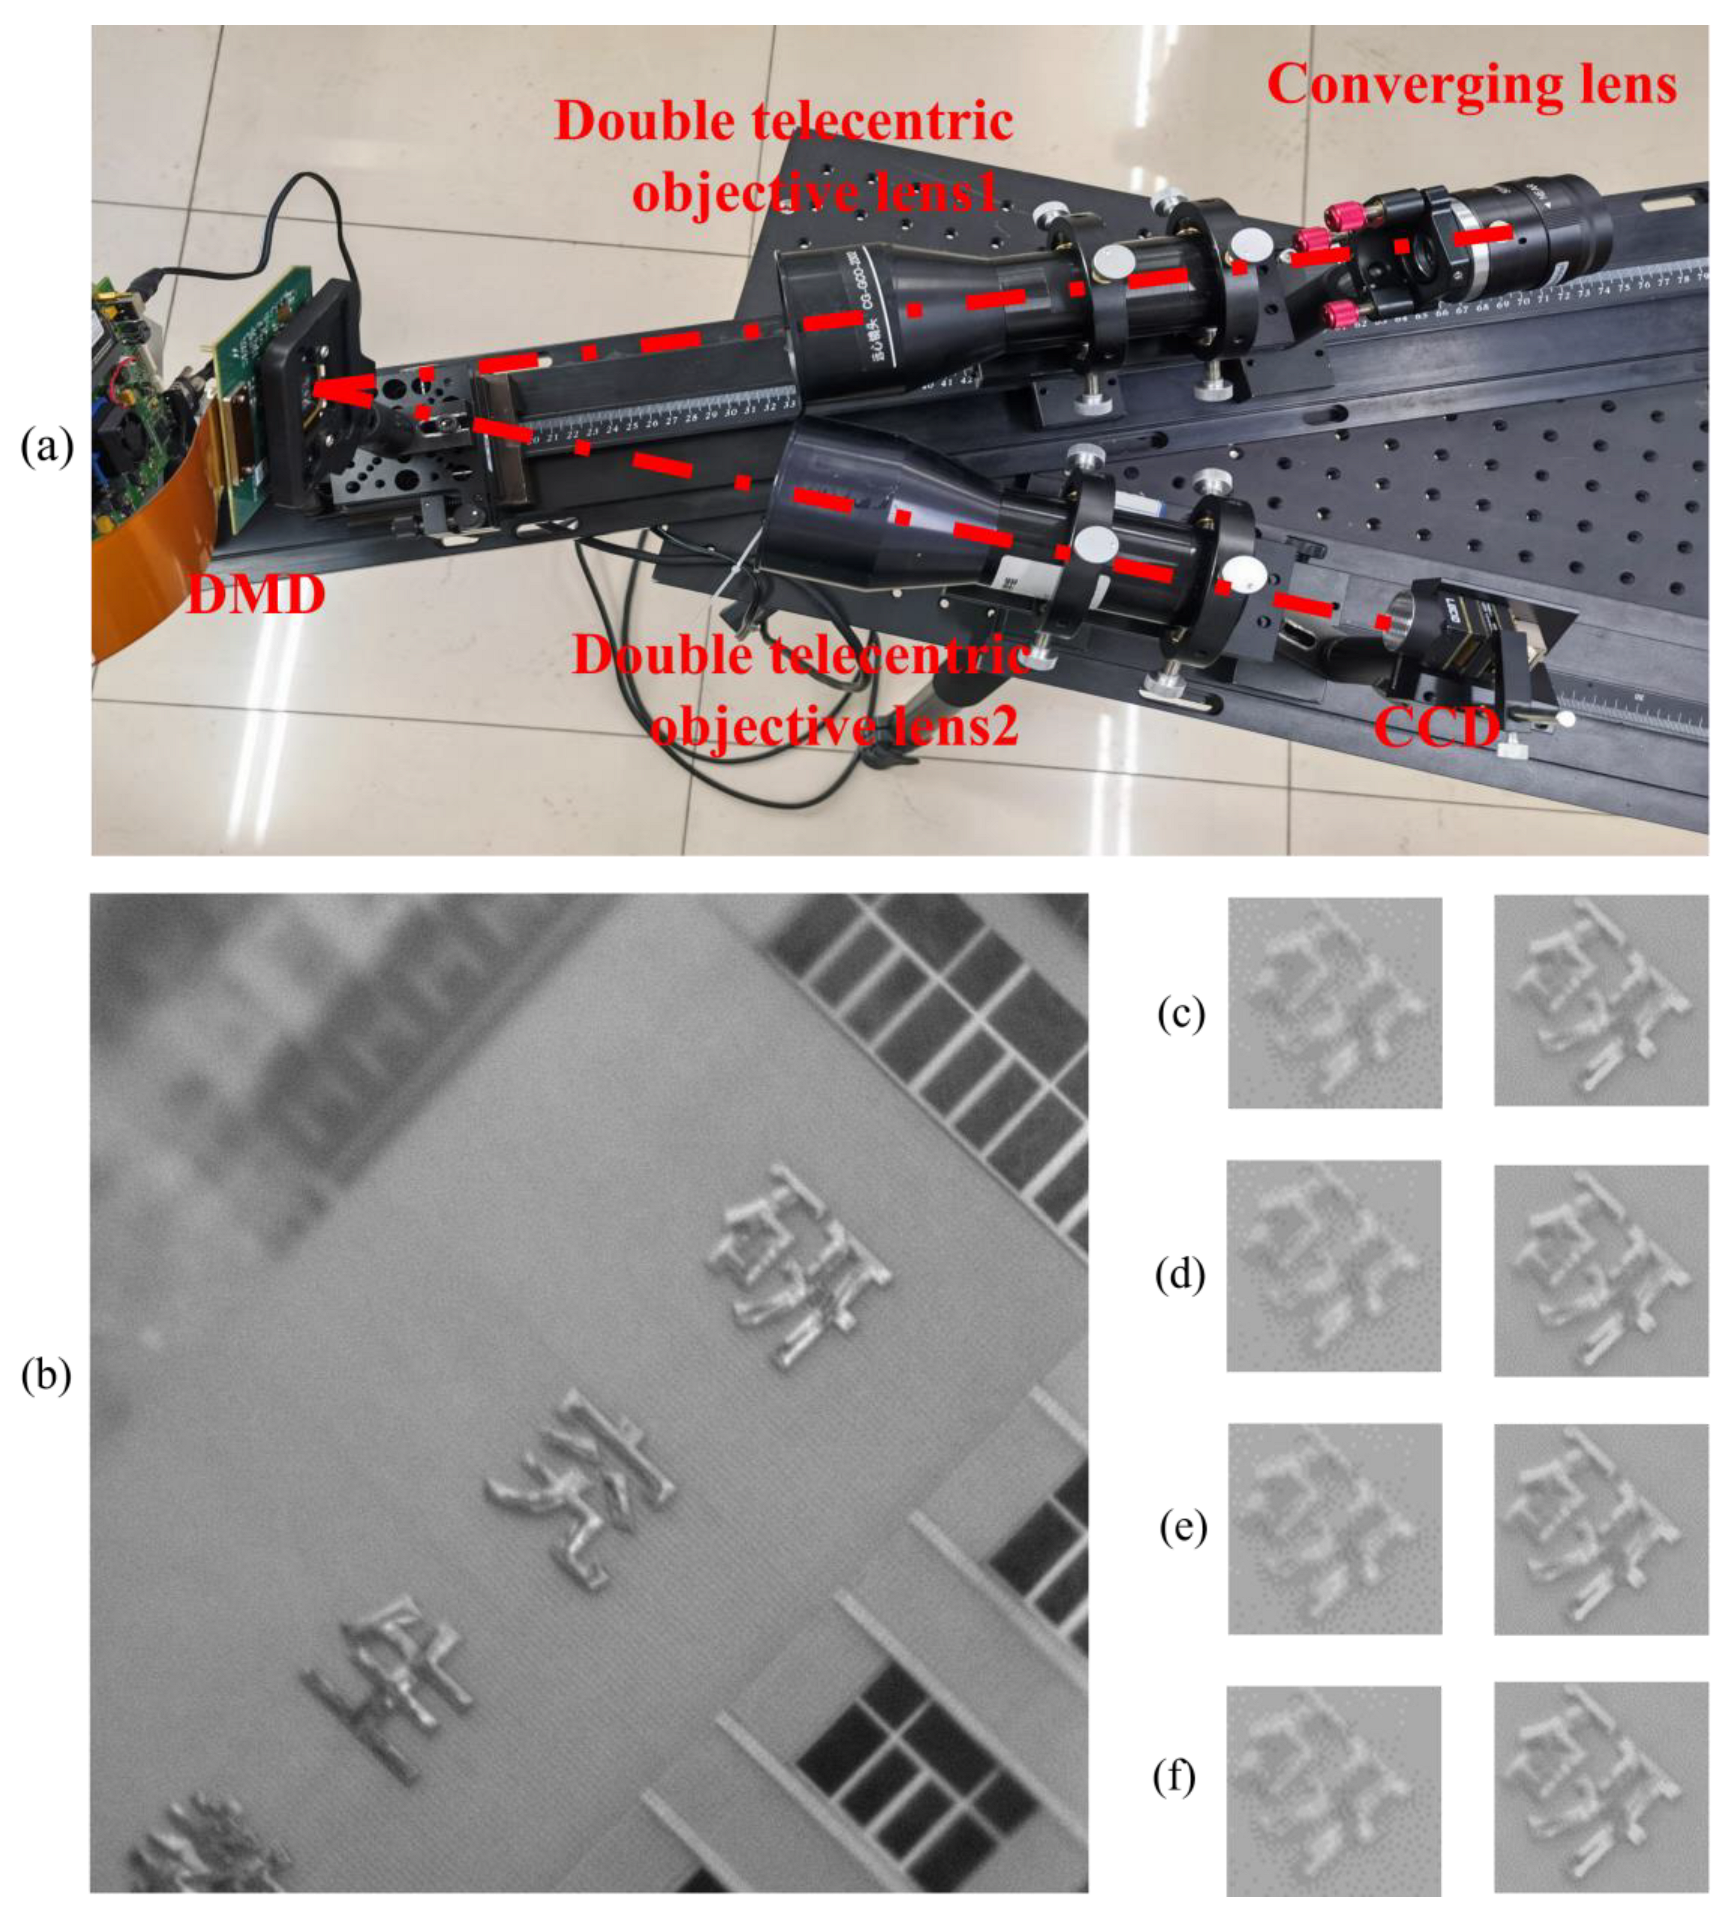
3.2. Experiment
4. Discussion
5. Conclusions
Author Contributions
Funding
Institutional Review Board Statement
Informed Consent Statement
Data Availability Statement
Conflicts of Interest
References
- Ke, J.; Lam, E.Y. Object reconstruction in block-based compressive imaging. Opt. Express 2012, 20, 22102. [Google Scholar] [CrossRef] [PubMed]
- Zhang, X.; Li, C.; Meng, Q.; Liu, S.; Zhang, Y.; Wang, J. Infrared Image Super Resolution by Combining Compressive Sensing and Deep Learning. Sensors 2018, 18, 2587. [Google Scholar] [CrossRef] [PubMed]
- Xu, M.; Wang, C.; Wang, K.; Shi, H.; Li, Y.; Jiang, H. Polarization Super-Resolution Imaging Method Based on Deep Compressed Sensing. Sensors 2022, 22, 9676. [Google Scholar] [CrossRef] [PubMed]
- Wang, F.; Wang, C.; Chen, M.; Gong, W.; Zhang, Y.; Han, S.; Situ, G. Far-field super-resolution ghost imaging with a deep neural network constraint. Light Sci. Appl. 2022, 11, 1. [Google Scholar] [CrossRef] [PubMed]
- Zhang, X.; Xie, J.; Li, C.; Xu, R.; Zhang, Y.; Liu, S.; Wang, J. MEMS-based super-resolution remote sensing system using compressive sensing. Opt. Commun. 2018, 426, 410–417. [Google Scholar] [CrossRef]
- Wang, C.; Xing, S.; Xu, M.; Shi, H.; Wu, X.; Fu, Q.; Jiang, H. The Influence of Optical Alignment Error on Compression Coding Superresolution Imaging. Sensors 2022, 22, 2717. [Google Scholar] [CrossRef] [PubMed]
- Dumas, J.P.; Lodhi, M.A.; Bajwa, W.U.; Pierce, M.C. Computational imaging with a highly parallel image-plane-coded architecture: Challenges and solutions. Opt. Express 2016, 24, 6145–6155. [Google Scholar] [CrossRef] [PubMed]
- Ri, S.; Fujigaki, M.; Matui, T.; Morimoto, Y. Pixel-to-Pixel Correspondence Adjustment in DMD Camera by Moiré Methodology. Exp. Mech. 2006, 46, 67–75. [Google Scholar] [CrossRef]
- Wu, Z.; Wang, X. DMD Mask Construction to Suppress Blocky Structural Artifacts for Medium Wave Infrared Focal Plane Array-Based Compressive Imaging. Sensors 2020, 20, 900. [Google Scholar] [CrossRef] [PubMed]
- Kulkarni, K.; Lohit, S.; Turaga, P.; Kerviche, R.; Ashok, A. ReconNet: Non-Iterative Reconstruction of Images from Compressively Sensed Measurements. In Proceedings of the 2016 IEEE Conference on Computer Vision and Pattern Recognition (CVPR), Las Vegas, NV, USA, 26 June–1 July 2016. [Google Scholar]
- Cui, C.; Ke, J. Spatial compressive imaging deep learning framework using joint input of multi-frame measurements and degraded maps. Opt. Express 2022, 30, 1235. [Google Scholar] [CrossRef] [PubMed]
- Yang, J.; He, Q.; Liu, L.; Qu, Y.; Shao, R.; Song, B.; Zhao, Y. Anti-scattering light focusing by fast wavefront shaping based on multi-pixel encoded digital-micromirror device. Light Sci. Appl. 2021, 10, 149. [Google Scholar] [CrossRef] [PubMed]
- Thompson, K. Description of the third-order optical aberrations of near-circular pupil optical systems without symmetry. J. Opt. Soc. Am. A Opt. Image Sci. Vis. 2005, 22, 1389–1401. [Google Scholar] [CrossRef] [PubMed]
- Lohit, S.; Kulkarni, K.; Kerviche, R.; Turaga, P.; Ashok, A. Convolutional Neural Networks for Noniterative Reconstruction of Compressively Sensed Images. IEEE Trans. Comput. Imaging 2018, 4, 326–340. [Google Scholar] [CrossRef]
- Wang, X.; Xie, L.; Dong, C.; Shan, Y. Real-ESRGAN: Training Real-World Blind Super-Resolution with Pure Synthetic Data. In Proceedings of the 2021 IEEE/CVF International Conference on Computer Vision Workshops (ICCVW), Montreal, QC, Canada, 11–17 October 2021; pp. 1905–1914. [Google Scholar]


| Parameter | Value |
|---|---|
| Wavelength/nm | 390–780 |
| FOV(X/Y)/(◦) | 2.2°/2.2° |
| F/# | 1 |
| DMD array size/pixel | 1024 × 1024 |
| DMD pixel size/µm | 7.6 |
| Detector pixel size/µm | Detector pixel size/µm |
| 3.45 | 3.45 |
| Detector array size/pixel | 256 × 256 |
| CS Rate | 1/16 | 1/8 | 1/4 |
|---|---|---|---|
| PSNR/SSIM | 23.3149/0.7649 | 26.9589/0.8846 | 28.0675/0.8723 |
| Decenter | Tilt | Defocus | Complex | |
|---|---|---|---|---|
| OMP | 12.6821/0.0462 | 12.6631/0.0448 | 12.6633/0.0475 | 12.6673/0.0434 |
| Reconnet | 21.4278/0.5843 | 21.2601/0.5772 | 21.6159/0.5902 | 20.8833/0.5720 |
| Real-ESRGAN | 18.6232/0.6923 | 18.3760/0.6733 | 18.8864/0.6923 | 17.7600/0.6604 |
| Ours | 24.6103/0.8305 | 23.6994/0.8108 | 23.6765/0.8201 | 23.4484/0.7983 |
Disclaimer/Publisher’s Note: The statements, opinions and data contained in all publications are solely those of the individual author(s) and contributor(s) and not of MDPI and/or the editor(s). MDPI and/or the editor(s) disclaim responsibility for any injury to people or property resulting from any ideas, methods, instructions or products referred to in the content. |
© 2023 by the authors. Licensee MDPI, Basel, Switzerland. This article is an open access article distributed under the terms and conditions of the Creative Commons Attribution (CC BY) license (https://creativecommons.org/licenses/by/4.0/).
Share and Cite
Xu, M.; Wang, C.; Shi, H.; Fu, Q.; Li, Y.; Dong, L.; Jiang, H. Deep Compressed Super-Resolution Imaging with DMD Alignment Error Correction. Photonics 2023, 10, 581. https://doi.org/10.3390/photonics10050581
Xu M, Wang C, Shi H, Fu Q, Li Y, Dong L, Jiang H. Deep Compressed Super-Resolution Imaging with DMD Alignment Error Correction. Photonics. 2023; 10(5):581. https://doi.org/10.3390/photonics10050581
Chicago/Turabian StyleXu, Miao, Chao Wang, Haodong Shi, Qiang Fu, Yingchao Li, Lianqing Dong, and Huilin Jiang. 2023. "Deep Compressed Super-Resolution Imaging with DMD Alignment Error Correction" Photonics 10, no. 5: 581. https://doi.org/10.3390/photonics10050581