Article

Simultaneous and Multiplexed Measurement of Curvature and Strain Based on Optical Fiber Fabry-Perot Interferometric Sensors

1
Research Center for Optical Fiber Sensing, Zhejiang Laboratory, Hangzhou 311100, China
2
Department of Electrical Engineering, College of Engineering, King Saud University, Riyadh 11421, Saudi Arabia
3
Department of Electrical and Computer Engineering, Missouri University of Science and Technology, Rolla, MO 65401, USA
*
Author to whom correspondence should be addressed.
Photonics 2023, 10(5), 580; https://doi.org/10.3390/photonics10050580
Submission received: 29 March 2023 / Revised: 24 April 2023 / Accepted: 10 May 2023 / Published: 16 May 2023
(This article belongs to the Special Issue Optical Fiber Physical and Mechanical Sensors)

Abstract

:
Optical fiber sensors that have a compact size and the capability for multi-parameter sensing are desired in various applications. This article reports a miniaturized optical fiber Fabry-Perot interferometric sensor with a length of hundreds of µm that is able to simultaneously measure variations of curvature, temperature, and strain. The sensor is easy to fabricate, requiring only the fusion splicing of a short section of the silica capillary tube between two single-mode fibers (SMFs). The combined mechanism of the Fabry-Perot interference occurred in the two interfaces between the capillary and the SMFs, and the antiresonant guidance induced by the capillary tube makes the device capable of realizing multi-parameter sensing. A simplified coefficient matrix approach is developed to decouple the contributions from different parameters. In addition, the capability of the device for multiplexing is investigated, where four such prototypes with different air cavity lengths are multiplexed in a system in parallel. The spectral behavior of an individual device for measuring curvature and strain is reconstructed and investigated, showing reliable responses and little crosstalk between different devices. The proposed device is easy to fabricate, cost-effective, robust, and could find potential applications in the field of structural health monitoring and medical and human–machine interactive sensing.

1. Introduction

The measurements of bending/curvature play a significant role in a diverse array of fields, ranging from mechanical engineering and structural health monitoring to medical and human–machine interface applications [1,2,3,4,5]. The tremendous growth and advancement of optical fiber sensing technologies was witnessed in recent decades due to their distinctive advantages over conventional mechanical and electrical sensors, including being lightweight, diminutive in size, immune to electromagnetic interference, resistant to corrosion, and having multiplexing and remote operation capabilities [6,7]. Optical fiber sensors devoted to measuring bending/curvature have also attracted extensive research attention in recent years.
Among various types of optical fiber curvature sensors, the modal interferometer-based sensor is one of the most widely explored configurations. The construction of an optical fiber modal interferometer is quite simple, involving the fusion splicing of mode exciters between two single-mode fibers (SMFs, one lead-in fiber, and one lead-out fiber). When the interferometer is bent, the effective distribution of the refractive index in the fiber section varies, leading to a spectral shift in the transmission characteristic of the device. By tracking bending-induced changes in the transmission spectrum, a modal interferometer can be used as a curvature sensor after proper calibration. Different types of optical fibers, typically with a different mode field diameter compared to an SMF, have been employed as mode exciters, including multimode fibers [8,9,10,11], multi-core fibers [8,9,10,12,13,14,15,16], thin-core fibers [17,18], photonic crystal fibers [19,20], and hollow-core fibers [21,22,23,24]. In addition, specially designed fusion-splicing processes, such as lateral-offset splicing and tapering, were also used to fabricate mode exciters [1,25]. It is worth mentioning that the SMS device (the single mode-multimode-single mode fiber structure), arguably one of the simplest optical fiber interferometers, was also investigated for high-performance curvature sensing. By carefully tailoring the length of the sandwiched multimode fiber, an ultra-high measurement sensitivity was achieved [26]. Meanwhile, due to the multiple fringe dips in the transmission spectrum of the device, the simultaneous measurement of curvature and temperature was realized based on a coefficient matrix calibration method [27]. On the other hand, the hollow-core fiber (HCF)-assisted curvature sensor with a single mode–hollow core–single mode (SHS) fiber configuration represents a relatively new sensing modality based on the antiresonant guidance mechanism. The intensity of the antiresonant guidance signal in the HCF section was highly sensitive to bending, making the SHS structure a great candidate for temperature-insensitive curvature sensing [21,24,28]. Moreover, the multi-physics coexisting SHS structure has also made multi-parameter sensing possible based on separately analyzing trivial changes in the superimposed spectrum of the device [29,30]. However, the majority of the previously mentioned modal interferometer-based optical fiber curvature sensors are relatively large in size (e.g., at least a few mm in length), and operate in a transmission mode, making it difficult for deployment in real-world scenarios. Meanwhile, the capability of these modal interferometer-based sensors for multiplexing has yet to be demonstrated.
The Fabry–Perot interferometer (FPI) is one of the most widely used devices in various photonic applications, such as sensing [31], lasering [32,33], optical filtering [34], etc. With the implementation of the FPI using optical fibers, a unique family of optical sensors, i.e., the optical fiber FPI sensors, has emerged [31,35,36,37]. In comparison with the aforementioned modal interferometers, the fiber in-line FPI device is featured in its high sensitivity, small size (typically, a few hundred µm or less in length), reflection-working fashion, and importantly, its capability to multiplex. The potential of the FPI device for curvature sensing has been previously explored. Ouyang et al. reported a dual air-cavity FPI to realize the simultaneous measurement of curvature and strain [38]. The device fabrication is relatively complicated, requiring the integration of multiple segments of different optical fibers (e.g., a multimode fiber, a seven-core fiber, and a dual side-hole fiber). Leal-Junior et al. demonstrated a complete study of ultraviolet-curable resins-based FPI devices for curvature measurements [39]. The sensor structure is simple; the FPI was generated by filling an air gap between two SMFs with the resin, but the mechanical robustness and repeatability of the device are concerned. Xu et al. investigated an approach to increase the sensitivity of a simple silica tube-based FPI device for bending sensing [40]. By incorporating a Fabry–Perot cavity during the fusion splicing process of connecting two multimode fibers, a high-sensitivity curvature sensor in a medical needle was demonstrated [41]. However, the ability of the FPI device to multiplex for multi-point curvature sensing has not been considered yet.
In this article, we propose and experimentally demonstrate a sensor system for multi-point curvature measurements based on multiplexed optical fiber FPI sensors. The proposed FPI sensor is easy to fabricate, only involving the fusion splicing of a section of a capillary tube between a lead-in SMF and a lead-out SMF. Bending the FPI device results in trackable changes in its reflection spectrum (mostly variations in intensity). The capability of the FPI sensor to discriminate strain and curvature is investigated. The temperature crosstalk of the sensor is also discussed. By integrating a few such FPI devices with different cavity lengths, multi-point curvature sensing can thus be achieved.
The paper is organized as follows. In Section 2, the working principle of the FPI sensor is discussed. The experimental apparatus used to apply variations of curvature, strain, and temperature in the proof-of-concept demonstration is given. In Section 3, the responses of a prototype FPI device to variations of curvature are first demonstrated. The responses of the device to changes in strain and temperature are also investigated. Next, four such FPI devices with different cavity lengths are multiplexed in a system, and the curvature responses of an individual FPI are tested. All the experimental results are given in detail. Section 4 concludes this paper.

2. Materials and Methods

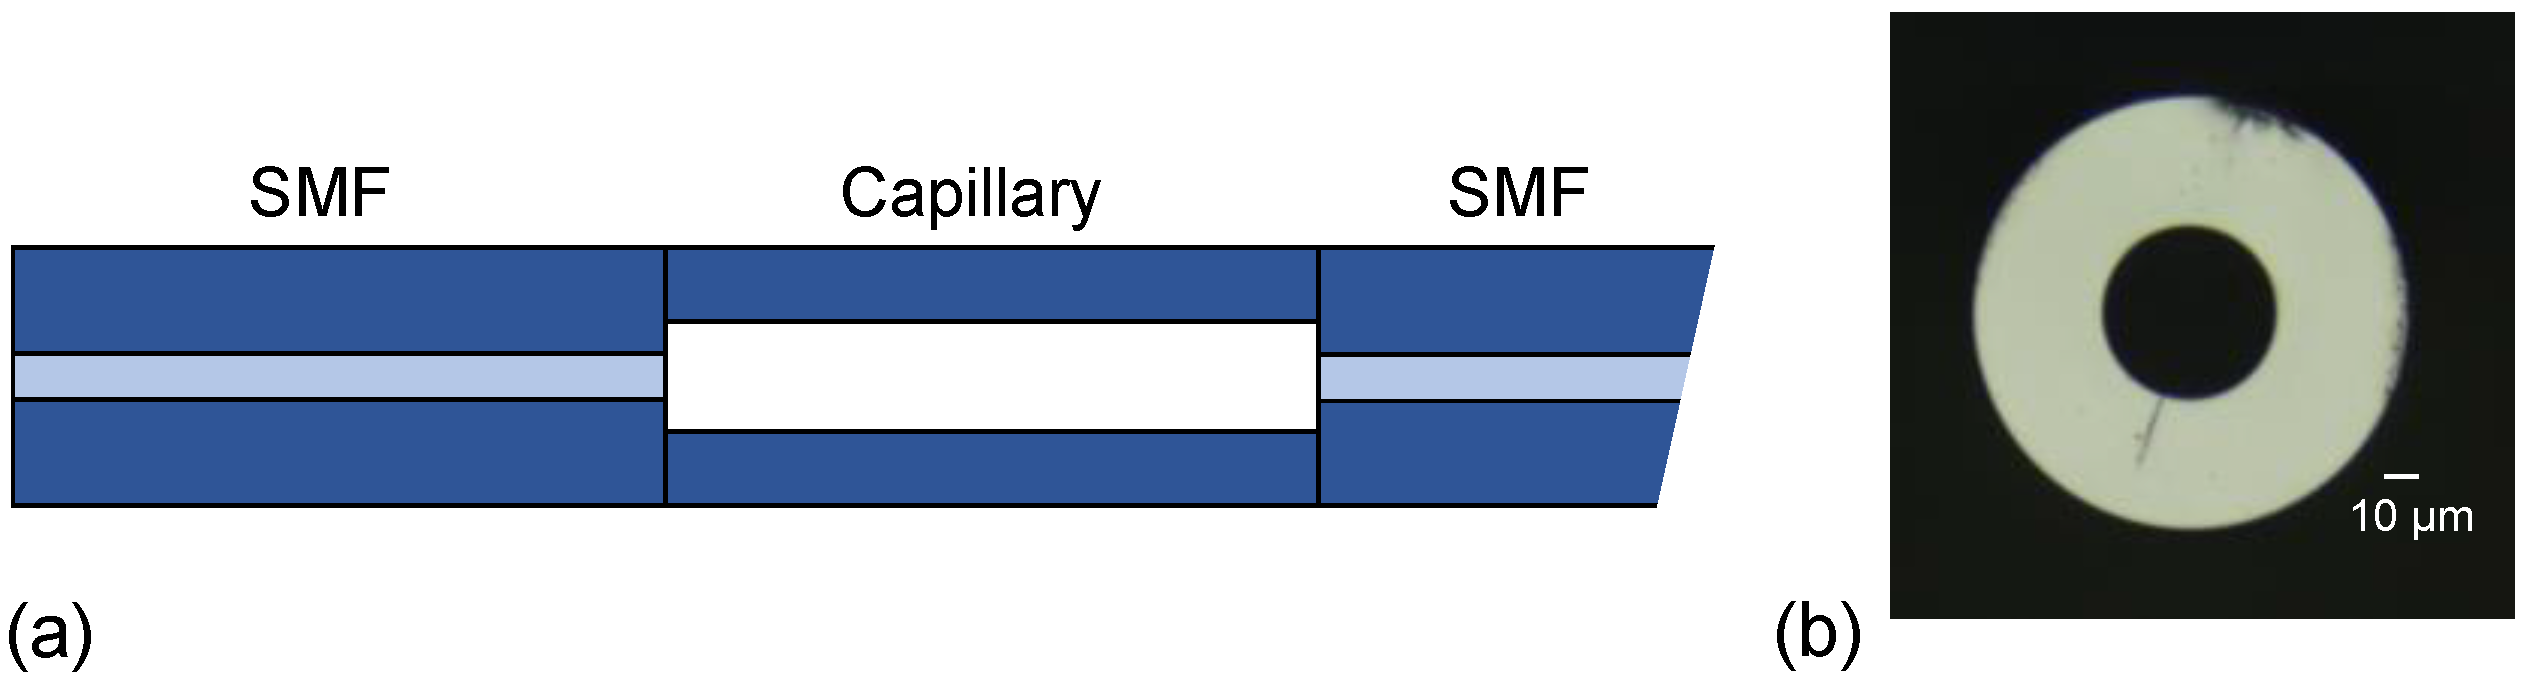
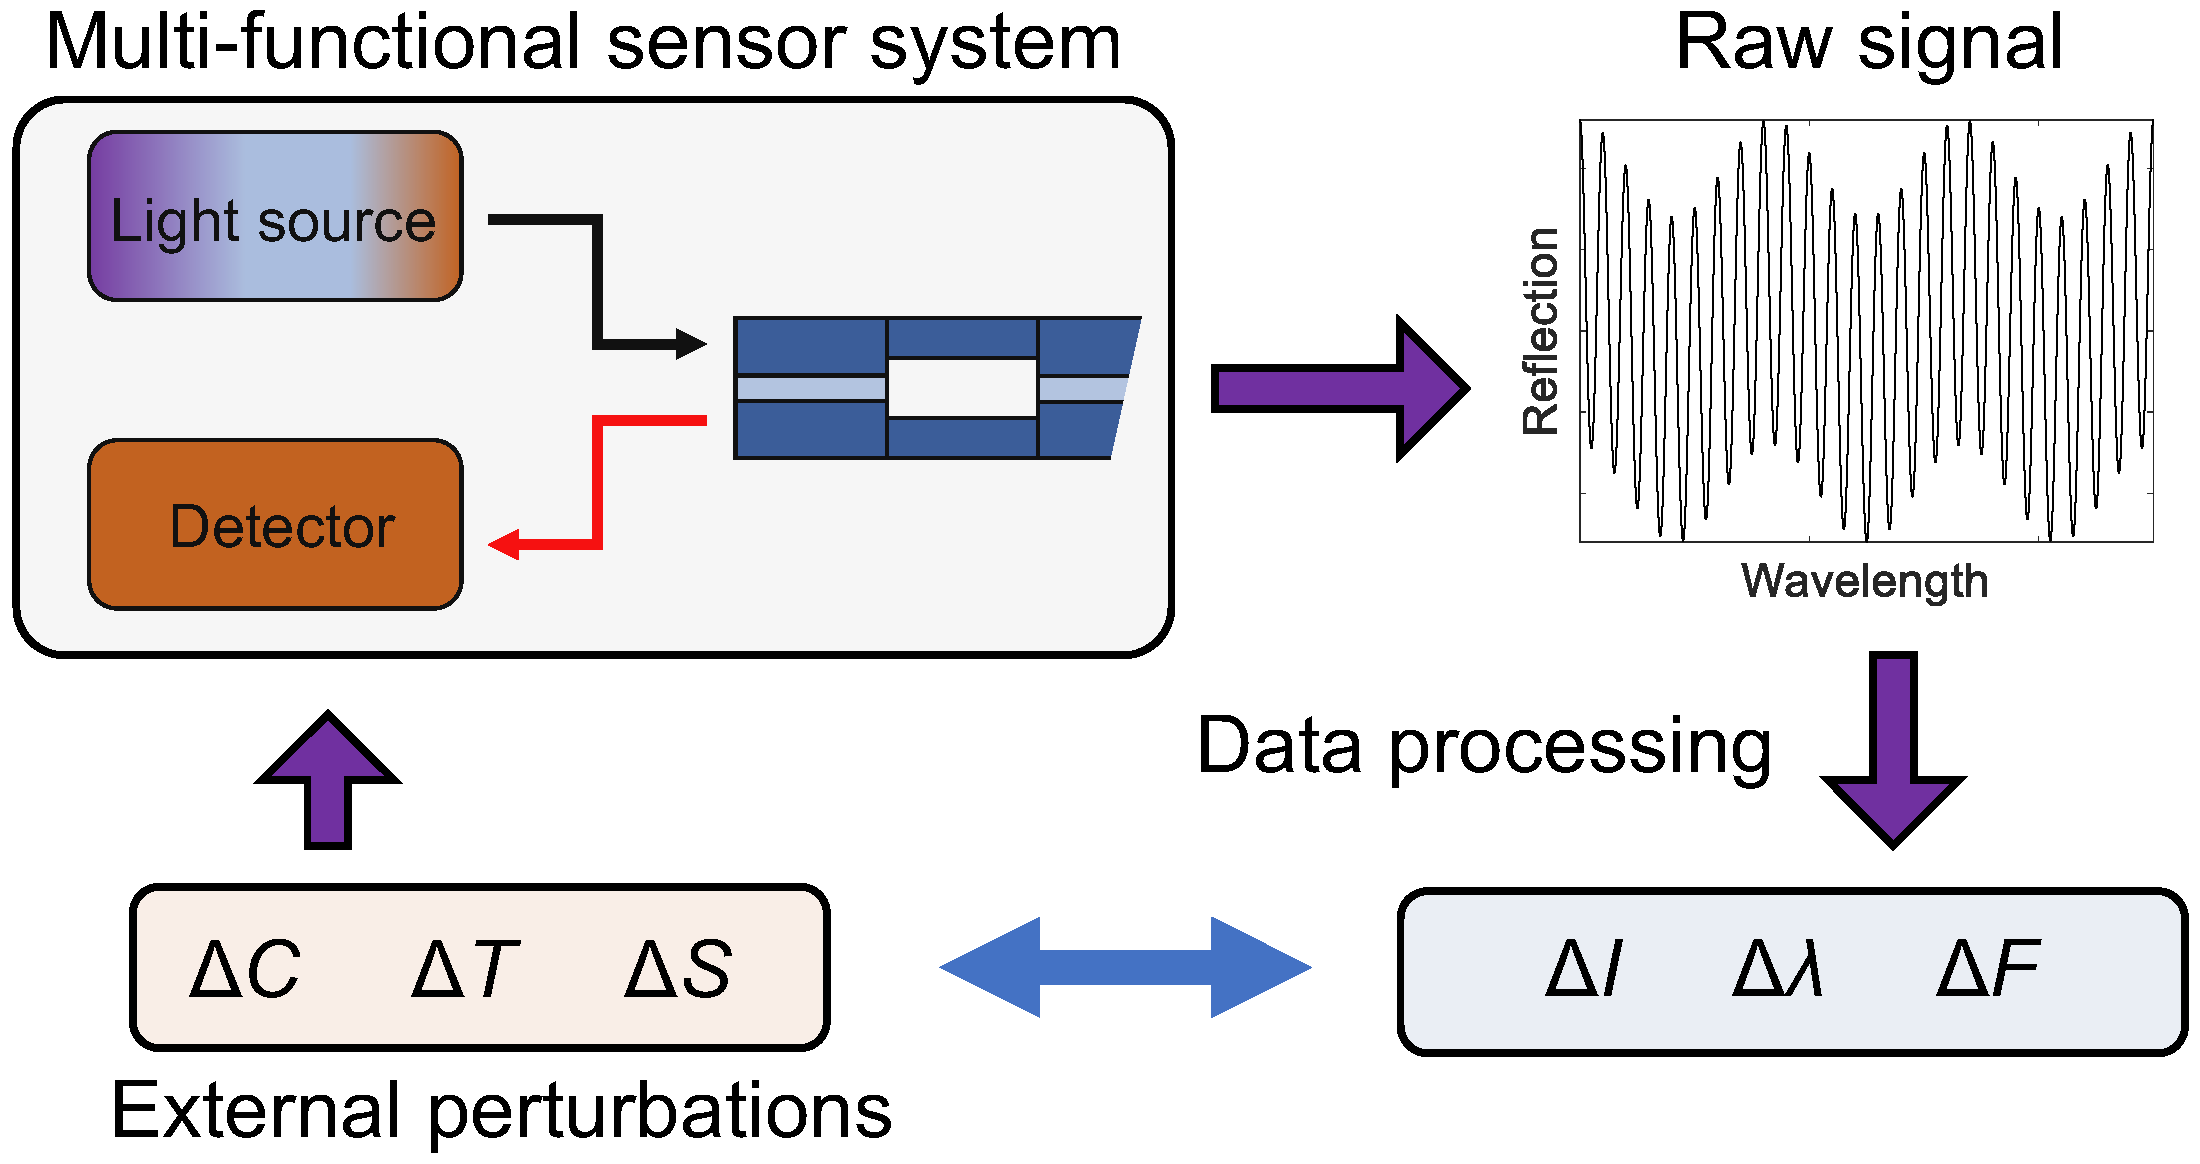
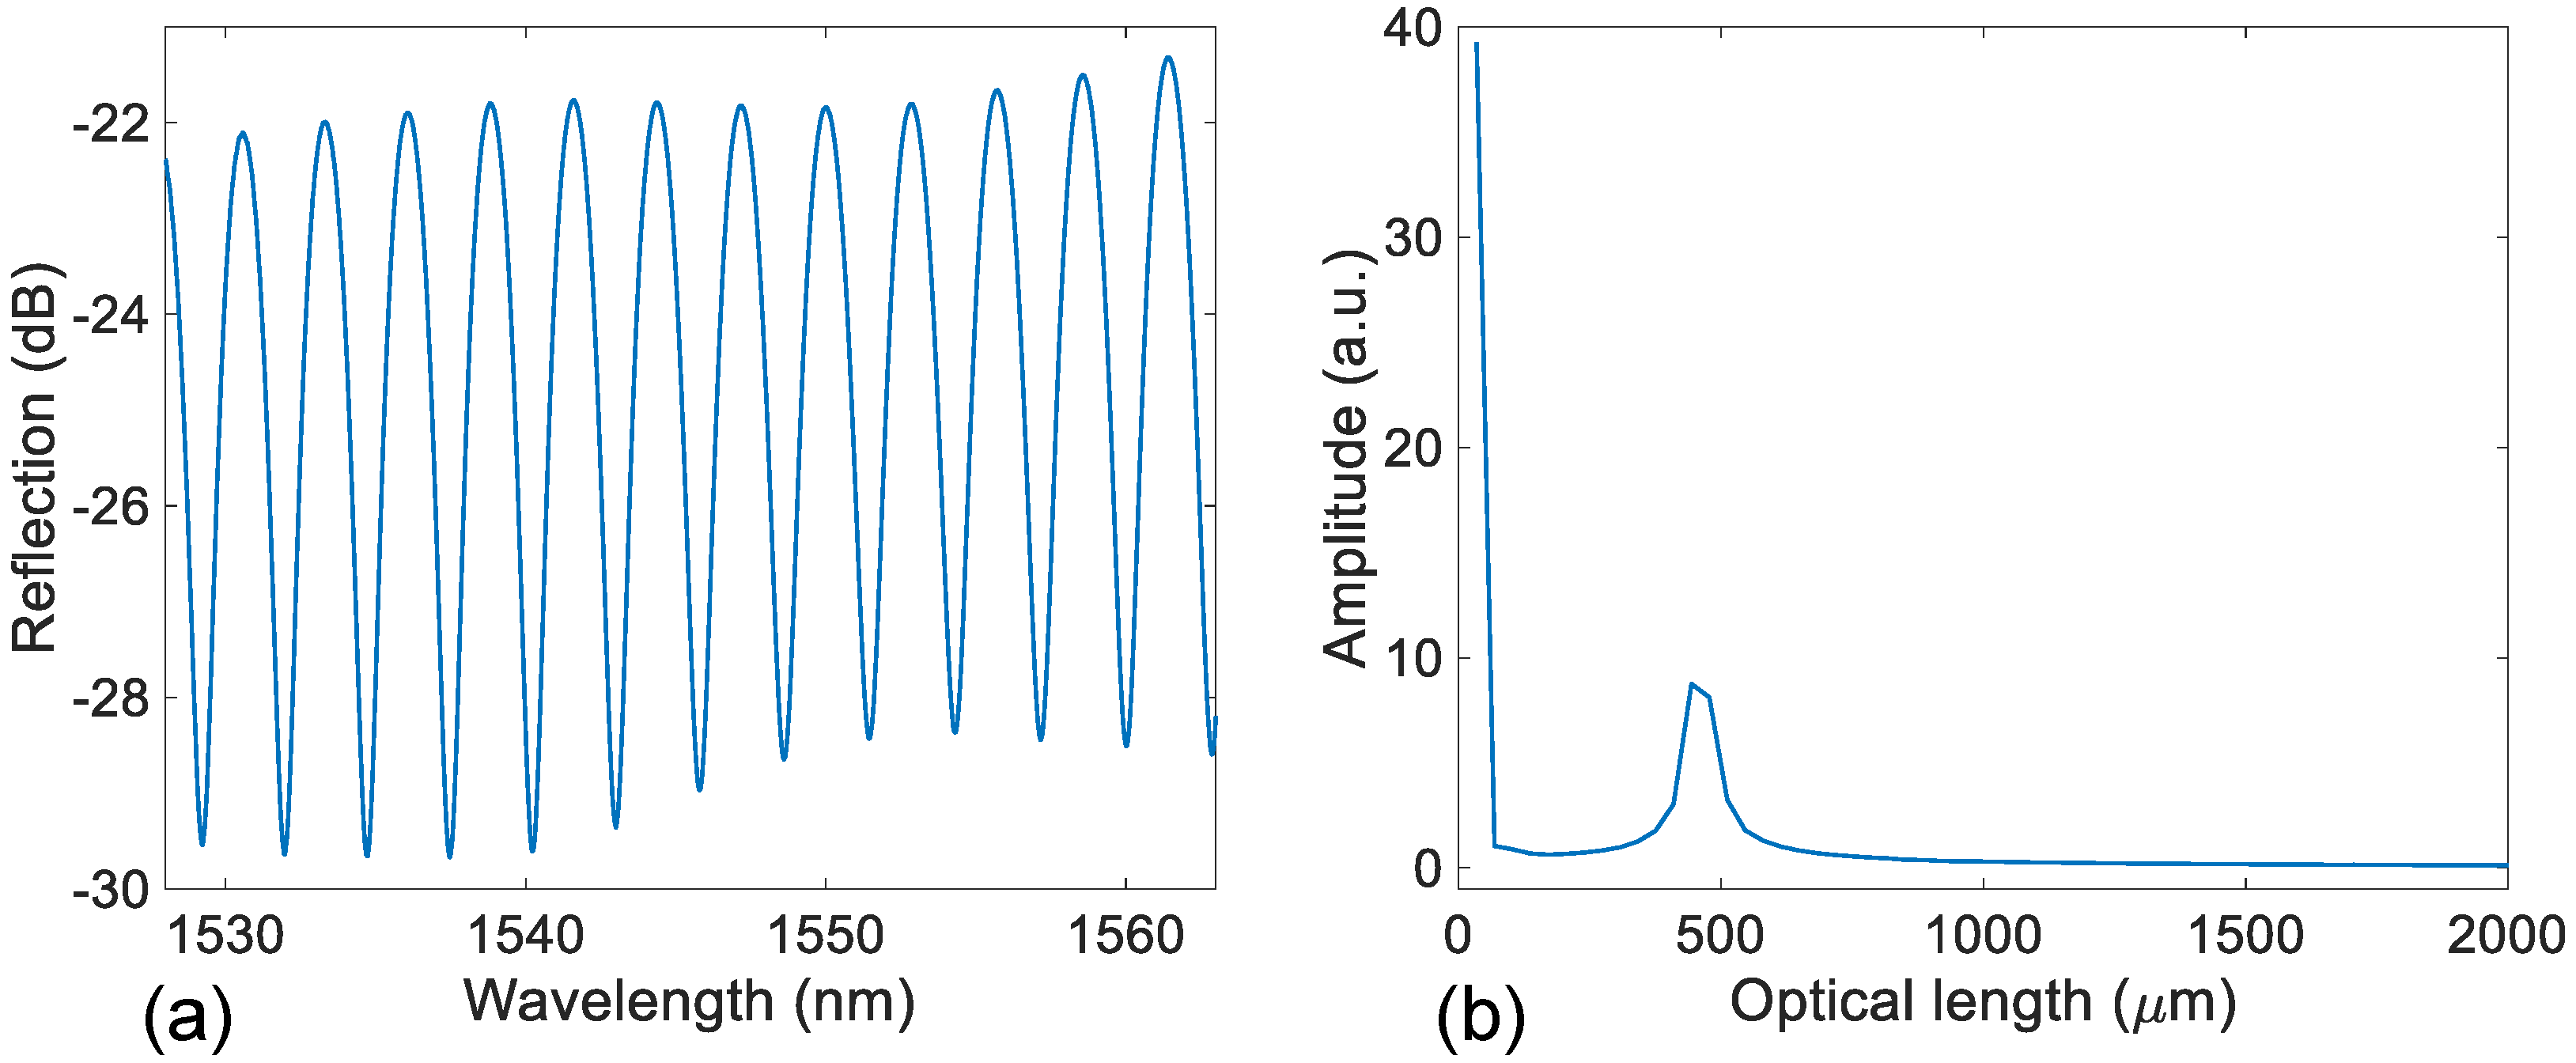
2.1. Sensing Structure and Principle

The silica capillary tube-assisted FPI is a well-known device that has been used for sensing many physical quantities. Figure 1a gives a schematic diagram of the proposed FPI curvature sensor. Figure 1b shows a microscope image of the cross-sectional view of the capillary tube, where the hollow air core is easy to observe. The construction of the FPI sensor is accomplished by fusion splicing a short section of the capillary tube between two SMFs, where one of the SMFs serves as the lead-in fiber and the other acts as the lead-out fiber. The two interfaces between the SMFs and the capillary form an FPI along the axial direction with the air as the cavity medium. From the perspective of two-beam interference, the reflected signal from the FPI device can be simply expressed as [31]
I = I 1 + I 2 + 2 I 1 I 2 cos 4 π n e f f L e f f λ + π ,
where I1 and I2 denote the reflected light intensity at the first and second reflector, respectively; λ is the wavelength of the probing light; neff and Leff represent the effective refractive index and length of the Fabry-Perot cavity. On the other hand, when the probing light is launched into the hollow air core of the capillary via the lead-in fiber, a portion of the light will radiate into the silica cladding of the capillary because the total internal reflection condition does not hold. Thus, the ring-cladding of the capillary tube can be considered a Fabry-Perot device along the radial direction. Light wavelengths that satisfy the resonant condition of the radial Fabry-Perot etalon will go through the silica cavity and leak out, whereas light wavelengths that do not satisfy the resonant condition will be reflected back into the hollow core and finally reach the lead-out fiber via the so-called AR guidance. Two mechanisms co-exist in such an FPI device, i.e., the Fabry-Perot interference and the antiresonant guidance. The emergence of the co-existence relies on the length of the capillary tube, where a critical value is defined as [42]
L c = n 0 2 + n 2 2 n 1 2 r n 1 2 n 2 2 + 2 d n 1 2 n 0 2 ,
where 2r and d represent the diameter of the hollow core and the thickness of the capillary tube, and are 50 µm and 37.5 µm, respectively, for the capillary used in this work; n0, n1, and n2 are the refractive index of the air, optical fiber core, and silica cladding, respectively. The critical length is then estimated to be 259 µm. In other words, the reflection spectrum of the FPI device shown in Figure 1a is rather involved and is the superposition of two signals, as the length of the capillary tube is larger than 259 µm. A comprehensive study of this combined effect can be found in [42,43]. The relatively complex spectrum also gives us the opportunity to use it for multi-parameter sensing, i.e., simultaneous measurements of curvature, temperature, and strain.
Let us first consider the effects of curvature on the reflection spectrum of the FPI device. As the FPI is bent, a portion of the probing light will leak out due to the variation of the boundary condition, leading to a decreased amplitude of the light reflected at the second reflector. Therefore, the fringe visibility/the intensity at the destructive interference of the FPI signal will decrease/increase as the curvature exerted on the sensor increases. Meanwhile, it is expected that the fringe visibility of the antiresonant guidance signal will also decrease with the increasing curvature due to the fact that more light is leaked out. As for temperature sensing, the air-cavity-based FPI device is known for its temperature insensitivity due to the small thermo-optic coefficient of air (the cavity medium) and a low thermal expansion coefficient of silica. On the other hand, the antiresonant guidance signal is expected to be sensitive to temperature variations because changes in temperature directly affect the optical length of the ring-cladding Fabry-Perot etalon based on a dominant thermo-optic effect. In the case of strain, the elongation of the FPI cavity (along the axial direction) directly changes the FPI signal, where the antiresonant guidance signal is also expected to change with strains to some extent. As a result, the coefficient matrix calibration approach can be employed for the proposed FPI device to realize the simultaneous measurement of curvature, temperature, and strain. The relationship between the changes in the reflection spectrum and changes in curvature, temperature, and strain can be expressed as
Δ λ F P I Δ I F P I Δ λ A R Δ I A R = S F P I λ C S F P I λ T S F P I λ S S F P I I C S F P I I T S F P I I S S A R λ C S A R λ T S A R λ S S A R I C S A R I T S A R I S Δ C Δ T Δ S ,
where ΔλFPI and ΔIFPI represent the changes in the dip wavelength and dip intensity of the FPI signal induced by changes in curvature (ΔC), temperature (ΔT), and strain (ΔS), respectively; ΔλAR and ΔIAR are the corresponding changes in the dip wavelength and dip intensity of the antiresonant guidance signal. The term S denotes the corresponding sensitivity coefficient; for example, SFPI−λ−C is the sensitivity coefficient of the FPI signal to curvature in terms of changes in dip wavelength. Thus, by reconstructing the individual signals of the FPI and the antiresonant guidance mechanism using appropriate signal processing techniques (i.e., Fourier transform) and tracking the changes accordingly, the proposed FPI device can simultaneously measure curvature, temperature, and strain after proper sensor calibration.
However, due to the short cavity length of the ring-cladding Fabry-Perot etalon, an ultra-broadband light source (e.g., a C + L band source or a supercontinuum source) is required to unambiguously reconstruct the signals induced by the FPI and the antiresonant guidance effect, which could increase the system cost. To avoid this side effect, we have further optimized the calibration process, where no complicated signal processing (i.e., Fourier transform) is needed. Specifically, the change in the intensity at the destructive interference point (ΔI) and the spectral shift (Δλ) of the raw signal measured from the device are directly considered two variables in response to external perturbations. Additionally, the fringe contrast (ΔF) of the raw signal near a resonance dip is deemed to be another variable. Thus, Equation (3) can be simplified as
Δ I Δ λ Δ F = S I C S I T S I S S λ C S λ T S λ S S F C S F T S F S Δ C Δ T Δ S .
Figure 2 conceptually illustrates the proposed sensor system for multi-parameter sensing based on the simplified coefficient matrix-based data processing technique.

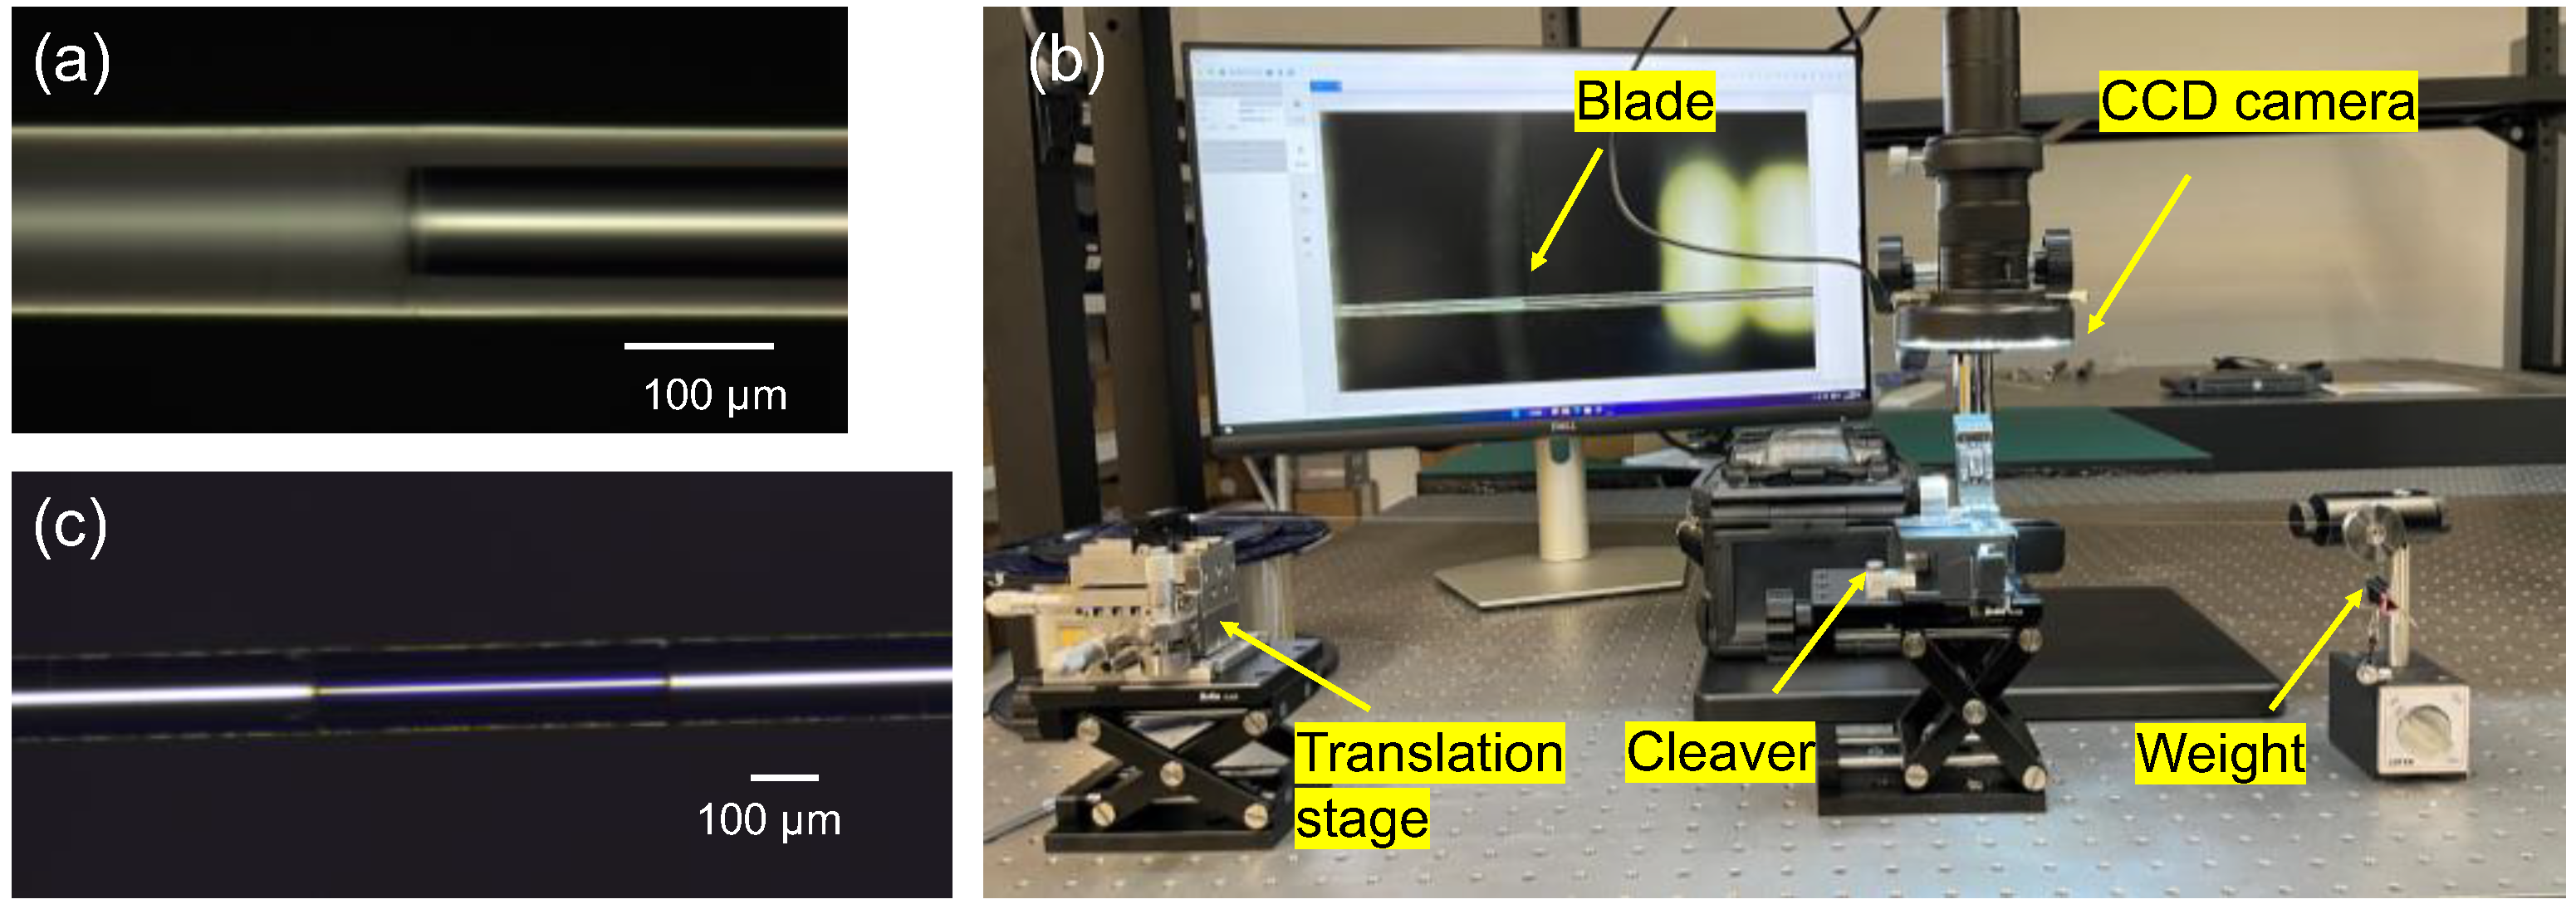
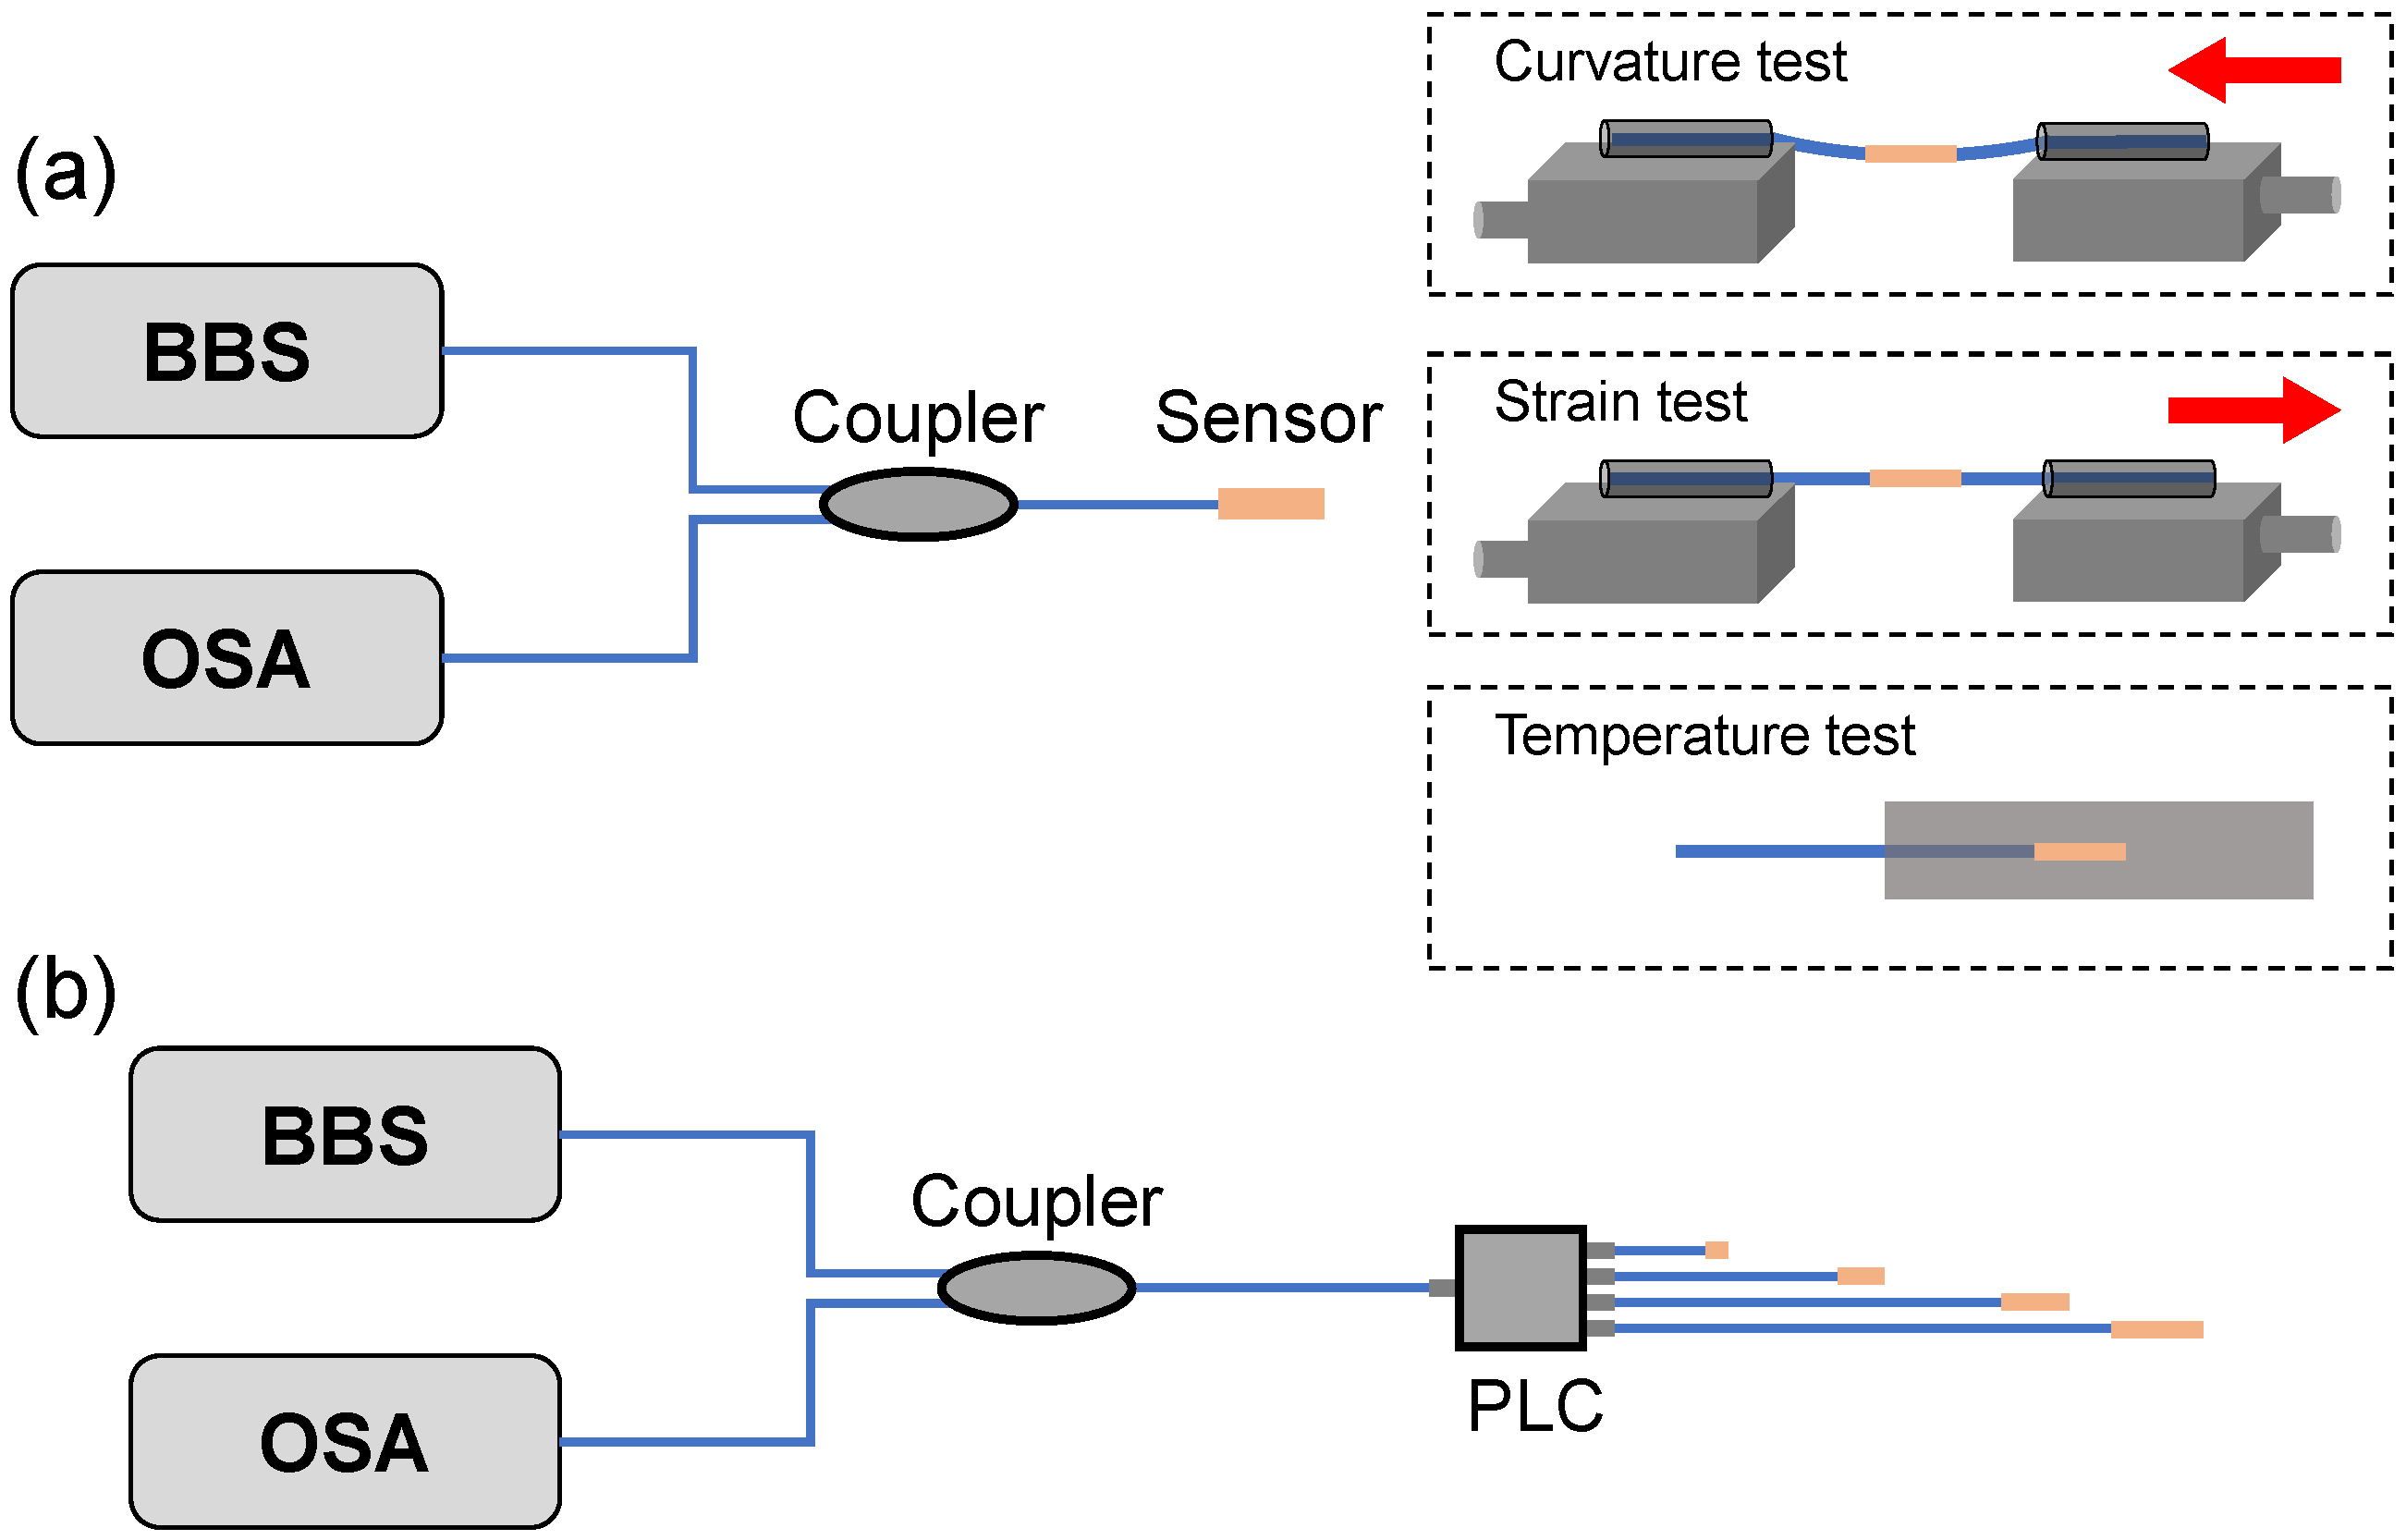
2.2. Experimental Setup

The fabrication of the proposed silica capillary-assisted FPI device involves non-standard fusion splicing and high-precision cleaving. The details of these two processes are given in this subsection.
The construction of the FPI device requires the integration of a short section of the capillary tube with standard SMFs. The splicing between the capillary and the SMF was accomplished using a commercial fusion splicer (Fujikura-88s, Shanghai, China) based on a special program developed in-house. The key parameters include arc power of 80 bits, arc time of 500 ms, and an initial distance between the two end facets of 15 µm. The SMF and the capillary were aligned manually. The program ensured a strong connection between the SMF and the capillary, and meanwhile, avoided the collapse of the hollow air core of the capillary, as shown in Figure 3a. Then, the free end of the spliced capillary was carefully cut off with a desired length remaining to the SMF, using an optical fiber cleaver. A photograph of the platform developed to achieve high-precision cleaving is shown in Figure 3b. The platform includes an imaging system, an optical fiber cleaver, a translation stage, and several fixtures. A desired cavity length can be achieved with an accuracy of 10 µm based on the platform. After cleaving, the cleaved end facet was then connected to another piece of SMF to form the Fabry–Perot cavity. The pigtail of the SMF was then terminated to avoid additional reflection, completing the fabrication of the proposed FPI device.
The FPI device is characterized using a broadband light source (BBS, 1528~1563 nm) and an optical spectrum analyzer (OSA, Yokogawa AQ6370D, Yokogawa, Tokyo, Japan). For the curvature test, the FPI device is secured on two translation stages (OMTOOLS, HFA-XYZ, Zeewolde, The Netherlands, affording a lateral resolution of 10 µm) mounted to an optical table, similar to the setup in [10]. The initial distance between the two stages is 50 mm, and the FPI device is placed in the center part. Curvature is then applied to the device by moving one of the stages inwards to bend the FPI device with a step size of 50 µm. Note that a similar setup is used for the strain test. As for the temperature test, the FPI device is placed in a temperature-controlled box. Figure 4a gives an overview of the experimental setup for characterizing the responses of the FPI device to curvature, strain, and temperature variations. In the case of multi-point sensing, four such FPI devices were multiplexed in a single system in parallel, as shown in Figure 4b. A 1 × 4 planar waveguide circuit (PLC)-based optical splitter was used to assist the parallel multiplexing of the four devices. Note that the length differences between the delay fibers for the four devices should be significantly larger than the coherence length of the BBS and OSA system to eliminate interference between the devices. The responses of each device can be quantified using the apparatus given in Figure 4a.

3. Results and Discussion

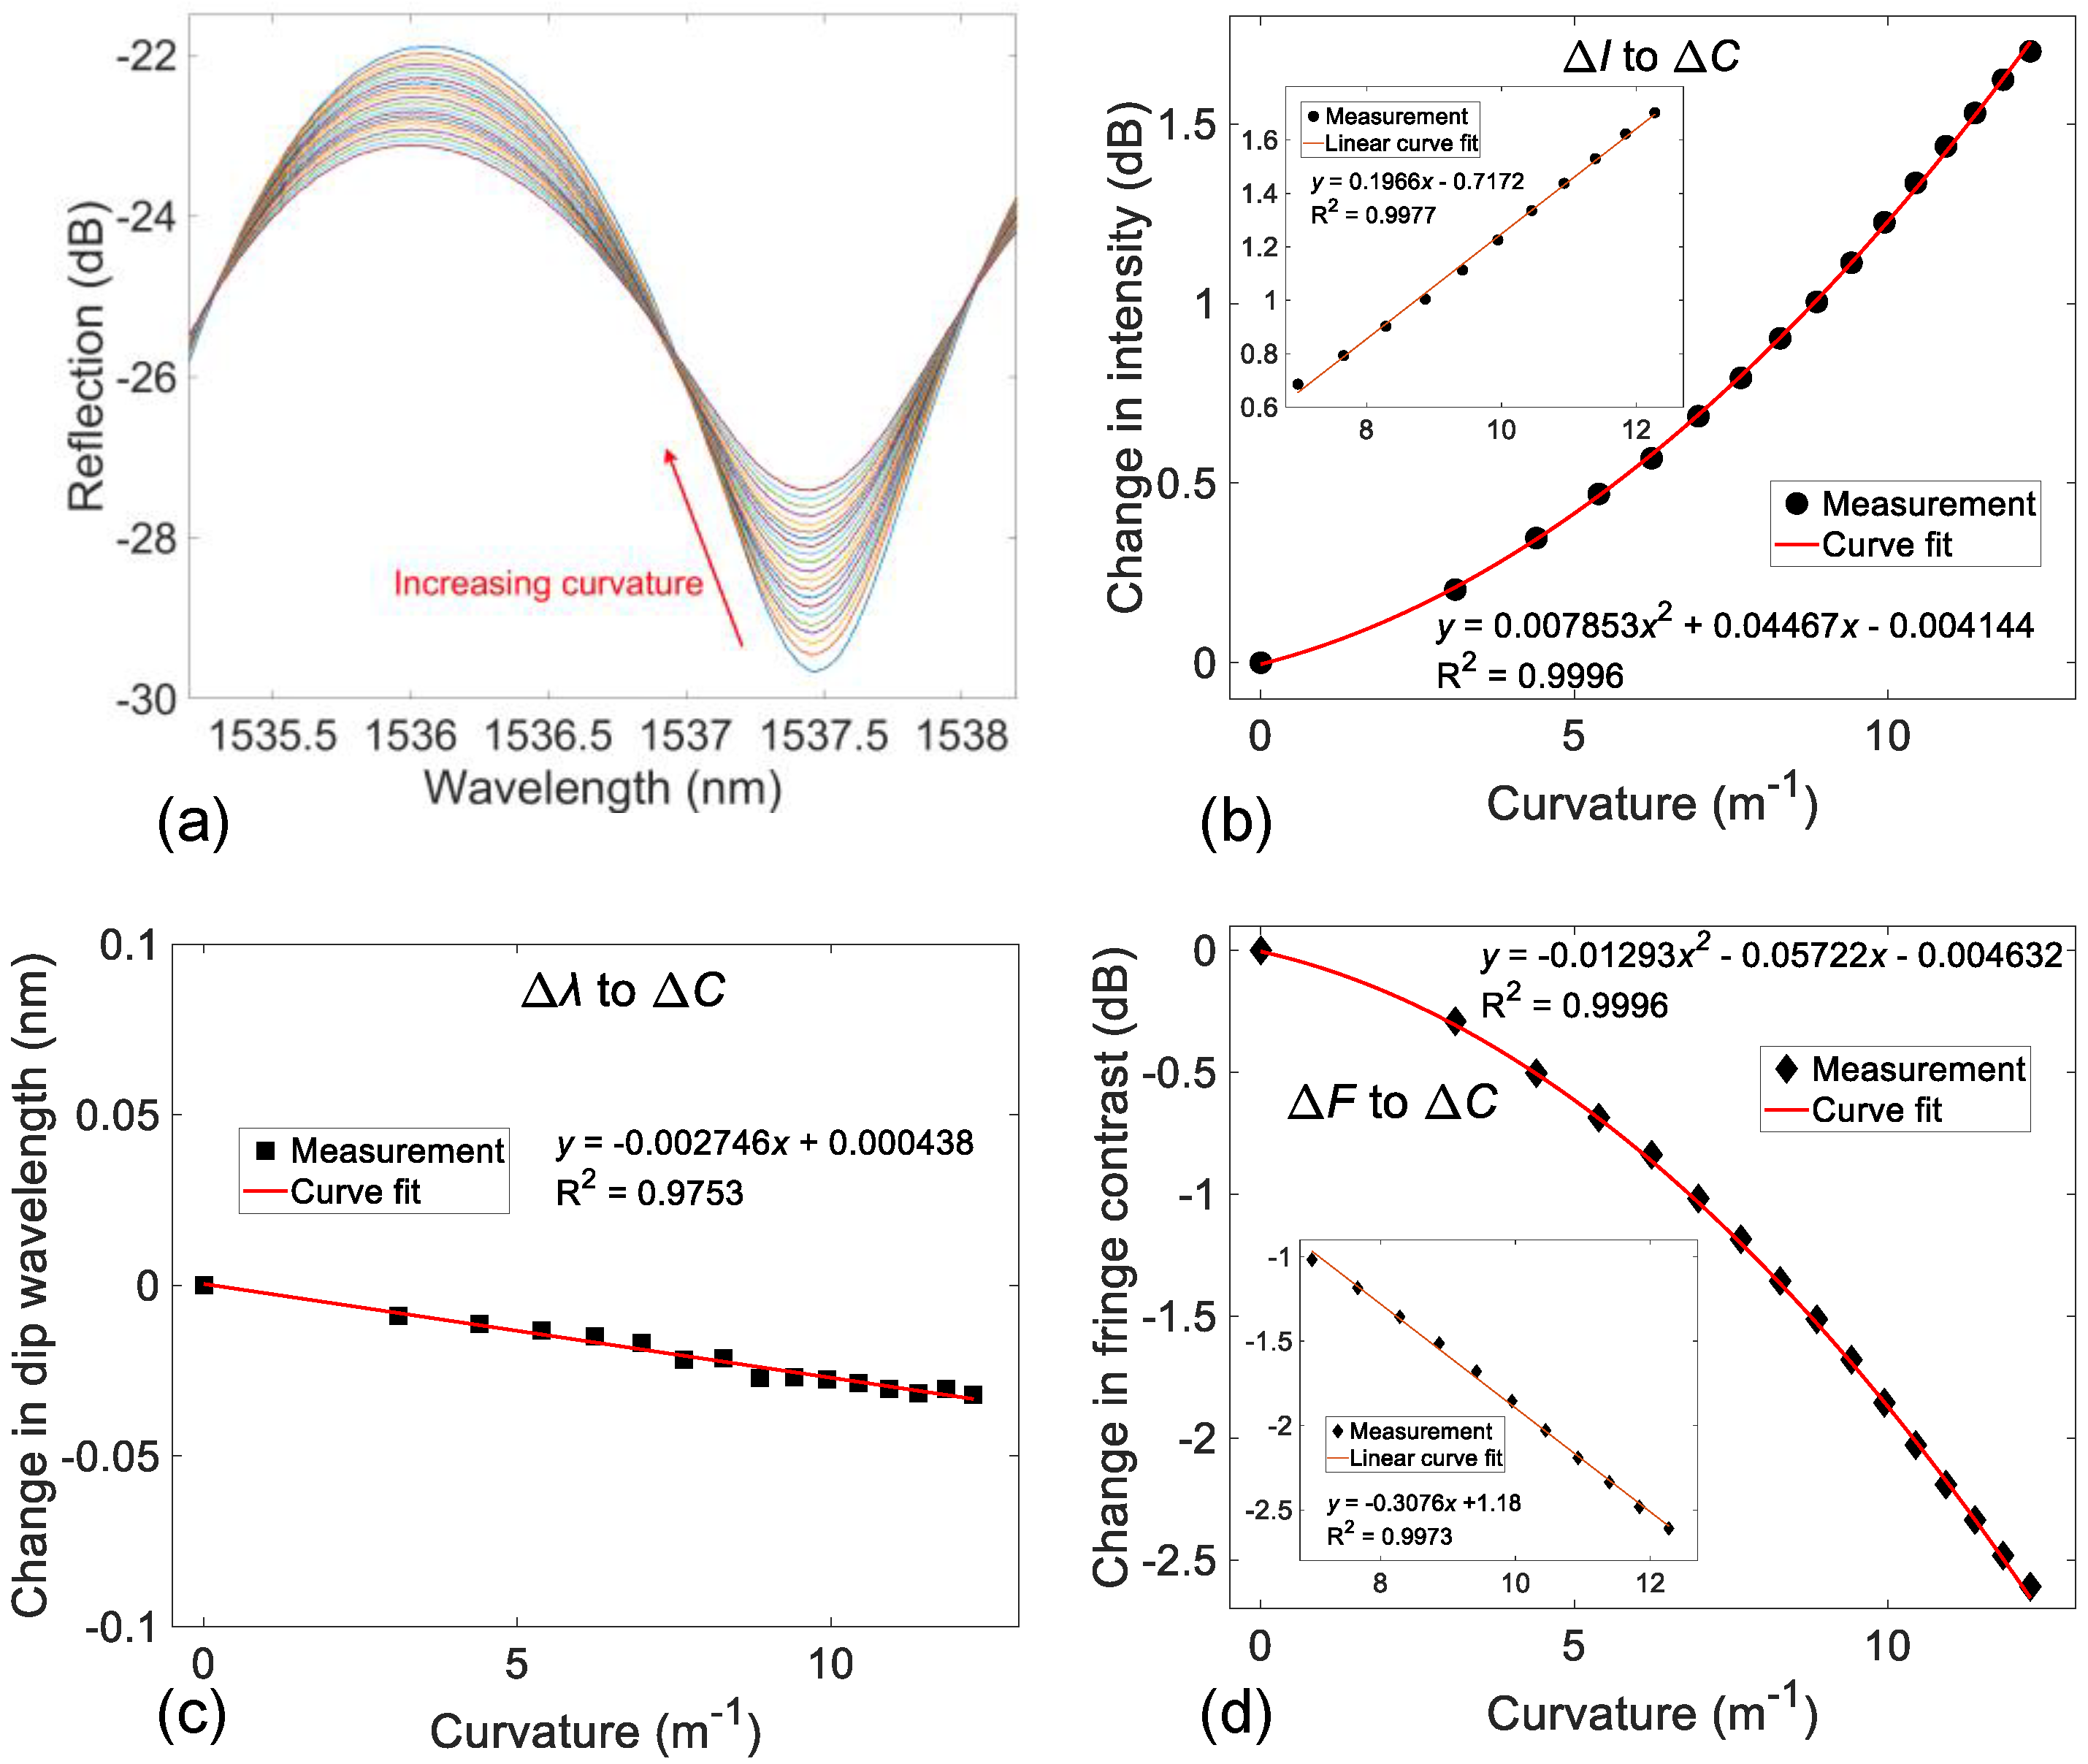
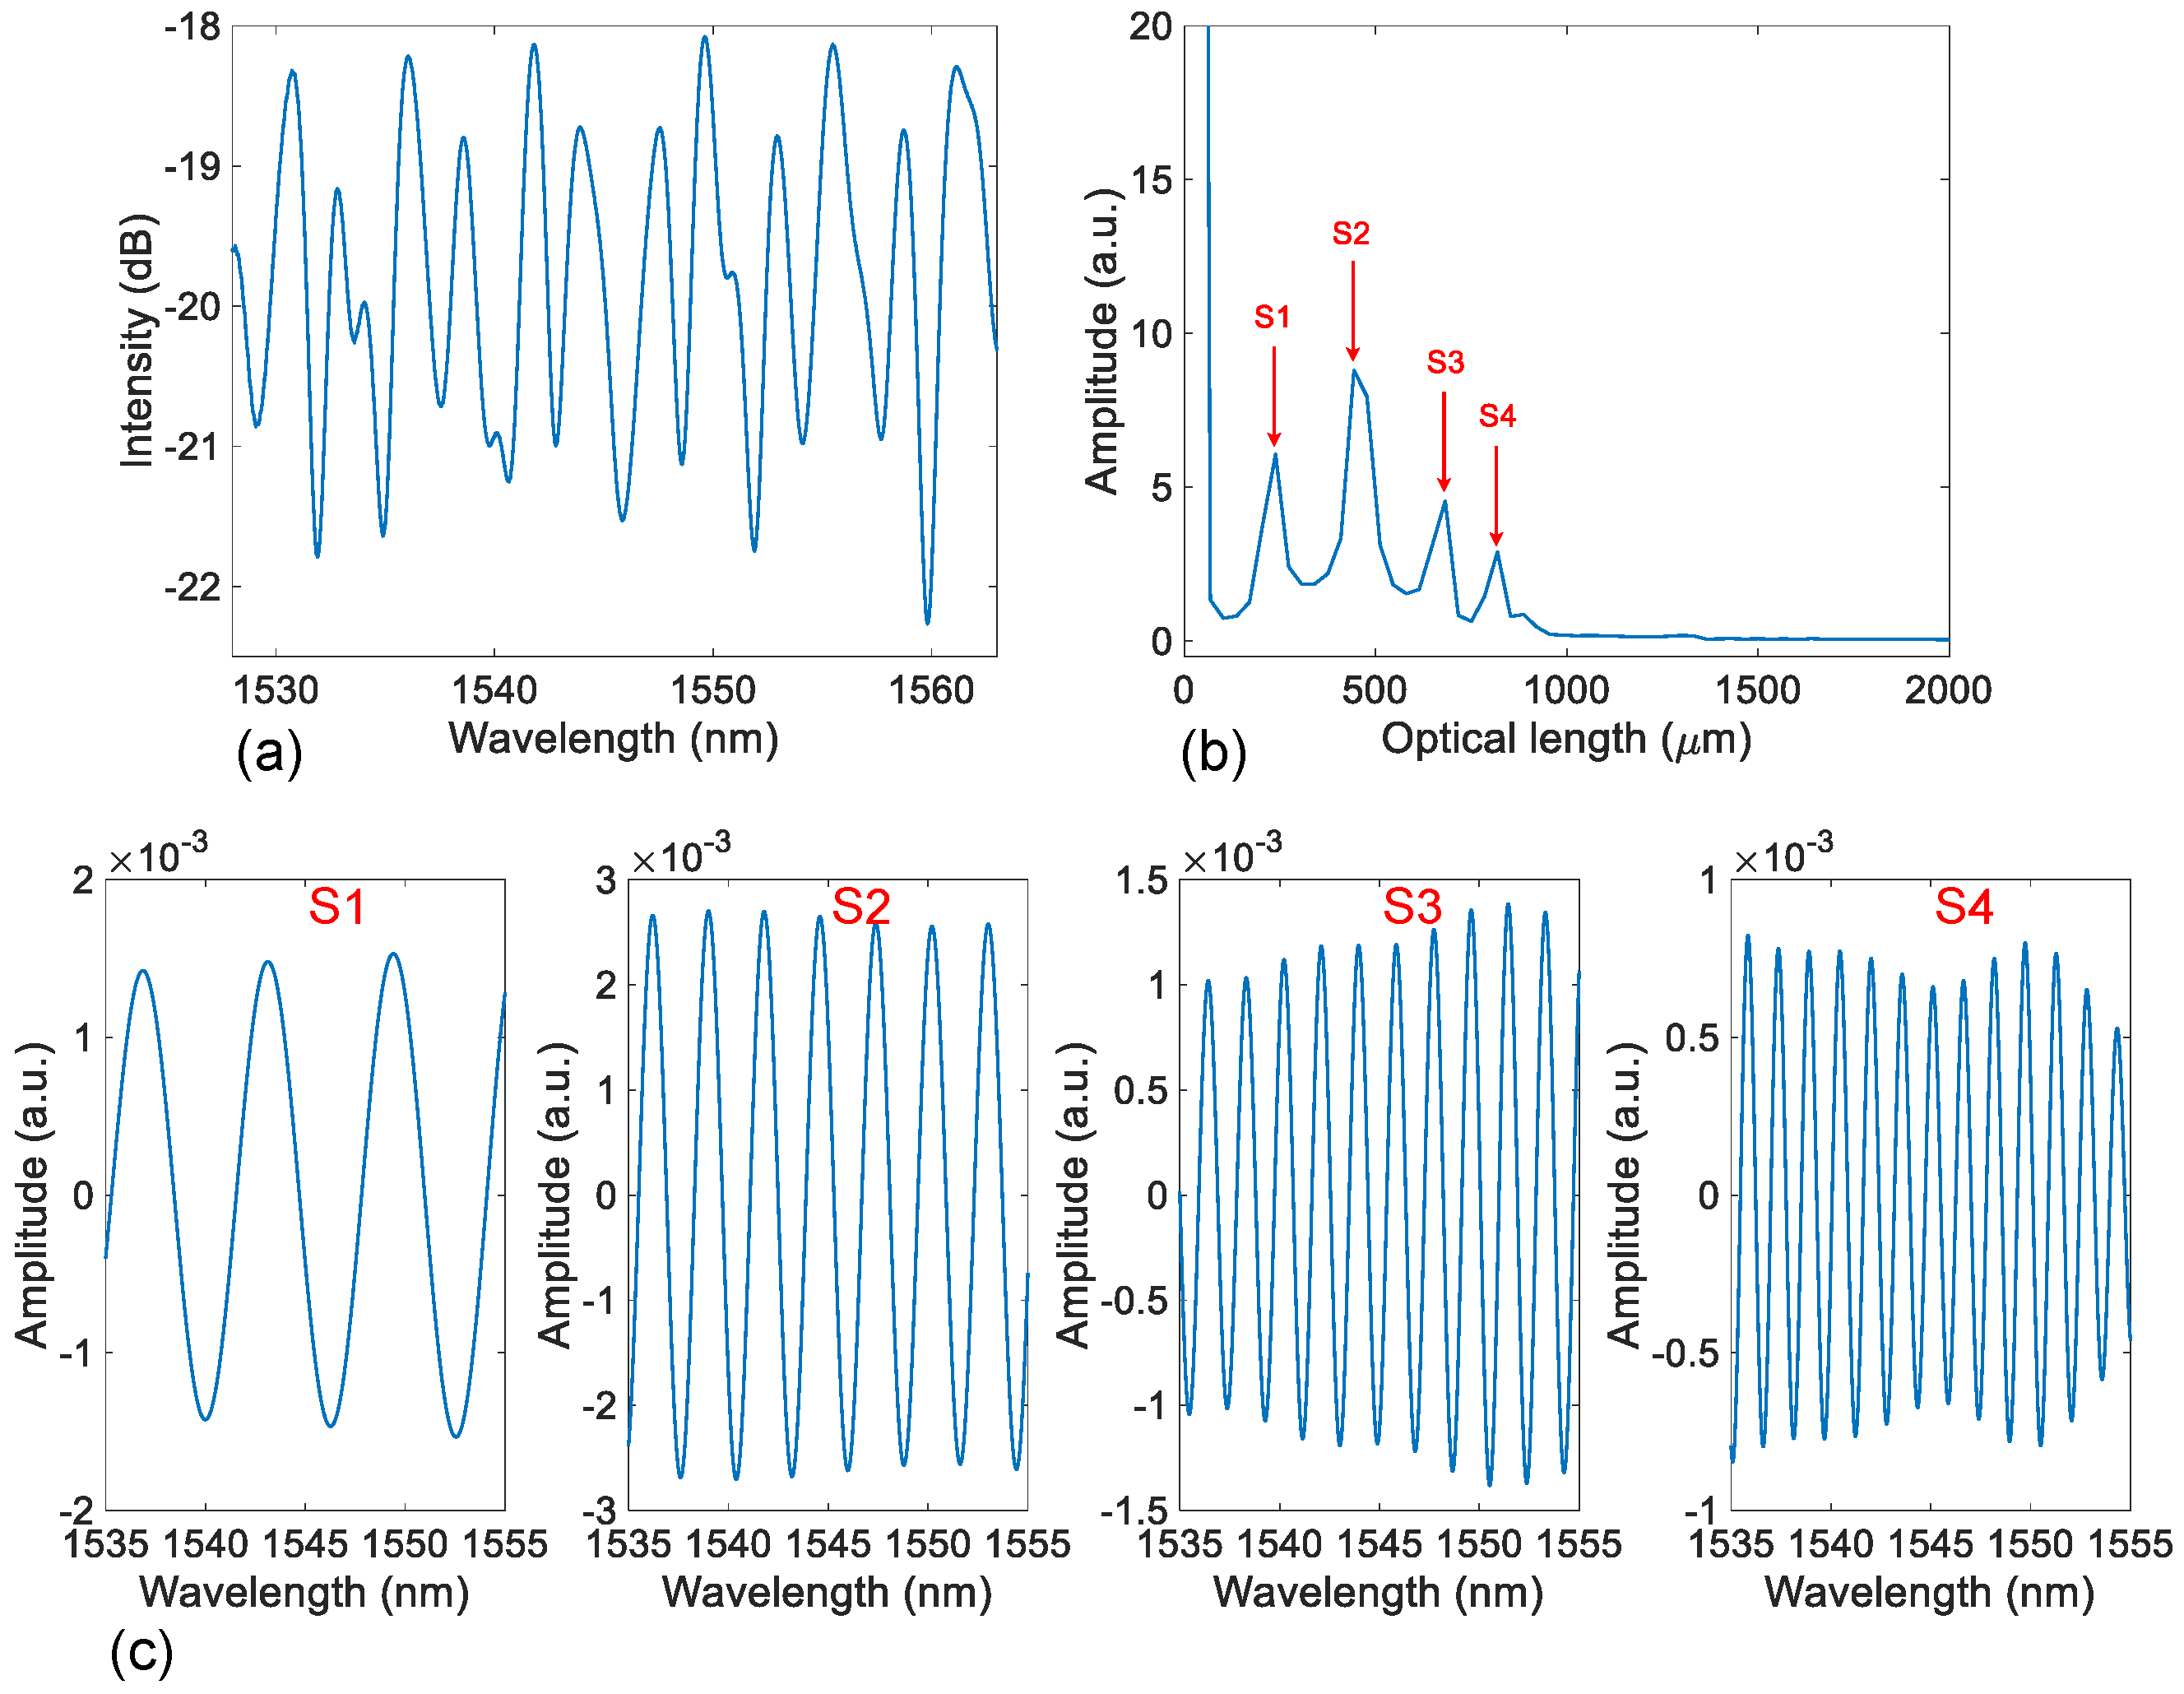
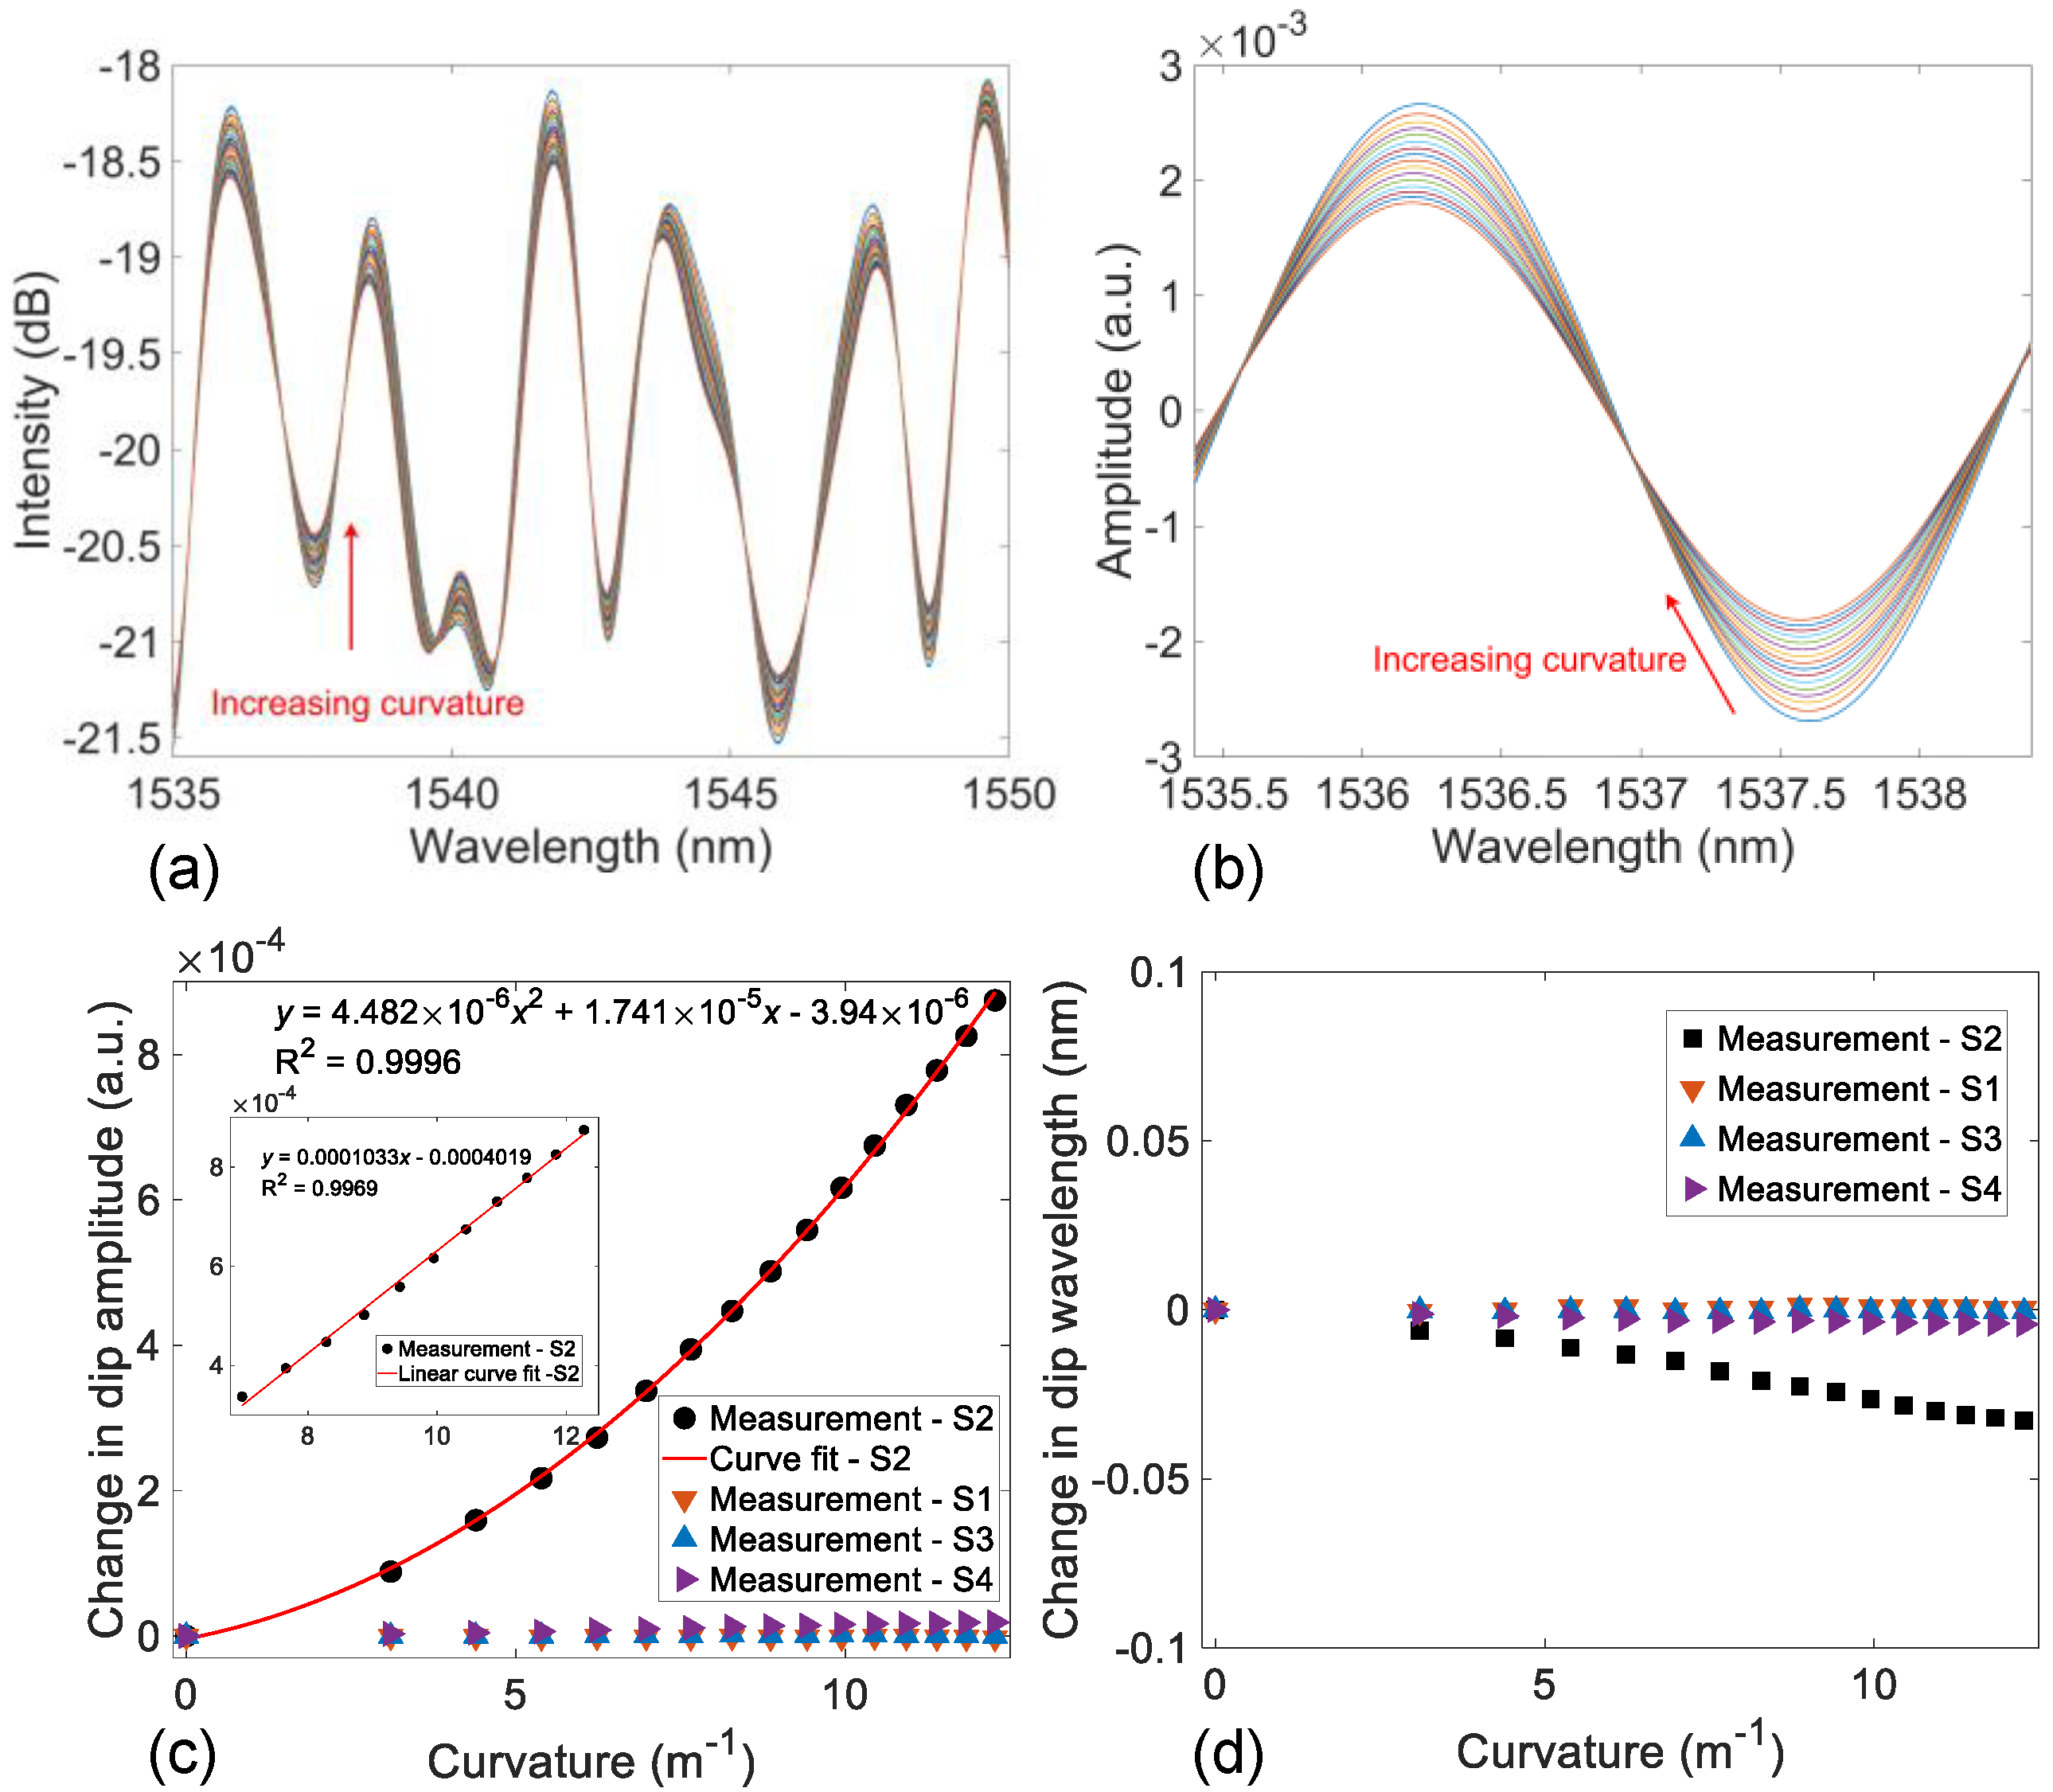
3.1. Single FPI Device for Curvature Sensing

The spectral responses of a single FPI device to variations of curvature, temperature, and strain were quantified using the experimental setup shown in Figure 4a. The results and corresponding discussion are given in detail as follows. Figure 5a presents the measured spectral behavior of the proposed FPI device with a cavity length of approximately 420 µm (measured under a microscope). A quasi-sinusoidal signal is obtained, as expected, due to the Fabry-Perot interference that occurred at the two interfaces between the SMFs and the capillary. The optical length is calculated to be 426.26 µm based on a home-developed algorithm [44], which matches the designed value well, considering reasonable errors during the fabrication and measurement. Amplitude modulation is also sustained in the measured raw reflection spectrum from the device, which is caused by the antiresonant guidance effect, as can be expected from the analysis in Section 2. However, due to the relatively small wavelength observation bandwidth limited by the low-cost light source used in the experiment, a complete cycle of the antiresonant guidance envelope is not observed. Figure 5b gives the spatial domain signal of the measured spectrum shown in Figure 5a based on Fourier transform. No distinctive peaks can be observed in the spatial domain signal except for the dominant one corresponding to the Fabry-Perot interference. Therefore, it would be rather challenging to reconstruct the FPI and AR signals unambiguously to solve Equation (3) for multi-parameter sensing. Instead, the simplified approach depicted in Equation (4) is employed in the following calibration experiment.
The curvature study was then carried out using the setup shown in Figure 4a. The measured spectral responses of the FPI device during the curvature test within a single fringe period near 1537 nm for clarity are given in Figure 6a. As can be seen, the reflected light intensity of the resonance dip at ~1537.5 nm increased as the applied curvature increased. Figure 6b shows the change in the dip intensity as a function of the applied curvature. A second-order polynomial curve fit was applied to the measured data points, revealing a monotonic, trackable, and predictable relationship between the change in the dip intensity and the applied curvature. The inset gives an enlarged view of the intensity response within the curvature range 7~12.2 m−1. Linear curve fitting was employed to demonstrate the linear response of the device, and the fitting results are indicated in the inset figure. What is also observed in the spectral responses shown in Figure 6a is the slight dip wavelength shift with increasing curvature. Figure 6c quantifies the relationship between the change in the dip wavelength at ~1537.5 nm and the applied curvature. The dip wavelength changed only by approximately 0.03 nm as the applied curvature increased to 12.2 m−1, indicating that the dip wavelength is insensitive to curvature. The slight changes in the dip wavelength could be attributed to strains induced by bending during the test. Additionally, another reference that can be tracked in the spectral responses presented in Figure 6a, i.e., the fringe contrast, shows direct dependence on the applied curvature; the fringe contrast decreased with increasing curvature. The specific relationship between the fringe contrast and the applied curvature is obtained by means of a second-order polynomial curve fit, as shown in Figure 6d. Again, the change in the fringe contrast shows a linear dependence on the applied curvature within the range 7~12.2 m−1, as revealed in the inset. Note that the linear response range is related to the dimensional size of the capillary tube used to construct the FPI. Thus, the proposed FPI device can be used for wide-range curvature sensing (0~12.2 m−1) based on tracking either the change in the dip intensity or the change in the fringe contrast. The dip wavelength shows little dependence on the applied curvature.

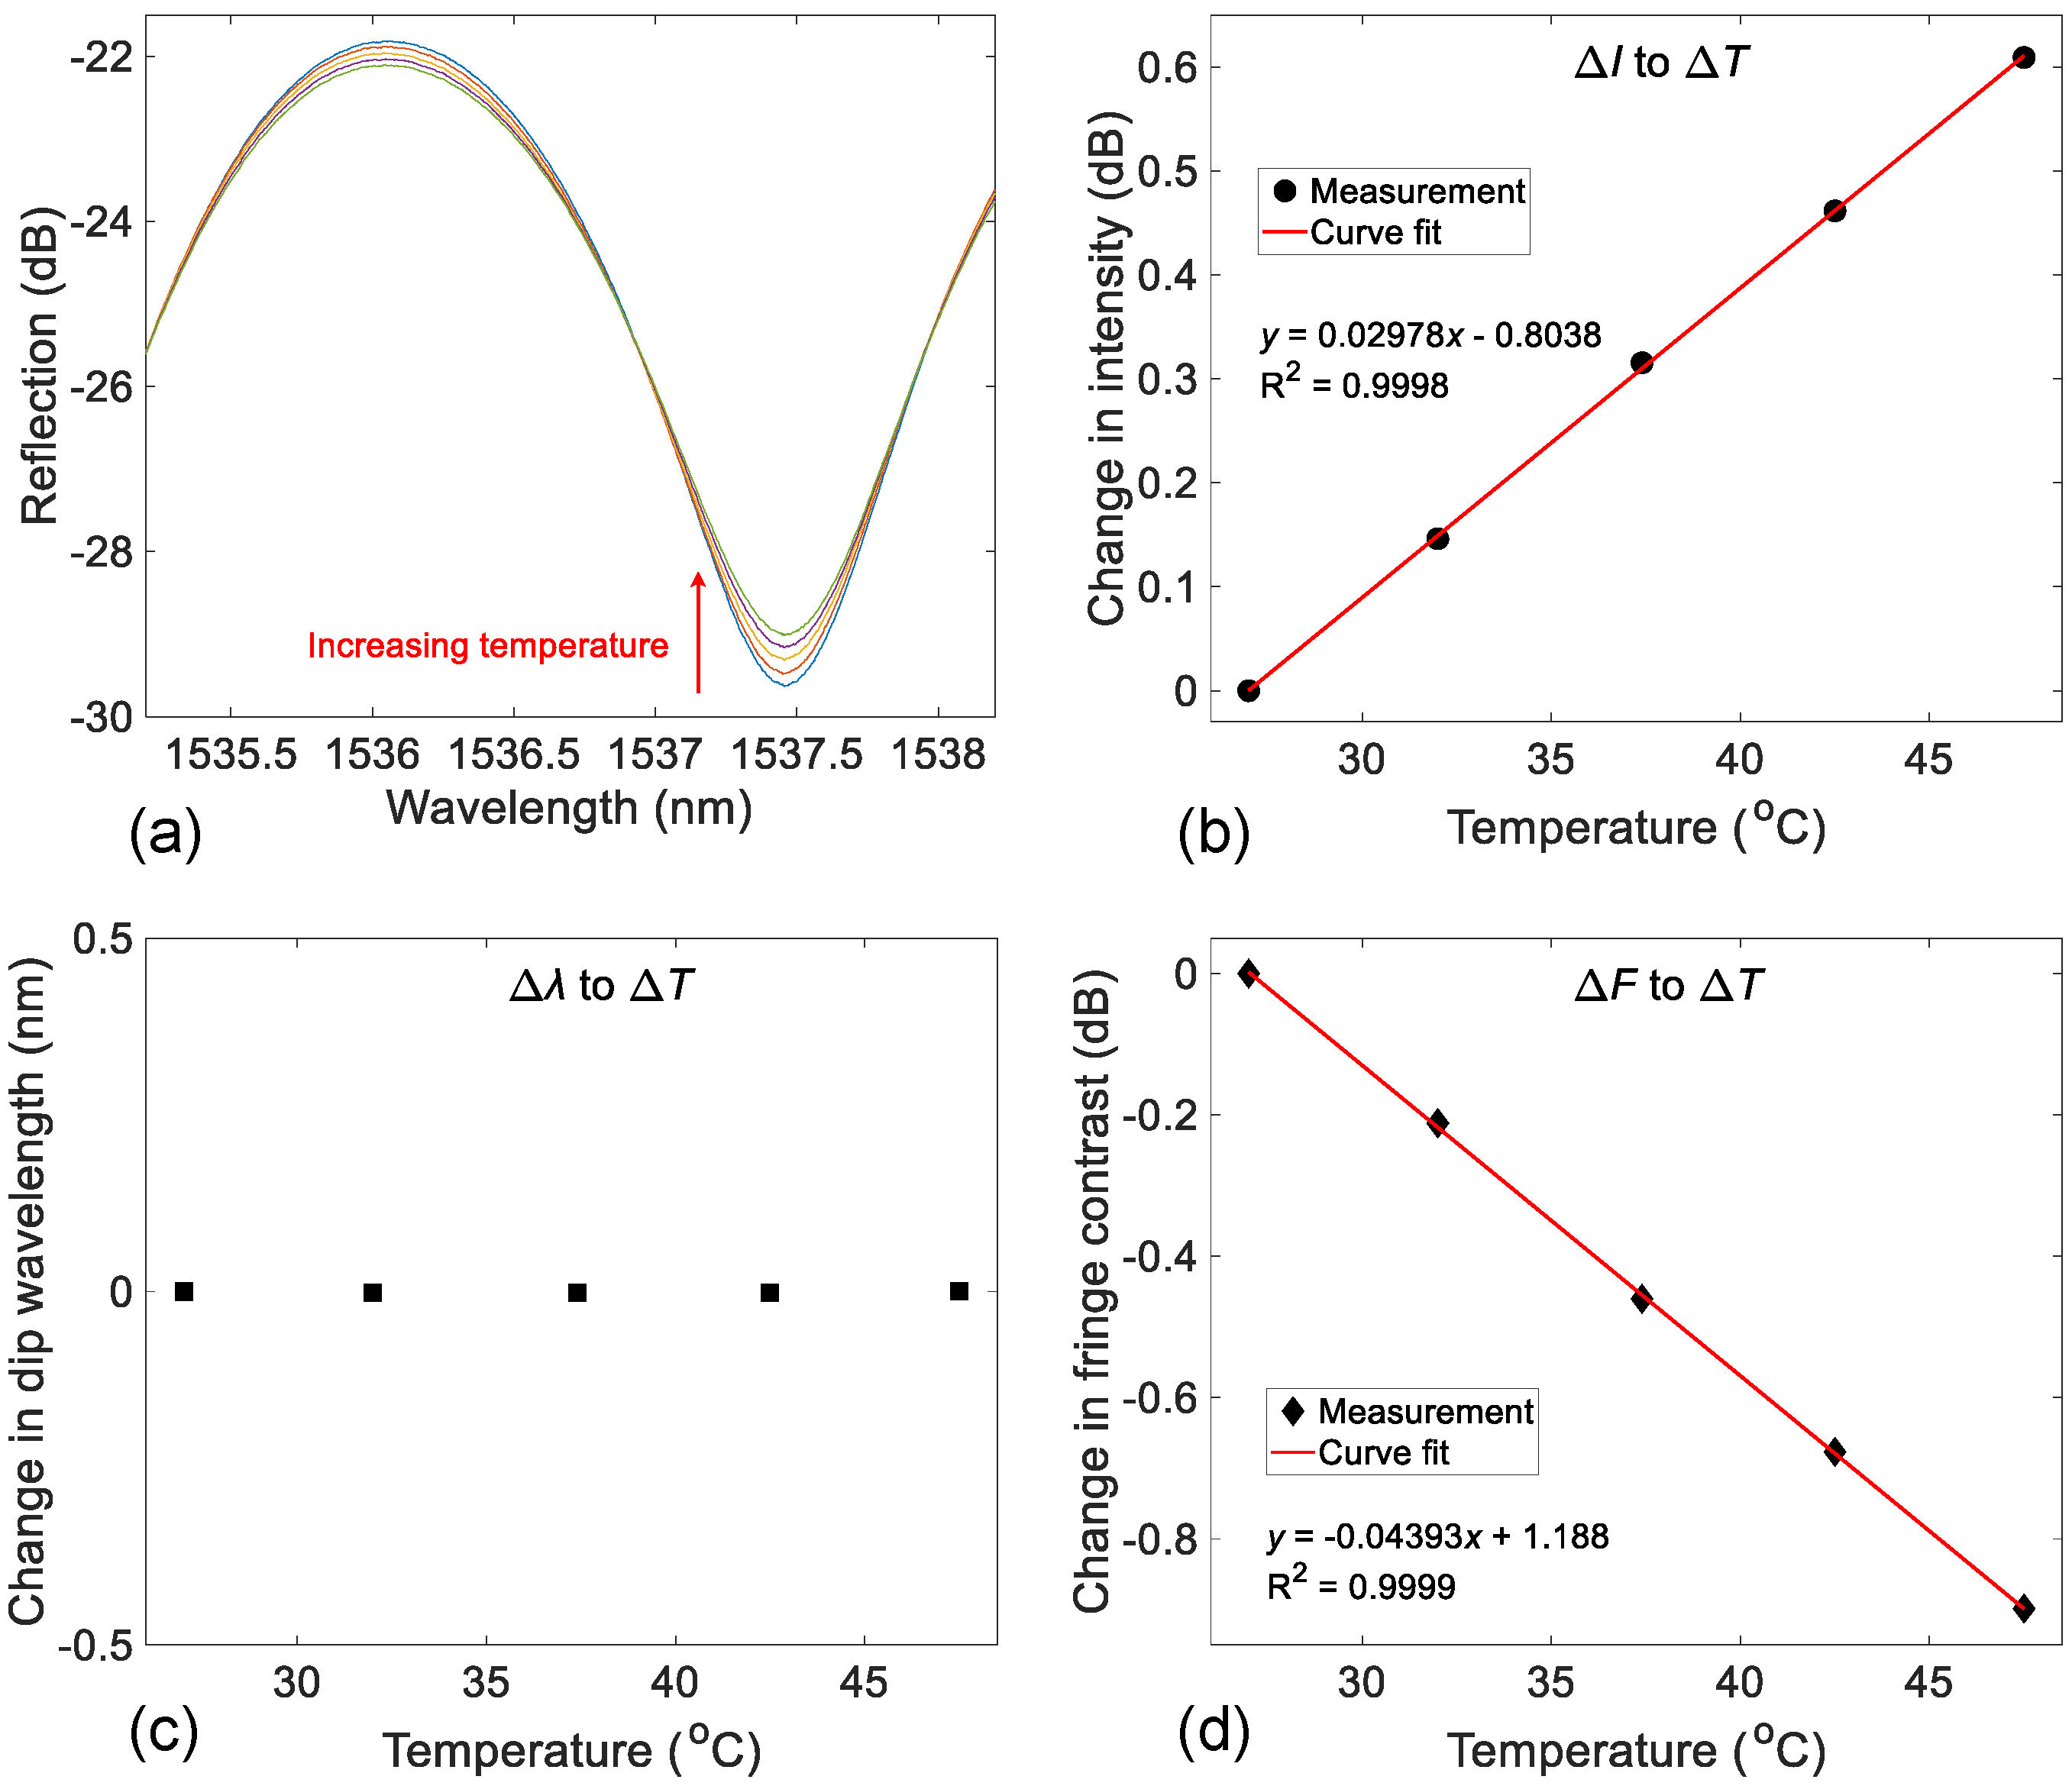
3.2. Single FPI Device for Temperature Sensing

Then, the spectral responses of the FPI device to temperature variations were investigated by securing the device inside a temperature-controlled box. The measured reflection spectra of the device within a single fringe period at different settings of temperature are given in Figure 7a. The dip intensity shows observable increases with increasing temperature. The relationship between the change in the dip intensity at ~1537.5 nm and the temperature is shown in Figure 7b, where a linear curve fit was applied to determine the measurement sensitivity, as indicated in the figure. As mentioned in Section 2, the air-cavity FPI is expected to be insensitive to temperature variations. Thus, the changes in the reflection spectra are mainly attributed to the changes in the antiresonant guidance signal induced by temperature variations. Figure 7c shows the determined dip wavelength as a function of temperature, where little changes in the dip wavelength are obtained within a temperature variation of 20 °C. Additionally, the change in the fringe contrast as a function of temperature is plotted in Figure 7d. A linear curve fit was applied, and the slope (i.e., the measurement sensitivity) is determined. Based on the calibration results, the FPI device can be used for temperature sensing by tracking changes in the dip intensity, as well as the changes in the fringe contrast. On the contrary, the dip wavelength is relatively stable. The changes in the antiresonant guidance signal dominate the changes in the reflection spectrum of the FPI device in response to temperature variations.

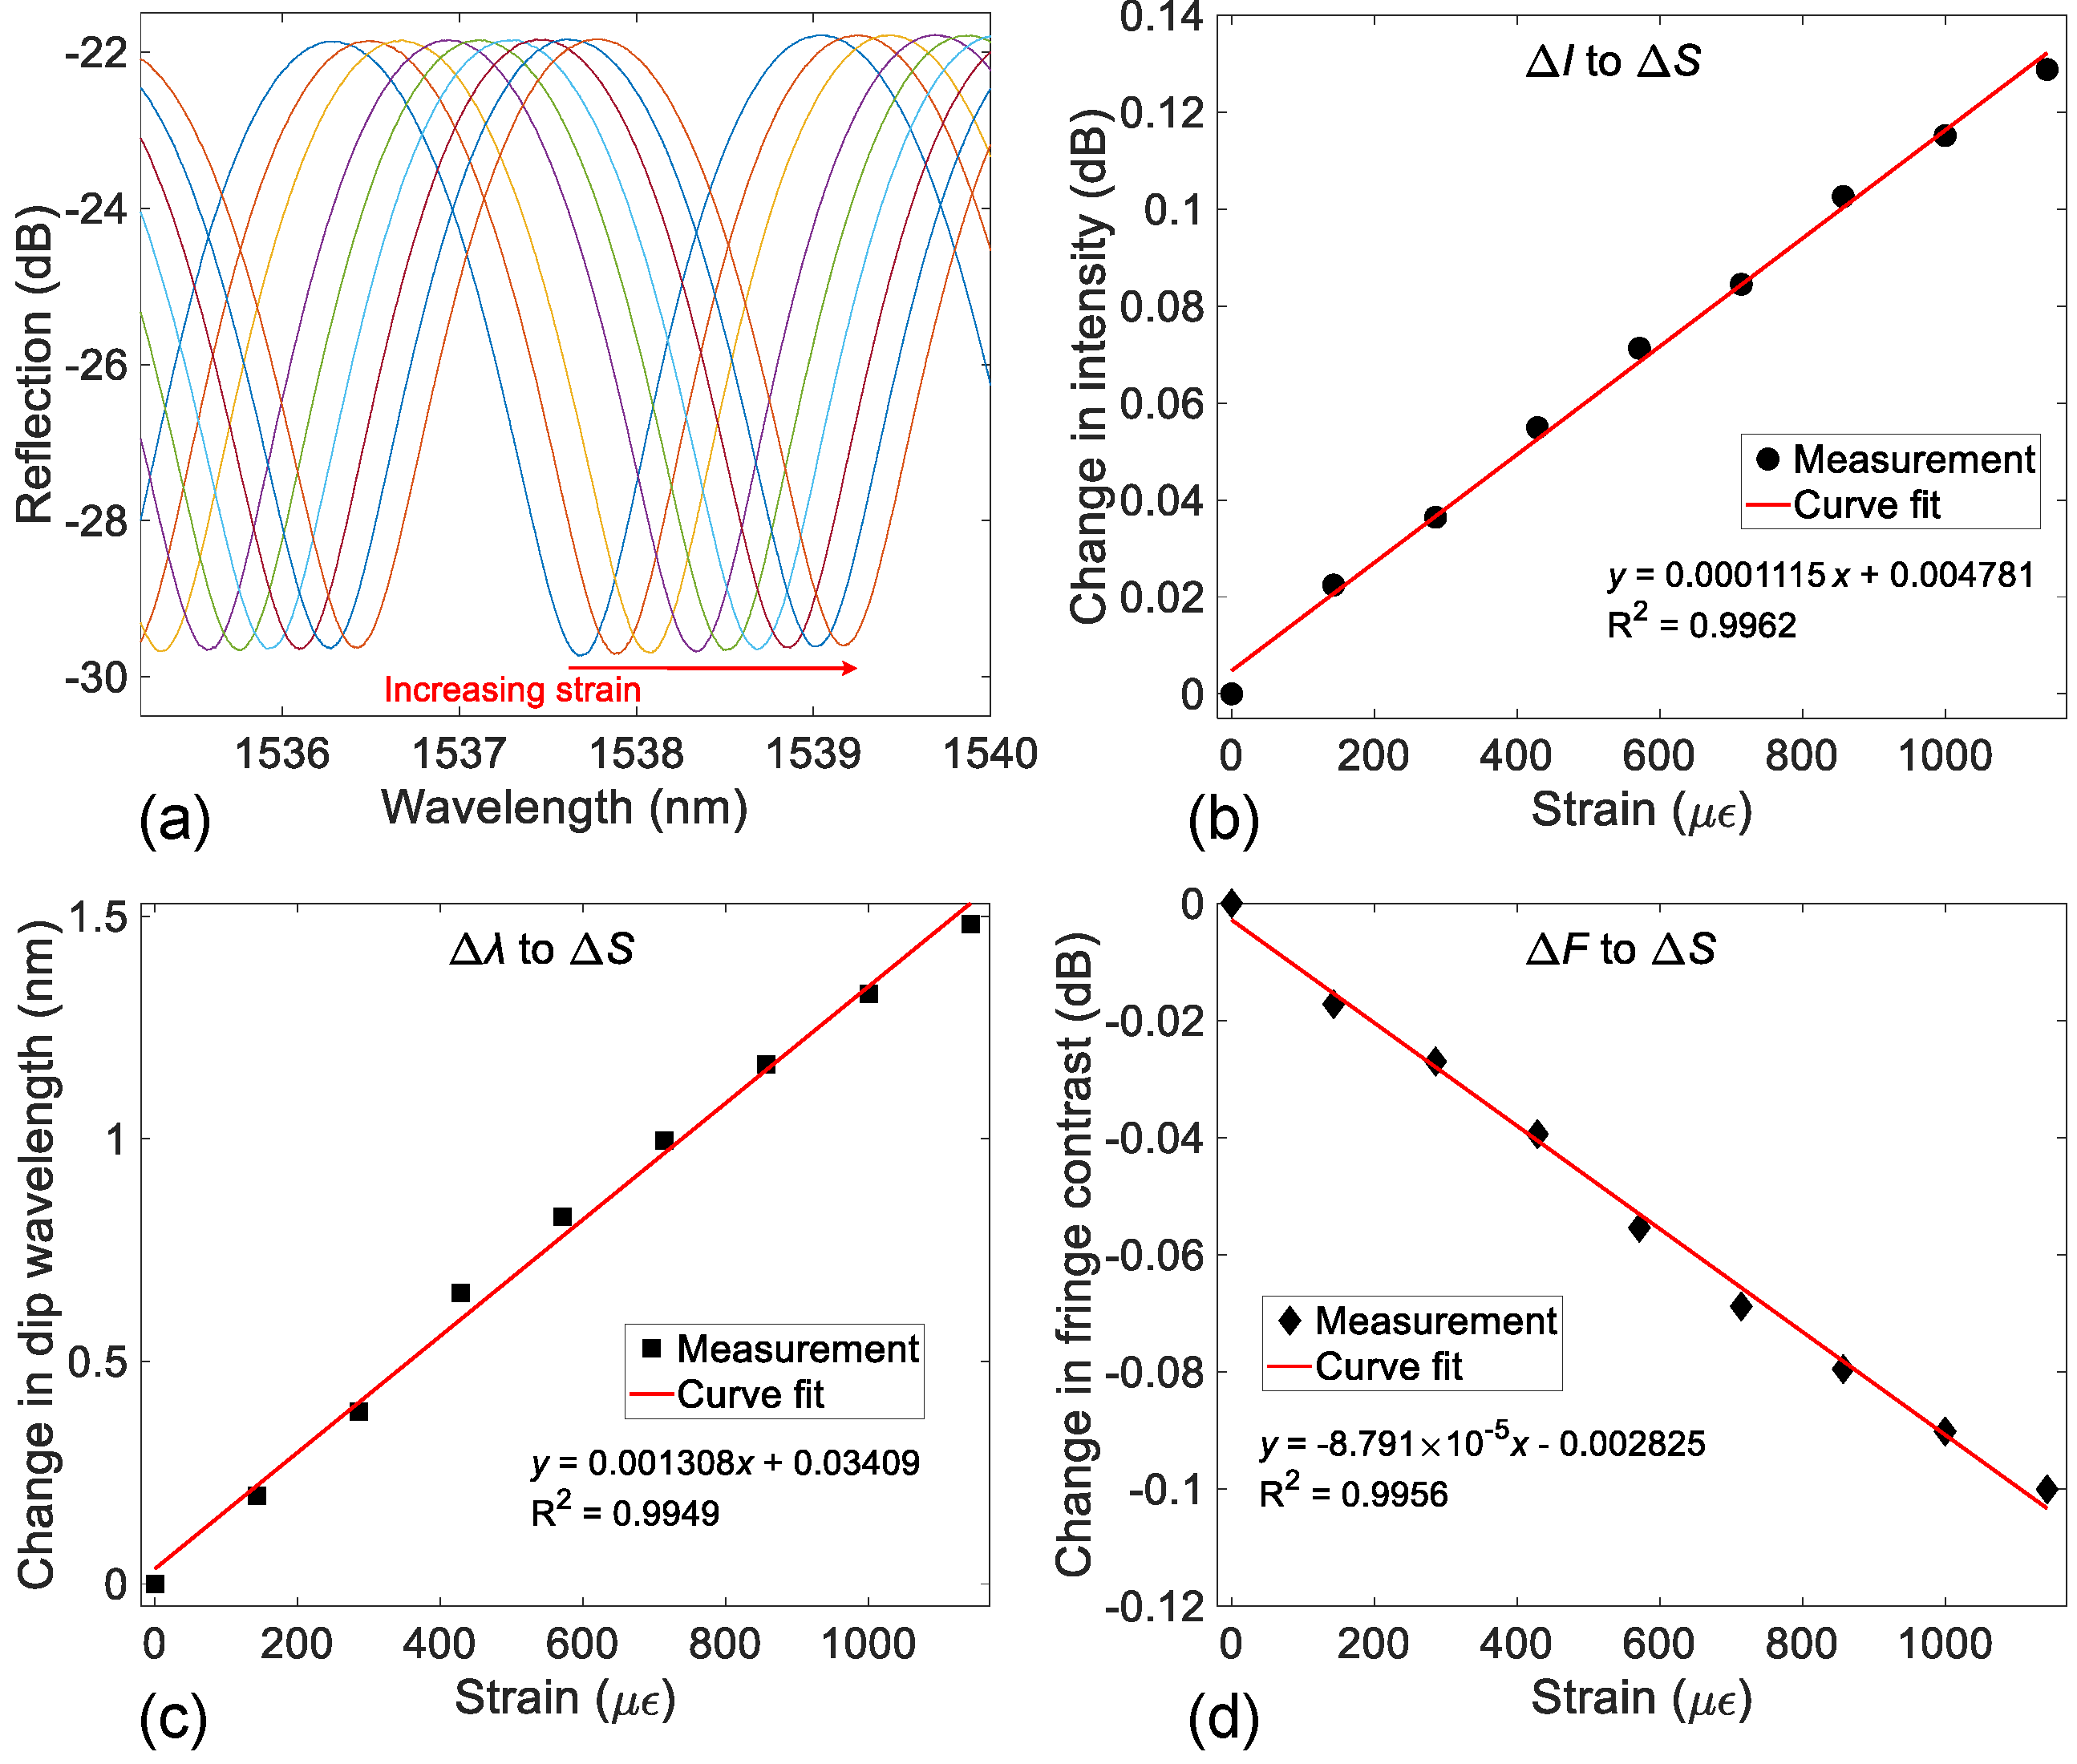
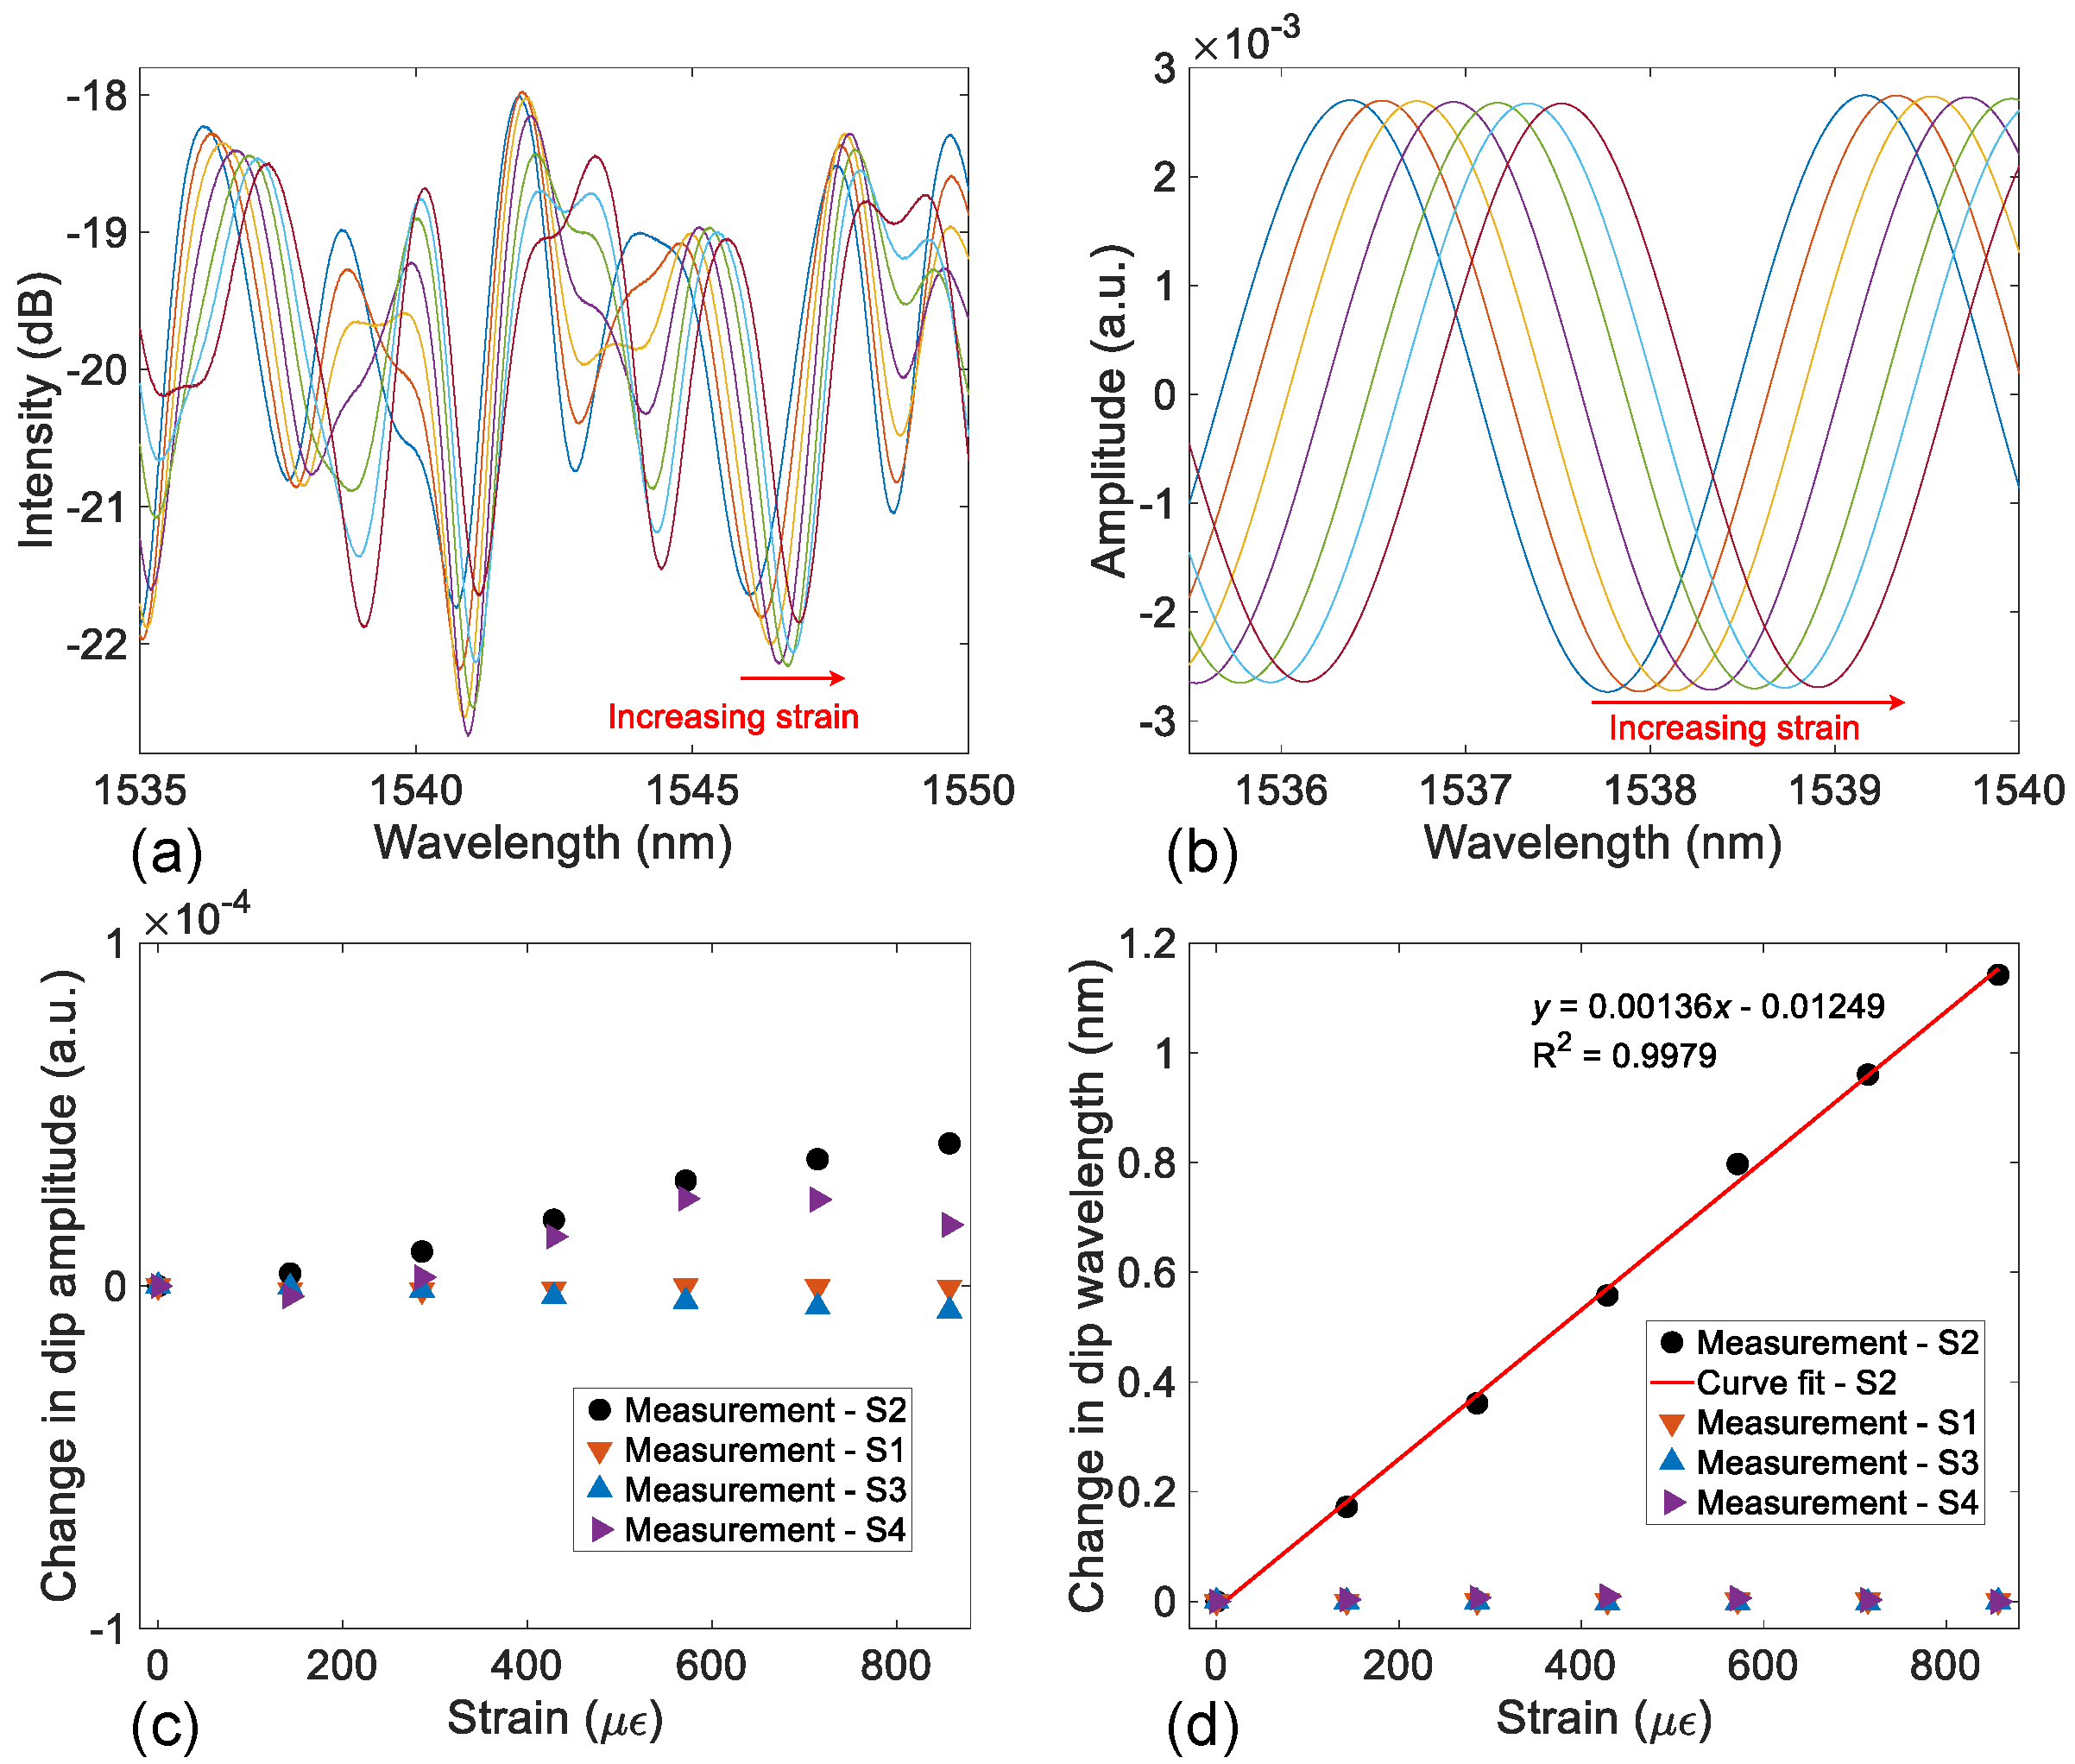
3.3. Single FPI Device for Strain Sensing

Next, a strain test was performed based on the two-stage setup shown in Figure 4a. The FPI-section fiber was elongated by moving one of the translation stages outwards. The measured reflection spectra of the device are plotted in Figure 8a for different settings of tensile strains. The spectrum shifted to the longer wavelength region, as expected, due to the elongation of the FPI air cavity. The intensity at the dip slightly increased as the applied tensile strain increased, as revealed in Figure 8b. Figure 8c,d presents the change in the dip wavelength and the change in the fringe contrast as a function of the applied strain, respectively. Linear curve fits were applied to the measured data points in the three cases, and the fitting results are indicated in the figure accordingly. According to the calibration results, one can conclude that the dominant mechanism that makes the FPI device a strain sensor is the FPI effect. Tensile strains applied to the device can be quantified by tracking the dip wavelength shift. Both the dip intensity and the fringe contrast show no significant dependence on the tensile strain.
Based on the calibration results shown above, the coefficient matrix shown in Equation (4) can be solved. By tracking the change in the dip intensity (ΔI), spectral shift (Δλ), and the change in the fringe contrast (ΔF), simultaneous measurements of curvature (ΔC), temperature (ΔT), and strain (ΔS) can be realized based on
Δ C Δ T Δ S = S I C S I T S I S S λ C S λ T S λ S S F C S F T S F S 1 Δ I Δ λ Δ F = 0.1966 0.02978 0.0001115 - 0.002746 0 0.001308 - 0.3076 - 0.04393 - 0.00008791 1 Δ I Δ λ Δ F .
Note that the curvature sensitivity shown in the inset in Figure 6b is employed in Equation (5). Therefore, the curvature measurement range is limited to 7~12.2 m−1 when Equation (5) is used to de-couple curvature, temperature, and strain variations.
Indeed, considering the FPI device as a curvature sensor with the change in the dip intensity as the reference variable, the temperature–curvature cross-sensitivity and strain–curvature cross-sensitivity can be determined to be 0.1515 m−1/°C and 0.0005671 m−1/ɛ, respectively. Thus, temperature variations could cause more confusion in the curvature measurement than strain variations. On the other hand, the FPI device can be used for temperature-insensitive strain sensing with a curvature–strain crosstalk coefficient of approximately 2 ɛ/m−1. Thus, the proposed FPI device is an ideal candidate for simultaneously measuring curvature and tensile strain by tracking the change in the dip intensity and the shift of the dip wavelength with negligible cross-talk. More importantly, the FPI is multiplexable, as shown in the next subsection.

3.4. Multiplexed FPI Sensors for Curvature and Strain Sensing

The capability of the proposed FPI device for multiplexing was then investigated based on the experimental setup shown in Figure 4b. Four FPI devices with different cavity lengths were multiplexed in parallel, and the measured superimposed reflection spectrum is given in Figure 9a. A relatively complex signal is obtained due to the superposition of the interference fringes from the four FPI devices. A fast Fourier transform was applied to the spectrum, and the calculated spatial domain signal is plotted in Figure 9b. Four distinct peaks can be observed, which correspond to the four different devices, as indicated in the figure, i.e., S1, S2, S3, and S4. The cavity lengths of the four devices were approximately 193 µm, 426 µm, 635 µm, and 772 µm. By applying a proper passband filter to the spatial domain signal, followed by a Fourier transform, the interference fringe of each device can be unambiguously reconstructed. Figure 9c presents the reconstructed individual interference spectrum of each of the devices. By tracking the changes in each spectrum, multi-point sensing can then be realized.
Curvature was applied to S2 in the multiplexed system, and the spectral responses of the system were recorded. The abovementioned signal processing was then employed for the demodulation of responses of each of the four devices. Figure 10a shows the measured spectral behavior of the system in a wavelength span of 15 nm (for clarity) when different settings of curvature were exerted on S2. Changes can be observed in the superimposed signal, but it would be challenging to identify the contribution of each device’s response. The reconstructed reflection spectra within a single fringe period of S2 at different settings of curvature are plotted in Figure 10b. Increases at the resonance dip can be seen, matching the results shown in Figure 6a well. A slight spectral shift can be noticed as well. The change in the dip amplitude and the dip wavelength as a function of curvature are plotted in Figure 10c,d, respectively. The responses obtained from the reconstructed spectra of S1, S3, and S4 are also shown for comparison. It is noted that S2 responded well to variations of curvature with changes in the dip amplitude; as expected, S1, S3, and S4 did not show significant responses due to the fact that curvature was only applied to S2. The dip wavelengths of all devices did not show significant shifts in the curvature test. The experiment results demonstrate that the four-device-multiplexed system can be used for multi-point curvature sensing with little crosstalk between sensors by tracking the changes in the dip amplitude of the reconstructed interference spectrum of each sensor.
A strain test was also performed, where tensile strains were applied to S2 only by elongating the device S2 using the two-stage-stretching-based approach shown in Figure 4a. Figure 11a presents the recorded spectra from the four-device-multiplexed system for different settings of tensile strains. More involved changes could be observed, compared to the spectra shown in Figure 10a. The same procedure was employed to acquire the individual responses from the four FPI devices. Figure 11b gives the reconstructed interference spectra of S2 at different settings of tensile strains. The spectrum shifted to the longer wavelength region as the tensile strain increased, which agrees with the results shown in Figure 8a, demonstrating reasonable responses of S2. Figure 11c,d shows the change in the dip amplitude and the change in the dip wavelength of S2 as a function of the applied tensile strain. The responses obtained from S1, S3, and S4 are plotted for comparison as well. The dip amplitudes of the four devices showed little dependence on the applied tensile strains. The dip wavelength of S2 increased linearly with increasing strains, whereas the dip wavelength of S1, S3, and S4 did not change significantly in the strain test. Thus, the results indicate that the four-device-multiplexed system can be used for multi-point strain sensing by tracking the spectral shift of the individual device.
According to the calibration results shown in Figure 10 and Figure 11, the four-device-multiplexed system can be potentially employed for multi-point simultaneous measurements of curvature and strain by tracking both the changes in the dip amplitude and the changes in the dip wavelength of the reconstructed interference spectra of the devices. The crosstalk between the curvature and strain measurements can be significantly eliminated based on the coefficient matrix approach discussed in Section 2.

4. Conclusions

In summary, we have proposed and experimentally demonstrated a miniature optical fiber FPI device with a cavity length of a few hundred µm for multi-parameter sensing. The construction of such an FPI device is quite simple, involving only fusion splicing a short length of capillary between two SMFs. The fabrication apparatus and details are given. The responses of a prototype device with a cavity length of ~426 µm to variations of curvature, strain, and temperature are discussed and experimentally quantified. By employing a simplified coefficient matrix calibration method, the proposed FPI device could be employed for simultaneously measuring curvature, strain, and temperature. Additionally, the capability of the FPI device for multiplexing is investigated, where four such prototypes with different air-cavity lengths, ~193 µm, 426 µm, 635 µm, and 772 µm, are multiplexed in a system in parallel based on the frequency-domain multiplexing technique. The interference spectrum of each of the devices can be unambiguously reconstructed, and can thus be used for multi-parameter sensing, i.e., measurements of curvature and strain. The proposed air-cavity FPI device is easy to fabricate, robust, and cost-effective, and is expected to find applications in medical engineering, human–machine interactive sensing, and structural health monitoring.

Author Contributions

Conceptualization, C.Z.; methodology, C.Z.; software, C.Z. and H.Z.; validation, C.Z. and H.Z.; formal analysis, C.Z., H.Z., O.A., W.N. and L.M.; investigation, C.Z.; resources, C.Z.; data curation, C.Z.; writing—original draft preparation, C.Z.; writing—review and editing, C.Z.; funding acquisition, L.M. All authors have read and agreed to the published version of the manuscript.

Funding

Center-initiated Research Project of Zhejiang Lab (No. K2022ME0AL05), Research Initiation Project of Zhejiang Lab (No. 2022ME0PI01), Researchers Supporting Project number (RSPD2023R654), King Saud University, Riyadh, Saudi Arabia.

Institutional Review Board Statement

Not applicable.

Informed Consent Statement

Not applicable.

Data Availability Statement

The data presented in this study are available on request from the corresponding author.

Acknowledgments

Researchers Supporting Project number (RSPD2023R654), King Saud University, Riyadh, Saudi Arabia.

Conflicts of Interest

The authors declare no conflict of interest.

References

  1. Wang, Q.; Liu, Y. Review of optical fiber bending/curvature sensor. Measurement 2018, 130, 161–176. [Google Scholar] [CrossRef]
  2. Di, H.; Xin, Y.; Jian, J. Review of optical fiber sensors for deformation measurement. Optik 2018, 168, 703–713. [Google Scholar] [CrossRef]
  3. Amanzadeh, M.; Aminossadati, S.M.; Kizil, M.S.; Rakić, A.D. Recent developments in fibre optic shape sensing. Measurement 2018, 128, 119–137. [Google Scholar] [CrossRef]
  4. Parent, F.; Loranger, S.; Mandal, K.K.; Iezzi, V.L.; Lapointe, J.; Boisvert, J.-S.; Baiad, M.D.; Kadoury, S.; Kashyap, R. Enhancement of accuracy in shape sensing of surgical needles using optical frequency domain reflectometry in optical fibers. Biomed. Opt. Express 2017, 8, 2210–2221. [Google Scholar] [CrossRef] [PubMed]
  5. Ma, J.; Asundi, A. Structural health monitoring using a fiber optic polarimetric sensor and a fiber optic curvature sensor-static and dynamic test. Smart Mater. Struct. 2001, 10, 181. [Google Scholar] [CrossRef]
  6. Lu, P.; Lalam, N.; Badar, M.; Liu, B.; Chorpening, B.T.; Buric, M.P.; Ohodnicki, P.R. Distributed optical fiber sensing: Review and perspective. Appl. Phys. Rev. 2019, 6, 041302. [Google Scholar] [CrossRef]
  7. Joe, H.-E.; Yun, H.; Jo, S.-H.; Jun, M.B.; Min, B.-K. A review on optical fiber sensors for environmental monitoring. Int. J. Precis. Eng. Manuf.-Green Technol. 2018, 5, 173–191. [Google Scholar] [CrossRef]
  8. Wang, S.; Zhang, W.-G.; Chen, L.; Zhang, Y.-X.; Geng, P.-C.; Wang, B.; Yan, T.-Y.; Li, Y.-P.; Hu, W. Bending vector sensor based on the multimode-2-core-multimode fiber structure. IEEE Photonics Technol. Lett. 2016, 28, 2066–2069. [Google Scholar] [CrossRef]
  9. Wu, Y.; Pei, L.; Jin, W.; Jiang, Y.; Yang, Y.; Shen, Y.; Jian, S. Highly sensitive curvature sensor based on asymmetrical twin core fiber and multimode fiber. Opt. Laser Technol. 2017, 92, 74–79. [Google Scholar] [CrossRef]
  10. Zhao, Y.; Cai, L.; Li, X.-G. Temperature-insensitive optical fiber curvature sensor based on SMF-MMF-TCSMF-MMF-SMF structure. IEEE Trans. Instrum. Meas. 2016, 66, 141–147. [Google Scholar] [CrossRef]
  11. Fernandes, C.S.; Giraldi, M.T.M.R.; de Sousa, M.J.; Costa, J.C.; Gouveia, C.; Jorge, P.; Franco, M.A. Curvature and vibration sensing based on core diameter mismatch structures. IEEE Trans. Instrum. Meas. 2016, 65, 2120–2128. [Google Scholar] [CrossRef]
  12. Villatoro, J.; Van Newkirk, A.; Antonio-Lopez, E.; Zubia, J.; Schülzgen, A.; Amezcua-Correa, R. Ultrasensitive vector bending sensor based on multicore optical fiber. Opt. Lett. 2016, 41, 832–835. [Google Scholar] [CrossRef] [PubMed]
  13. Li, C.; Ning, T.; Zhang, C.; Li, J.; Zhang, C.; Wen, X.; Lin, H.; Pei, L. All-fiber multipath Mach Zehnder interferometer based on a four-core fiber for sensing applications. Sens. Actuators A Phys. 2016, 248, 148–154. [Google Scholar] [CrossRef]
  14. Ou, Z.; Yu, Y.; Yan, P.; Wang, J.; Huang, Q.; Chen, X.; Du, C.; Wei, H. Ambient refractive index-independent bending vector sensor based on seven-core photonic crystal fiber using lateral offset splicing. Opt. Express 2013, 21, 23812–23821. [Google Scholar] [CrossRef]
  15. Salceda-Delgado, G.; Van Newkirk, A.; Antonio-Lopez, J.; Martinez-Rios, A.; Schülzgen, A.; Correa, R.A. Compact fiber-optic curvature sensor based on super-mode interference in a seven-core fiber. Opt. Lett. 2015, 40, 1468–1471. [Google Scholar] [CrossRef]
  16. Zhou, R.; Qiao, X.; Wang, R.; Chen, F.; Ma, W. An optical fiber sensor based on lateral-offset spliced seven-core fiber for bending and stretching strain measurement. IEEE Sens. J. 2020, 20, 5915–5920. [Google Scholar] [CrossRef]
  17. Fu, H.; Zhao, N.; Shao, M.; Li, H.; Gao, H.; Liu, Q.; Yong, Z.; Liu, Y.; Qiao, X. High-sensitivity Mach–Zehnder interferometric curvature fiber sensor based on thin-core fiber. IEEE Sens. J. 2014, 15, 520–525. [Google Scholar]
  18. Gong, H.; Yang, X.; Ni, K.; Zhao, C.-L.; Dong, X. An optical fiber curvature sensor based on two peanut-shape structures modal interferometer. IEEE Photonics Technol. Lett. 2013, 26, 22–24. [Google Scholar] [CrossRef]
  19. Gong, H.; Song, H.; Zhang, S.; Jin, Y.; Dong, X. Curvature sensor based on hollow-core photonic crystal fiber Sagnac interferometer. IEEE Sens. J. 2013, 14, 777–780. [Google Scholar] [CrossRef]
  20. Ni, K.; Li, T.; Hu, L.; Qian, W.; Zhang, Q.; Jin, S. Temperature-independent curvature sensor based on tapered photonic crystal fiber interferometer. Opt. Commun. 2012, 285, 5148–5150. [Google Scholar] [CrossRef]
  21. Marrujo-García, S.; Hernández-Romano, I.; Torres-Cisneros, M.; May-Arrioja, D.A.; Minkovich, V.P.; Monzón-Hernández, D. Temperature-independent curvature sensor based on in-fiber Mach–Zehnder interferometer using hollow-core fiber. J. Light. Technol. 2020, 38, 4166–4173. [Google Scholar] [CrossRef]
  22. Zhao, Y.; Cai, L.; Li, X.-G. In-fiber modal interferometer for simultaneous measurement of curvature and temperature based on hollow core fiber. Opt. Laser Technol. 2017, 92, 138–141. [Google Scholar] [CrossRef]
  23. Herrera-Piad, L.A.; Hernández-Romano, I.; May-Arrioja, D.A.; Minkovich, V.P.; Torres-Cisneros, M. Sensitivity enhancement of curvature fiber sensor based on polymer-coated capillary hollow-core fiber. Sensors 2020, 20, 3763. [Google Scholar] [CrossRef] [PubMed]
  24. Cheng, H.; Wu, S.; Wang, Q.; Wang, S.; Lu, P. In-line hybrid fiber sensor for curvature and temperature measurement. IEEE Photonics J. 2019, 11, 6803311. [Google Scholar] [CrossRef]
  25. Zhao, Y.; Chen, M.-q.; Xia, F.; Cai, L.; Li, X.-G. Small curvature sensor based on butterfly-shaped Mach–Zehnder interferometer. IEEE Trans. Electron Devices 2017, 64, 4644–4649. [Google Scholar] [CrossRef]
  26. Gong, Y.; Zhao, T.; Rao, Y.-J.; Wu, Y. All-fiber curvature sensor based on multimode interference. IEEE Photonics Technol. Lett. 2011, 23, 679–681. [Google Scholar] [CrossRef]
  27. Silva, S.; Frazão, O.; Viegas, J.; Ferreira, L.; Araújo, F.; Malcata, F.X.; Santos, J. Temperature and strain-independent curvature sensor based on a singlemode/multimode fiber optic structure. Meas. Sci. Technol. 2011, 22, 085201. [Google Scholar] [CrossRef]
  28. Niu, Y.; Chen, Q.; Zhao, C.; Wang, D. Highly sensitive optical fiber bending sensor based on hollow core fiber and single mode fiber. Optik 2021, 228, 166209. [Google Scholar] [CrossRef]
  29. Zhu, C.; Gerald, R.E.; Huang, J. A dual-parameter internally calibrated Fabry-Perot microcavity sensor. IEEE Sens. J. 2019, 20, 2511–2517. [Google Scholar] [CrossRef]
  30. Gao, H.; Jiang, Y.; Zhang, L.; Cui, Y.; Jiang, Y.; Jia, J.; Jiang, L. Antiresonant mechanism based self-temperature-calibrated fiber optic Fabry–Perot gas pressure sensors. Opt. Express 2019, 27, 22181–22189. [Google Scholar] [CrossRef]
  31. Islam, M.; Ali, M.M.; Lai, M.-H.; Lim, K.-S.; Ahmad, H. Chronology of Fabry-Perot interferometer fiber-optic sensors and their applications: A review. Sensors 2014, 14, 7451–7488. [Google Scholar] [CrossRef]
  32. Bitarafan, M.H.; DeCorby, R.G. On-chip high-finesse Fabry-Perot microcavities for optical sensing and quantum information. Sensors 2017, 17, 1748. [Google Scholar] [CrossRef]
  33. Pfeifer, H.; Ratschbacher, L.; Gallego, J.; Saavedra, C.; Faßbender, A.; von Haaren, A.; Alt, W.; Hofferberth, S.; Köhl, M.; Linden, S. Achievements and perspectives of optical fiber Fabry–Perot cavities. Appl. Phys. B 2022, 128, 29. [Google Scholar] [CrossRef]
  34. Ebermann, M.; Neumann, N.; Hiller, K.; Seifert, M.; Meinig, M.; Kurth, S. Tunable MEMS Fabry-Pérot Filters for Infrared Microspectrometers: A Review; MOEMS and Miniaturized Systems XV, 2016; SPIE: Cergy-Pontoise, France, 2016; pp. 64–83. [Google Scholar]
  35. Rao, Y.-J. Recent progress in fiber-optic extrinsic Fabry–Perot interferometric sensors. Opt. Fiber Technol. 2006, 12, 227–237. [Google Scholar] [CrossRef]
  36. Yu, Q.; Zhou, X. Pressure sensor based on the fiber-optic extrinsic Fabry-Perot interferometer. Photonic Sens. 2011, 1, 72–83. [Google Scholar] [CrossRef]
  37. Zhu, C.; Zhuang, Y.; Zhang, B.; Muhammad, R.; Wang, P.P.; Huang, J. A miniaturized optical fiber tip high-temperature sensor based on concave-shaped Fabry–Perot cavity. IEEE Photonics Technol. Lett. 2018, 31, 35–38. [Google Scholar] [CrossRef]
  38. Ouyang, Y.; Guo, H.; Ouyang, X.; Zhao, Y.; Zheng, Z.; Zhou, C.; Zhou, A. An in-fiber dual air-cavity Fabry–Perot interferometer for simultaneous measurement of strain and directional bend. IEEE Sens. J. 2017, 17, 3362–3366. [Google Scholar] [CrossRef]
  39. Leal-Junior, A.G.; Avellar, L.M.; Diaz, C.A.; Frizera, A.; Marques, C.; Pontes, M.J. Fabry–Pérot curvature sensor with cavities based on UV-curable resins: Design, analysis, and data integration approach. IEEE Sens. J. 2019, 19, 9798–9805. [Google Scholar] [CrossRef]
  40. Xu, X.; He, J.; Hou, M.; Liu, S.; Bai, Z.; Wang, Y.; Liao, C.; Ouyang, Z.; Wang, Y. A miniature fiber collimator for highly sensitive bend measurements. J. Light. Technol. 2018, 36, 2827–2833. [Google Scholar] [CrossRef]
  41. Novais, S.; Silva, S.O.; Frazão, O. Curvature detection in a medical needle using a Fabry-Perot cavity as an intensity sensor. Measurement 2020, 151, 107160. [Google Scholar] [CrossRef]
  42. Zhang, X.; Pan, H.; Bai, H.; Yan, M.; Wang, J.; Deng, C.; Wang, T. Transition of Fabry-Perot and antiresonant mechanisms via a SMF-capillary-SMF structure. Opt. Lett. 2018, 43, 2268–2271. [Google Scholar] [CrossRef] [PubMed]
  43. Sun, W.; Zhang, X.; Yu, Y.; Yang, L.; Hou, F.; Yang, Y.; Wang, T. Comparative study on transmission mechanisms in a SMF-capillary-SMF structure. J. Light. Technol. 2020, 38, 4075–4085. [Google Scholar] [CrossRef]
  44. Zheng, H.-K.; Lv, R.-Q.; Zhao, Y.; Wang, X.-X.; Lin, Z.-T.; Zhou, Y.-F.; Zhao, Q. A novel high accuracy optical path difference compensation method based on phase difference technology. Opt. Lasers Eng. 2021, 137, 106367. [Google Scholar] [CrossRef]
Figure 1. The FPI sensor. (a) Schematic diagram of the FPI sensor constructed by splicing a section of a capillary tube between two SMFs. The free end of the lead-out fiber is terminated to avoid additional reflection. (b) Microscope image of the cross-sectional view of the capillary tube used in this work to show the hollow air core.
Photonics 10 00580 g001
Figure 2. Conceptual illustration of the proposed FPI device for multi-parameter sensing.
Photonics 10 00580 g002
Figure 3. Sensor fabrication. (a) Microscope image of the interface between the SMF and the capillary. (b) Photograph of the high-precision cleaving platform developed to precisely control the air-cavity length of the FPI device, affording an approximate accuracy of 10 µm. (c) Microscope image of a prototype device with a cavity length of ~520 µm.
Photonics 10 00580 g003
Figure 4. Schematic illustration of the experimental setup. (a) Schematic diagrams of the system and the apparatus employed to characterize the FPI device’s responses to different quantities, i.e., curvature, strain, and temperature. (b) Schematic diagram of the system used for multi-point sensing.
Photonics 10 00580 g004
Figure 5. Characterization of the reflection signal measured using the FPI device without curvature applied. (a) Reflection spectrum. (b) Spatial domain signal obtained by performing Fourier transform to the reflection spectrum.
Photonics 10 00580 g005
Figure 6. Responses of the FPI device to variations of the applied curvature. (a) Measured spectral responses within a single fringe period from the device. (b) The change in intensity at the destructive interference point (i.e., ΔI) as a function of the applied curvature. A second-order polynomial curve fit was applied to the discrete data points, and the fitting results are indicated in the figure. The inset gives an enlarged view of the device’s response in the curvature range of 7~12.2 m−1, where a linear response is demonstrated by means of a linear curve fit. (c) The change in the dip wavelength (i.e., Δλ) as a function of the applied curvature. A linear curve fit was applied, and the fitting results are indicated in the figure. (d) The change in the fringe contrast (i.e., ΔF) as a function of the applied curvature. A second-order polynomial curve fit was first applied to the discrete data points, showing predictable responses. An enlarged view of the device’s response in the curvature range of 7~12.2 m−1 is given in the inset, where a linear response is shown and a linear curve fit model was applied.
Photonics 10 00580 g006
Figure 7. Responses of the FPI device to variations in temperature. (a) Measured spectral responses within a single fringe period from the device at different settings of temperature. (b) The change in the dip intensity (i.e., ΔI) as a function of temperature, showing a linear relationship, as revealed by the curve fit model. (c) The change in the dip wavelength (i.e., Δλ) as a function of the temperature. The dip wavelength shows little changes (±0.002 nm) during the temperature test. (d) The change in the fringe contrast (i.e., ΔF) as a function of the temperature. A linear curve fit was applied to quantify the sensitivity, and the results are indicated in the figure.
Photonics 10 00580 g007
Figure 8. Responses of the FPI device to variations in the tensile strains. (a) An enlarged view of the measured spectral responses in the wavelength range 1535~1540 nm. (b) The change in the dip intensity (i.e., ΔI) as a function of strain. (c) The change in the dip wavelength (i.e., Δλ) as a function of strain. (d) The change in the fringe contrast (i.e., ΔF) as a function of strain. Linear curve fits were applied in the three measurements to quantify the corresponding sensitivities (i.e., the slopes of the fitted curve), and the fitting results are indicated in the figures.
Photonics 10 00580 g008
Figure 9. Characterization of the reflection signal measured from the four-device-multiplexed system without curvature applied to the devices. (a) Reflection spectrum in a log scale. (b) Spatial domain signal obtained by performing a Fourier transform to the reflection spectrum. Four peaks revealed in the spatial domain signal correspond to the four devices with different cavity lengths. (c) Reconstructed interference spectra in a linear scale of the four devices.
Photonics 10 00580 g009
Figure 10. Responses of the four-device-multiplexed system to variations of the applied curvature exerted on S2. (a) Measured spectral responses within a wavelength span of 15 nm. (b) Reconstructed interference spectra within a single fringe period of S2 for different settings of curvature. (c) The change in intensity at the destructive interference point of S2 as a function of the applied curvature. A second-order polynomial curve fit was applied to the measurement points, and the fitting results are shown in the figure. An enlarged view of the device’s response in the curvature range of 7~12.2 m−1 is given in the inset, showing a linear response, as revealed by the linear curve fit. The responses of S1, S3, and S4 are also plotted for comparison. (d) The change in the dip wavelength of S2 as a function of the applied curvature. A linear curve was applied. The responses of S1, S3, and S4 are also plotted for comparison. Note that the responses of S1, S3, and S4 are obtained from the corresponding reconstructed interference spectra, and the fringe dips at ~1540 nm were used as the reference.
Photonics 10 00580 g010
Figure 11. Responses of the four-device-multiplexed system to variations of the tensile strains exerted on S2. (a) Measured spectral responses within a wavelength span of 15 nm. The spectrum mostly shifted to the longer wavelength region with increasing tensile strains. (b) Reconstructed interference spectra within a single fringe period of S2 for different settings of tensile strains. (c) The change in the dip amplitude of S2 as a function of the applied strain. The responses of S1, S3, and S4 are also shown. (d) The change in the dip wavelength of S2 as a function of the applied strain. A linear response was revealed by applying a linear curve fit, as indicated in the figure. The responses of S1, S3, and S4 are also plotted for comparison. Note that the responses of S1, S3, and S4 are obtained from the corresponding reconstructed interference spectra, and the fringe dips at ~1540 nm were used as reference.
Photonics 10 00580 g011
Disclaimer/Publisher’s Note: The statements, opinions and data contained in all publications are solely those of the individual author(s) and contributor(s) and not of MDPI and/or the editor(s). MDPI and/or the editor(s) disclaim responsibility for any injury to people or property resulting from any ideas, methods, instructions or products referred to in the content.

