Communication

Demodulation of Fiber Specklegram Curvature Sensor Using Deep Learning

1
School of Optical-Electrical and Computer Engineering, University of Shanghai for Science and Technology, Shanghai 200093, China
2
Zhangjiang Laboratory, 100 Haike Road, Shanghai 201204, China
3
Shanghai Key Lab of Modern Optical System, University of Shanghai for Science and Technology, Shanghai 200093, China
4
Institute of Modern Optics, Nankai University, Tianjin 300350, China
*
Author to whom correspondence should be addressed.
Photonics 2023, 10(2), 169; https://doi.org/10.3390/photonics10020169
Submission received: 27 December 2022 / Revised: 1 February 2023 / Accepted: 2 February 2023 / Published: 5 February 2023

Abstract

:
In this paper, a learning-based fiber specklegram sensor for bending recognition is proposed and demonstrated. Specifically, since the curvature-induced variations of mode interference in optical fibers can be characterized by speckle patterns, Resnet18, a classification model based on convolutional neural network architecture with excellent performance, is used to identify the bending state and disturbed position simultaneously according to the speckle patterns collected from the distal end of the multimode fiber. The feasibility of the proposed scheme is verified by rigorous experiments, and the test results indicate that the proposed sensing system is effective and robust. The accuracy of the trained model is 99.13%, and the prediction speed can reach 4.75 ms per frame. The scheme proposed in this work has the advantages of low cost, easy implementation, and a simple measurement system and is expected to find applications in distributed sensing and bending identification in complex environments.

1. Introduction

Curvature sensing is critical in many applications such as architecture, mechanical engineering, and the aerospace industry. Optical fiber curvature sensors have attracted extensive attention due to their advantages of small size, high sensitivity, and anti-electromagnetic interference. According to the sensing principle, the reported fiber curvature sensors can be roughly divided into three categories: fiber interferometer [1,2,3,4,5,6,7,8], long-period fiber grating (LPFG) [9,10,11,12,13,14,15], and fiber Bragg grating (FBG) [16,17,18,19]. The above schemes all show excellent performance, but most of them rely on the expensive experimental setup and complex sensing structures, which introduces uncertainty and reduces practicality [20]. For example, it is generally necessary to improve the sensitivity of fiber interferometers by twisting [3], etching [4], splicing [1,7], and tapering [5,8], which sacrifices repeatability and increases experimental effort. In this context, fiber specklegram sensors based on relatively simple measurement systems and sensing structures are particularly attractive. Multimode fiber (MMF) specklegram is a kind of pattern with random intensity distribution, which is generated by the interference between eigenmodes. Because the statistical characteristics of speckle patterns are susceptible to external disturbances, fiber specklegram sensors have excellent sensing performance and are widely used in various fields [20,21,22,23,24,25,26,27].
As a research hotspot in recent years, deep learning, a data-driven method that mines and learns the inherent characteristics of given data through multi-layer data processing units, has achieved remarkable results in the engineering field [28,29]. In view of the extraordinary success achieved in engineering, deep learning has attracted more and more attention from researchers in other disciplines. In the past few years, deep learning has become a new method to demodulate fiber specklegram [30,31,32,33,34]. In 2020, L. Yan et al. proposed a neural network based on VGG (Visual Geometry Group Network) architecture to demodulate the fiber specklegram bending sensor, which could analyze 21 bending states of the MMF with a prediction accuracy of 96.6% [33]. In 2022, G. Li et al. proposed a fiber specklegram bending sensor based on a regression neural network with a prediction accuracy of 0.3 m−1 [32]. Data-driven deep learning treats the fiber specklegram sensor as a black box, allowing the model to learn the mapping relationship between perturbations and speckle patterns collected at the distal end of the fiber sensor from a large amount of data. Moreover, the measurement range of the learning-based fiber specklegram sensor only depends on its calibration range, demonstrating the potential to overcome the shortcomings of traditional schemes. However, the reported learning-based scheme can only predict a single parameter and does not fully exploit the potential of deep learning.
In this paper, we proposed and demonstrated a learning-based fiber specklegram bending sensor that can simultaneously identify the bending state and the disturbed position. A simple measurement system consisting of a piece of MMF, a laser source, and a commercial camera is used to sense bending and record the speckle patterns corresponding to different curvatures. Resnet18, a classification model based on a convolutional neural network, is used to bridge speckle patterns with the parameters to be measured. The trained model can output the corresponding bending state and bending position according to the speckle pattern. Overall, 105 groups of samples collected from different bending states and bending positions were employed to train the model, and the test results showed that the recognition accuracy of the trained model could reach 99.13%, and the prediction speed was 4.75 milliseconds per frame. The learning-based measurement scheme proposed in this work has the advantages of high stability, good robustness, easy implementation, and low cost, which is expected to promote the application of fiber specklegram sensors in actual scenes.

2. Materials and Methods

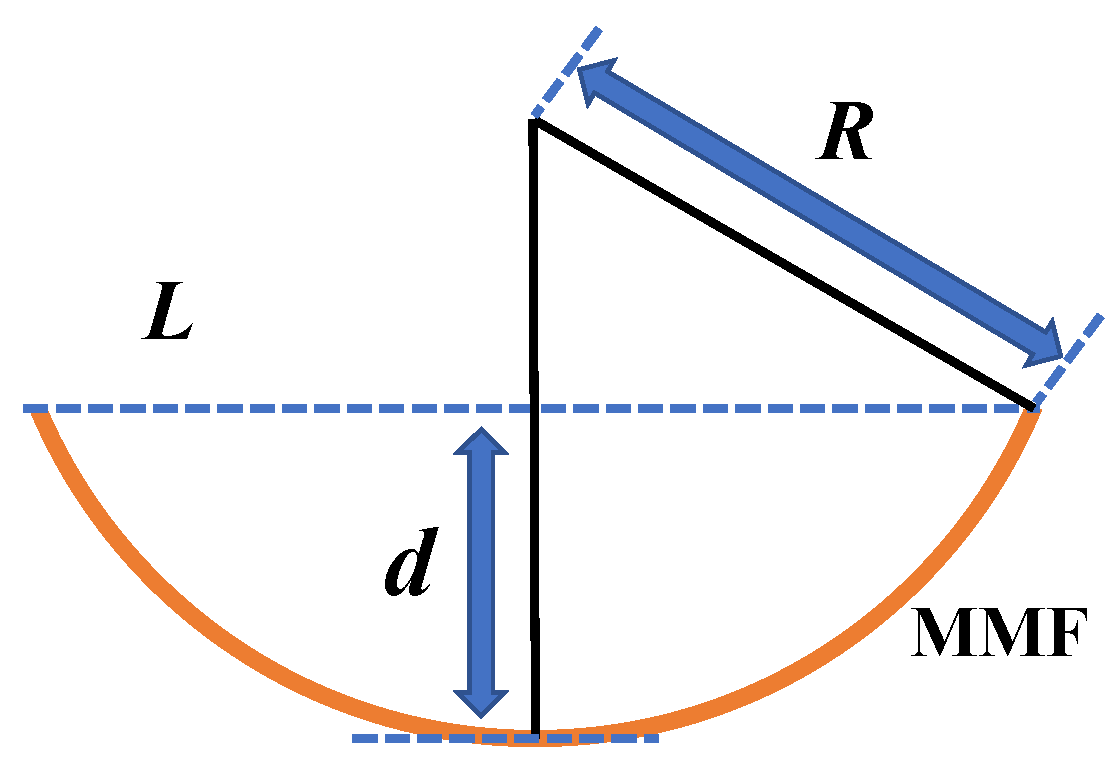
2.1. Principle of Operation

The illumination light launched into the MMF will be distorted due to the interference between propagation modes with different propagation constants, resulting in a pattern with bright and dark spots at the distal end of the fiber. This pattern is the fiber specklegram, which can be expressed as the coherent superposition of the eigenmodes excited in the MMF as given as follows:
A ( x , y ) = m = 0 M a m ( x , y ) exp ( j [ ϕ m ( x , y ) ] )
where M is the number of eigenmodes excited in MMF, a m ( x , y ) is the amplitude distribution of the m-th mode, and ϕ m ( x , y ) is the phase distribution of the m-th mode. In the experiment, the camera can only detect the intensity distribution of the speckle field, which can be expressed as follows:
I ( x , y ) = | A ( x , y ) | 2 = n = 0 M m = 0 M a m a n exp ( j [ ϕ m ϕ n ] )
It can be found that the intensity distribution of the speckle field depends on the interference between eigenmodes and will change with the variation of mode transmission. When the fiber is bent, the variation of ϕ m would be different, resulting in a change in the spatial characteristics of the speckle pattern. Therefore, the specklegram can be interpreted as a representation of bending behavior of MMF.
The fiber specklegram sensor based on the classification neural network proposed in this work can simultaneously identify the bending state and the disturbed position according to the speckle pattern. The operation steps of the proposed scheme are as follows: First of all, some areas on the optical fiber are selected as monitored positions. Then, one of the positions is selected as the research object, and different disturbances are applied to the optical fiber at that position. The speckle patterns corresponding to different bending states are recorded by the camera. At this time, the optical fibers within other positions remain stationary. All positions are recorded according to the above method, and the collected speckle patterns are divided into different categories according to the disturbed position and curvature. Next, the processed speckle patterns are used to generate the data set and classification table. Since the demodulation model employed in this work is a classification neural network, it is necessary to encode the disturbed position and curvature into different categories and use a classification table to store the encoding and decoding details. The classification table contains two elements, i.e., the category N and the corresponding coordinates (CP, CC). The values of category N range from 1 to 101, representing 101 pre-designed categories. The CP in the coordinates (CP, CC) represents the perturbed position, and CC denotes the curvature. Then, the neural network is trained using the generated dataset. Finally, the speckle patterns collected in the unknown state are fed into the network, and the trained model can directly output the classification results according to the given samples. By querying the classification table, the bending state and disturbed position of unknown samples can be identified simultaneously according to the output results of the model. In this work, five monitored positions were selected, and 21 bending states were applied to each position. It should be noted that the measurement range of the proposed scheme only depends on the calibration range. The model can be further expanded by increasing the number of monitored positions and bending states.

2.2. Convolutional Neural Network

As a subset of deep learning, convolutional neural networks (CNNs) have attracted a great deal of attention due to their excellent performance and have achieved remarkable results in the field of computer science and engineering [35]. CNN extracts the intrinsic features of the sample by performing multiple and multi-layer convolution operations on the given data, which can effectively capture useful spatial information and local correlation in the image. In optical and photonics research, CNN is also a guaranteed candidate to analyze high-dimensional data, such as the spectral response of photonic devices and speckle patterns of scattering media. The architecture of CNN-based classification neural network is shown in Figure 1, which is mainly composed of feature extraction and classification. In feature extraction, the block structure composed of the convolution layer, pooling layer, and activation function is often used to extract abstract information of given data. The full-connection layer is utilized to classify objects according to the extracted high-dimensional information.
In this work, the classification model used is Resnet [36,37], which won the ILSVRC (ImageNet Large Scale Visual Recognition Challenge) in 2015. Compared to the conventional CNN, the Resnet model is significantly more effective in solving the gradient explosion, gradient disappearance, and degradation problems. Since there are obvious differences between the speckle patterns corresponding to different curvatures, a relatively simple Resnet18 architecture is used in this work to demodulate the specklegram.

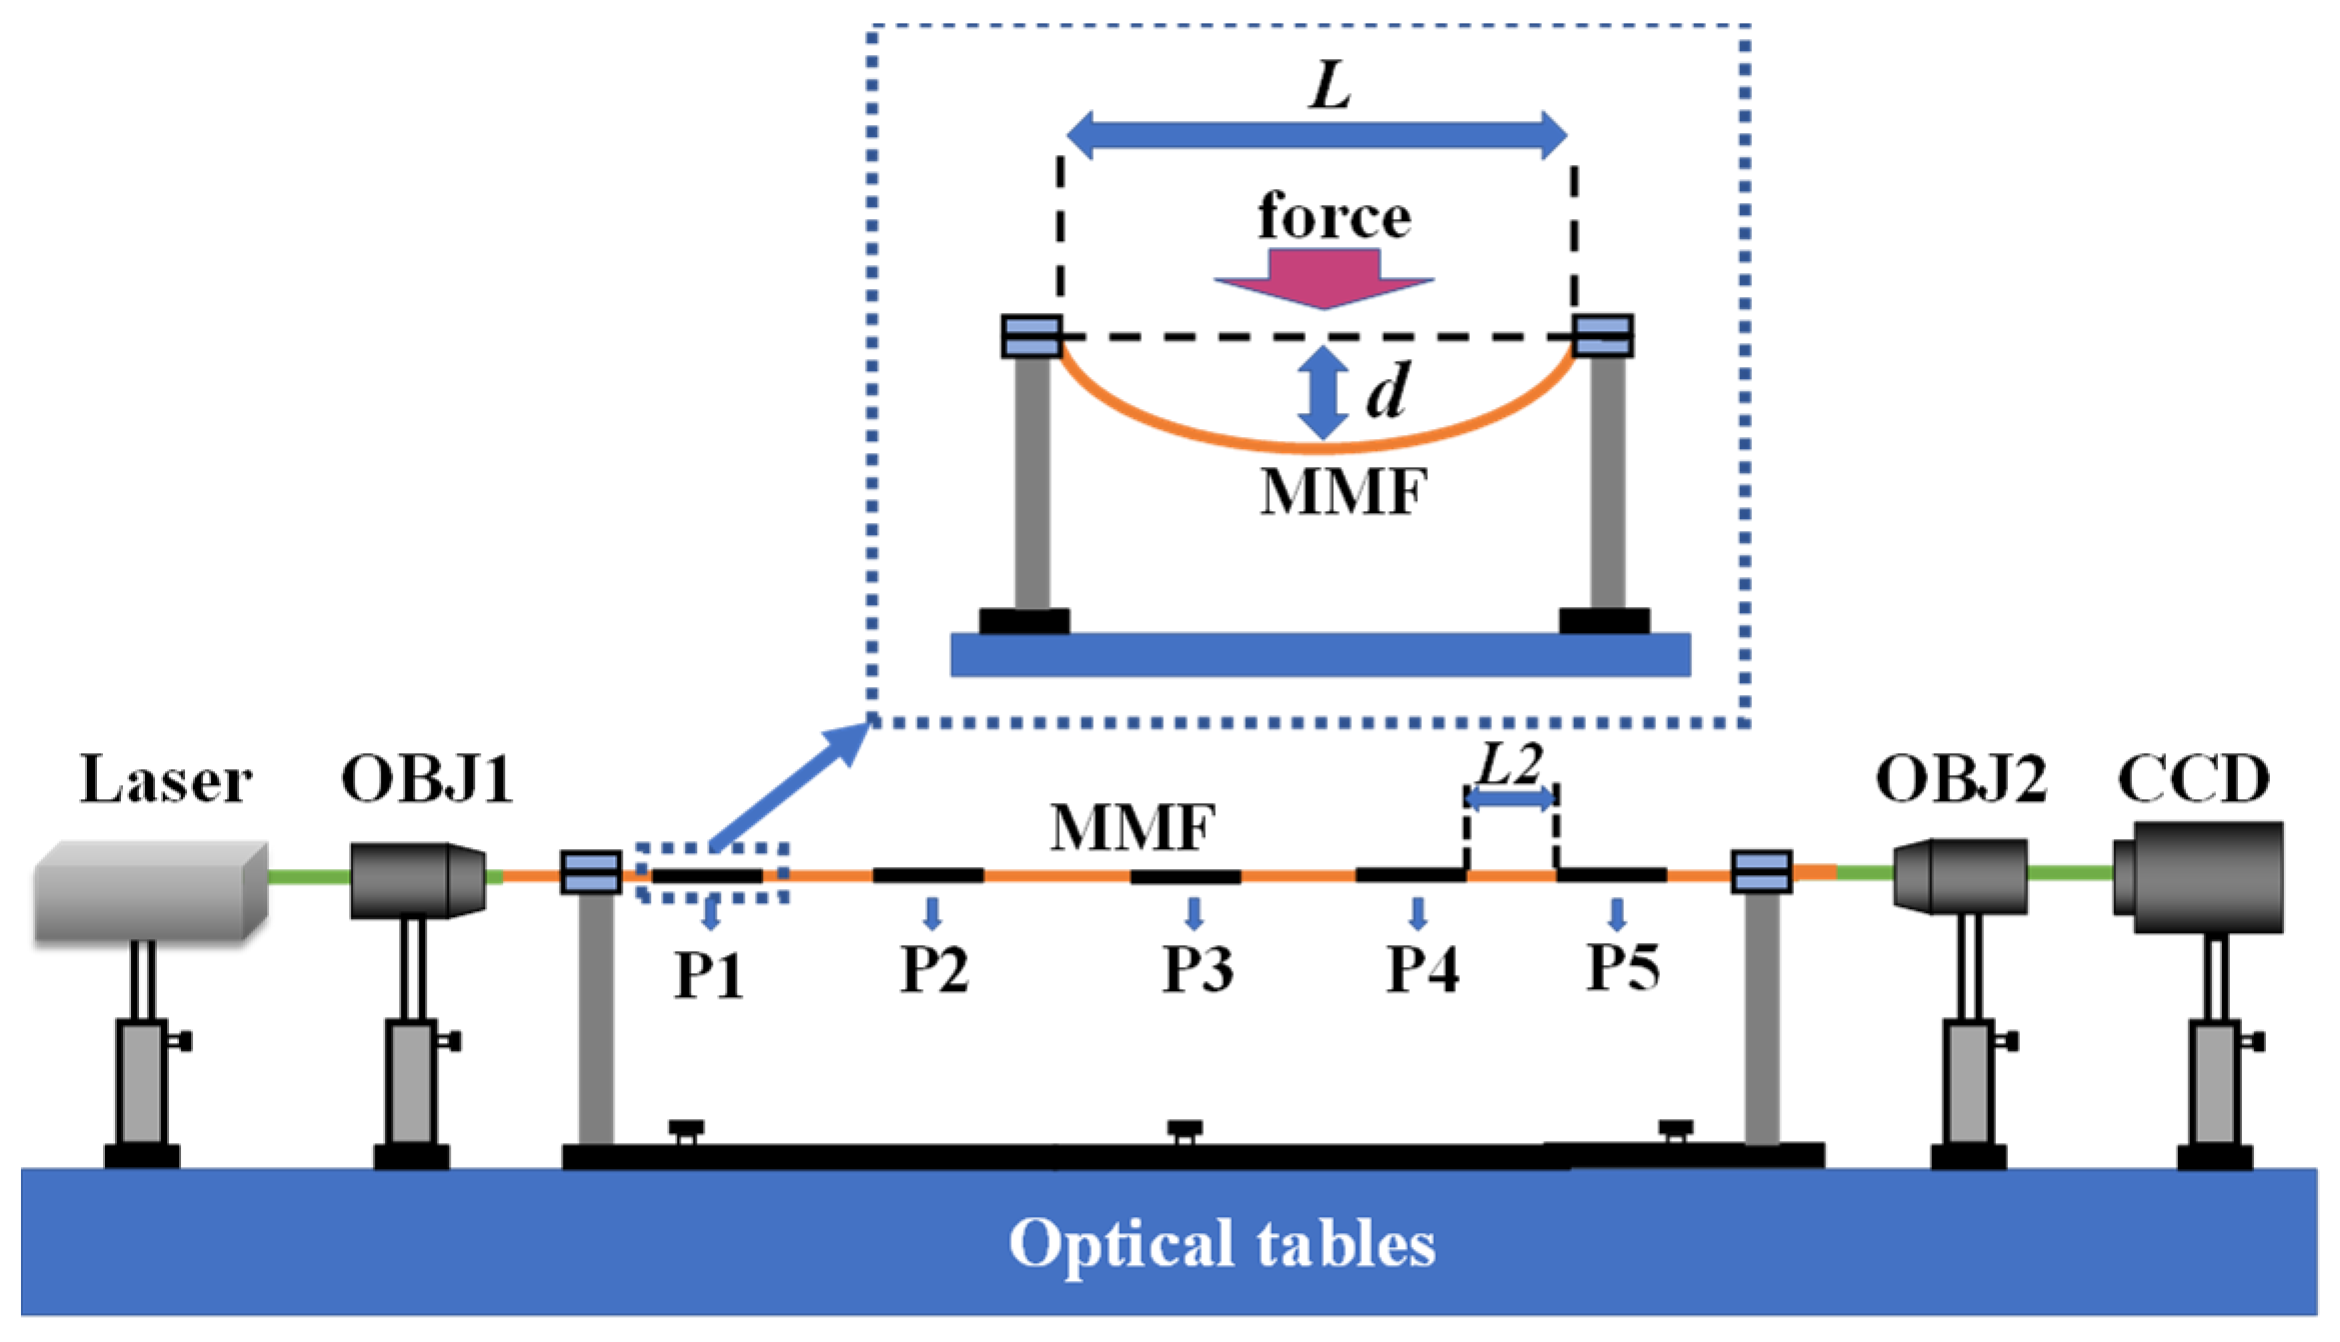
2.3. Experimental Setup

The experimental setup is shown in Figure 2. The illumination light emitted from the solid-state laser (MGL-III, 532 nm, 50 mW) is launched into the MMF (step index, 62.5/125 μm core/cladding diameters, 1.5 m length). The objective (OBJ2, Nikon, CFI40X, 40×, NA = 0.75) is placed at the output plane of the MMF to image the speckle pattern on a charge-coupled device (CCD) camera (FLIR, GS3-U3-91S6M-C, 3376 × 2704 pixels).
To monitor curvature and disturbed position simultaneously, it is necessary to collect data under different conditions. Five positions are selected from the MMF and labeled P1, P2, P3, P4, and P5, respectively. The length L of each monitored position is 80 mm, and the distance L2 between adjacent positions is 100 mm. The bending response of each position is measured using the setup described in the upper panel of Figure 2. The optical fiber within the position to be measured is mounted on the gripper to keep all movement restrictions except along fiber axis-direction freedom. A displacement d is applied in the middle of the fiber within the position, which is controlled by a precise micrometer driver. In this case, the curvature radius R of the multimode fiber (MMF), as shown in Figure 3, can be approximately expressed as given:
R 2 = ( R d ) 2 + ( L 2 ) 2
Therefore, the curvature C of the bent fiber can be expressed as follows [14]:
C = 1 R = 2 d d 2 + L 2 4

2.4. Data Preparation

The preparation of the dataset can be divided into two steps. The first step is to collect speckle patterns corresponding to different bending states and different perturbed positions. Specifically, the first marked position P1 is selected as the research object. Then, the bending state of the fiber within position P1 is changed, and the speckle patterns corresponding to different curvatures are recorded. In this process, other marked positions need to remain static. In this work, the applied displacement d is from 0 mm to 2 mm, and the corresponding curvature is from 0 m−1 to 2.5 m−1. The displacement step is 0.1 mm, and 21 groups of data are collected, including 20 different bending states and original states. Next, 20 images are collected for each group, and the collection process is repeated 10 times to ensure that the model could thoroughly learn the change rule. For all monitored positions, the speckle pattern corresponding to the original state is the same. Therefore, the original state only needs to be collected once at position P1. All marked positions were tested according to the above method, and 20,200 speckle patterns were obtained. The second step is to make the training set and test set according to the collected data. The captured 20,200 specklegrams are randomly divided into 12,120 training, 4040 validation, and 4040 testing sets.

3. Results and Discussion

The Resnet18 was implemented on a computer equipped with an NVIDIA RTX2060 graphics processing unit and i7-10857H CPU. During training, the solver is designated as Adam, the maximum number of epochs is 30, and the batch size is set as 30. The initial learning rate is set to 0.01 and adjusted every 10 epochs. The transfer learning strategy is utilized when training the Resnet18 model. Specifically, the weights of the feature extraction layer of the Resnet18 network, which was pre-trained on the ImageNet dataset, are extracted and loaded onto the model built in this work. Then, the dataset consisting of speckle patterns, as described in Section 2.4, is used to train the built model. Transfer learning can alleviate the uncertainty caused by initial value sensitivity, which is conducive to improving learning ability and convergence speed.
Before learning, the images in the data set need to be preprocessed. The format of the speckle pattern captured by the camera is 3376 × 2704 pixels. In general, since high-dimensional input samples will seriously reduce the convergence speed of the model, high-resolution images will not be directly fed into the neural network. In this work, the collected speckle pattern is cut into a window centered on the speckle and downsampled to 224 × 224 pixels. To more intuitively demonstrate the variation of the speckle pattern induced by curvature, the specklegrams corresponding to different curvatures are collected from position P1 and displayed in Figure 4. The upper panel of Figure 4 shows the speckle patterns when the curvature is 0 m−1, 0.62 m−1, 1.25 m−1, and 1.87 m−1, respectively, while the bottom panel shows the difference between adjacent patterns. It can be found that there are apparent differences between speckle patterns corresponding to different curvatures at the same position, which is consistent with the previous analysis.
To study the feasibility of multi-parameter measurement scheme based on speckle pattern, the same curvature was applied to the five calibrated positions, respectively, and the corresponding speckle patterns were collected, as shown in Figure 5. The upper panel of Figure 5 shows the speckle patterns collected from positions P1, P2, P3, P4, and P5, respectively, while the bottom panel is the difference between adjacent patterns. When the same disturbance is applied to different positions of the optical fiber, the speckle patterns generated at the distal end of the MMF are also different. Therefore, it can be concluded that when the fiber is disturbed with different intensity or from different positions, the speckle patterns observed at the output plane of MMF are different, which indicates that the multi parameter measurement based on speckle patterns is feasible.
Next, the preprocessed dataset is employed to train the Resnet18 model. The learning curves of the Resnet18 model are shown in Figure 6, where Figure 6a depicts the relationship between classification accuracy and epoch during the training process. The loss during learning is plotted as a function of the epoch, as shown in Figure 6b. The training time of the Resnet18 model is 177 min. It can be found that after 10 epochs, the Resnet18 model tends to converge and reaches a stable state with high accuracy, indicating that the model has learned the mapping relationship between speckle pattern and curvature quickly and thoroughly. In addition, this model shows similar classification accuracy in both the training set and test set, which demonstrates that the trained model has satisfactory generalization ability.
The generalization ability of the trained model is quantified using the testing set. The classification speed can reach 4.75 milliseconds per frame. By convention, the confusion matrix of the trained model on the testing set is calculated, as shown in Figure 7. Confusion matrix, a visual tool, is generally used to describe the deviation between the predicted value and the true value. It can be found from Figure 7 that most of the elements in the confusion matrix are gathered on the diagonal, indicating that there is good consistency between the true value and the predicted value obtained by using the trained model.
To quantitatively describe the generalization ability of the proposed scheme, the absolute position classification error and the absolute curvature classification error of the trained model on the test set were calculated separately, as shown in Figure 8. Figure 8a depicts the histogram of the absolute position-classification error. It can be found that the recognition accuracy of the model for the disturbed positions is 100%. Figure 8b shows the histogram of the absolute curvature classification error. The trained model has a demodulation accuracy of 99.13% for curvature, and most of the errors are concentrated around the target value.
Both vibration and temperature fluctuations introduce uncertainty into the measurement process. To estimate the measurement uncertainty, a long-term quantification of the stability of the measurement system was performed. In the stability test, the bending state of the fiber was kept constant for about 10 h at room temperature. A speckle pattern was collected from the distal end of the fiber every minute, and the Pearson correlation coefficient (PCC) was used to describe the correlation between these speckle patterns. The test results are shown in Figure 9. It can be found that although the correlation between the speckle patterns decreases with time, the correlation consistently remains above 97% for at least 10 h, demonstrating the robustness of the proposed sensing system.
In addition, the proposed scheme is also applicable to demodulate simultaneous perturbations applied to multiple positions. The fibers within positions P1, P2, and P3 are considered as study targets, and the states of the fibers within positions P4 and P5 are kept constant. Three displacements (i.e., 0 mm, 1 mm, and 2 mm) are applied to the fiber within each selected position, resulting in a total of 27 configurations. Then, 200 speckle patterns are collected for each configuration according to the method described in Section 2.4, and the collected samples are divided into a training set and a test set according to a 4:1 ratio. The accuracy of the trained model is verified using the test set, and the confusion matrix is shown in Figure 10. The coordinates (Y1, Y2, Y3) used in Figure 10 are employed to describe the deformation state, where the x of the Yx represents the x-th monitored position, and the value of each Yx is defined as the applied displacement; i.e., 0 is 0 mm, 1 is 1 mm, and 2 is 2 mm. It can be found that the elements in the confusion matrix are clustered around the diagonal, and the classification accuracy of the model is 99.63%. The model proposed in this work is not only effective for single-point excitation but also applicable to the demodulation of simultaneous bending, demonstrating the superiority and generalization ability of the proposed scheme.
Compared with the reported fiber specklegram bending sensor based on the convolutional neural network [32,33], the advantages of the proposed scheme are mainly reflected in two aspects. On the one hand, the scheme proposed in this paper has higher recognition accuracy. The accuracy of the reported bending identification scheme based on CNN architecture is 96.6%, while the accuracy of Resnet18 can reach 99.13%. On the other hand, the scheme described in this work can identify the bending state and the disturbed position simultaneously, which provides an enlightening reference for using neural networks to solve the distributed sensing problem. Compared with the reported KNN method [38], the proposed scheme in this work improves the demodulation speed and classification accuracy by approximately 10 times and 8%, respectively, demonstrating the superiority of the proposed scheme.

4. Conclusions

In conclusion, we demonstrated a learning-based fiber specklegram bending sensor, and rigorous experiments were carried out to verify its feasibility and effectiveness. Specifically, a CNN-based classification neural network was used to simultaneously identify the bending state and the disturbed position according to the speckle pattern recorded from the distal end of MMF. The experimental results indicate that the proposed bending recognition scheme is effective and robust, and the accuracy and prediction speeds of the trained model are 99.13% and 4.75 ms per frame, respectively. Furthermore, the proposed scheme is also applicable to demodulate simultaneous perturbations applied to multiple positions, and the classification accuracy of the model is 99.63%. The proposed scheme in this work only requires a relatively simple measurement system (based on a laser source and commercial camera) and a section of MMF, providing a promising candidate for distributed optical fiber sensing and bending recognition in complex environments.

Author Contributions

Conceptualization, L.G.; methodology, Z.Y.; software, H.G.; validation, Z.Y.; formal analysis, Z.Y.; investigation, Z.Y.; resources, L.G.; data curation, Z.Y.; writing—original draft preparation, Z.Y.; writing—review and editing, H.H.; visualization, Z.Y.; supervision, L.G.; project administration, L.G.; funding acquisition, L.G. All authors have read and agreed to the published version of the manuscript.

Funding

This research was funded by the National Natural Science Foundation of China, grant number 62005168, 62075132, and 92050202, and by Natural Science Foundation of Shanghai, grant number 22ZR1443100.

Institutional Review Board Statement

Not applicable.

Informed Consent Statement

Not applicable.

Data Availability Statement

The data presented in this study are available on request from the corresponding author.

Conflicts of Interest

The authors declare no conflict of interest.

References

  1. Wang, S.; Shan, C.; Jiang, J.; Liu, K.; Zhang, X.; Han, Q.; Lei, J.; Xiao, H.; Liu, T. Temperature-insensitive curvature sensor based on anti-resonant reflection guidance and Mach–Zehnder interferometer hybrid mechanism. Appl. Phys. Express 2019, 12, 106503. [Google Scholar] [CrossRef]
  2. Wang, S.; Zhang, Y.X.; Zhang, W.G.; Geng, P.C.; Yan, T.Y.; Chen, L.; Li, Y.P.; Hu, W. Two-Dimensional Bending Vector Sensor Based on the Multimode-3-Core-Multimode Fiber Structure. IEEE Photonics Technol. Lett. 2017, 29, 822–825. [Google Scholar] [CrossRef]
  3. Tian, K.; Xin, Y.; Yang, W.; Geng, T.; Ren, J.; Fan, Y.-X.; Farrell, G.; Lewis, E.; Wang, P. A Curvature Sensor Based on Twisted Single-Mode–Multimode–Single-Mode Hybrid Optical Fiber Structure. J. Light. Technol. 2017, 35, 1725–1731. [Google Scholar] [CrossRef]
  4. Wei, Y.; Jiang, T.; Liu, C.; Zhao, X.; Li, L.; Wang, R.; Shi, C.; Liu, C. Sawtooth Fiber MZ Vector Bending Sensor Available for Multi Parameter Measurement. J. Light. Technol. 2022, 40, 6037–6044. [Google Scholar] [CrossRef]
  5. Zhao, Y.; Zhou, A.; Guo, H.; Zheng, Z.; Xu, Y.; Zhou, C.; Yuan, L. An Integrated Fiber Michelson Interferometer Based on Twin-Core and Side-Hole Fibers for Multiparameter Sensing. J. Light. Technol. 2018, 36, 993–997. [Google Scholar] [CrossRef]
  6. Wu, Y.; Pei, L.; Jin, W.; Jiang, Y.; Yang, Y.; Shen, Y.; Jian, S. Highly sensitive curvature sensor based on asymmetrical twin core fiber and multimode fiber. Opt. Laser Technol. 2017, 92, 74–79. [Google Scholar] [CrossRef]
  7. Zhao, Y.; Cai, L.; Li, X.-G. In-fiber modal interferometer for simultaneous measurement of curvature and temperature based on hollow core fiber. Opt. Laser Technol. 2017, 92, 138–141. [Google Scholar] [CrossRef]
  8. Li, Z.; Zhang, Y.X.; Zhang, W.G.; Kong, L.X.; Yue, Y.; Yan, T.Y. Parallelized fiber Michelson interferometers with advanced curvature sensitivity plus abated temperature crosstalk. Opt. Lett. 2020, 45, 4996. [Google Scholar] [CrossRef]
  9. Li, Y.-P.; Zhang, W.G.; Wang, S.; Chen, L.; Zhang, Y.X.; Wang, B.; Yan, T.Y.; Li, X.Y.; Hu, W. Bending Vector Sensor Based on a Pair of Opposite Tilted Long-Period Fiber Gratings. IEEE Photonics Technol. Lett. 2017, 29, 224–227. [Google Scholar] [CrossRef]
  10. Wang, Y.P.; Rao, Y.J. A novel long period fiber grating sensor measuring curvature and determining bend-direction simultaneously. IEEE Sens. J. 2005, 5, 839–843. [Google Scholar] [CrossRef]
  11. Zhang, Y.X.; Zhang, W.G.; Zhang, Y.S.; Wang, S.; Bie, L.J.; Kong, L.X.; Geng, P.C.; Yan, T.Y. Bending Vector Sensing Based on Arch-Shaped Long-Period Fiber Grating. IEEE Sens. J. 2018, 18, 3125–3130. [Google Scholar] [CrossRef]
  12. Barrera, D.; Madrigal, J.; Sales, S. Long Period Gratings in Multicore Optical Fibers for Directional Curvature Sensor Implementation. J. Light. Technol. 2018, 36, 1063–1068. [Google Scholar] [CrossRef]
  13. Li, Z.; Liu, S.; Bai, Z.; Fu, C.; Zhang, Y.; Sun, Z.; Liu, X.; Wang, Y. Residual-stress-induced helical long period fiber gratings for sensing applications. Opt. Express 2018, 26, 24114–24123. [Google Scholar] [CrossRef] [PubMed]
  14. Lai, M.; Zhang, Y.; Li, Z.; Zhang, W.; Gao, H.; Ma, L.; Ma, H.; Yan, T. High-sensitivity bending vector sensor based on γ-shaped long-period fiber grating. Opt. Laser Technol. 2021, 142, 107255. [Google Scholar] [CrossRef]
  15. Zhang, Y.S.; Zhang, W.G.; Chen, L.; Zhang, Y.-X.; Wang, S.; Yu, L.; Li, Y.P.; Geng, P.-C.; Yan, T.-Y.; Li, X.-Y.; et al. Concave-lens-like long-period fiber grating bidirectional high-sensitivity bending sensor. Opt. Lett. 2017, 42, 3892–3895. [Google Scholar] [CrossRef]
  16. Yang, K.; He, J.; Liao, C.; Wang, Y.; Liu, S.; Guo, K.; Zhou, J.; Li, Z.; Tan, Z. Femtosecond Laser Inscription of Fiber Bragg Grating in Twin-Core Few-Mode Fiber for Directional Bend Sensing. J. Light. Technol. 2017, 35, 4670–4676. [Google Scholar] [CrossRef]
  17. Koo, B.; Kim, D.H. Directional bending sensor based on triangular shaped fiber Bragg gratings. Opt. Express 2020, 28, 6572–6581. [Google Scholar] [CrossRef]
  18. Yi, X.; Chen, X.; Fan, H.; Shi, F.; Cheng, X.; Qian, J. Separation method of bending and torsion in shape sensing based on FBG sensors array. Opt. Express 2020, 28, 9367–9383. [Google Scholar] [CrossRef]
  19. Zhu, F.; Zhang, Y.; Qu, Y.; Jiang, W.; Su, H.; Guo, Y.; Qi, K. Stress-insensitive vector curvature sensor based on a single fiber Bragg grating. Opt. Fiber Technol. 2020, 54, 102133. [Google Scholar] [CrossRef]
  20. Fujiwara, E.; da Silva, L.E.; Cabral, T.D.; de Freitas, H.E.; Wu, Y.T.; Cordeiro, C.M.D.B. Optical Fiber Specklegram Chemical Sensor Based on a Concatenated Multimode Fiber Structure. J. Light. Technol. 2019, 37, 5041–5047. [Google Scholar] [CrossRef]
  21. Rodríguez-Cuevas, A.; Peña, E.R.; Rodríguez-Cobo, L.; Lomer, M.; López-Higuera, J.M. Low-cost fiber specklegram sensor for noncontact continuous patient monitoring. J. Biomed. Opt. 2017, 22, 037001. [Google Scholar] [CrossRef]
  22. Hu, S.; Liu, H.; Liu, B.; Lin, W.; Zhang, H.; Song, B.; Wu, J. Self-temperature compensation approach for fiber specklegram magnetic field sensor based on polarization specklegram analysis. Meas. Sci. Technol. 2022, 33, 115101. [Google Scholar] [CrossRef]
  23. Gómez, J.A.; Lorduy, H.; Salazar, Á. Improvement of the dynamic range of a fiber specklegram sensor based on volume speckle recording in photorefractive materials. Opt. Lasers Eng. 2011, 49, 473–480. [Google Scholar] [CrossRef]
  24. Gómez, J.A.; Salazar, Á. Self-correlation fiber specklegram sensor using volume characteristics of speckle patterns. Opt. Lasers Eng. 2012, 50, 812–815. [Google Scholar] [CrossRef]
  25. Chen, W.; Feng, F.; Chen, D.; Lin, W.; Chen, S.-C. Precision non-contact displacement sensor based on the near-field characteristics of fiber specklegrams. Sens. Actuators A Phys. 2019, 296, 1–6. [Google Scholar] [CrossRef]
  26. Rodriguez-Cobo, L.; Lomer, M.; Cobo, A.; Lopez-Higuera, J.M. Optical fiber strain sensor with extended dynamic range based on specklegrams. Sens. Actuators A Phys. 2013, 203, 341–345. [Google Scholar] [CrossRef]
  27. Feng, F.; Chen, W.; Chen, D.; Lin, W.; Chen, S.-C. In-situ ultrasensitive label-free DNA hybridization detection using optical fiber specklegram. Sens. Actuators B Chem. 2018, 272, 160–165. [Google Scholar] [CrossRef]
  28. Gao, H.; Chen, Z.; Zhang, Y.-X.; Zhang, W.-G.; Hu, H.-F.; Yan, T.-Y. Rapid Mode Decomposition of Few-Mode Fiber By Artificial Neural Network. J. Light. Technol. 2021, 39, 6294–6300. [Google Scholar] [CrossRef]
  29. Gao, H.; Hu, H.; Zhao, Y.; Li, J. A real-time fiber mode demodulation method enhanced by convolution neural network. Opt. Fiber Technol. 2019, 50, 139–144. [Google Scholar] [CrossRef]
  30. Li, H.; Liang, H.; Hu, Q.; Wang, M.; Wang, Z. Deep learning for position fixing in the micron scale by using convolutional neural networks. Chin. Opt. Lett. 2020, 18, 050602. [Google Scholar] [CrossRef]
  31. Fujiwara, E.; Wu, Y.T.; Santos, M.F.M.; Schenkel, E.A.; Suzuki, C.K. Optical Fiber Specklegram Sensor for Measurement of Force Myography Signals. IEEE Sens. J. 2017, 17, 951–958. [Google Scholar] [CrossRef]
  32. Li, G.; Liu, Y.; Qin, Q.; Zou, X.; Wang, M.; Yan, F. Deep learning based optical curvature sensor through specklegram detection of multimode fiber. Opt. Laser Technol. 2022, 149, 107873. [Google Scholar] [CrossRef]
  33. Liu, Y.; Li, G.; Qin, Q.; Tan, Z.; Wang, M.; Yan, F. Bending recognition based on the analysis of fiber specklegrams using deep learning. Opt. Laser Technol. 2020, 131, 106424. [Google Scholar] [CrossRef]
  34. Liang, Q.; Li, Y.; Tao, J.; Wang, X.; Wang, T.; Gao, X.; Zhou, P.; Xu, B.; Zhao, C.; Kang, J.; et al. Demodulation of Fabry-Pérot sensors using random speckles. Opt. Lett. 2022, 47, 4806–4809. [Google Scholar] [CrossRef] [PubMed]
  35. Ma, W.; Liu, Z.; Kudyshev, Z.A.; Boltasseva, A.; Cai, W.; Liu, Y. Deep learning for the design of photonic structures. Nat. Photonics 2020, 15, 77–90. [Google Scholar] [CrossRef]
  36. Yang, C.; Chen, J.; Li, Z.; Huang, Y. Structural Crack Detection and Recognition Based on Deep Learning. Appl. Sci. 2021, 11, 2868. [Google Scholar] [CrossRef]
  37. He, K.; Zhang, X.; Ren, S.; Sun, J. Deep Residual Learning for Image Recognition. In Proceedings of the IEEE Conference on Computer Vision and Pattern Recognition (CVPR), Las Vegas, NV, USA, 27–30 June 2016; pp. 770–778. [Google Scholar]
  38. Wang, X.; Wang, Y.; Zhang, K.; Althoefer, K.; Su, L. Learning to sense three-dimensional shape deformation of a single multimode fiber. Sci. Rep. 2022, 12, 12684. [Google Scholar] [CrossRef] [PubMed]
Figure 1. The architecture of classification neural network based on CNN.
Photonics 10 00169 g001
Figure 2. Experimental setup of the proposed fiber specklegram bending sensing system. CCD, charge-coupled device camera; OBJ, objective; MMF, multimode fiber; P, bending position.
Photonics 10 00169 g002
Figure 3. Graphical representation of the curvature radius R.
Photonics 10 00169 g003
Figure 4. Speckle patterns corresponding to different curvatures collected from position P1 and their differences between the adjacent speckle patterns.
Photonics 10 00169 g004
Figure 5. Speckle patterns corresponding to the same curvature collected from different positions and their differences between the adjacent speckle patterns.
Photonics 10 00169 g005
Figure 6. Learning curve of model based on Resnet18 architecture. (a) The training accuracy is plotted as a function of epochs. (b) The relationship between loss and epochs.
Photonics 10 00169 g006
Figure 7. The confusion matrix of the testing set.
Photonics 10 00169 g007
Figure 8. The generalization ability of the trained model is described quantitatively. (a) The histogram of the absolute position classification error. (b) The histogram of the absolute curvature classification error.
Photonics 10 00169 g008
Figure 9. Stability test results of the sensing system.
Photonics 10 00169 g009
Figure 10. The confusion matrix when multiple monitored positions are perturbed simultaneously.
Photonics 10 00169 g010
Disclaimer/Publisher’s Note: The statements, opinions and data contained in all publications are solely those of the individual author(s) and contributor(s) and not of MDPI and/or the editor(s). MDPI and/or the editor(s) disclaim responsibility for any injury to people or property resulting from any ideas, methods, instructions or products referred to in the content.

