Article

Applicability of Extreme Vertices Design in the Compositional Optimization of 3D-Printed Lightweight High-Entropy-Alloy/B4C/ZrO2/Titanium Trihybrid Aero-Composite

by
Abayomi Adewale Akinwande
1,*,
Dimitry Moskovskikh
2,3,
Elena Romanovskaia
4,
Oluwatosin Abiodun Balogun
1,
J. Pradeep Kumar
5 and
Valentin Romanovski
2,4,*
1
Department of Metallurgical and Materials Engineering, Federal University of Technology Akure, Akure 340110, Nigeria
2
Center for Functional Nano-Ceramics, National University of Science and Technology, “MISIS”, Lenin Av., 119049 Moscow, Russia
3
Research Laboratory of Scanning Probe Microscopy, Moscow Polytechnic University, B. Semenovskaya St., 107023 Moscow, Russia
4
Department of Materials Science and Engineering, University of Virginia, Charlottesville, VA 22904, USA
5
Department of Mechanical Engineering, Kings Engineering College, Chennai 602117, India
*
Authors to whom correspondence should be addressed.
Math. Comput. Appl. 2023, 28(2), 54; https://doi.org/10.3390/mca28020054
Submission received: 4 February 2023 / Revised: 23 March 2023 / Accepted: 1 April 2023 / Published: 3 April 2023

Abstract

:
Recent studies have shown the benefits of utilizing ceramic particles as reinforcement in metal alloys; nevertheless, certain drawbacks, including loss of ductility, embrittlement, and decreases in toughness, have been noted. For the objective of obtaining balanced performance, experts have suggested the addition of metal particles as supplement to the ceramic reinforcement. Consequently, high-performance metal hybrid composites have been developed. However, achieving the optimal mix for the reinforcement combination with regards to the optimal performance of developed composite remains a challenge. This research aimed to determine the optimal mixture of Al50Cu10Sn5Mg20Zn10Ti5 lightweight high-entropy alloy (LHEA), B4C, and ZrO2 for the fabrication of trihybrid titanium composites via direct laser deposition. A mixture design was involved in the experimental design, and experimental data were modeled and optimized to achieve the optimal performance of the trihybrid composite. The ANOVA, response surface plots, and ternary maps analyses of the experimental results revealed that various combinations of reinforcement particles displayed a variety of response trends. Moreover, the analysis showed that these reinforcements significantly contributed to the magnitudes and trends of the responses. The generated models were competent for predicting response, and the best formulation consisted of 8.4% LHEA, 1.2% B4C, and 2.4% ZrO2.

1. Introduction

The aerospace and automotive sectors require lightweight materials with high strength, resistance to corrosion and wear, and fatigue resistance [1,2]. Iron, steel, and cast iron have high strengths, but their weight limits their usage in the aircraft industry. By virtue of their excellent strength-to-weight percentage, metal materials such as aluminum and titanium have gained popularity in this sector [3]. Titanium alloys have risen to prominence in aviation based on their promising features and greater strength than aluminum. Titanium composites are made by reinforcing the matrix with particles in order to enhance the properties of titanium alloys for aerospace applications. Comparing particulate reinforced titanium composite (PRTC) to the unreinforced alloy, the composite shows superior and enhanced properties, attracting the interest of researchers [4,5]. B4C, ZrO2, TiO2, SiO2, Al2O3, TiB2, and BN are examples of reinforcements that have been included into titanium matrices [6,7], resulting in enhanced performance. Ceramic particles have high operating temperatures and moduli; hence, they are employed in metal composites to increase thermal stability [8,9]. In addition, their use in metal composites has enhanced the composites’ hardness, wear resistance, and corrosion resistance.
Despite this, these ceramic particles have exhibited a number of drawbacks. Due to their brittle nature, their incorporation into metal matrices has led to a loss in ductility and embrittlement in composites [10,11]. Some findings also argued that ceramic particles in metal matrices have limitations in postfabrication operations, such as rolling and extrusion and finishing operations such as machining and milling of metal composites [12,13]. Some researchers have advocated the use of ductile metal particles as a replacement for ceramic particles [14,15], while others have advocated their use as a complement to ceramic particulates in metal composites. They believe that the ductility of the metal particles would compensate for the brittleness of the ceramic particles. Several studies have been conducted on this aspect; however, further research is required to confirm the offered perspective. Hybrid metal composites are generated by reinforcing a metal matrix with more than one particle. In accordance with the opinions of references [16,17,18], hybrid composites exhibit superior performance compared with single-particle-reinforced composites on the basis of the equilibrium of their characteristics. Metal–ceramic-reinforced metal matrix hybrid composites are fabricated and manufactured based on this theory.
On account of their ductility, high temperature stability, and wear and corrosion resistance, high-entropy alloys (HEAs) have recently acquired popularity. They are considered for aerospace applications because of their greater performance at high temperatures in comparison with nickel and its alloys utilized in turbine and high-temperature aerospace applications. HEA is thought to be a superior reinforcement in metal–metal composites [19], as a result of its multiple superior properties. On the basis of this concept, Luo et al. [20] strengthened aluminum 1050 with Al0.5CoCrFeNi HEA. The investigation revealed that 3 wt.% of HEA was responsible for 74.3% of the ultimate tensile strength, demonstrating a major contribution of HEA particle reinforcement. Similarly, 15 wt.% AlCoCrCuFe HEA inclusion in an aluminum matrix resulted in 89.6% appreciation in the hardness of the matrix, ensuing enhanced wear resistance [20]. Cao et al. [21] found that the flexural and fracture toughness of aluminum composites were improved by 124.6% and 107.6%, respectively, when 10 wt.% FeCoCrNiAl HEA particles were introduced into pure aluminum. According to Yang et al. [22], 10 vol.% AlCoCrFeNi HEA particles increased the yield stress and ultimate tensile strength of 5083-aluminum matrix by 25.1 and 31.9%, respectively. Similar accomplishments may be found in references [23,24,25]. Utilizing HEAs to improve the properties of metal composites has been substantiated by a study of the relevant literature. Lu et al. [26] showed that HEA is superior to ceramic particles such as SiC for matrix enhancement.
Most established HEAs have high densities; hence, their usage in light metal composites such as titanium and aluminum increases host matrix densities [27]. Recent lightweight high-entropy alloys (LHEA) are options for reinforcement in metal–metal matrix composites because of their light weight, which is desired for aerospace applications. In the current work, a lightweight HEA (Al50Cu10Sn5Mg20Zn10Ti5) possessing a density of 3.74 g/cm3 was engaged as a supplemental reinforcement to B4C and ZrO2 ceramic particle reinforcement in Ti6Al4V alloy in the fabrication of a trihybrid composite. Owing to its excellent strength-to-weight ratio, Ti6Al4V is widely employed in the aerospace industry for airframes, as well as engine and turbine components [28]. In an effort to increase its thermal stability and improve the high-temperature performance, ceramic particles B4C and ZrO2 are considered reinforcements based on their high-temperature stability. Al50Cu10Sn5Mg20Zn10Ti5 is a ductile LHEA particle; hence, its incorporation into the Ti6Al4V matrix was devised to counteract the brittleness of the ceramic particles.
Recent and contemporary studies are embracing additive manufacturing because of its speed, precision, near-net-shape flexibility, little material waste, and minimum or no post-manufacturing machining [29]. In light of this, the direct laser deposition (DLD) method was applied in the current investigation. Three reinforcing variables, LHEA, B4C, and ZrO2 percentage, were used in our investigation. In order to conduct a comprehensive factorial experimental investigation, 81 experimental runs were required, which is laborious and cost intensive. For the objective of reducing experimental costs and the associated labor, the mixture design approach was engaged in the design of experiments, as was the case in previous research [30,31,32]. Earlier works evaluated addressed the manufacture and design of HEA-reinforced metal composites without clear optimization processes and prediction models for the property responses, which is the major aim of this report.
Modeling and optimization of experimental outcomes are prevalent nowadays [33]. Recent research [34] has involved the design of the experiment, modeling of the experimental result (for forecasting of response), and optimization of the experimental data for sintered Fe1.2CrZnCuAlTi0.8 reinforced aluminum 7075 composite. In the investigation, different amounts of HEA were optimized under various fabrication conditions of compaction pressure and sintering temperature. The experiment was designed with Box Behnken Design (BBD). Nonetheless, in the current study, mixture design of experiment (MoE) is used since the variables are in the same form (powder); hence, the focus is on the quantity of mixture and not manufacturing conditions, as in the case in ref. [34]. Consequently, the intention of this report is to establish the ideal ratio of LHEA, B4C, and ZrO2 for producing an optimal trihybrid titanium composite. This work hereafter focuses critically on response surface analysis, development and validation of mathematical models for future response prediction, and multi-objective optimization of obtained experimental results.

2. Experimental Program

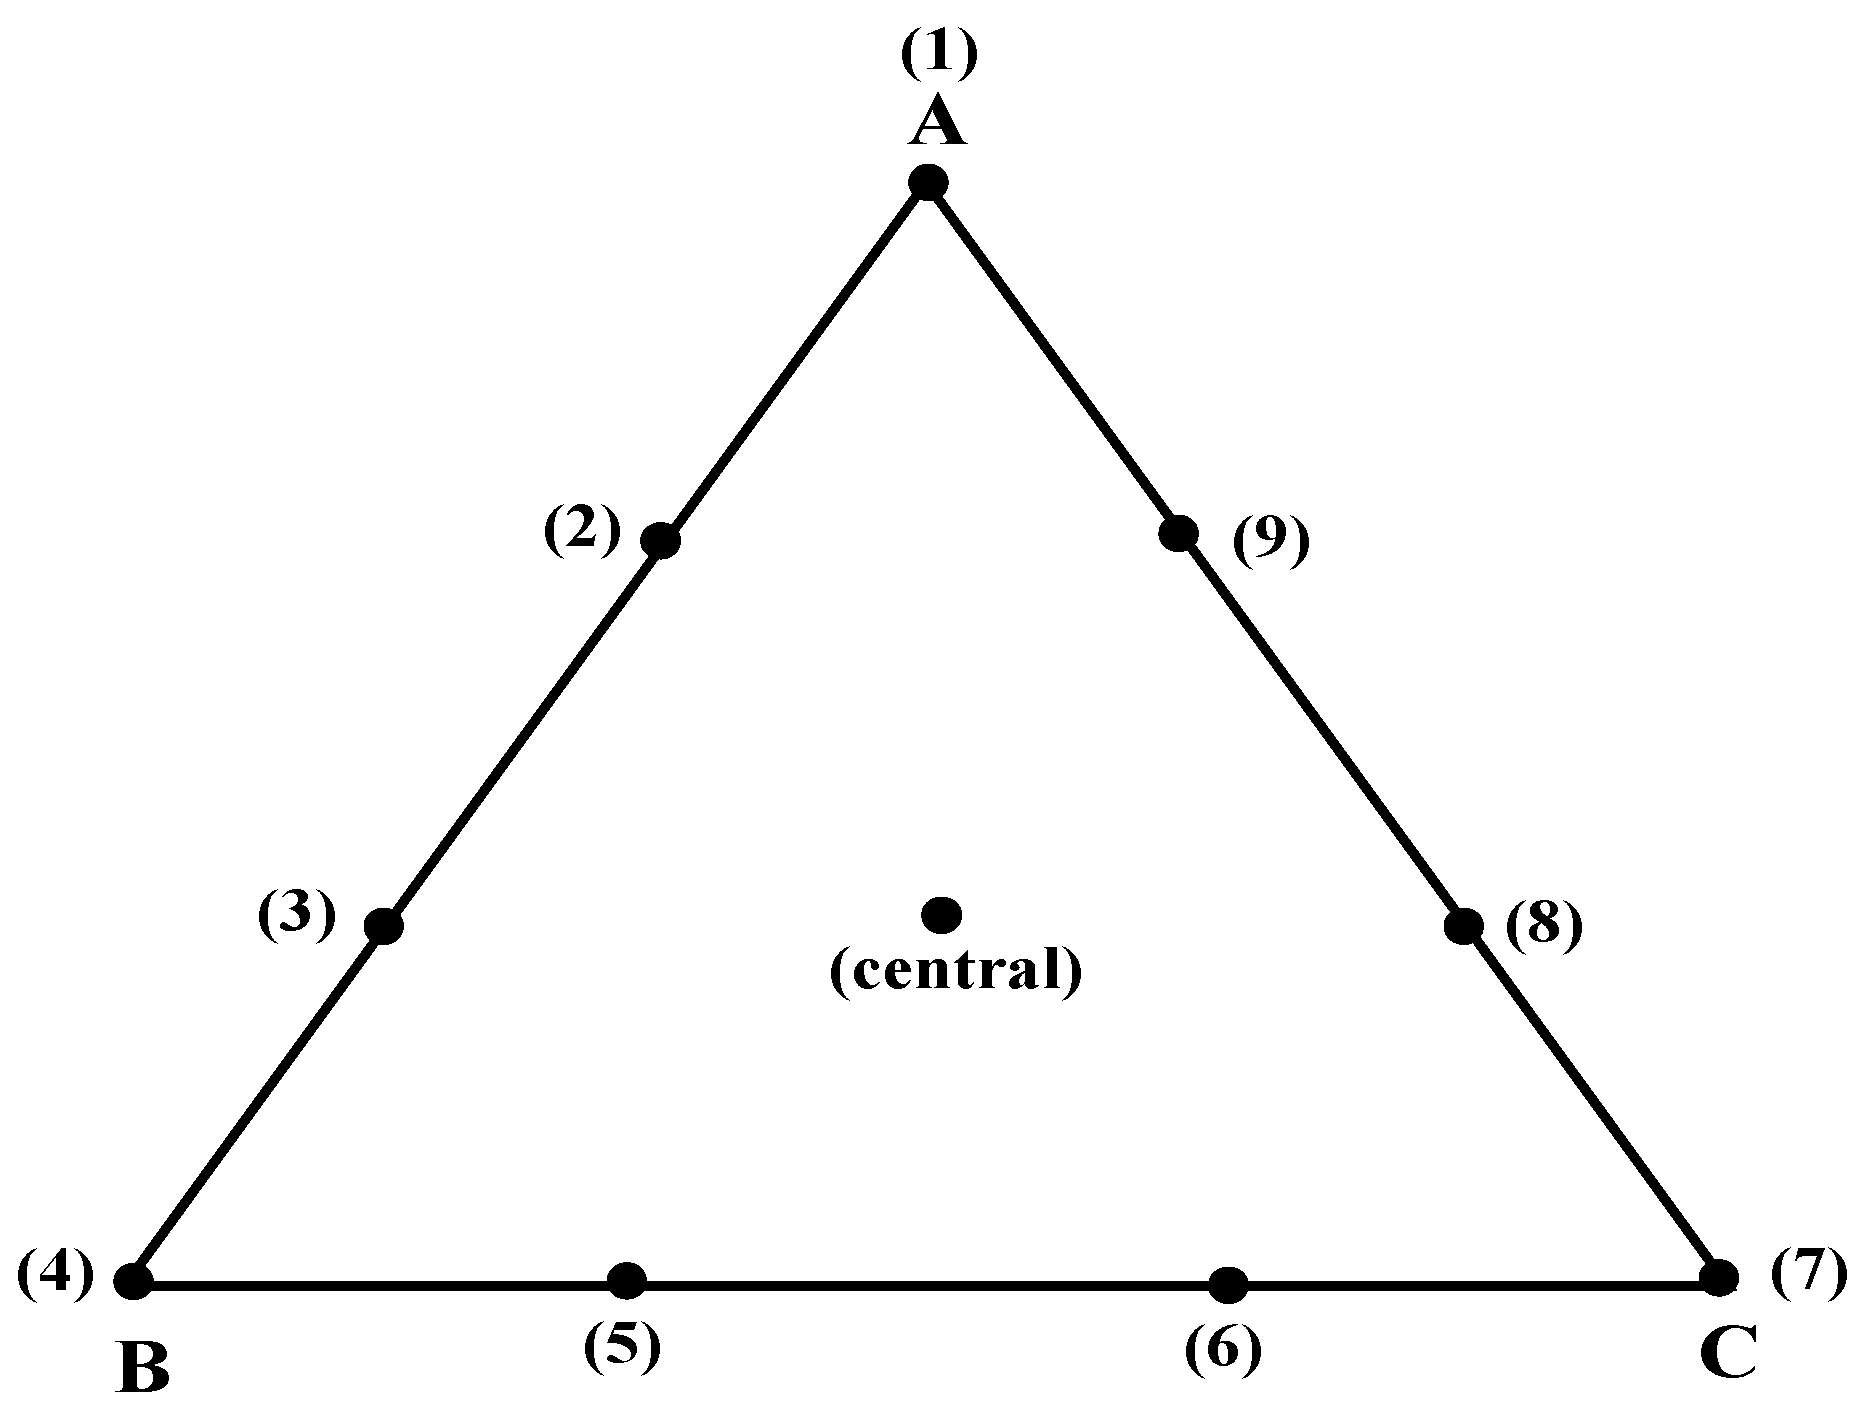
2.1. Mixture Design of Experiment (MoE)

Henry Scheffe conceptualized the experimental mixture design in 1958 towards reducing cost and labor of experimental runs that could have been achieved by full factorial experiments [35]. Using this experimental method, the impact of each element of a mixture on the attributes of the investigated component may be determined. In addition, the technique permits the development of mathematical models for response prediction and simultaneous optimization to determine the best desirable performance. In mixture design (extreme vertices design) experiments, the total of the weights or volume percentages of the mixture’s components is 1 or 100%. Due to the fact that the components’ combination equals 1, the design space is represented by an equilateral triangle (Figure 1).
In the current investigation, there were three constituents, whose combined weight fractions totaled 1. The LHEA percentage is expressed by factor A, the B4C proportion is expressed by factor B, and the ZrO2 dose is expressed by factor C. The value range for each reinforcement is 0 to 12 wt.%. For the mixed design experiment, Design expert 13 software was used, and Table 1 displays the experimental runs for the design. As seen, the total of the components in each of the ten formulations was 12 wt.%. Therefore, this suggests that the mixture design for the trihybrid titanium composite is envisaged with a particle count of 12, according to [36]. As initially stated, this report intends to establish the optimal combination of the three components that will yield the best mechanical property balance for Al50Cu10Sn5Mg20Zn10Ti5/B4C/ZrO2/Ti6Al4V trihybrid composites. Mechanical parameters tested include tensile strength (TS), compressive strength (CS), elastic modulus (EM), hardness (HD), elastic strain (Es), and compressive strain (CS) (Cs). Following Equation (1), we generated the quadratic regression models for each response.
y = a 1 A + a 2 B + a 3 C + a 4 A B + a 5 A C + a 6 B C
where a 1 , a 2 , a 3 , a 4 , a 5 , a 6 are coefficients, and A, B, and C are the input components.
The equilateral triangle presented in Figure 1 for the extreme vertices coordinate indicate points for each formulation for a typical mixture design.

2.2. Materials and Trihybrid Composite Fabrication

For the composite manufacturing, the following atomized powders were acquired: Ti6Al4V (20–60 μm), Al50Cu10Sn5Mg20Zn10Ti5 LHEA, B4C, and ZrO2 powders, with particle sizes ranging from 7–18 μm. In the manufacturing procedure, direct laser deposition (DLD) was used, and the titanium-based plate was heated to 150 °C. The printing laser (ROFIN DL013S) with a wavelength of 800–940 nm was engaged, and the argon carrying gas flow rate was maintained at 0.1 L per second. In accordance with Table 1, the powders were pre-combined in the hopper, and a constant powder flow rate of 5 g/min was maintained throughout the printing operation. Based on the results of a prior experiment [33], the laser power was 500 W, and the speed was maintained at 800 mm/s. To accomplish a rise in height with each successive layer, a single layer with a length of 120 mm and an average thickness of 100 μm was deposited with an accuracy of ±0.005 mm for the average height of the layer. After the procedure, printed specimens of 120 × 120 × 100 mm were cut to various shapes (by laser machining) for the property tests. For the basis of comparison, pure Ti6Al4V with no reinforcement was prepared at the same condition.

2.3. Property Examination

The examined properties are tensile, compression, and hardness.
Tensile samples were machined into 120 mm, 60 mm, and 10 mm for specimen length, gauge length, and gauge diameter, respectively. The tensile samples were subjected to tensile test via a universal testing machine (WAW 1000D), engaging a loading rate of 10−3 s−1 using a load of 100 KN, in line with the ASTM E 8M-21 [37] procedure. Three samples were subjected to each test representing each formulation, and the mean value for tensile strength and elastic modulus was recorded.
Samples machined to a dimension of 5 × 5 × 5 mm were involved in a hardness test utilizing a digital Vickers diamond pyramid tester of model MMT X3. A microhardness test was carried out on polished samples by engaging a load of 5 N for the surface indentation for 13 s at an angle of 136 degrees (ASTM E 92-17 [38]). The mean result of 7 indentations was recorded as the hardness value.
Specimens machined to 25 × 25 × 25 mm were subjected to compression. The universal testing machine was engaged in the test, in line with the ASTM E09-9 [39] prescription at 1 × 10⁻³ s−1 strain, engaging a 200 KN load. The average result of three samples (as regards compressive strength and strain) representing each formulation was collected.

3. Results and Discussion

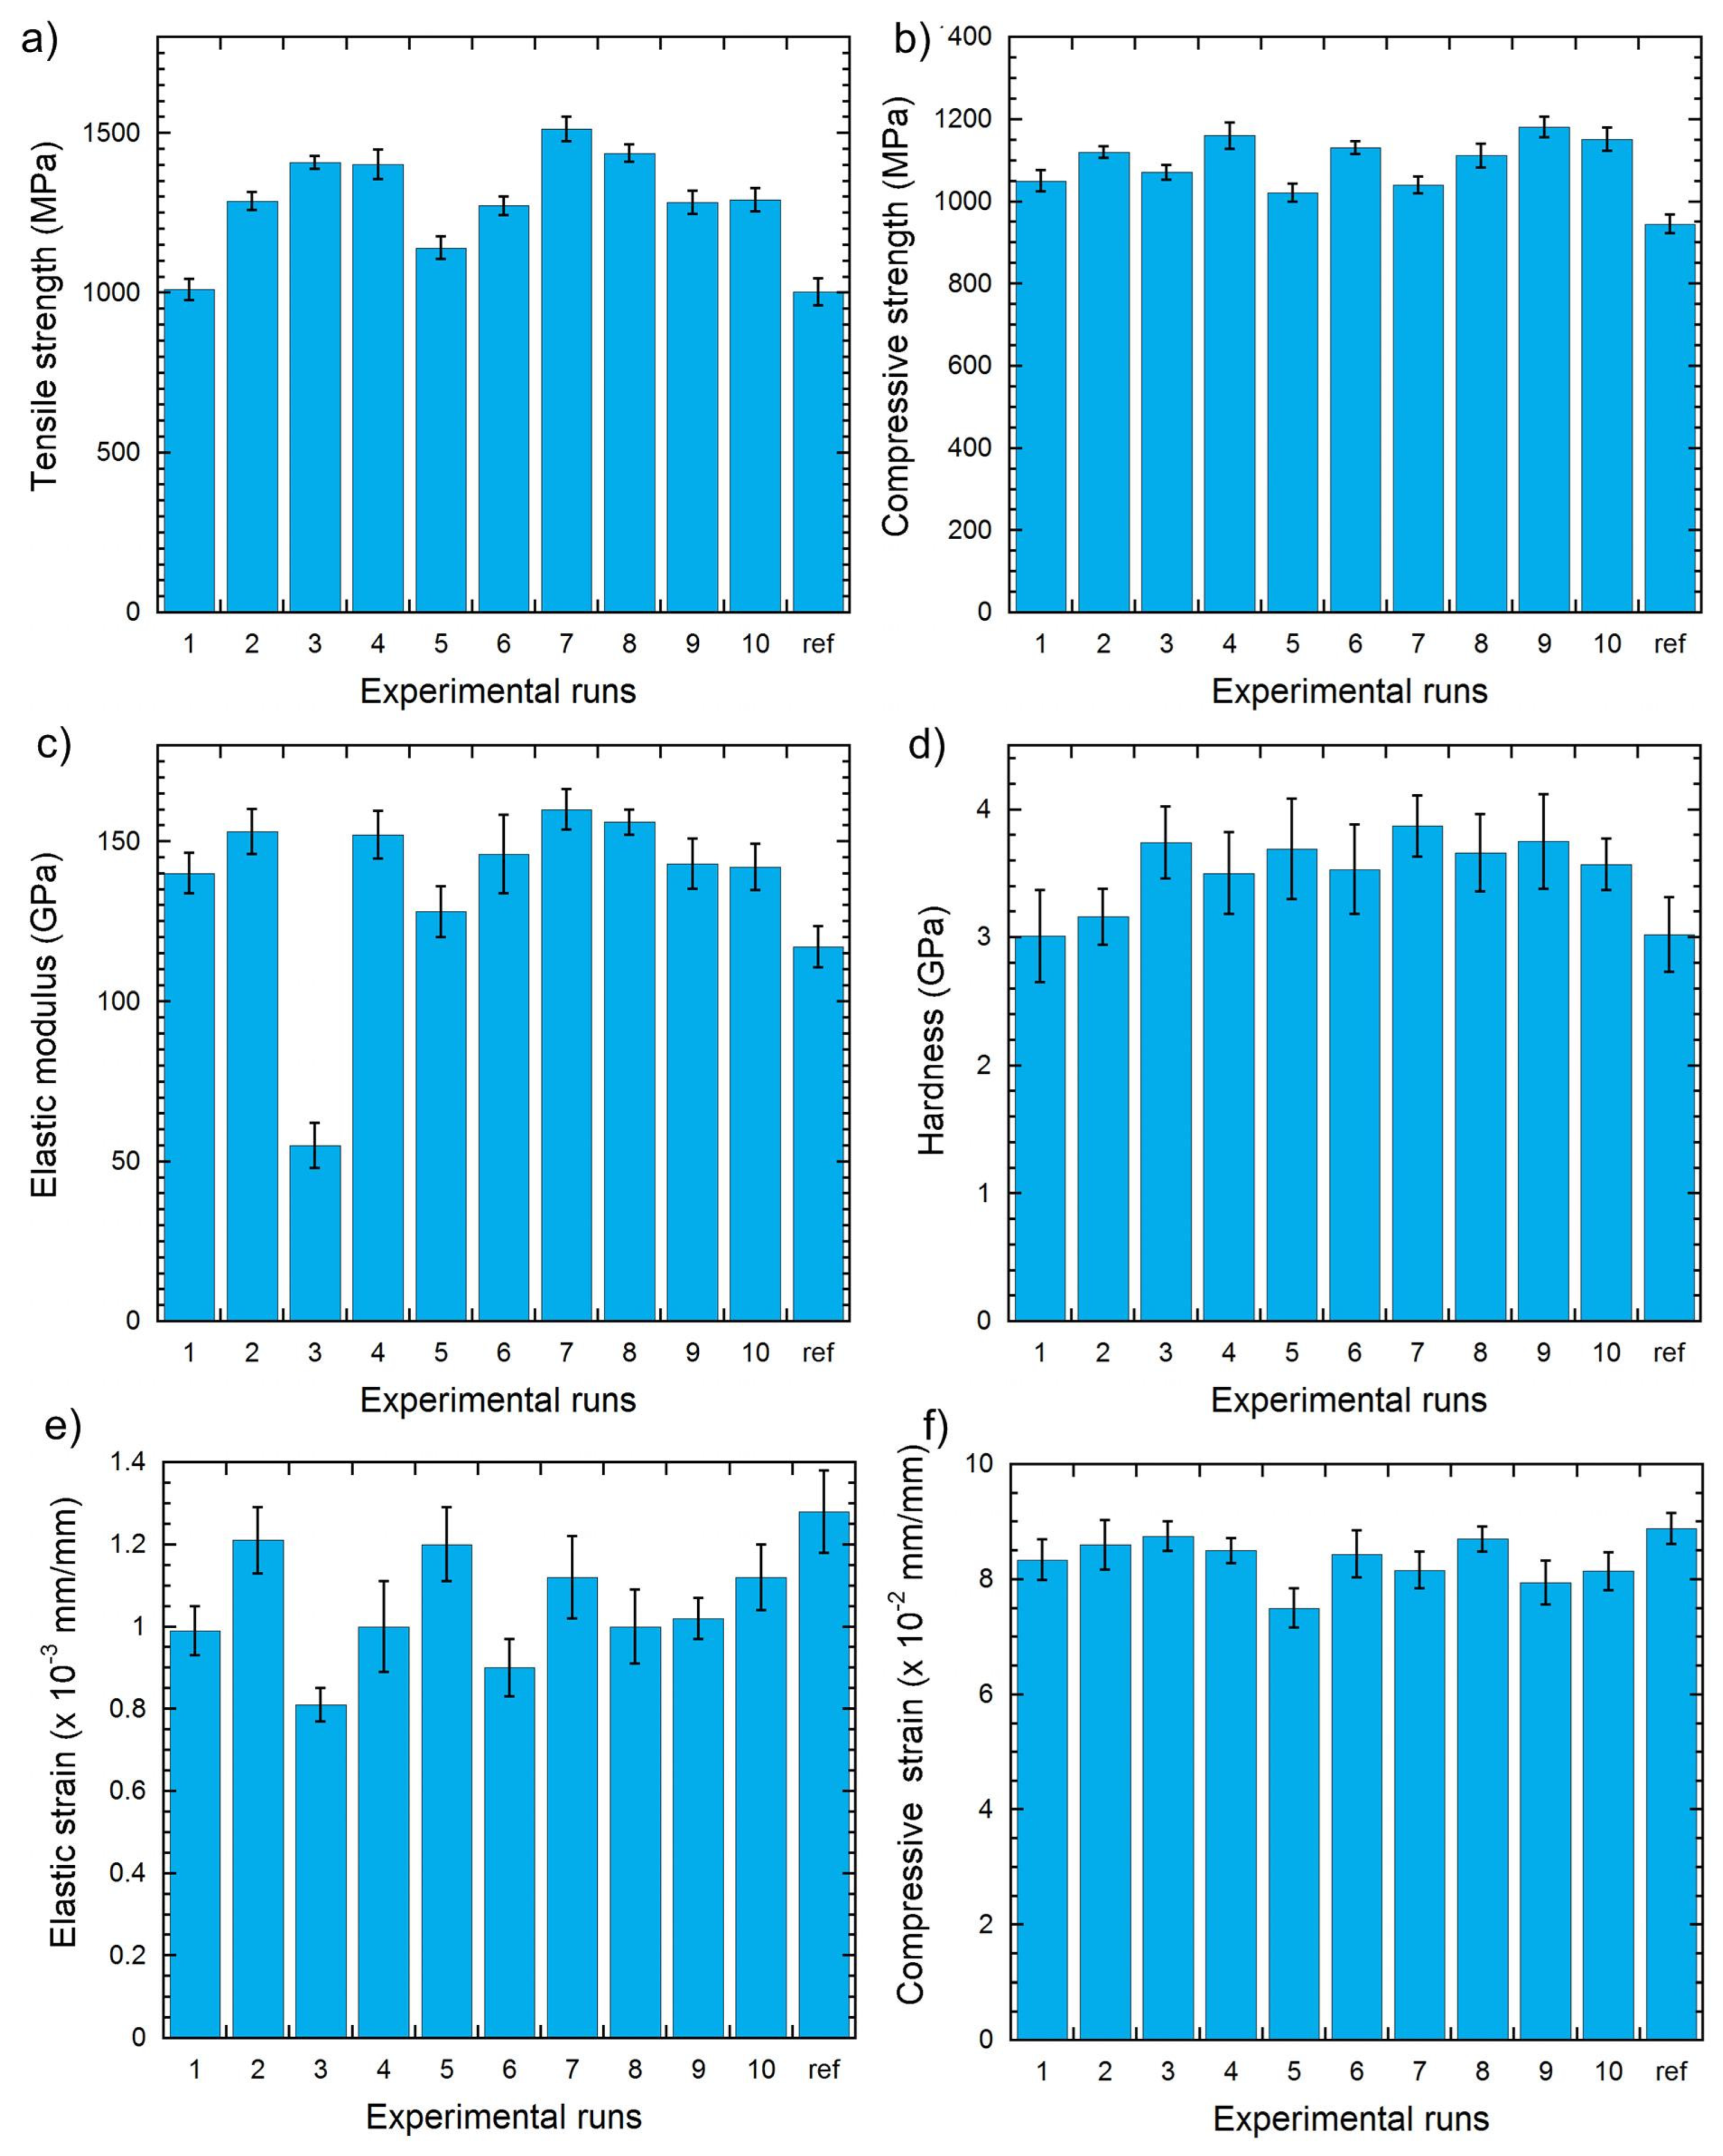
3.1. Analysis of Experimental Results

Figure 2 shows the experimental values for each of the responses plotted against each run. Experimental run “ref” represents pure, unreinforced Ti6Al4V alloy manufactured without reinforcement, while runs 1 through 10 represent composites with different reinforcement proportions as specified in Table 1. Figure 2a reveals that Run 2 had no discernible increase in strength compared with the pure alloy. By deduction, the formulation containing 0% LHEA, 12% B4C, and 0% ZrO2 exhibited no noticeable increase in tensile strength. Runs 2 through 10 exhibited a significant increase in tensile strength compared with the unreinforced alloy, indicating that the introduction of various particle formulations improved tensile strength compared with the unreinforced alloy. Run 7’s formulation of 12 wt.% LHEA, 0 wt.% B4C, and 0 wt.% ZrO2 exhibited the highest tensile strength. The ductile LHEA at 12 wt.% (1512 MPa) is very favorable to tensile strength.
For compressive strength (Figure 2b), the values obtained between runs 1 and 10 are greater than the strength of the pure alloy (ref), and all mixture formulations are advantageous for compressive strength in comparison with the reference (ref). Run 9 (1181 MPa) recorded the maximum strength, showing that 0% LHEA, 6% B4C, and 6% ZrO2 are optimal for compressive strength response. The elastic modulus of every mixture combination was larger than that of the unreinforced alloy. Consequently, all formulations used between runs 1 and 10 increased the elastic modulus. During Run 7, the highest value for elastic modulus was determined (160 GPa). Similar to tensile strength, 12 wt.% LHEA, 0 wt.% B4C, and 0 wt.% ZrO2 exhibited the greatest increase in elastic modulus.
As noted in Figure 2d, runs 2 and 3 are averse to hardness, as the formulations 6 wt.% LHEA, 6 wt.% B4C, and 0 wt.% ZrO2 and 0 wt.% LHEA, 6 wt.% B4C, and 6 wt.% ZrO2 are detrimental to hardness. Meanwhile, runs 3 through 10 acquired higher hardness than the pure alloy. The formulation containing 12% LHEA, 0% B4C, and 0% ZrO2 exhibited a maximum hardness of 3.87 GPa. The pure alloy (ref) had the greatest elastic and compressive strain values (Figure 2e,f). Addition of the particles in various formulations reduced the elastic and compressive ductility, resulting in lower strain values as compared with the pure alloy. Conclusively, Figure 2 revealed disparities in the magnitude of the responses for different mixture combinations, necessitating response and formulation optimization to obtain balanced performance.

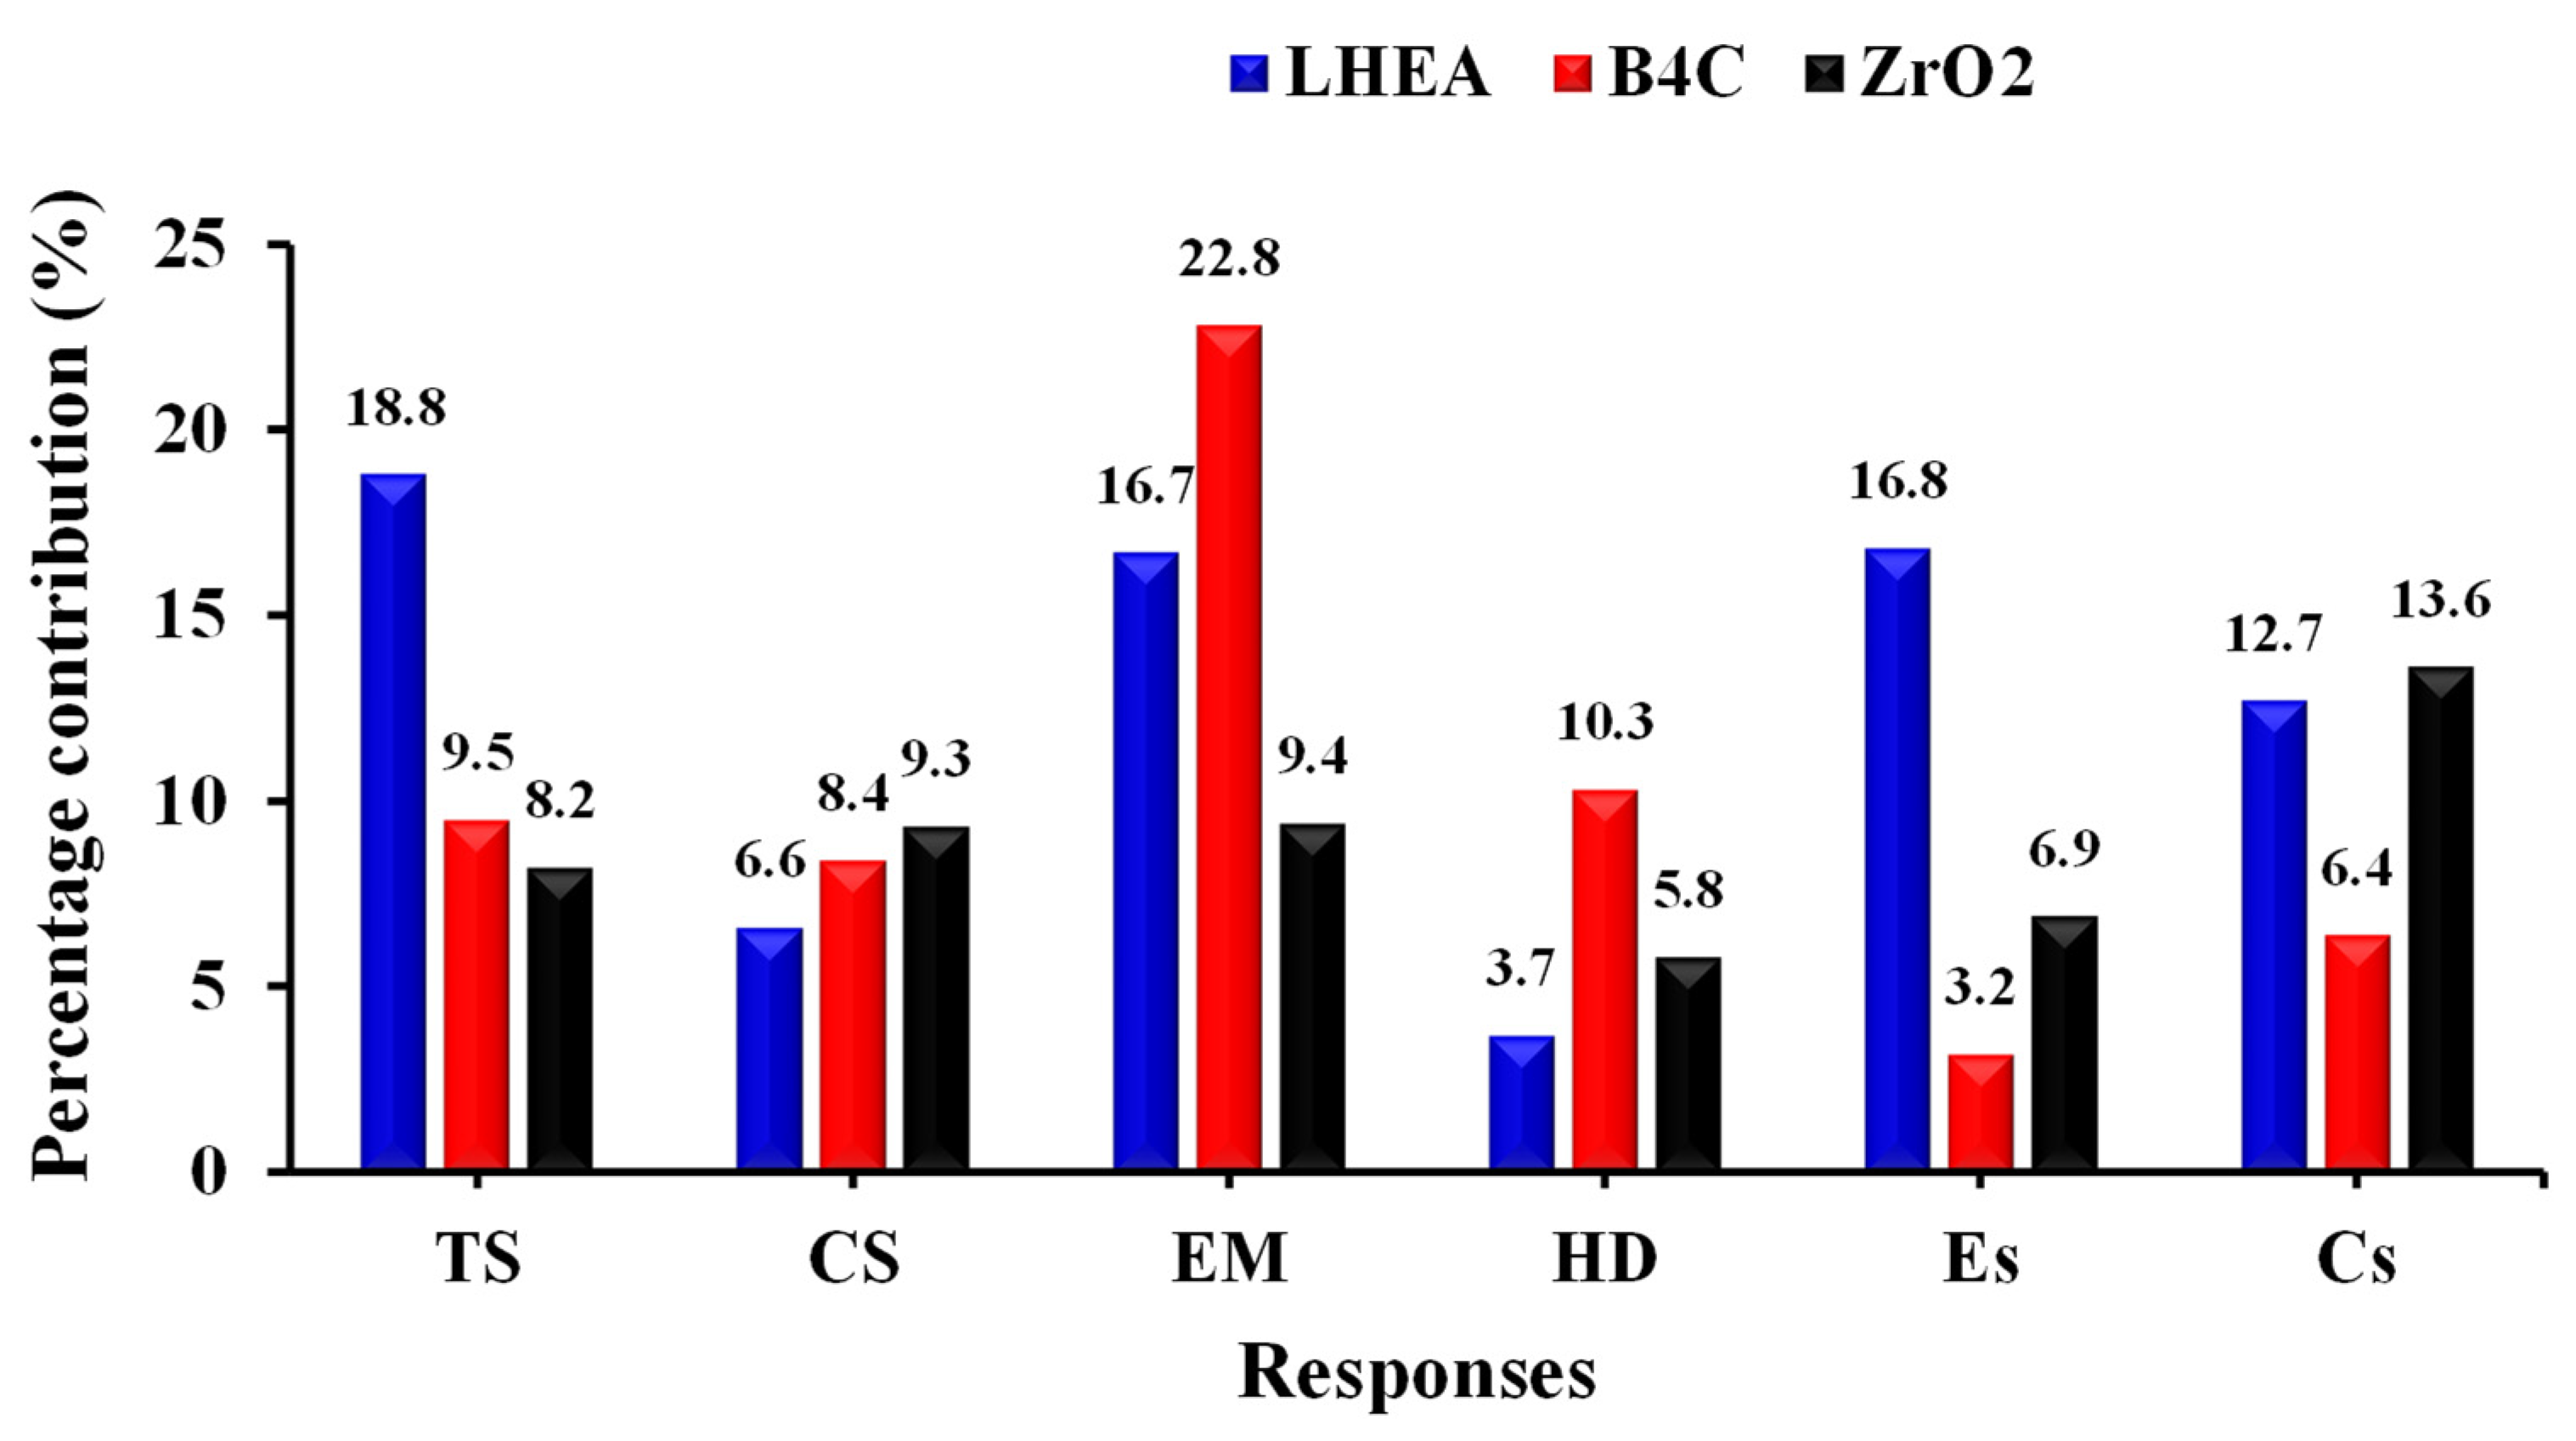
3.2. Analysis of Variance

The experimental outcomes were subjected to variance analysis at 95% confidence in order to ascertain the significance of the input variables as well as their interaction on the magnitude of the response variables [40,41].
The outcome of the analysis of variance on the responses is showcased in Table 2, from which it can be deduced that the linear mixture (A + B + C) of components A, B, and C is significant given the p-value of <0.05. The quadratic interaction between the terms is as follows: AB is consequential (since p < 0.05), except for the elastic modulus. Cross-interaction AC exhibited substantial influence on the responses, exclusive of tensile strength and elastic modulus, by reason of the p value being >0.05. In the same way, interaction BC demonstrated significant influence on the assessed responses, except for compressive strain. From Table 2, it is observed that the p-values for the models expressed in Equations (2)–(7) are <0.05, implying the models are statistically significant.
The influence of the input variables and their interaction on every response parameter is shown in the table. As a greater contribution corresponds to a greater value, the linear interaction between the powders had the greatest impact on tensile strength at 36.5%. AB, AC, and BC shared 30.2, 15.1, and 18.2%, respectively, of the interactions. The tensile strength response was thus reliant on the linear interaction A + B + C and associated cross-interactions. Cross-interaction BC contributed the most to compressive strength at 35.2%, followed by AC at 27.9% and AB at 12.0%. The linear interaction between the input variables contributed 24.3% to the total. Inductively, the compressive strength response depends more on the cross-interactions among the variables than on the linear interaction. The linear interaction between the powders contributed the most to the elastic modulus response, 48.9%. Interactions AB and BC shared 24.6% and 24.2%, respectively, while the elastic modulus remained reliant on cross interactions. As percentage contribution is less than 5%, the cross-interaction AC has shown to be inconsequential, validating the p-value depicted in the table. On the basis of the contribution of the variables to elastic strain and compressive strain, it is evident that both strains displayed a greater dependence on the cross-interaction than the linear interaction among the input variables, with cross-interaction BC having a marginal contribution (%C < 5%) to compressive strain. For each response, the contribution of error is less than 5%, indicating that the models of the responses exhibited a high level of fitness.
Figure 3 demonstrates the effect of each reinforcing powder on the response qualities (a breakdown of the linear interactions). The LHEA performed superiorly in terms of tensile strength and elastic strain. In terms of elastic modulus and hardness, B4C outperformed other inputs. In terms of compressive strength and compressive strain, ZrO2 also beat the other input materials.

3.3. Predictive Models

3.3.1. Predicted Values vs. Actual (Experimental Values)

Tensile strength, compressive strength, elastic modulus, hardness, elastic strain, and compressive strain responses are denoted as TS, CS, EM, HD, Es, and Cs, respectively. In addition, PV and EV represent the projected and experimental values, respectively. In the meantime, the percentage error was computed as the percentage difference between the forecast and observed values.
Table 3 presents the forecasted values derived from the mathematical models of prediction, the actual values as determined in the laboratory, and the error % for each experimental run. The error produced for each experimental run as a function of each property parameter is less than 5%, verifying the models’ ability to predict responses.

3.3.2. Mathematical Models

The experimental data was imputed to obtain mathematical models for future response predictions. Equations (2)–(7) represent the models for the responses.
TS = +125.5583 A + 83.8310 B + 95.1038 C + 4.3874 AB − 0.7338 AC + 6.1445 BC
CS = +86.6251 A + 87.5040 B + 85.2389 C + 0.7839 AB + 2.6286 AC + 4.1362 BC
EM = +13.3237 A + 11.6570 B + 10.6721 C + 0.1094 AB + 0.2231 AC + 0.2231 BC
HD = +0.3236 A + 0.2511 B + 0.3079 C + 0.0083 AB − 0.0172 AC + 0.0109 BC
Es = +0.0930 A + 0.0823 B + 0.1002 C − 0.0068 AB + 0.0015 AC − 0.0020 BC
Cs = +0.6818 A + 0.6945 B + 0.6252 C + 0.0134 AB + 0.0210 AC − 0.0002 BC
Equations (2)–(7) successively provide the predicted mathematical models for tensile strength, compressive strength, elastic modulus, hardness, elastic strain, and compressive strain. The terms with positive coefficients in the models indicate that the variables or interactions have a synergistic influence on the responses, while those with negative coefficients have an antagonistic effect [42,43]. Therefore, it is inferred that the three particle reinforcements are synergistic to all responses. AB interaction is synergistic to all responses except elastic strain. Cross-interaction AC is antagonistic to tensile strength and hardness, but it has a beneficial influence on the other examined responses. Similarly, cross-interaction BC had a negative effect on elastic and compressive strains, although its influence on other responses was favorable. Figure 3 shows the diagnostic diagrams for the models. The diagnostic plots (normal probability plot and plot of predicted values vs. experimental values) are used to determine the statistical fitness of the regression models relative to the experimental data.

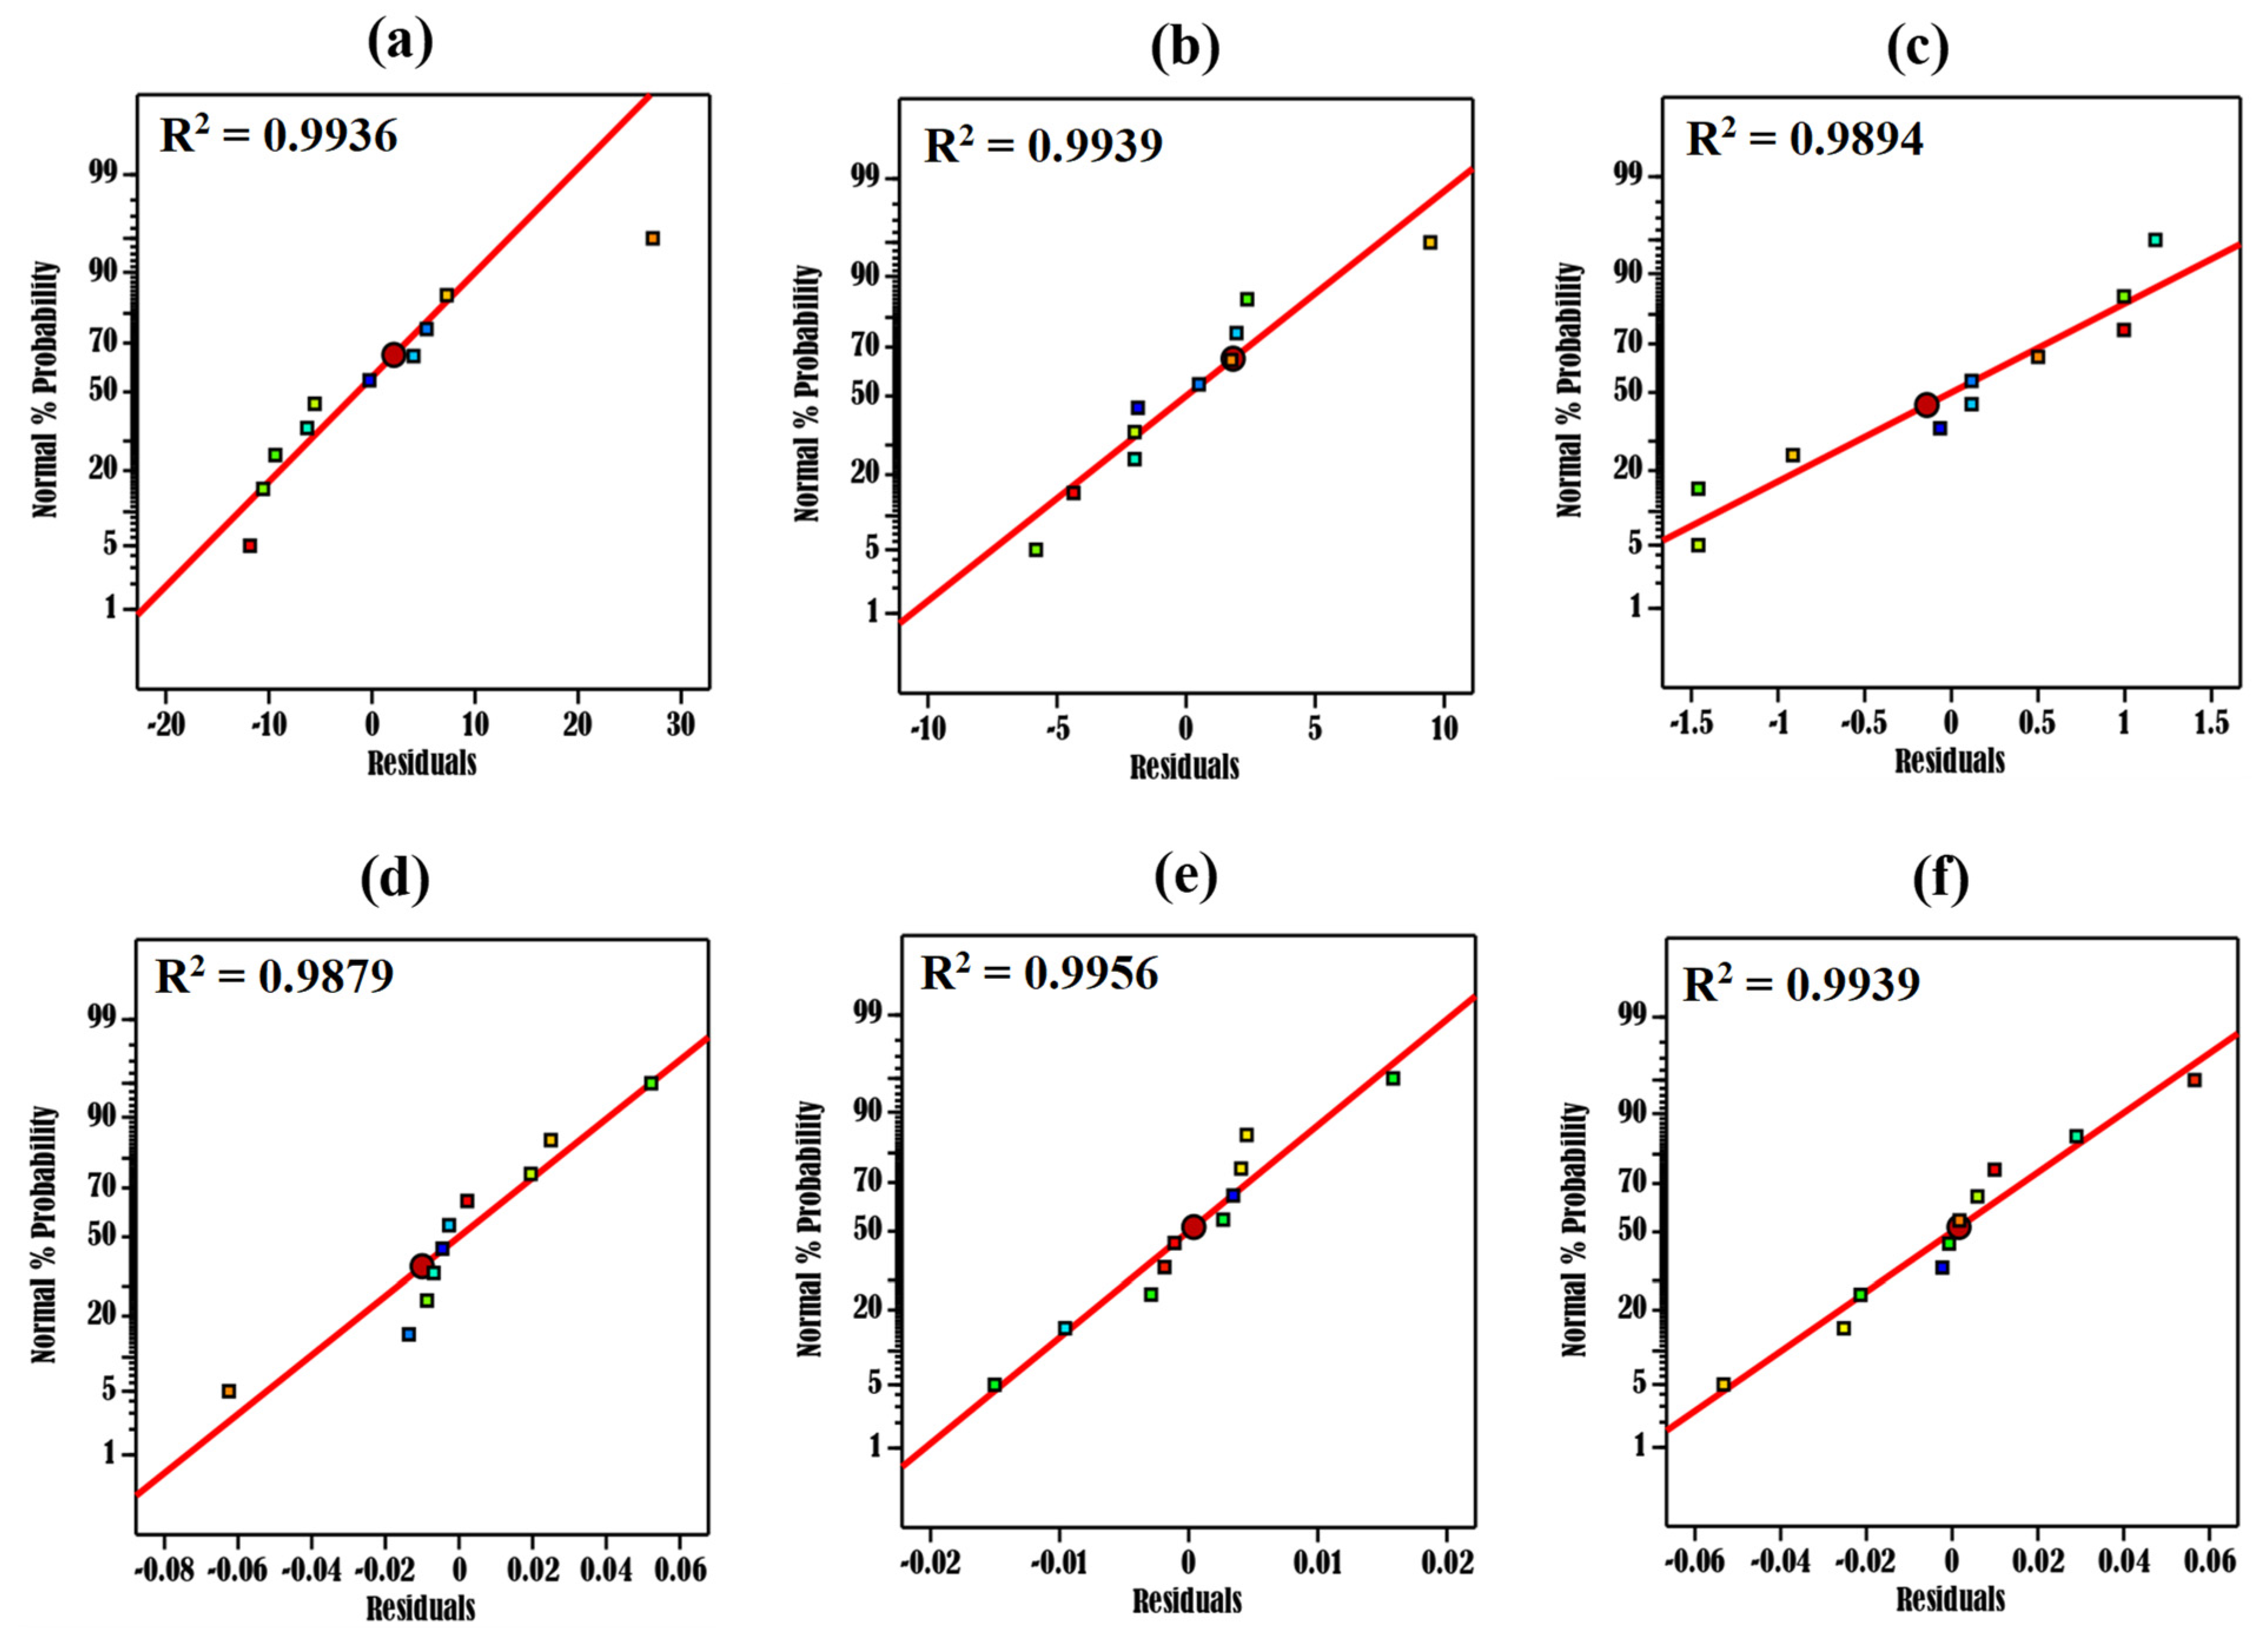
3.4. Probability Plot

The probability plot is used to ascertain whether or not the model adequately represents the experimental data [44]. Figure 4a–f provides the probability plots for tensile strength, compressive strength, elastic modulus, hardness, elastic strain, and compressive strain responses, respectively. As seen, the data are distributed in harmony with the mean line (red line), demonstrating that the model accurately represents the experimental results. The values of the coefficient of correlation for each response parameter are more than 0.95, indicating that the model is statistically adequate to represent the experimental data due to its high degree of fitness.

3.5. Predicted vs. Experimental Value Plots

The plots of predicted vs. experimental values for tensile strength, compressive strength, elastic modulus, hardness, elastic strain, and compressive strain responses are shown in Figure 5a–f, respectively. It can be seen in the figures that the values are plotted on the two sides of the 45° line, showing that the models are statistically adequate to predict the responses. In addition, the predicted R2 for each response parameter is greater than 0.90, indicating that the mathematical models are statistically adequate for predicting the values of response parameters under random conditions.

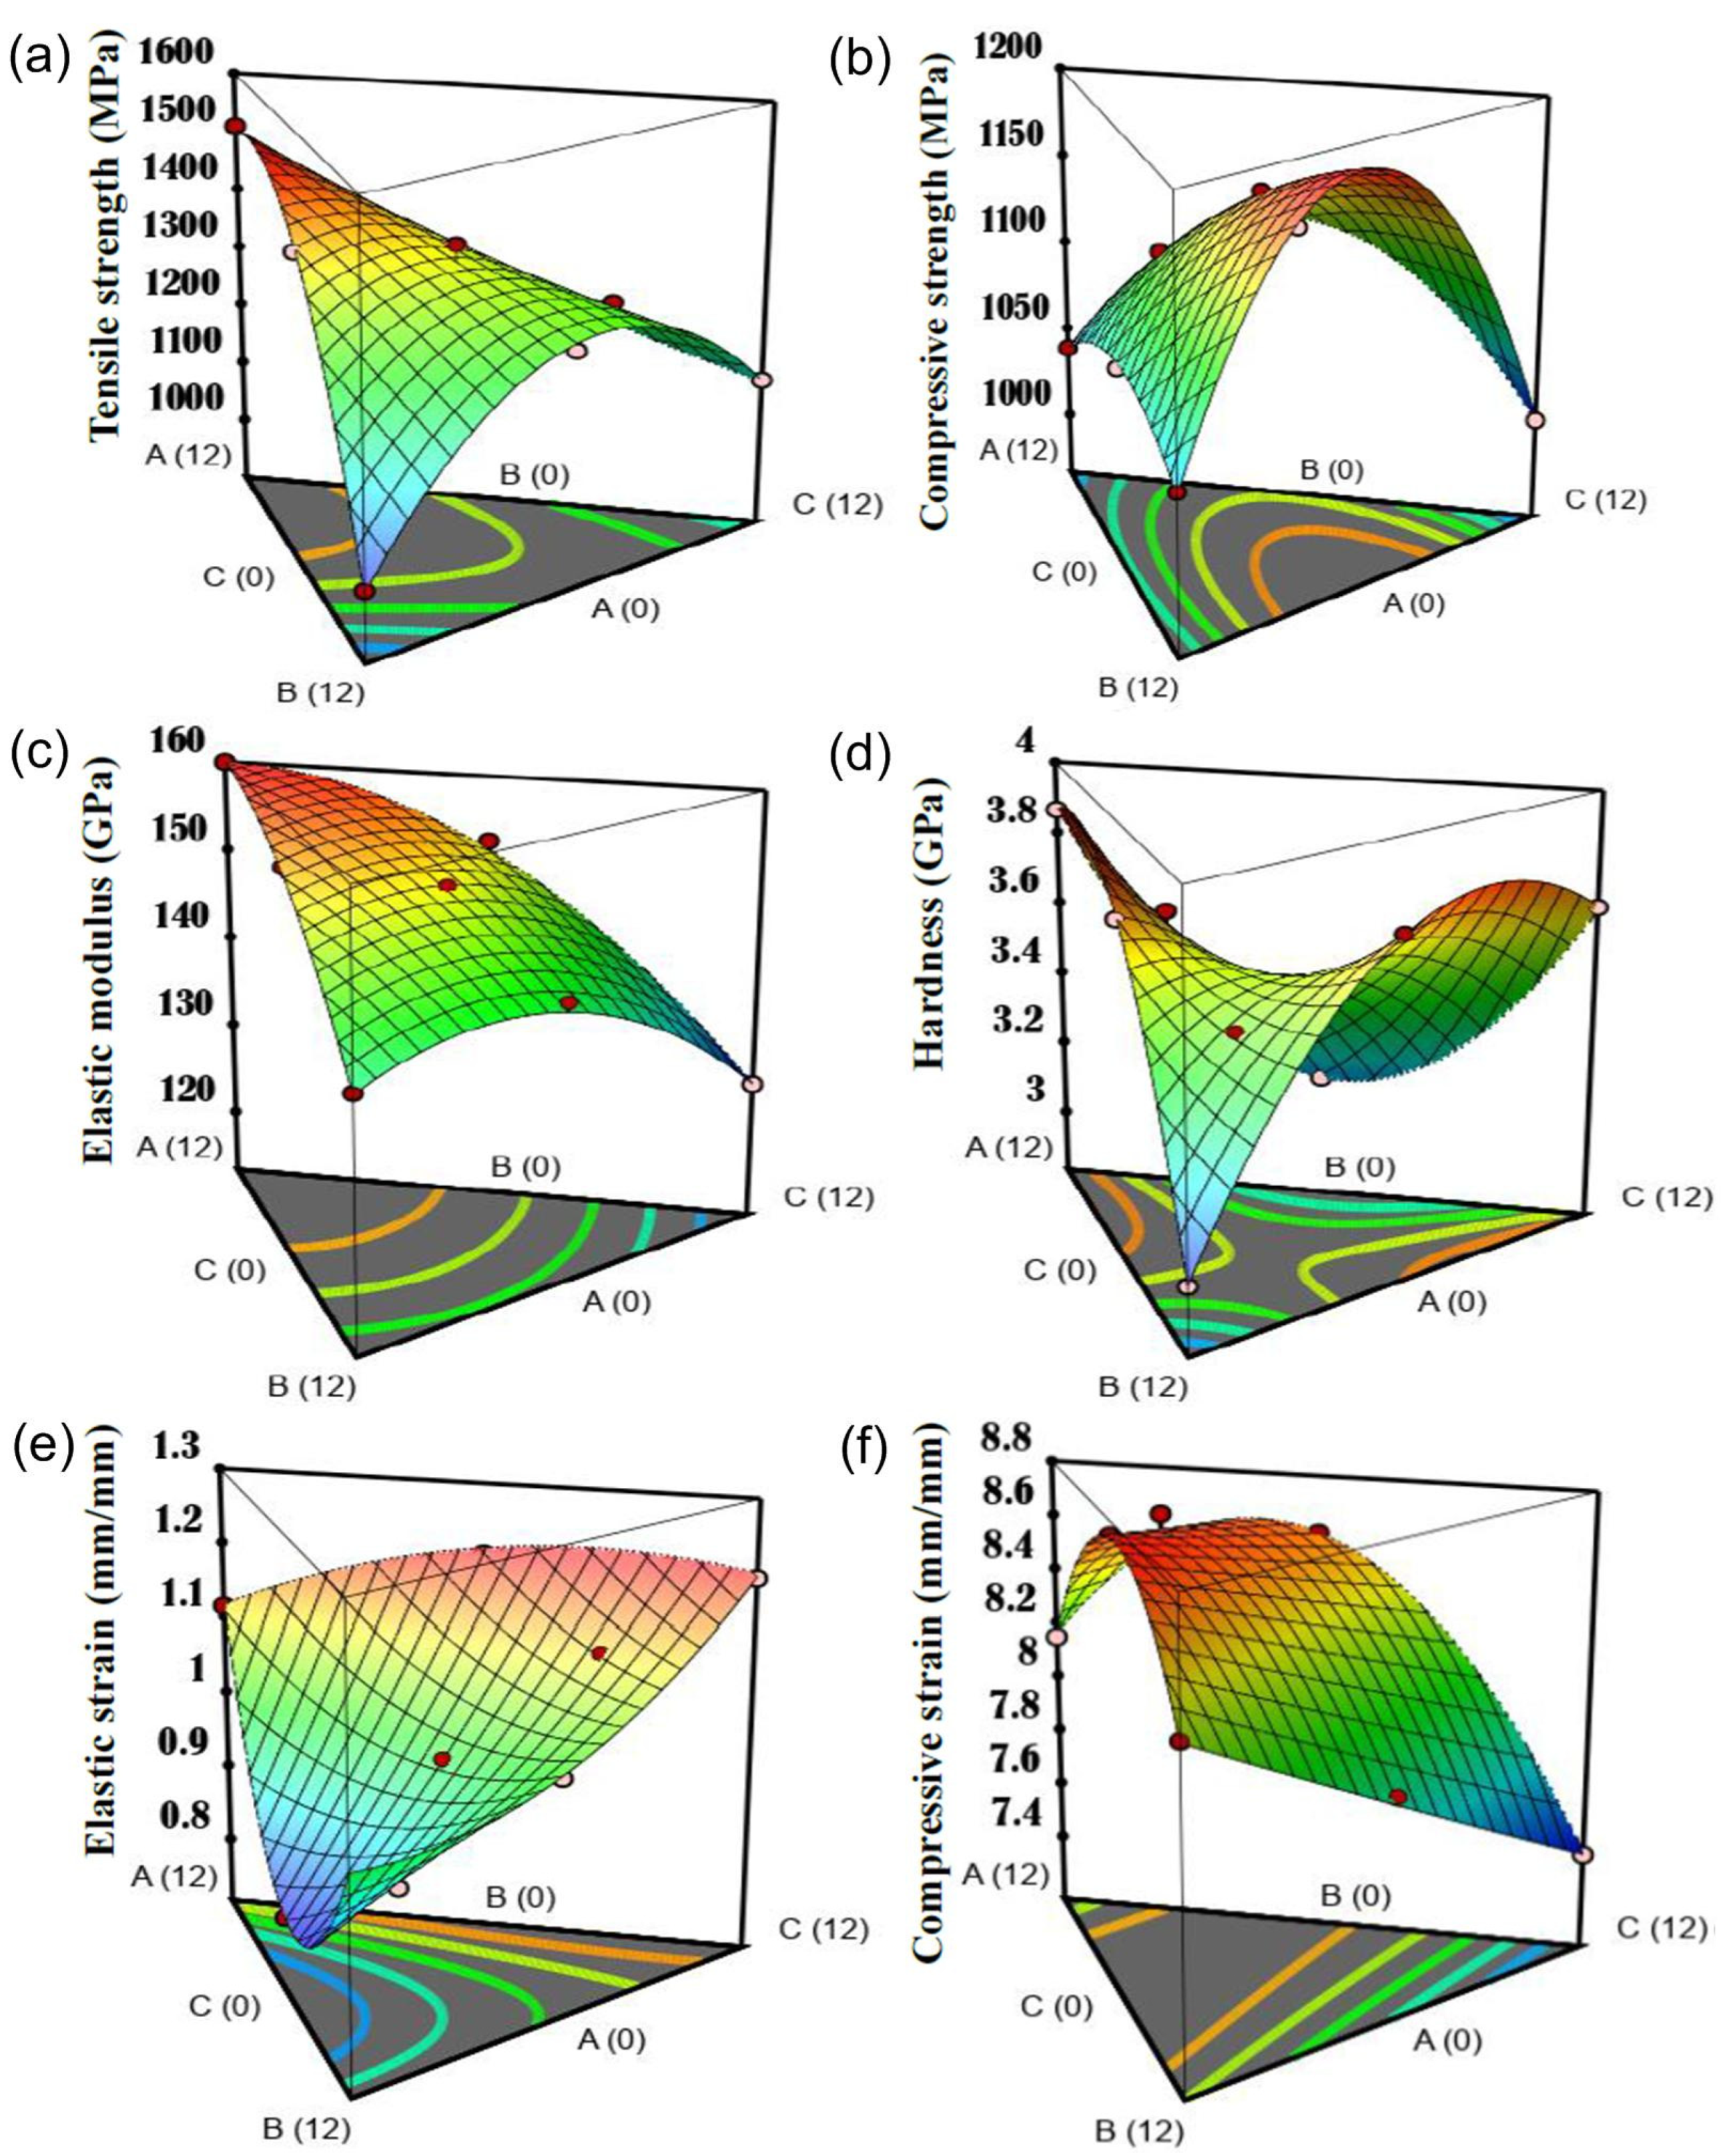
3.6. Response Surface Plots

Surface plots are used to examine the interacting patterns between the input components and the model-generated output. Therefore, in this scenario, factors A (LHEA), B (B4C), and C (ZrO2) are displayed on the horizontal x, y, and z axes of the surface plots, while the responses are exhibited on the vertical axis. Due to the examination of six response characteristics, six surface plots were generated (Figure 6): one for each response parameter.
The pattern of interaction between the three input variables and their interactions with respect to each response is shown in Figure 6. The examination of response surfaces revealed that the three independent variables exhibited distinct patterns for each response variable. The addition of 0–12% LHEA, 0–5% B4C, and 0–6% ZrO2 increased the tensile strength (Figure 6a) to a maximum of 1402 MPa at (12, 5, 6) wt.% coordinate. The mixture of 0 to 12 wt.% LHEA, 5–12 wt.% B4C, and 6–12 wt.% ZrO2 enhanced tensile strength, resulting in a minimum value of 1160 MPa, which corresponds to (12, 12, 0) wt.%. LHEA exhibited a positively convex interaction profile, while B4C and ZrO2 exhibited an inverted “U”-shaped parabolic pattern with inflexion points at 5 and 6 wt.%, respectively. The graph revealed that the tensile strength was reliant on the interaction profile of the three independent variables.
In Figure 6b, a combination of 4–12 wt.% LHEA, 0–5 wt.%B4C, and 0–6 wt.% ZrO2 is synergistic to compressive strength, resulting in a maximum value of 1160 MPa at a coordinate combination of 12 wt.% LHEA, 5 wt.%B4C, and 6 wt.% ZrO2 for each input. The same proportions of B4C and ZrO2 coupled with 0–4% LHEA led to a decrease in compressive strength. A 4–12 wt.% combination of the input factors resulted in a decrease in strength. B4C and ZrO2 exhibited an inverted “U”-shaped parabolic line of fit. Since there is no independent interaction, it is evident that the compressive strength is contingent on the pattern of interaction between the variables.
In terms of elastic modulus (Figure 6c), the mixture of 0–12 wt.% LHEA, 0–12 wt.% B4C, and 0–6 wt.% ZrO2 enhanced elastic modulus, whereas the same range of LHEA and B4C with 6–12 wt.% ZrO2 decreased elastic modulus. ZrO2 showed an inverted “U”-shaped parabolic outline with an inflexion point at 6 wt.%, corresponding to 160 GPa. The maximum elastic modulus was achieved at position 12% LHEA, 12% B4C, and 6% ZrO2, which corresponds to 173 GPa, while the lowest was 142.5 GPa at coordinate 0, 0, 0. Consequently, this demonstrates an increase in elastic modulus and a dependency of the response on the interaction pattern between factors.
Regarding hardness (Figure 6d), the combination of 0–5 wt.% LHEA, 4–12 wt.% B4C, and 0–6 wt.% ZrO2 is antagonistic to hardness, whereas the blend of 5–12 wt.% LHEA, 0–4 wt.% B4C, and 6–12 wt.% ZrO2 resulted in an improvement of hardness. The maximum hardness was observed to be 12 wt.% LHEA, 4 wt.% B4C, and 12 wt.% ZrO2, yielding a value of 3.93 GPa, even though a minimum value of 2.5 GPa was reached at a coordinate combination of 5 wt.% LHEA, 6 wt.% B4C, and 6 wt.%. LHEA and ZrO2 exhibited a “U”-shaped parabolic profile, while B4C depicted an inverted “U”-shaped parabolic interaction pattern. The analysis is indicative of the dependence of the hardness of the trihybrid composite on the behavioral pattern of the independent variables.
The surface plot of elastic strain is showcased in Figure 6e. Mixtures of 0–8 wt.% LHEA, 0–8 wt.% B4C, and 6–12 wt.% ZrO2 showed a progressive decrease in elastic strain with a minimum strain at coordinates (8, 8, 12), equaling 0.81 × 10⁻³ mm/mm. On the other hand, 8–12 wt.% LHEA, 8–12 wt.% B4C, and 0–6 wt.% ZrO2 ensue an increase in elastic strain with a maximum value of 1.23 × 10⁻³ mm/mm at coordinates (0, 0, 6). While LHEA and ZrO2 delayed the “U”-shaped parabolic profile, B4C exhibited an inverted “U”-shaped pattern. Elastic strain is established to depend on the interaction patterns of the input variables.
The surface plot of compressive strain, as presented in Figure 6f, demonstrates that 0–6 wt.% LHEA, 0–12 wt.% B4C, and 0–6 wt.% ZrO2 admixture results in a rise in compressive strain of which a 6–12 wt.% LHEA, 0–12 wt.% B4C, and 6–12 wt.% ZrO2 mixture provoked a reduction in compressive strain. Maximum compressive strain is realized at 6 wt.% LHEA, 12 wt.% B4C, and 6 wt.% ZrO2 (9.42 × 10⁻² mm/mm), and minimum compressive strain at 0 wt.% LHEA, 0 wt.% B4C, and 12 wt.% ZrO2. While LHEA and ZrO2 displayed an inverted “U”-shaped parabolic profile, B4C portrayed a positive convex profile. Similar to other response parameters, the magnitude of compressive strain is hinged on the behavioral pattern of the input variables.

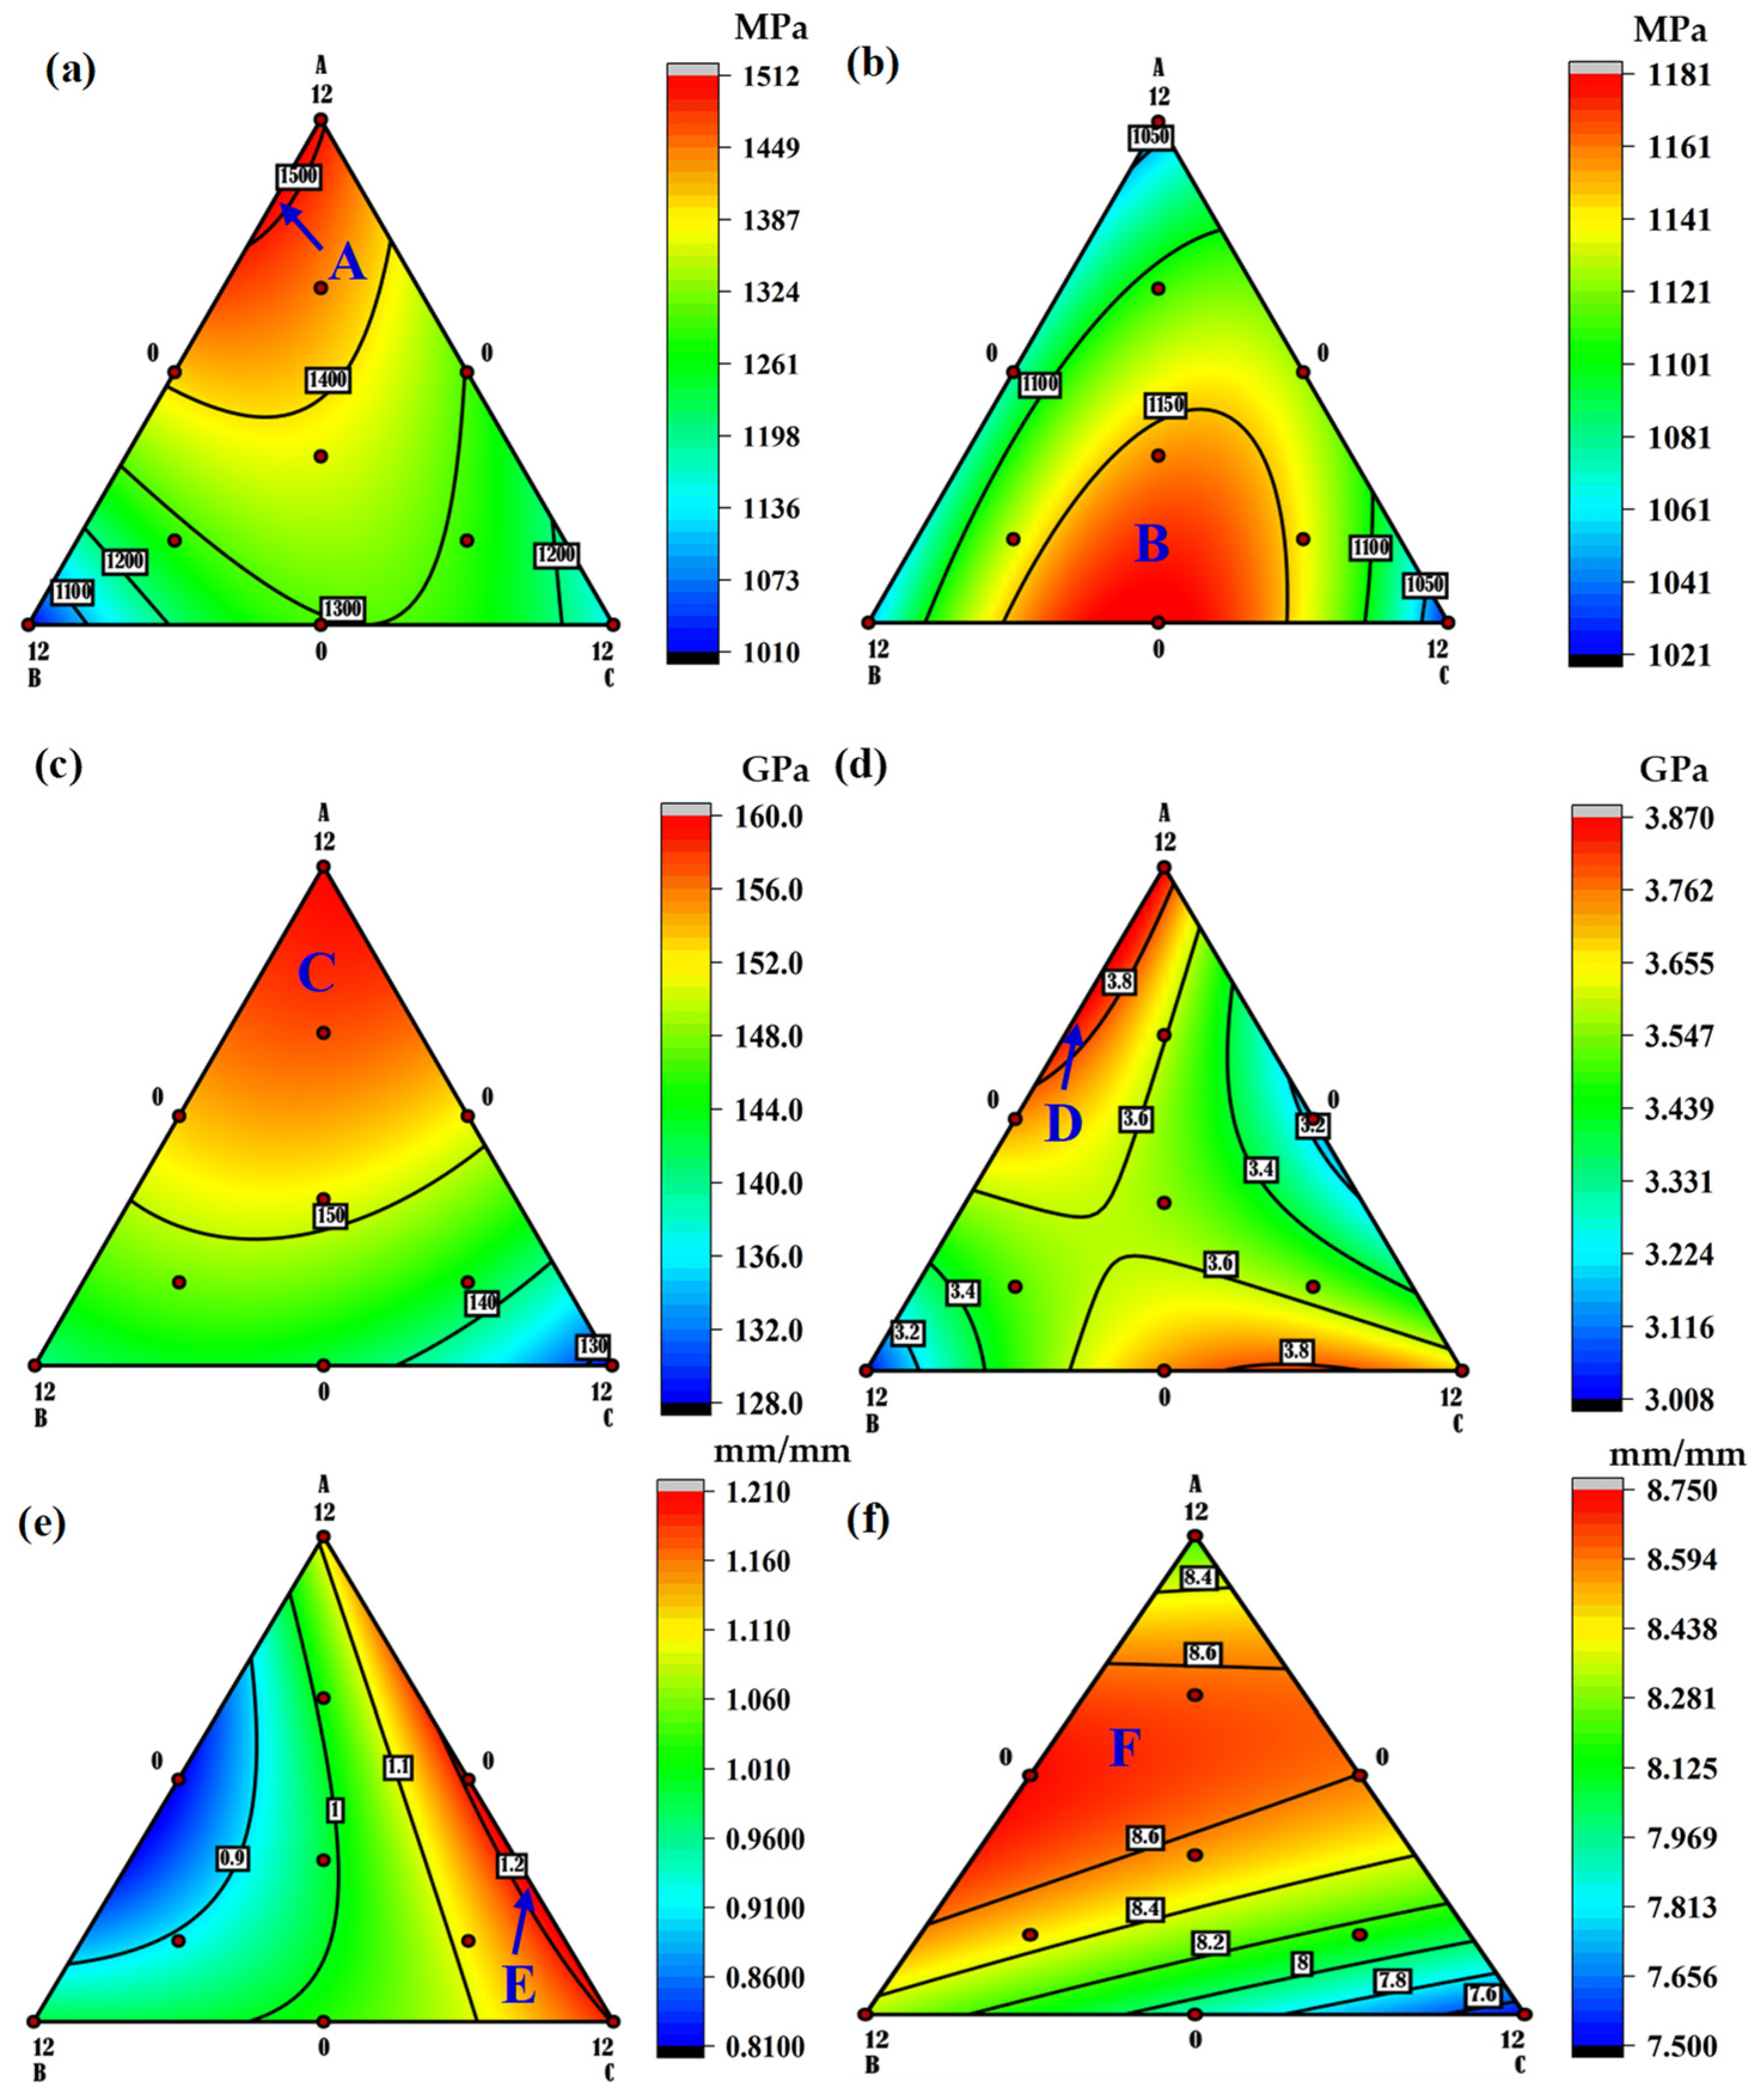
3.7. Ternary Maps for Responses

Ternary maps, similar to contour plots in two dimensions, are outlines depicting the projected values of the responses at different combination formulations [45,46]. Figure 7 depicts the ternary plots illustrating the function of the interactions between the input variables in response to the property parameters. In the ternary maps displayed in Figure 7, the regions labeled A, B, C, D, E, and F are sections for attaining ideal values for the input combination as tensile strength, compressive strength, elastic modulus, hardness, elastic strain, and compressive strain, respectively, when considering a response at a time. As a summary of the derived findings from the ternary plots, Table 4 illustrates the parametric combinations for suitable combinations for a single objective response, as well as expected and desired outcomes.

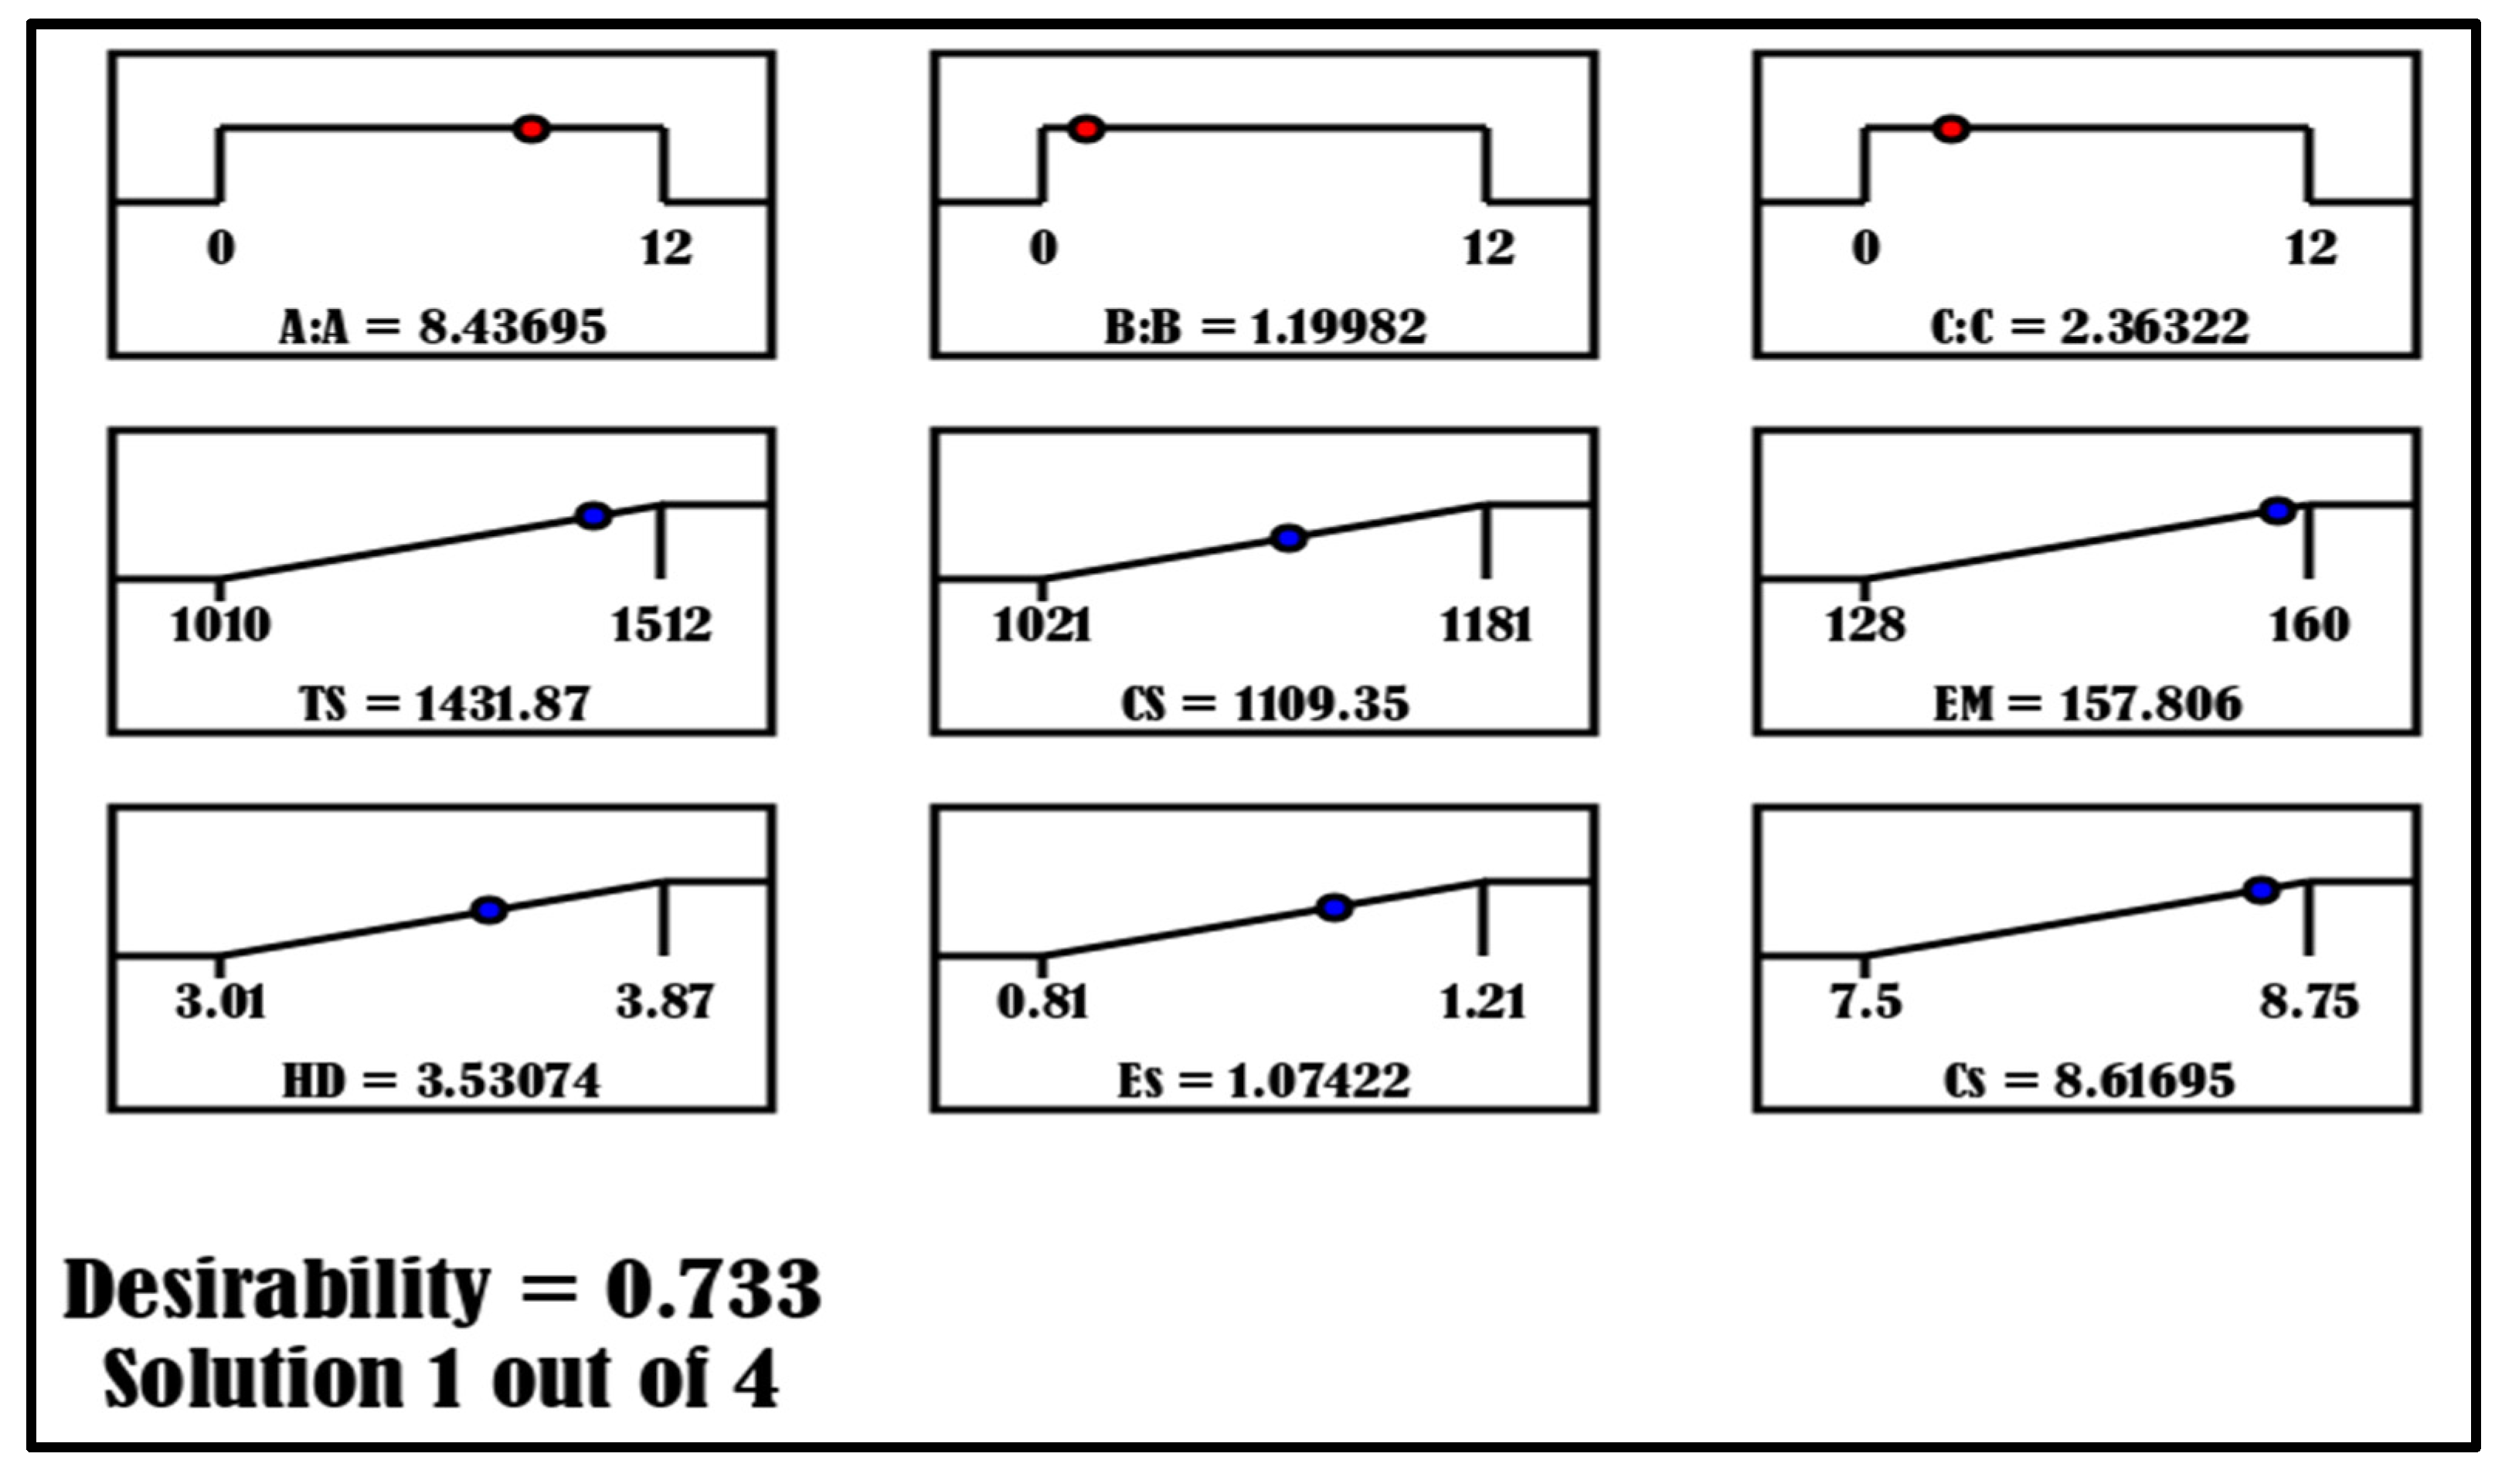
3.8. Multiobjective Optimization and Model Validation

The desirability function is often used to access simultaneous optimization of response surfaces. The projected values derived from the models are converted to a scale ranging from 0 to 1. A desirability rating of 0 denotes unfavorable conditions, while a desirability value of 1.00 represents 100 percent steady desirability [47]. The desirability function is a mathematical method for determining the ideal combination of input variables to maximize the overall performance of answers. The aim for desirability is always 1.00; however, the vast majority of outcomes fall below this mark. As described in references [47,48,49,50,51], the acquired data were optimized using the Design Expert 13 program. In Table 5, the optimization criteria and restrictions are emphasized.
Figure 8a depicts the response surface of the desirability function in this research, illustrating how the interaction between the input factors impacts the desirability values. In contrast, Figure 8b’s desirability ternary plot depicts the various desirability values at distinct parametric combinations of input variables. The maximum level of desirability attained by parametric optimization is 0.7325 (73.3%).
Figure 9 depicts the optimal values for optimizing overall performance as determined by the multi-objective optimization process, similar to refs. [52,53,54]. For optimal performance of the trihybrid composite, the projected optimal parameters are 8.43695% for A (LHEA), 1.199825% for B (B4C), and 2.36332% for C. (ZrO2). The software (design expert 13) predicts the optimal parameters to be 1431.87 MPa, 1109.35 MPa, 157.806 GPa, 3.53074 GPa, 1.07422 × 10⁻² mm/mm, and 8.61695 × 10⁻³ mm/mm for tensile strength, compressive strength, elastic modulus, hardness, elastic strain, and compressive strain, respectively, with a maximum desirability of 0.733.
In order to validate the accuracy of the models and the predicted optimum parameter, five samples were generated at the optimal formulations of 8.4%, 1.2%, and 2.4% for LHEA, B4C, and ZrO2, respectively. The samples were evaluated for the assessed properties, and the mean results for each property response were recorded. The experimental values for the respective responses are 1403.9 MPa, 1138.7 MPa, 163 GPa, 3.48 GPa, 1.10 × 10⁻² mm/mm, and 8.38 × 10⁻³ mm/mm. The variations between actual and predicted values for each property are 1.95, 2.65, 3.29, 1.44, 2.40, and 2.75% (Figure 9). The difference between the anticipated values and experimental values is 5%; hence, the mathematical models for the responses are further validated and deemed suitable for future prediction of the property parameters evaluated in this research.

4. Conclusions

An experimental design, modeling, and optimization of titanium trihybrid composites with Al50Cu10Sn5Mg20Zn10Ti5, B4C, and ZrO2 fillers was conducted utilizing a mixed design experiment. The following is arrived at:
  • The analysis of variance revealed that the contributions of the inputs to the investigated response properties are substantial. The relevance of the cross-interaction between the input components varied for each response.
  • Mathematical models were built for the attributes, and their mathematical significance in forecasting the responses was confirmed.
  • The response surface plot revealed various interaction patterns for the input variables and their interactions, indicating that the trend of the responses depended on the interactive patterns between the variables.
  • The ternary plots revealed varying regions in achieving varying outputs at varying parameter combinations.
  • The predicted optimization formulation was 8.43695 wt.% for A (LHEA), 1.19982 wt.% for B (B4C), and 2.36332 wt.% for C (ZrO2), yielding tensile strength, compressive strength, elastic strain, and compressive strain values of 1431.87 MPa, 1109.35 MPa, 157.806 GPa, 3.53074 GPa, 1.07422 × 10⁻² mm/mm, and 8.61695 mm/mm.
The validation experiment yielded marginal variation (error of less than 5%) from the forecasted values, attesting that the models are statistically competent for future response prediction.
It is concluded that for the balanced performance of the trihybrid composite, the optimum formulation is 8.4 wt.%, 1.2 wt.%, and 2.4 wt.% for LHEA, B4C, and ZrO2, based on the highest desirability of 0.733 obtained.

Author Contributions

A.A.A.: conceptualization, software, validation, formal analysis, data curation, writing original draft, and writing review and editing. D.M. and E.R.: formal analysis, data curation. O.A.B. and J.P.K.: validation, formal analysis, data curation, writing original draft, and writing review and editing. V.R.: conceptualization, resources, experiment, data curation, and writing review and editing. All authors have read and agreed to the published version of the manuscript.

Funding

This research received no external funding.

Data Availability Statement

All data employed in this report are presented herein.

Conflicts of Interest

The authors declare no conflict of interest.

References

  1. Pan, H. Development and application of lightweight high-strength metal materials. MATEC Web Conf. 2018, 207, 03010. [Google Scholar] [CrossRef] [Green Version]
  2. Zhang, W.; Xu, J. Advanced lightweight materials for automobiles: A review. Mater. Des. 2022, 221, 110994. [Google Scholar] [CrossRef]
  3. Nyamekye, P.; Golroudhary, S.R.; Piili, H.; Luukka, P.; Kraslawski, A. Impact of additive manufacturing on titanium supply chain: Case of titanium alloys in automotive and aerospace industries. Adv. Ind. Manuf. Eng. 2023, 6, 100112. [Google Scholar] [CrossRef]
  4. Falodun, O.E.; Obadele, B.A.; Oke, S.R.; Okoro, A.M.; Olumbambi, P.A. Titanium-based matrix composites reinforced with particulate, microstructure, and mechanical properties using spark plasma sintering technique: A review. Int. J. Adv. Manuf. Technol. 2019, 102, 1689–1701. [Google Scholar] [CrossRef]
  5. Shetty, R.; Hegde, A.; Shetty, U.K.; Nayak, R.; Naik, N.; Nayak, M. Processing and mechanical characterization of titanium metal matrix composites: A literature review. J. Compos. Sci. 2022, 6, 388. [Google Scholar] [CrossRef]
  6. Gofrey, T.M.T.; Goodwin, P.S.; Wrad-Close, C.M. Titanium particulate metal matrix composites–reinforcement, production methods, and mechanical properties. Adv. Eng. Mater. 2000, 2, 85–91. [Google Scholar] [CrossRef]
  7. Ogunsanya, O.A.; Akinwande, A.A.; Balogun, O.A.; Romanovski, V.; Kumar, M.S. Mechanical and damping behavior of artificially aged Al 6061/TiO2 reinforced composites for aerospace application. Part. Sci. Technol. 2022, 41, 196–208. [Google Scholar] [CrossRef]
  8. Hayat, M.D.; Singh, H.; He, Z.; Cao, P. Titanium metal matrix composites: An overview. Compos. Part A Appl. Sci. Manuf. 2019, 121, 418–438. [Google Scholar] [CrossRef]
  9. Yi, J.; Niu, B.; Pan, L.; Zou, X.; Cao, Y.; Wang, X.; Luo, J.; Hu, Y. Influence of WC grain size on the microstructure and wear property enhacement of 18Ni300 coatings. Surf. Coat. Technol. 2022, 414, 128823. [Google Scholar] [CrossRef]
  10. Olaniran, O.; Akinwande, A.A.; Adediran, A.A.; Jen, T.C. Microstructural characterization and properties of aluminium 7075/Mo prepared by microwave sintering for high-strength application. Adv. Mater. Process. Technol. 2022, 1. [Google Scholar] [CrossRef]
  11. Olorunyolemi, O.C.; Ogunsanya, O.A.; Akinwande, A.A.; Balogun, O.A.; Kumar, M.S. Enhanced mechanical behavior and grain characterization of aluminium matrix composites by cold rolling and reinforcement addition (Rice husk ash and coal fly ash). J. Process. Mech. Eng. 2022. [Google Scholar] [CrossRef]
  12. Gobalakrishnan, B.; Rajaravi, C.; Udhayakumar, G.; Lakshminarayanan, P.R. Effect of ceramic particulate addition on aluminium based ex-situ and in-situ formed metal matrix composites. Met. Mater. Int. 2020, 27, 3695–3708. [Google Scholar] [CrossRef]
  13. Laad, M.; Ghule, B. Synthesis and characterization of natural ceramic reinforced titanium metal matrix composite. Can. J. Metall. Mater. Sci. 2021, 60, 196–202. [Google Scholar] [CrossRef]
  14. Kumar, N.; Bharti, A.; Azam, S.M. Effect of reinforcement with metallic, carbon, and ceramic fillers on copper matrix composite physical and mechanical properties. Met. Sci. Heat Treat. 2022, 64, 223–226. [Google Scholar] [CrossRef]
  15. Bajakke, P.A.; Malik, V.R.; Deshpande, A.S. Particulate metal matrix composites and their fabrication via friction stir processing—A review. Mater. Manuf. Process. 2019, 34, 833–881. [Google Scholar] [CrossRef]
  16. Ashebir, D.A.; Mengesha, G.A.; Sinha, D.K. The role of tetra hybrid reinforcements on the behavior of aluminium metal matrix composites. J. Nanomater. 2022, 2022, 1–18. [Google Scholar] [CrossRef]
  17. Karthik, G.M.; Panikar, S.; Ram, G.D.J.; Kottada, R.S. Additive manufacturing of an aluminium matrix composite reinforced with nanocrystalline high-entropy alloy particles. Mater. Sci. Eng. A 2017, 679, 193–203. [Google Scholar] [CrossRef]
  18. Talabi, H.K.; Ojomo, A.M.; Folorunsho, O.E.; Akinfolarin, J.F.; Kumar, J.P.; Mohan, R.R.; Akinwande, A.A.; Kumar, M.S. Development of hybrid aluminium alloy composites modified with locally sourced environmental wastes. Adv. Mater. Process. Technol. 2022, 1–18. [Google Scholar] [CrossRef]
  19. Luo, K.; Xiong, H.; Zhnag, Y.; Gu, H.; Li, Z.; Kong, C.; Yu, H. AA1050 metal matrix composites reinforced by high-entropy alloy particles via stir casting and subsequent rolling. J. Alloys Compd. 2022, 893, 162370. [Google Scholar] [CrossRef]
  20. Prakash, K.S.; Purusothaman, M.; Sasikumar, M. Fabrication and characterization of metal-high entropy alloy composites. Int. J. Met. Cast. 2019, 14, 547–555. [Google Scholar] [CrossRef]
  21. Gao, C.; Wang, Q.; Wei, M.; Fan, H.; Zhao, L.; Wei, Y.; Ma, Q. Effects of reinforcement volume fraction on mechanical properties and microstructures of 7075Al matrix composites reinforced by FeCoCrNiAl high-entropy-alloy particles. Metals 2022, 12, 851. [Google Scholar] [CrossRef]
  22. Yang, X.; Dong, P.; Yan, Z.; Cheng, B.; Zhai, X.; Chen, H.; Zhang, H.; Wang, W. AlCoCrFeNu high-entropy alloy particle reinforced 5083Al matrix composites wityh fine grain structure fabricated by submerged friction stir processing. J. Alloys Compd. 2020, 836, 155411. [Google Scholar] [CrossRef]
  23. Ananiadis, E.; Argyris, K.T.; Matikas, T.E.; Sfikas, A.K.; Karantzalis, A.E. Microstructure and corrosion performance of aluminium matrix composites reinforced with refractory high-entropy alloy particulates. Appl. Sci. 2021, 11, 1300. [Google Scholar] [CrossRef]
  24. Yuan, Z.; Tian, W.; Li, F.; Fu, Q.; Hu, Y.; Wang, X. Microstructure and properties of high-entropy alloy reinforced aluminium matrix composites by spark plasma sintering. J. Alloys Compd. 2019, 806, 901–908. [Google Scholar] [CrossRef]
  25. Kumar, A.; Singh, A.; Suhane, A. Synthesis and characterization of a novel CoCrFeMnNi high-entropy alloy-reinforced AA6082 composite. J. Mater. Res. 2022, 37, 2961–2978. [Google Scholar] [CrossRef]
  26. Lu, T.; He, T.; Li, Z.; Chen, H.; Han, X.; Fu, Z.; Chen, W. Microstructure, mechanical properties and machinability of particulate reinforced Al matrix composites: A comparative study between SiC particles and high-entropy alloy particles. J. Mater. Res. Technol. 2020, 9, 13646–13660. [Google Scholar] [CrossRef]
  27. Chinababu, M.; Krishna, N.N.; Sivaprasad, K.; Prashanth, K.G.; Rao, E.B. Evolution of microstructure and mechanical properties of LM25-HEA composite processed through stir casting with a bottom pouring system. Materials 2022, 15, 230. [Google Scholar] [CrossRef]
  28. Antunes, R.A.; Salvador, C.A.F.; Oliveira, M.C.L. Materials Selection of optimized titanium alloys for aircraft applications. Mater. Res. 2018, 21, e20170979. [Google Scholar] [CrossRef] [Green Version]
  29. Tshephe, T.S.; Akinwamide, S.O.; Olevsky, E.; Olumbambi, P.A. Additive manufacturing of titanium-based alloys—A review of methods, properties, challenges, and prospects. Heliyon 2022, 8, e09041. [Google Scholar] [CrossRef]
  30. Srivabut, C.; Ratanawilai, T.; Hiziroglu, S. Response surface optimization and statistical analysis of composites made from calcium carbonate filler-added recycled polypropylene and rubberwood fiber. J. Thermoplast. Compos. Mater. 2019, 35, 391–415. [Google Scholar] [CrossRef]
  31. Santana, H.A.; Neto, J.S.A.; Amorim, N.S., Jr.; Ribeiro, D.V.; Cilla, M.S.; Dias, C.M.R. Sel-compacting geopolymer mixture: Dosing based on statistical mixture design and simulateneuous optimization. Constr. Build. Mater. 2020, 249, 118677. [Google Scholar] [CrossRef]
  32. Yildizel, S.A.; Tayeh, B.A.; Calis, G. Experimental and modelling study of mixture design optimization of glass fiber-reinfoced concrete with combined utilization of Taguchi and Extreme Vertices Design Techniques. J. Mater. Res. Technol. 2020, 9, 2093–2106. [Google Scholar] [CrossRef]
  33. Akinwande, A.A.; Balogun, O.A.; Adediran, A.A.; Adesina, O.S.; Romanovski, V.; Jen, T.C. Experimental analysis, statistical modeling, and parametric optimization of quinary-(CoCrFeMnNi)100-x/TiCx high-entropy-alloy (HEA) manufactured by laser additive manufacturing. Results Eng. 2022, 17, 100802. [Google Scholar] [CrossRef]
  34. Ogunbiyi, O.; Tian, Y.; Akinwande, A.A.; Rominiyi, A.L. AA7075/HEA composites fabricated by microwave sintering: Assessment of the microstructural features and response surface optimization. Intermetallics 2023, 155, 107830. [Google Scholar] [CrossRef]
  35. Scheffe, H. Experiments with mixtures. J. R. Stat. Soc. 1958, 20, 344–360. [Google Scholar] [CrossRef]
  36. Umashankar, M. Characterization and effect of particle sizes on the mechanical properties of glass particulate reinforced aluminium alloy 6061 metal matrix composites. Mater. Today Proc. 2018, 5, 12872–12876. [Google Scholar] [CrossRef]
  37. ASTM E 8M-21; Standard Test Methods for Tension Testing of Metallic Materials. ASTM International: West Conshohocken, PA, USA, 2021.
  38. ASTM E92-17; Standard Test Methods for Vickers Hardness and Knoop Hardness of Metallic Materials. ASTM International: West Conshohocken, PA, USA, 2017.
  39. ASTM E09-9; Standard Test Methods for Compression Testing of Metallic Materials at Room Temperature. ASTM International: West Conshohocken, PA, USA, 2018.
  40. Akinwande, A.A.; Balogun, O.A.; Romanovski, V.; Danso, H.; Kamarou, M.; Ademati, A.O. Mechanical performance and Taguchi optimization of Kenaf fiber/cement-paperboard composite for interior application. Environ. Sci. Pollut. Res. 2022, 29, 52675–52688. [Google Scholar] [CrossRef]
  41. Adediran, A.A.; Akinwande, A.A.; Balogun, O.A.; Bello, O.S.; Akinbowale, M.K.; Adesina, O.S.; Ojo, A.A. Mechanical and optimization studies of polypropylene hybrid biocomposites. Sci. Rep. 2022, 12, 2468. [Google Scholar] [CrossRef]
  42. Akinwande, A.A.; Folorunso, D.O.; Balogun, O.A.; Danso, H.; Romanovski, V. Paperbricks produced from wastes: Modeling and optimization of compressive strength by response surface approach. Environ. Sci. Pollut. Res. 2022, 30, 8080–8097. [Google Scholar] [CrossRef]
  43. Akinwande, A.A.; Folorunso, D.O.; Balogun, O.A.; Romanovski, V. Mathematical modelling, multi-objective optimization, and compliance reliability of paper-derived eco-composites. Environ. Sci. Pollut. Res. 2022, 29, 70135–70157. [Google Scholar] [CrossRef]
  44. Balogun, O.A.; Akinwande, A.A.; Oguinsanya, O.A.; Ademati, A.O.; Adediran, A.A.; Erinle, T.J.; Akinlabi, E.T. Central composite design and optimization of selected stir casting parameters on flexural strength and fracture toughness mTiO2/Al 7075 composites. Mater. Today Proc. 2022, 62, 4574–4583. [Google Scholar] [CrossRef]
  45. Olaniran, O.A.; Akinwande, A.A.; Adediran, A.A.; Jen, T.C. Process maps and regression models for the physio-thermo-mechanical properties of sintered Al7075-molybdenum composite. Mater. Lett. 2023, 332, 133527. [Google Scholar] [CrossRef]
  46. Akinwande, A.A.; Adediran, A.A.; Balogun, O.A.; Olorunfemi, B.J.; Kumar, M.S. Optimization of flexural strength of recycled polyethylene-terephthalate (PET) eco-composite using response surface methodology. E3S Web Conf. 2021, 309, 01094. [Google Scholar] [CrossRef]
  47. Mermerdas, K.; Algin, Z.; Oleiwi, S.M.; Nassani, D.E. Optimization of lightweight GCBFS and FA geopolymer mortars by response surface method. Constr. Build. Mater. 2017, 139, 159–171. [Google Scholar] [CrossRef]
  48. Ademati, A.A.; Akinwande, A.A.; Balogun, O.A.; Romanovski, V. Optimization of bamboo fiber-reinforced composite-clay bricks for development of low-cost farm settlements toward boosting rural agribusiness in Africa. J. Mater. Civ. Eng. 2022, 34, 04022335. [Google Scholar] [CrossRef]
  49. Akinwande, A.A.; Balogun, O.A.; Romanovski, V. Modeling, multi-response optimization, and performance reliability of green metal composites produced from municipal wastes. Environ. Sci. Pollut. Res. 2022, 29, 61027–61048. [Google Scholar] [CrossRef]
  50. Akinwande, A.A.; Adediran, A.A.; Balogun, O.A.; Yibowei, M.; Barnabas, A.; Talabi, H.K.; Olorunfemi, B.J. Optimization of selected casting parameters on the mechanical behavior of Al 6061/glass powder composites. Heliyon 2022, 8, e09350. [Google Scholar] [CrossRef]
  51. Akinwande, A.A.; Adesina, O.A.; Adediran, A.A.; Balogun, O.A.; Makuro, D.; Balogun, O.P.; Tee, K.F.; Kumar, M.S. Microstructure, process optimization, and strength response modelling of green-aluminium-6061 composite as automobile material. Ceramics 2023, 6, 386–415. [Google Scholar] [CrossRef]
  52. Sur, G.; Erkan, O. Surface quality optimization of CFRP plates drilled with standard and step drill bits using Taguchi, Topsis and AHP method. Eng. Comput. 2020; ahead of pront. [Google Scholar] [CrossRef]
  53. Erkan, O.; Demetgul, M.; Isik, B.; Tansel, I.N. Selection of optimal machining conditions for the composite material by using Taguchi and GONNs. Measurement 2014, 48, 306–313. [Google Scholar] [CrossRef]
  54. Adesina, O.S.; Akinwande, A.A.; Balogun, O.A.; Adediran, A.A.; Sanyaolu, O.O.; Romanovski, V. Statistical analysis and optimization of the experimental results on performance of green aluminium-7075 hybrid composites. J. Compos. Sci. 2023, 7, 115. [Google Scholar] [CrossRef]
Figure 1. Extreme vertices coordinate for the mixture design.
Mca 28 00054 g001
Figure 2. Variation in experimental values at varying formulation of the reinforcement with regards to (a) tensile strength, (b) compressive strength, (c) elastic modulus, (d) hardness, (e) elastic strain, and (f) compressive strain.
Mca 28 00054 g002
Figure 3. Percentage contribution of the input powders on response properties of the trihybrid titanium composite.
Mca 28 00054 g003
Figure 4. Probability plot for the responses.
Mca 28 00054 g004
Figure 5. Predicted vs. experimental values plot for the responses.
Mca 28 00054 g005
Figure 6. Surface plots for response parameters: (a) tensile strength, (b) compressive strength, (c) elastic modulus, (d) hardness, (e) elastic strain, and (f) compressive strain.
Mca 28 00054 g006
Figure 7. Ternary plots for response parameters: (a) tensile strength, (b) compressive strength, (c) elastic modulus, (d) hardness, (e) elastic strain, and (f) compressive strain.
Mca 28 00054 g007
Figure 8. Desirability: (a) response surface plot and (b) ternary plot.
Mca 28 00054 g008
Figure 9. Optimization ramp.
Mca 28 00054 g009
Table 1. Mix design formulations.
Experimental RunsFormulationTotal
A (wt.%)B (wt.%)C (wt.%)
0 (control)0000
1012012
260612
366012
444412
5001212
628212
7120012
882212
906612
1022812
Table 2. The p-values of the responses.
Tensile StrengthCompressive StrengthElastic ModulusHardnessElastic StrainCompressive Strain
Sourcep-Value%Cp-Value%Cp-Value%Cp-Value%Cp-Value%Cp-Value%C
A + B + C<0.0001.36.50.013124.30.000248.90.003119.8<0.000126.90.000132.7
AB0.000430.20.017012.60.008124.60.003818.6<0.000128.20.000627.78
AC0.249815.10.000227.90.07452.30.000233.50.006925.50.000135.9
BC0.001318.2<0.000135.20.008124.20.001428.10.020219.40.89303.6
Error0.98730.641.13290.610.88631.060.78861.211.22840.441.13770.61
Model0.000299.360.000299.390.000598.940.000698.79<0.000199.560.000299.39
%C stands for percentage contribution.
Table 3. Predicted and experimental values, and percentage error for the experimental runs.
Experimental Runs and Values
12345678910
TSPV1005.971297.561414.281374.751141.241277.561506.701445.371294.831284.74
EV1010.001287.001408.001402.001141.001272.001512.001436.001283.001291.00
% error−0.40+0.81+0.44−1.98+0.02+0.44−0.35+0.65+0.91−0.57
CSPV1050.051125.811072.991158.251022.871132.991039.501109.631185.361141.54
EV1052.001120.001071.001160.001021.001131.001040.001112.001181.001151.00
% error−0.19+0.52+0.19−0.15+0.18+0.18−0.05−0.21+0.37−0.83
EMPV139.88152.01153.82151.50128.07147.46159.88157.46142.01142.91
EV140.00153.00155.00152.00128.00146.00160.00156.00143.00142.00
% error−0.09−0.65−0.77−0.33+0.05+0.99−0.08+0.93−0.70+0.64
HDPV3.013.173.753.563.693.513.883.613.753.55
EV3.013.163.743.503.693.533.873.663.753.57
% error0.00+0.32+0.27+1.690.00−0.57+0.26−1.390.00−0.56
EsPV0.98731.21000.80650.98421.20000.90961.12001.02001.02001.1200
EV0.99001.21000.81001.00001.20000.90001.12001.00001.02001.1200
% error−0.270.00−0.43−1.610.00+1.060.00+1.960.000.00
CsPV8.338.608.748.557.508.478.188.647.918.14
EV8.348.608.758.507.508.448.168.707.948.14
% error−0.120.00−0.11+0.580.00+0.35+0.24−0.69−0.380.00
Table 4. Parametric range for desirable objectives.
ParameterDesirable RegionRange of Values for Independent Variable CombinationPredicted Range of ValuesPredicted Desirable Values
LHEA (wt.%)B4C (wt.%)ZrO2 (wt.%)
Tensile strengthA9.07–12.01.02–2.930.00–0.391500–1600 MPa1517.11 MPa
Compressive strengthB0.00–5.112.50–9.222.77–8.631150–1200 MPa1185.57 MPa
Elastic modulus C0.00–5.240.00–8.030.00–6.69150–160 GPa159.83 GPa
HardnessD0.05–120.00–5.150.00–9.833.80–4.00 GPa3.88 GPa
Elastic strainE0.00–7.040.00–0.380.00–12.001.20–1.30 mm/mm1.225 mm/mm
Compressive strainF0.00–9.760.00–9.760.00–6.008.60–8.80 mm/mm8.737 mm/mm
Table 5. Objectives for optimization and minimum and maximum response limitations.
NameGoalLower LimitUpper Limit
A: LHEAis in range012
B: B4Cis in range012
C: ZrO2is in range012
Tensile strengthmaximize10101512
Compressive strengthmaximize10211181
Elastic modulusmaximize128160
Hardnessmaximize3.013.87
Elastic strainmaximize0.811.21
Compressive strainmaximize7.58.75
Disclaimer/Publisher’s Note: The statements, opinions and data contained in all publications are solely those of the individual author(s) and contributor(s) and not of MDPI and/or the editor(s). MDPI and/or the editor(s) disclaim responsibility for any injury to people or property resulting from any ideas, methods, instructions or products referred to in the content.

