Next Article in Journal
A Validated, Stability-Indicating, Eco-Friendly HPTLC Method for the Determination of Cinnarizine
Previous Article in Journal
Green Automated Solid Phase Extraction to Measure Levofloxacin in Human Serum via Liquid Chromatography with Fluorescence Detection for Pharmacokinetic Study
 
 
Correction published on 15 April 2024, see Separations 2024, 11(4), 118.
Article

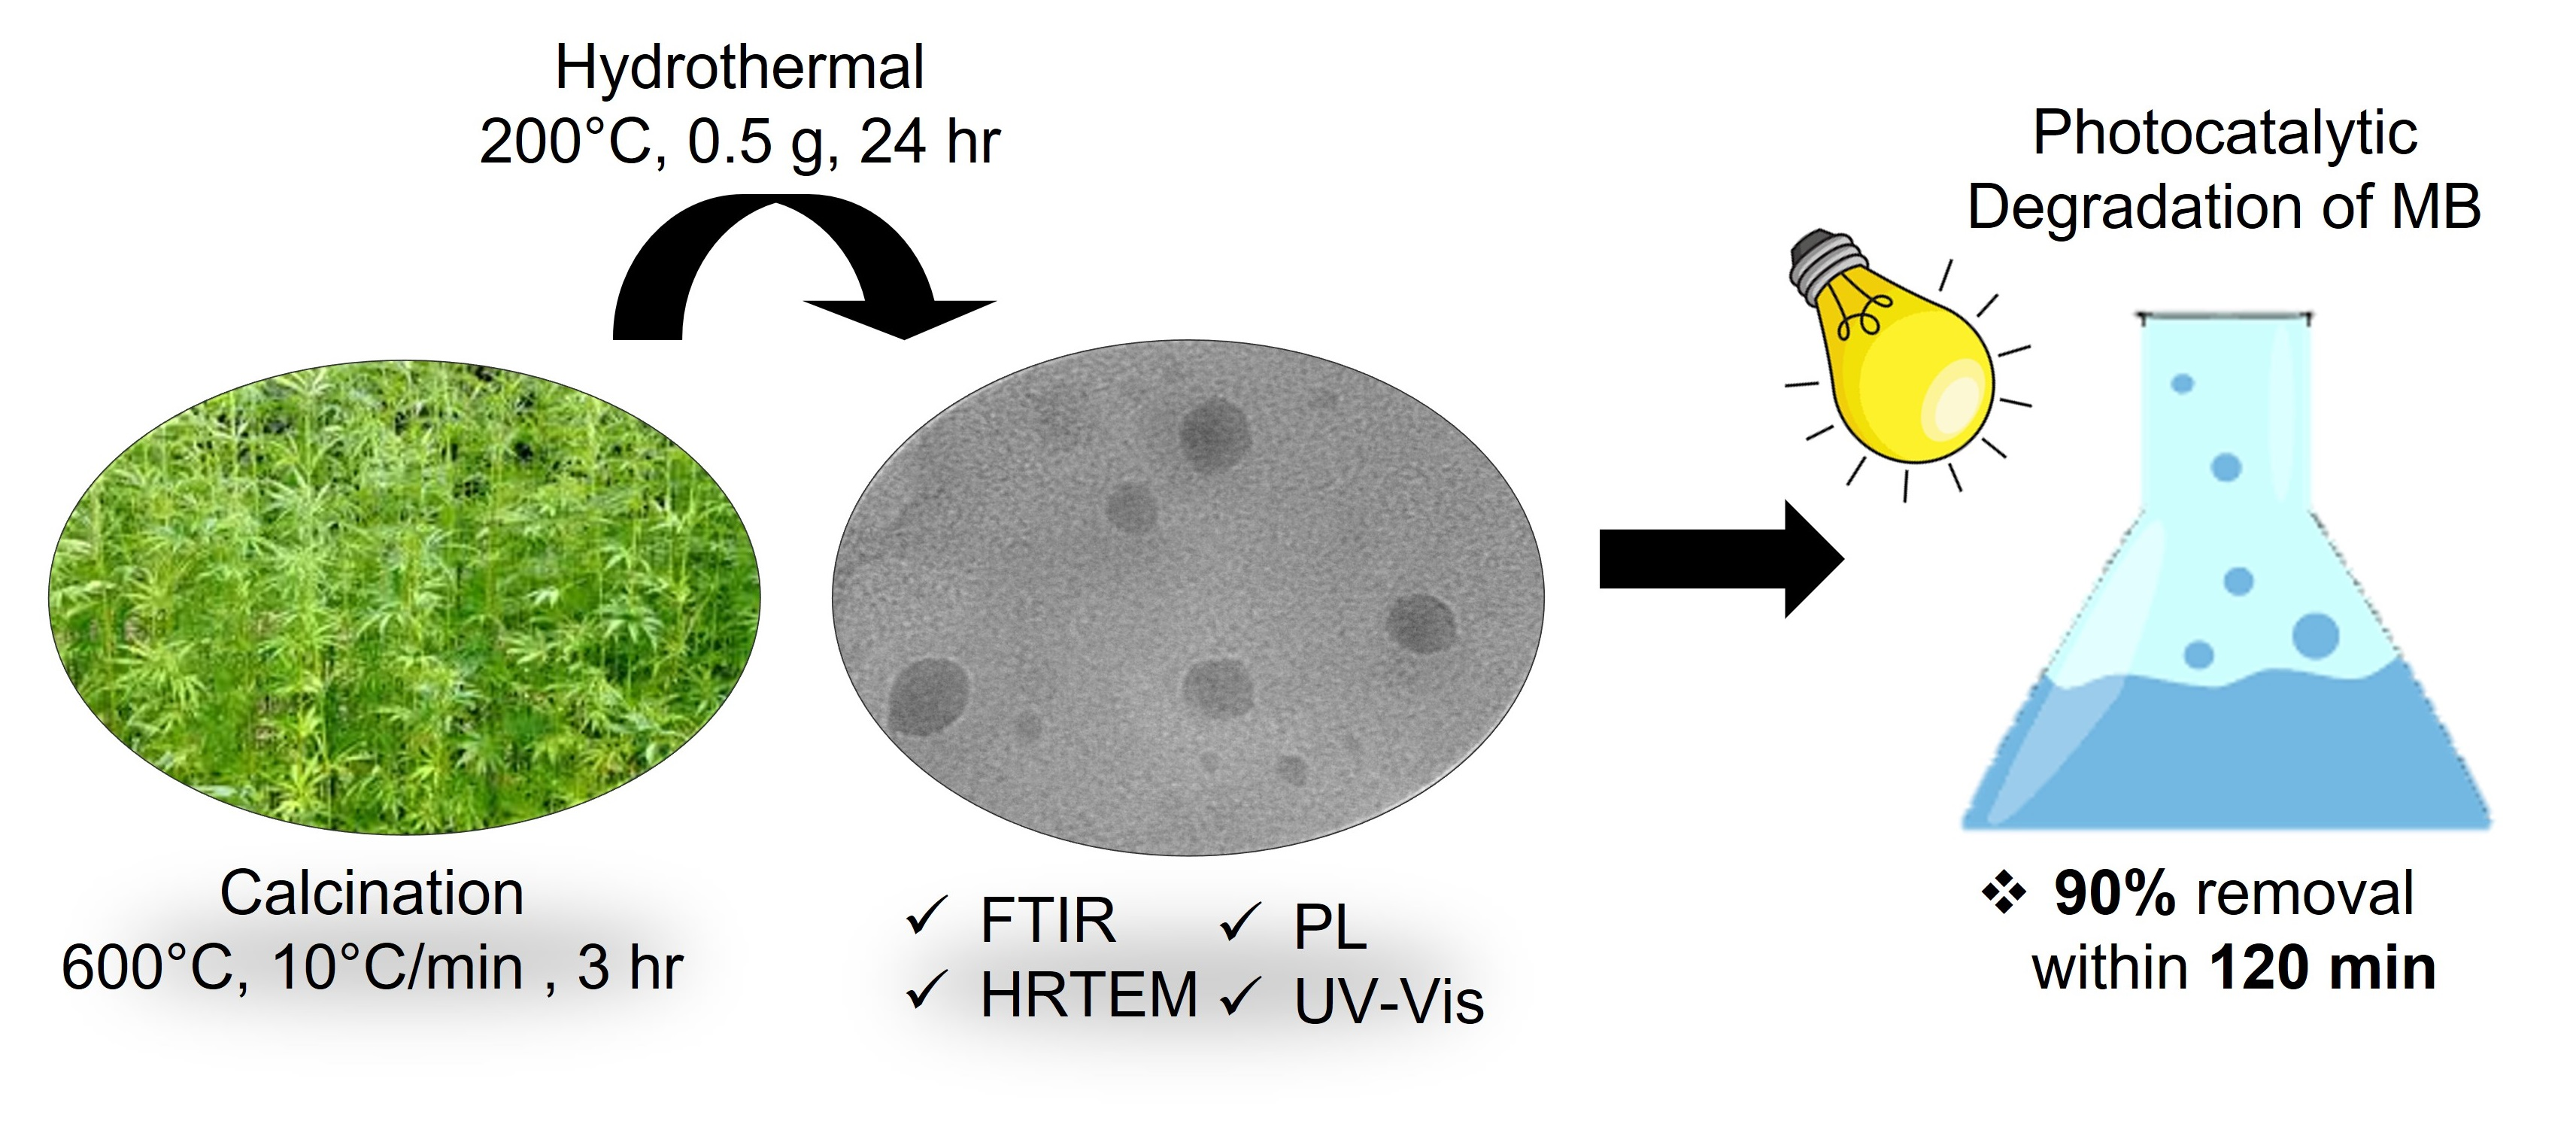
Effect of Hydrothermal Conditions on Kenaf-Based Carbon Quantum Dots Properties and Photocatalytic Degradation

by
Nabilah Saafie
1,
Nonni Soraya Sambudi
2,
Mohd Dzul Hakim Wirzal
1,3 and
Suriati Sufian
1,4,*
1
Chemical Engineering Department, Universiti Teknologi PETRONAS, Seri Iskandar 32610, Malaysia
2
Department of Chemical Engineering, Universitas Pertamina, Daerah Khusus Ibukota Jakarta 12220, Indonesia
3
Center of Research in Ionic Liquids (CORIL), Universiti Teknologi PETRONAS, Seri Iskandar 32610, Malaysia
4
Center of Innovative Nanostructures and Nanodevices (COINN), Universiti Teknologi PETRONAS, Seri Iskandar 32610, Malaysia
*
Author to whom correspondence should be addressed.
Separations 2023, 10(2), 137; https://doi.org/10.3390/separations10020137
Submission received: 27 January 2023 / Revised: 14 February 2023 / Accepted: 15 February 2023 / Published: 17 February 2023 / Corrected: 15 April 2024
(This article belongs to the Section Environmental Separations)

Abstract

:
The development of biomass-based CQD is highly attentive to enhancing photocatalytic performance, especially in secondary or ternary heterogeneous photocatalysts by allowing for smooth electron-hole separation and migration. In this study, kenaf-based carbon quantum dots (CQD) were prepared. The main objective of the current work was to investigate temperature, precursor mass and time in hydrothermal synthesis treatment to improve the CQD properties and methylene blue photocatalytic degradation. Optimization of kenaf-based CQD for inclusion in hydrothermal treatment was analyzed. The as-prepared CQDs were characterized in detail by Fourier transform infrared (FTIR) spectroscopy, using a Hitachi TEM System (HT7830, RuliTEM, Tokyo, Japan), by photoluminescence (PL), and by ultraviolet-visible (UV-Vis) spectroscopy. It was found that C200-0.5-24 exhibits a higher photocatalytic activity of the methylene blue dye and optimized hydrothermal conditions of 200 °C, 0.5 g and 24 h. Therefore, novel kenaf-based CQD was synthesized for the first time and was successfully optimized in the as-mentioned conditions. During the hydrothermal treatment, precursor mass controls the size and the distribution of CQD nanoparticles formed. The C200-0.5-24 showed a clearly defined and well-distributed CQD with an optimized nanoparticle size of 8.1 ± 2.2 nm. Indeed, the C200-0.5-24 shows the removal rate of 90% of MB being removed within 120 min.

Graphical Abstract

1. Introduction

Carbon quantum dots operate as electron state mediators, one of the alternative ways to establish firm interface contact between heterojunctions of a photocatalyst system which can improve carrier separation photocatalytic performance [1]. Quantum dots are semiconductor nanocrystals that are zero-dimensional (0D) nanomaterials with particle sizes in the nanometer range [2]. Different quasi-spherical carbon nanoparticles with sizes between 2 and 10 nm are known as carbon quantum dots. When the particle size of QDs is reduced to the nanoscale, excitons will be constrained in spatial dimensions, leading to discrete quantum states [3]. An exciton is formed when a weak coulombic force attracts an excited electron and a hole pair. As a result of the restricted mobility of excited electrons, a significant band gap is created, which can prevent recombination processes that result in the loss of active electrons [4].
Random flaws on photocatalyst surfaces are thought to cause a high rate of charge carrier recombination because they serve as hotspots for free-moving electrons [5]. Carbon quantum dots are frequently used in semiconductor modification because of their excellent electron-accepting ability and significant electron-storing capacity. Additionally, the heterojunction photocatalyst structure is driven by the high electron affinity of these molecules. As a result, the conducting network of CQDs allows electrons to move freely, separating them from the holes in the semiconductor’s valence band [6]. The high-speed separation prevents them from returning to equilibrium, allowing the hybrids to achieve charge stability. Charge carriers with a longer lifetime are more likely to be involved in forming free radicals, which can improve the overall degrading efficiency of photocatalysts.
These CQDs strategies have several benefits, such as (i) enhancing the photocatalyst surface morphology (nanoparticle size and shape), (ii) increasing the photocatalyst band gap energy, (iii) increasing the photocatalyst active surface site area, and (iv) allowing for smooth electron-hole separation and migration [7]. However, as existing data and studies demonstrate, this carbon quantum dots technique may not always be advantageous in boosting the photocatalytic performance of photocatalysts. In addition, while experimental lab results with simulated systems are presented, the actual natural environment’s behavior may differ [8]. For instance, in the case of wastewater degradation, the actual result might not match the simulation because the interaction between natural microflora and trace elements may be positively or negatively impacted [9].
Due to their abundance, low toxicity, low cost, and prolonged duration, carbon-based quantum dots have attracted the attention of other members of the quantum dot family, including semiconductor and graphene quantum dots [10]. The enormous potential of biomass-based CQDs as a renewable energy source that significantly contributes to long-term photocatalytic technology has been shown. Numerous techniques, such as hydrothermal, solar thermal, pyrolysis, microwave irradiation, and thermal decomposition, have been used to create carbon quantum dots [11]. However, hydrothermal synthesis is one of the most often utilized procedures because it includes simple preparation processes and is thus more cost-effective, as shown in Table 1.
Wongso et al. showed that the silica carbon quantum dots (Si-CQDs) from rice husk are decorated into a TiO2 matrix through easy mixing to minimize TiO2’s drawbacks in place of the beneficial effects of CQDs [13]. The PL spectra and the N2 sorption isotherm show that adding Si-CQDs to the mix extends the charge separation lifetime and increases surface area (17% more than TiO2). Due to the large surface area, it offers more active sites for the breakdown of pollutants, which enhances photocatalytic activity. Additionally, Wongso et al. found that loading Si-CQDs into TiO2 of 1 weight percent is the most effective and can eliminate acetaminophen 33.3% faster than pure TiO2. The paper also mentioned that adding more than one weight percent of TiO2 reduces the surface area of the composite because an excess of Si-CQDs may plug the pore.
In this regard, high specific surface area, pendant functional groups, high chemical activity, and nanosized CQDs have a significant impact on promoting ion storage and transfer [18]. CQDs are amorphous shell structures with large functional chains and a carbon core in most cases. The disadvantages, however, include the inability to precisely control the size of nanoparticles and the ability of CQDs shells to alter optical properties [19]. Therefore, several studies suggested that a stable polymer CQDs shell is necessary for a properly engineered heterojunction photocatalyst. Additionally, these CQD-heterogeneous photocatalysts were reportedly able to exhibit higher photocatalytic activity and photocatalytic regeneration. To increase the sustainability and affordability of CQD production, green synthesis techniques using natural precursors are currently being researched [17].
Therefore, natural carbon materials such as biomass from kenaf plants will be used to produce quantum dots in this work. Kenaf is a Malvaceae family plant with a rapid growth rate and large biomass utilized as a versatile fiber source. Kenaf matures in 5–6 months and has cellulose as its main component, accounting for more than 70% of its entire structure [20]. Carbon quantum dots made from biochar such as kenaf contain carbon nanoparticles with diameters smaller than 10 nm, with features such as semiconductor nanoparticles [21]. Biomass-based CQDs are superior as electron state mediators due to their low cost, ease of synthesis, and abundant source. The conventional heterojunctions typically result in unfavorable losses of redox ability for photogenerated charge carriers. A cost-efficient solid electron mediator plays an essential role in relaying the electron to improve the catalytic efficiency of the photocatalytic system.
Herein, this work reports a hydrothermal synthesis treatment of kenaf-based CQD, which has not been reported previously. Accordingly, an optimization synthesis of kenaf-based CQD development was evaluated in this research for an optimal application to a visible-light-driven photocatalyst for methylene blue removal. However, the hydrothermal parameters might influence the photodegradation performance, depending on the precursor mass, temperature and time. Therefore, this research compares the as-prepared kenaf-based CQD’s physicochemical properties by varying hydrothermal conditions. The evaluation of their quantity yield and photocatalytic degradation performance of CQDs were also explored in detail.

2. Materials and Methods

2.1. Materials

All the reagents and solutions were of analytical grade and used without further purification. Hydrochloric acid (purity of 37%) and NaOH (purity of 98.0%, pellets) as pH adjusters were purchased from Sigma-Aldrich (Selangor, Malaysia) and Merck (Selangor, Malaysia) companies, respectively. Methylene blue from Honeywell Fluka (Kuala Lumpur, Malaysia) was employed as a water pollutant to evaluate the photocatalytic ability of kenaf-based CQDs. The deionized water was used in preparing all required aqueous solutions during the experiments.

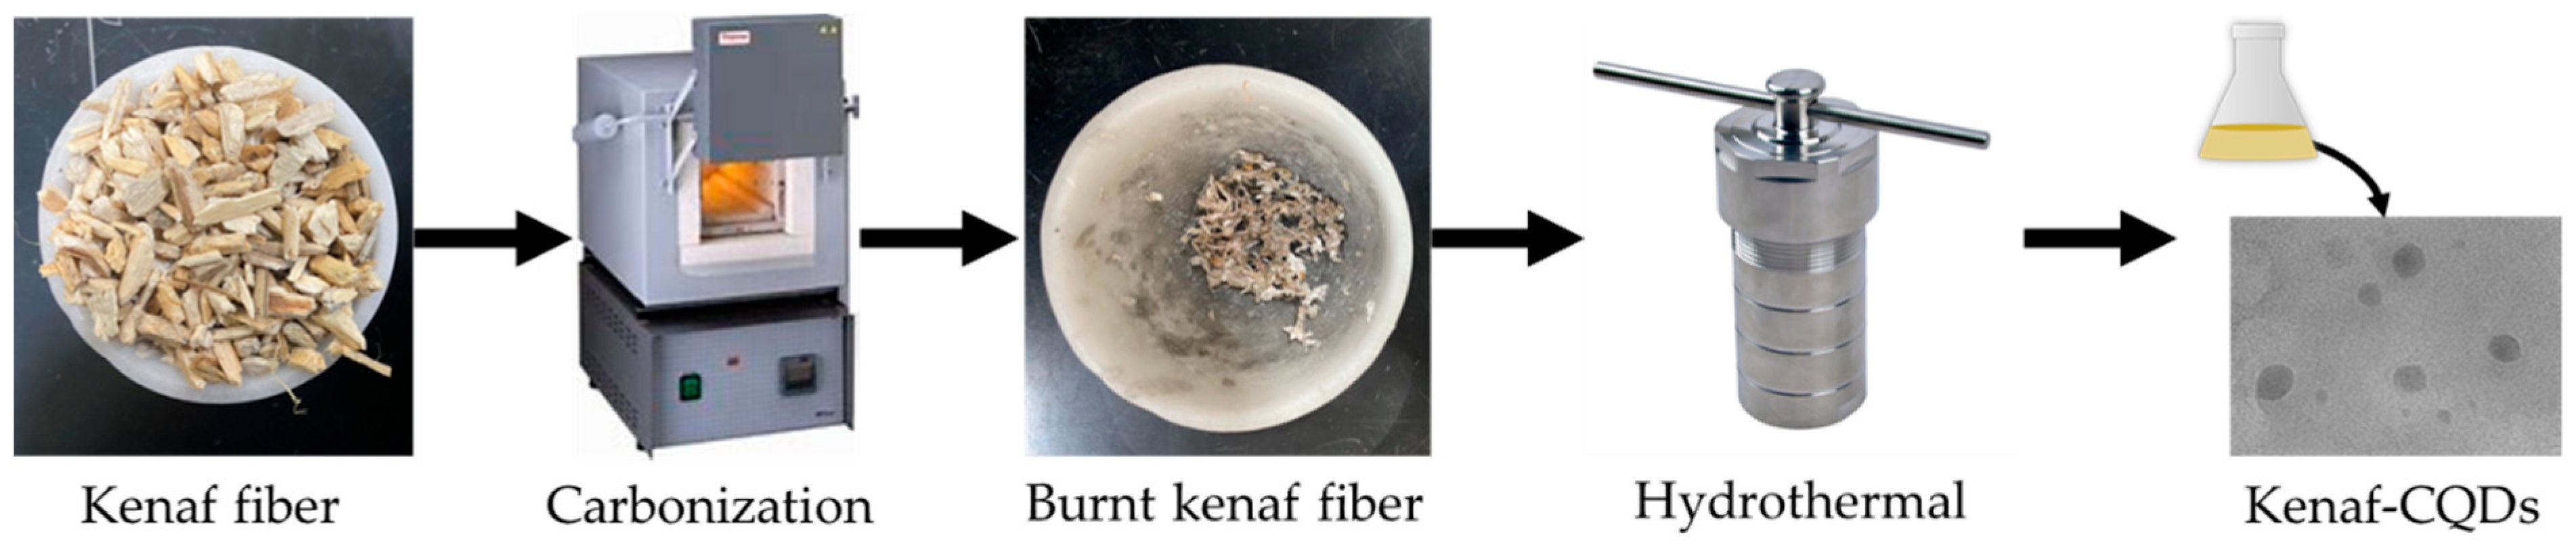
2.2. Synthesis of Kenaf-Based CQDs

The carbon quantum dots (CQDs) were synthesized from kenaf fiber via hydrothermal treatment and the synthesis process is shown in Figure 1 [17]. Initially, 5 g of kenaf fiber was placed in an alumina crucible and heated at 600 °C for 3 h at an air heating rate of 10 °C/min. Then, 40 mL of deionized water was added with 0.5 g of the crushed burnt kenaf fiber into a stainless-steel autoclave for the hydrothermal process under 190 °C for 24 h. The yellowish solution CQDs were collected through centrifugation and kept inside a vial. Meanwhile, the yellow precipitate was rewashed several times using deionized water and let dry overnight at 60 °C. The obtained CQDs were labeled as Cx-y-z, where “x” “y” and “z” were denoted as temperature, precursor mass and time, respectively (as shown in Table 2).

2.3. Physicochemical Characterization

The physicochemical properties of the as-prepared CQDs were investigated via several characterization techniques. The Perkin Elmer IR spectrophotometer (FTIR-Frontier, Salt Lake, OH, USA) was used to obtain Fourier transform infrared (FTIR) spectroscopy analysis from a wavenumber of 500–4000 cm−1. The particle size distributions of calcined samples were studied using a Hitachi TEM System (HT7830, RuliTEM, Japan). The average particle size was analyzed using Image J software based on at least 10–50 nanoparticles. Then, using an excitation wavelength of 350 nm, the photoluminescence (PL) of the prepared samples was confirmed using an Edinburgh Instrument (FLS920, Livingston, UK) photoluminescence spectrophotometer. Agilent’s Cary Series UV–Vis spectrophotometer was used to analyze the CQDs’ UV–Vis spectrum (UV-1800, Shimadzu, Tokyo, Japan) in the 280–600 nm range.

2.4. Quantum Yield Calculation

The quantum yield (QY) of Si-CQD samples was calculated using the following Equation (1) [22].
Q Y S = Q Y R ( I S I R ) ( O D R O D S ) ( η S 2 η R 2 )
where I is the photoluminescence area, OD is the absorbance value, and is the solvent’s refractive index. The subscripts “S” and “R” stand for sample (CQDs) and reference (quinine sulfate), respectively. 0.1 M H2SO4 contains quinine sulphate, which has a QY of 0.54 and an excitation wavelength of 350 nm.

2.5. Photocatalytic Degradation Setup

The photocatalytic degradation experiments were carried out in a photoreactor with a magnetic stirrer. A 100 mL beaker was covered with an aluminium foil sheet to avoid the release of radiation. The suspension was exposed to encourage visible light irradiation and will be placed 15 cm away from the photoreactor. All photocatalytic degradation studies of synthetic MB were performed at room temperature (30 ± 1.0 °C) and pH 7. In a typical method using standard parameters, 15 mL of CQD was dispersed in a 50 mL aqueous solution of 50 ppm MB. The suspension was stirred in the dark for 30 min to ensure an equilibrium adsorption–desorption state [23]. Afterwards, the solution temperature was maintained using cooling fans and irradiated under continuous stirring (150 rpm) using a 500 W halogen lamp. Every 30 min, 0.1 mL of an aliquot of the solution was removed using a micropipette and examined at 664 nm with a UV–Vis spectrophotometer (UV-1800, Shimadzu). The MB degradation efficiency (%) was estimated through the following Equation (2):
M B   d e g r a d a t i o n   e f f i c i e n c y = C o C t C o × 100
where C o and C t represents to initial and at specific time concentrations of MB, respectively.

2.6. Reaction Kinetics Analysis

In this work, the pseudo-first order (PFO) and pseudo-second order (PSO) models were used to fit with the experimental data. The photocatalytic degradation kinetics of pollutants explained by PFO and PSO are represented by the Equations (3) and (4), respectively in linear form as [24]:
ln ( C t C o ) = K 1 · t
1 C t 1 C o = K 2 · t
where t (min) and k are the degradation rate constant of the kinetic model (min−1). Values of K 1 can be calculated from the slope of the linear plots respectively of the plots of ln ( C t / C 0 ) versus t . While K 2 can be calculated from the slope of the linear plots respectively of the plots of 1 C t 1 C 0 versus t .

3. Results and Discussion

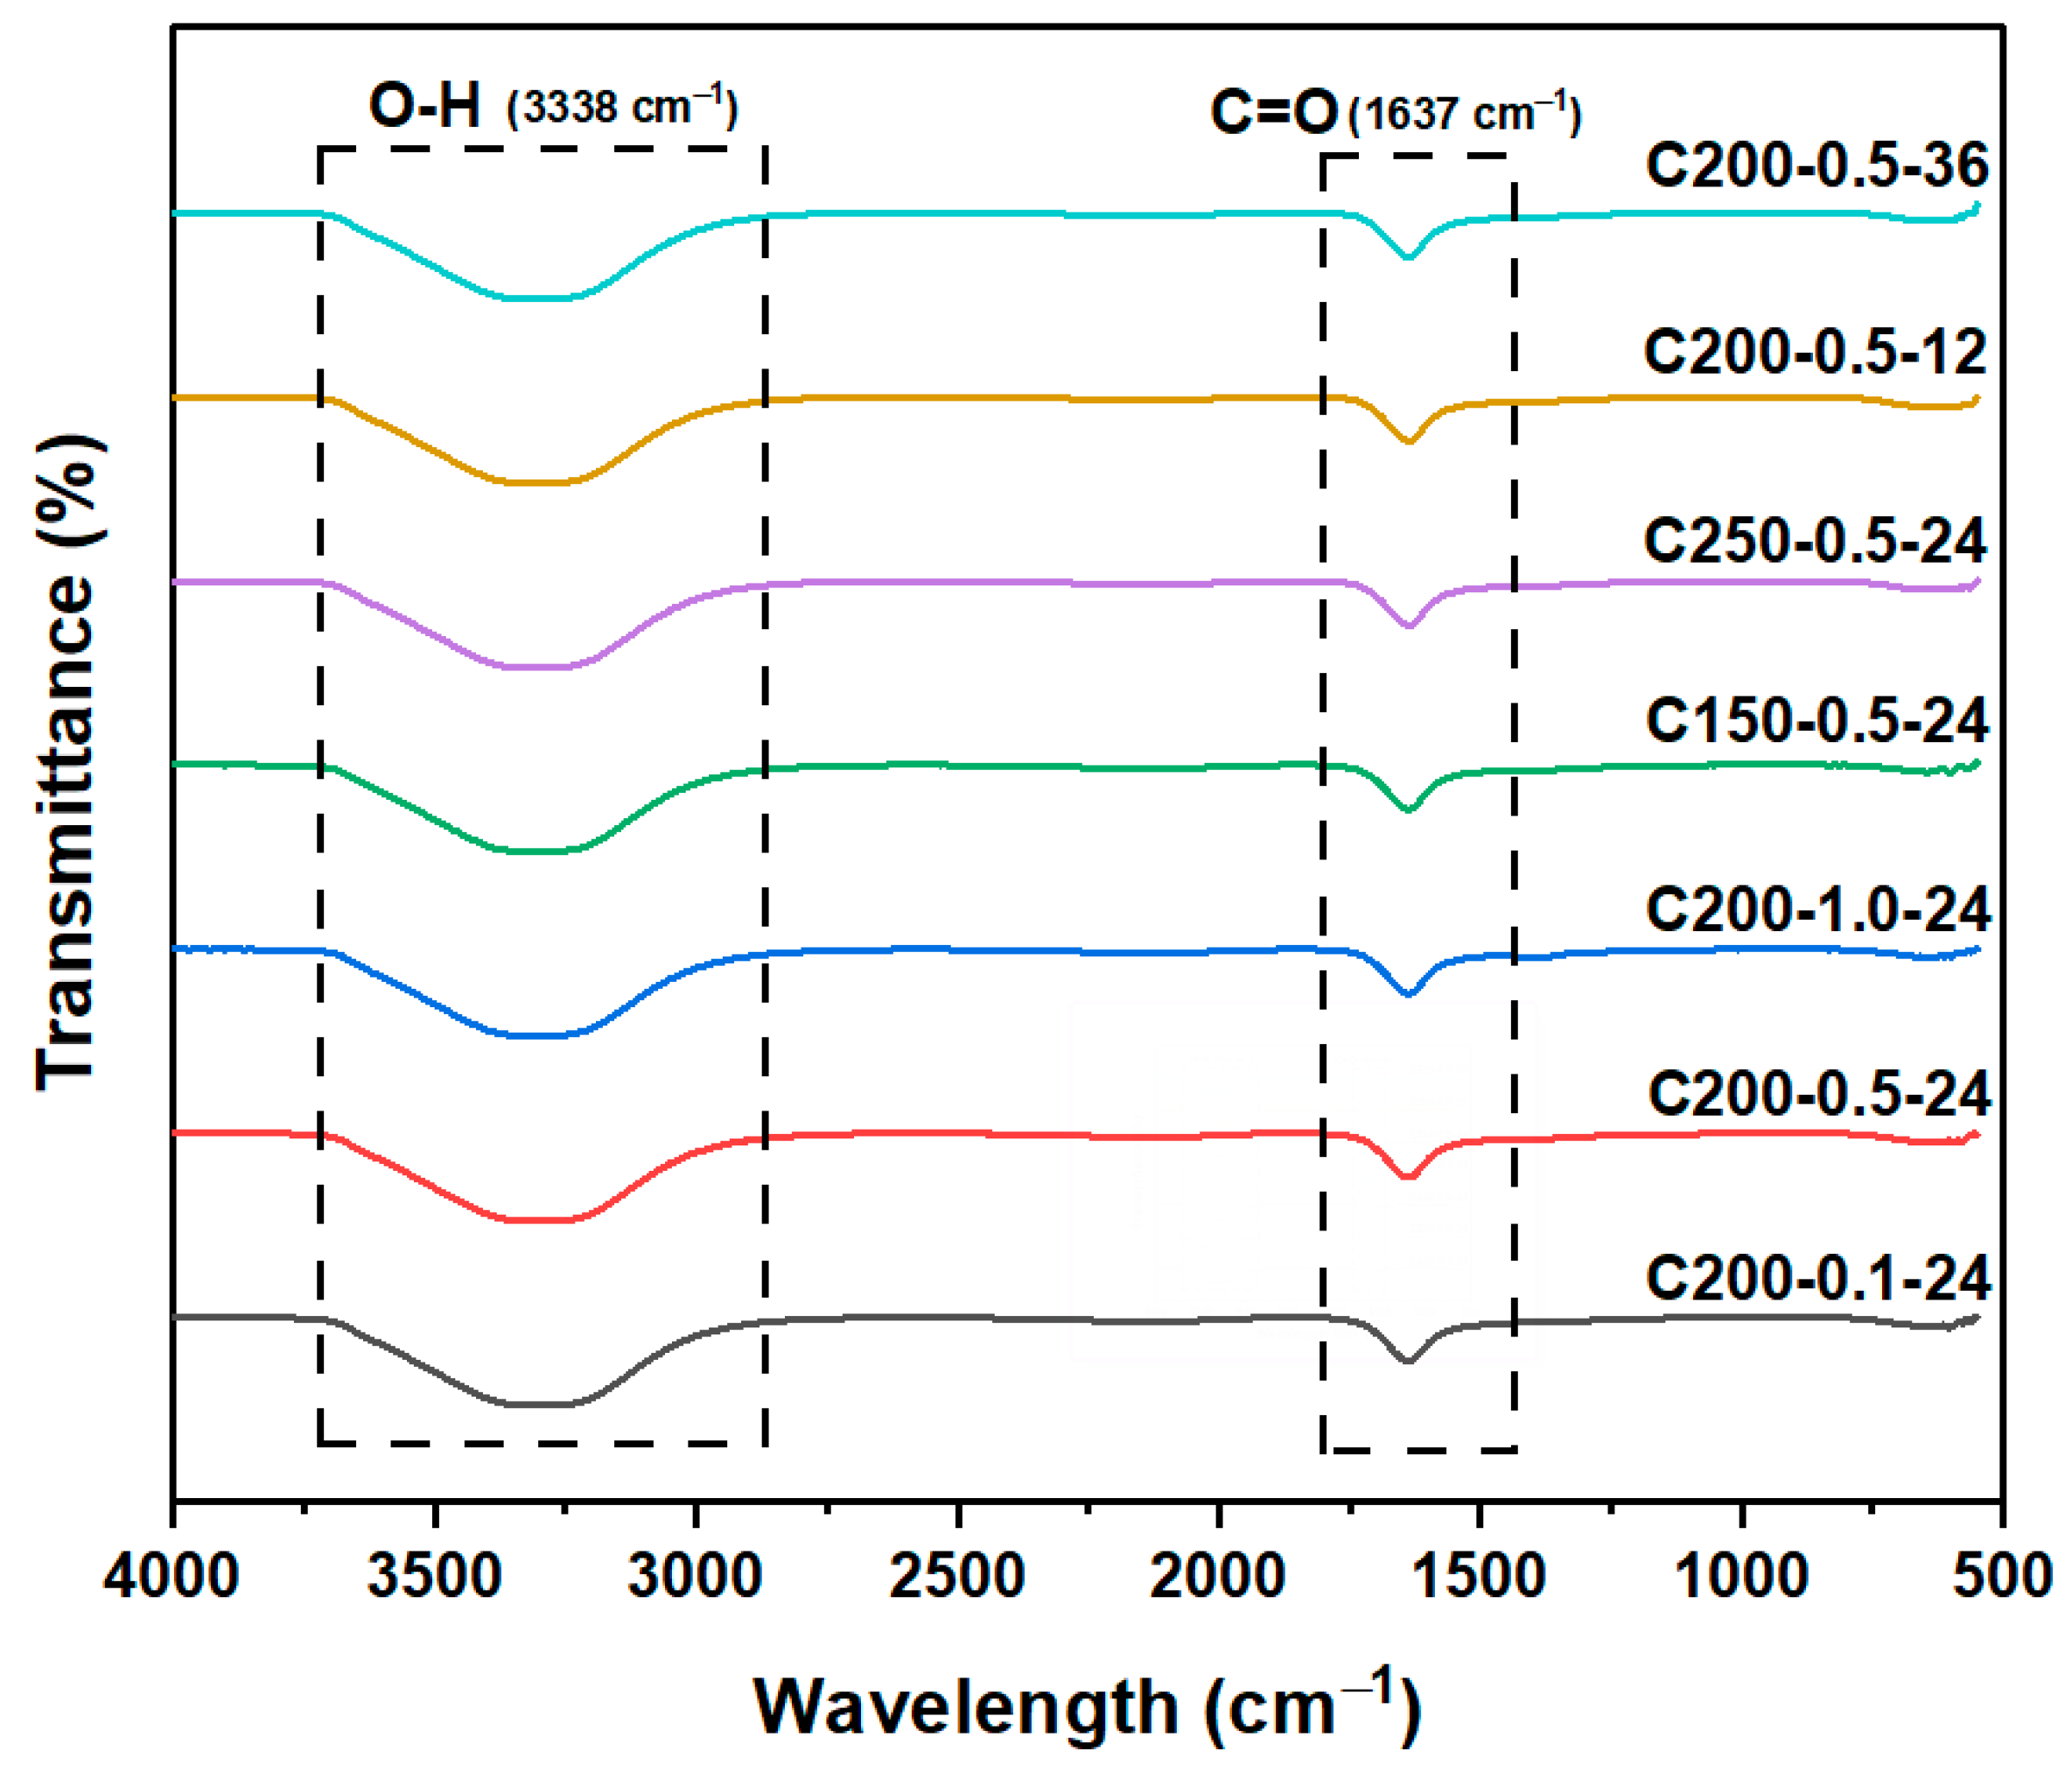
3.1. Chemical Stability Analysis

Figure 2 shows an FTIR spectra that was implemented to determine different additional groups when the CQDs were functionalized with various hydrothermal conditions. The broad band at around 3338 cm−1 corresponds to the O–H group in all samples synthesized by hydrothermal reaction [25]. The observable peak at 1637 cm−1 indicates the presence of stretching vibrations of the C=O functional group [26]. This demonstrates that during the hydrothermal process, the kenaf fibre was destroyed, resulting in the carbon material with aromatic structures rich in surface functional groups, such as hydroxyl and carbonyl groups. O–H groups on the photocatalyst surface are advantageous for photocatalytic activity because they result in the production of the hydroxyl radical (•OH) following charge separation. This degradation of organic pollutants depends heavily on these free radicals.

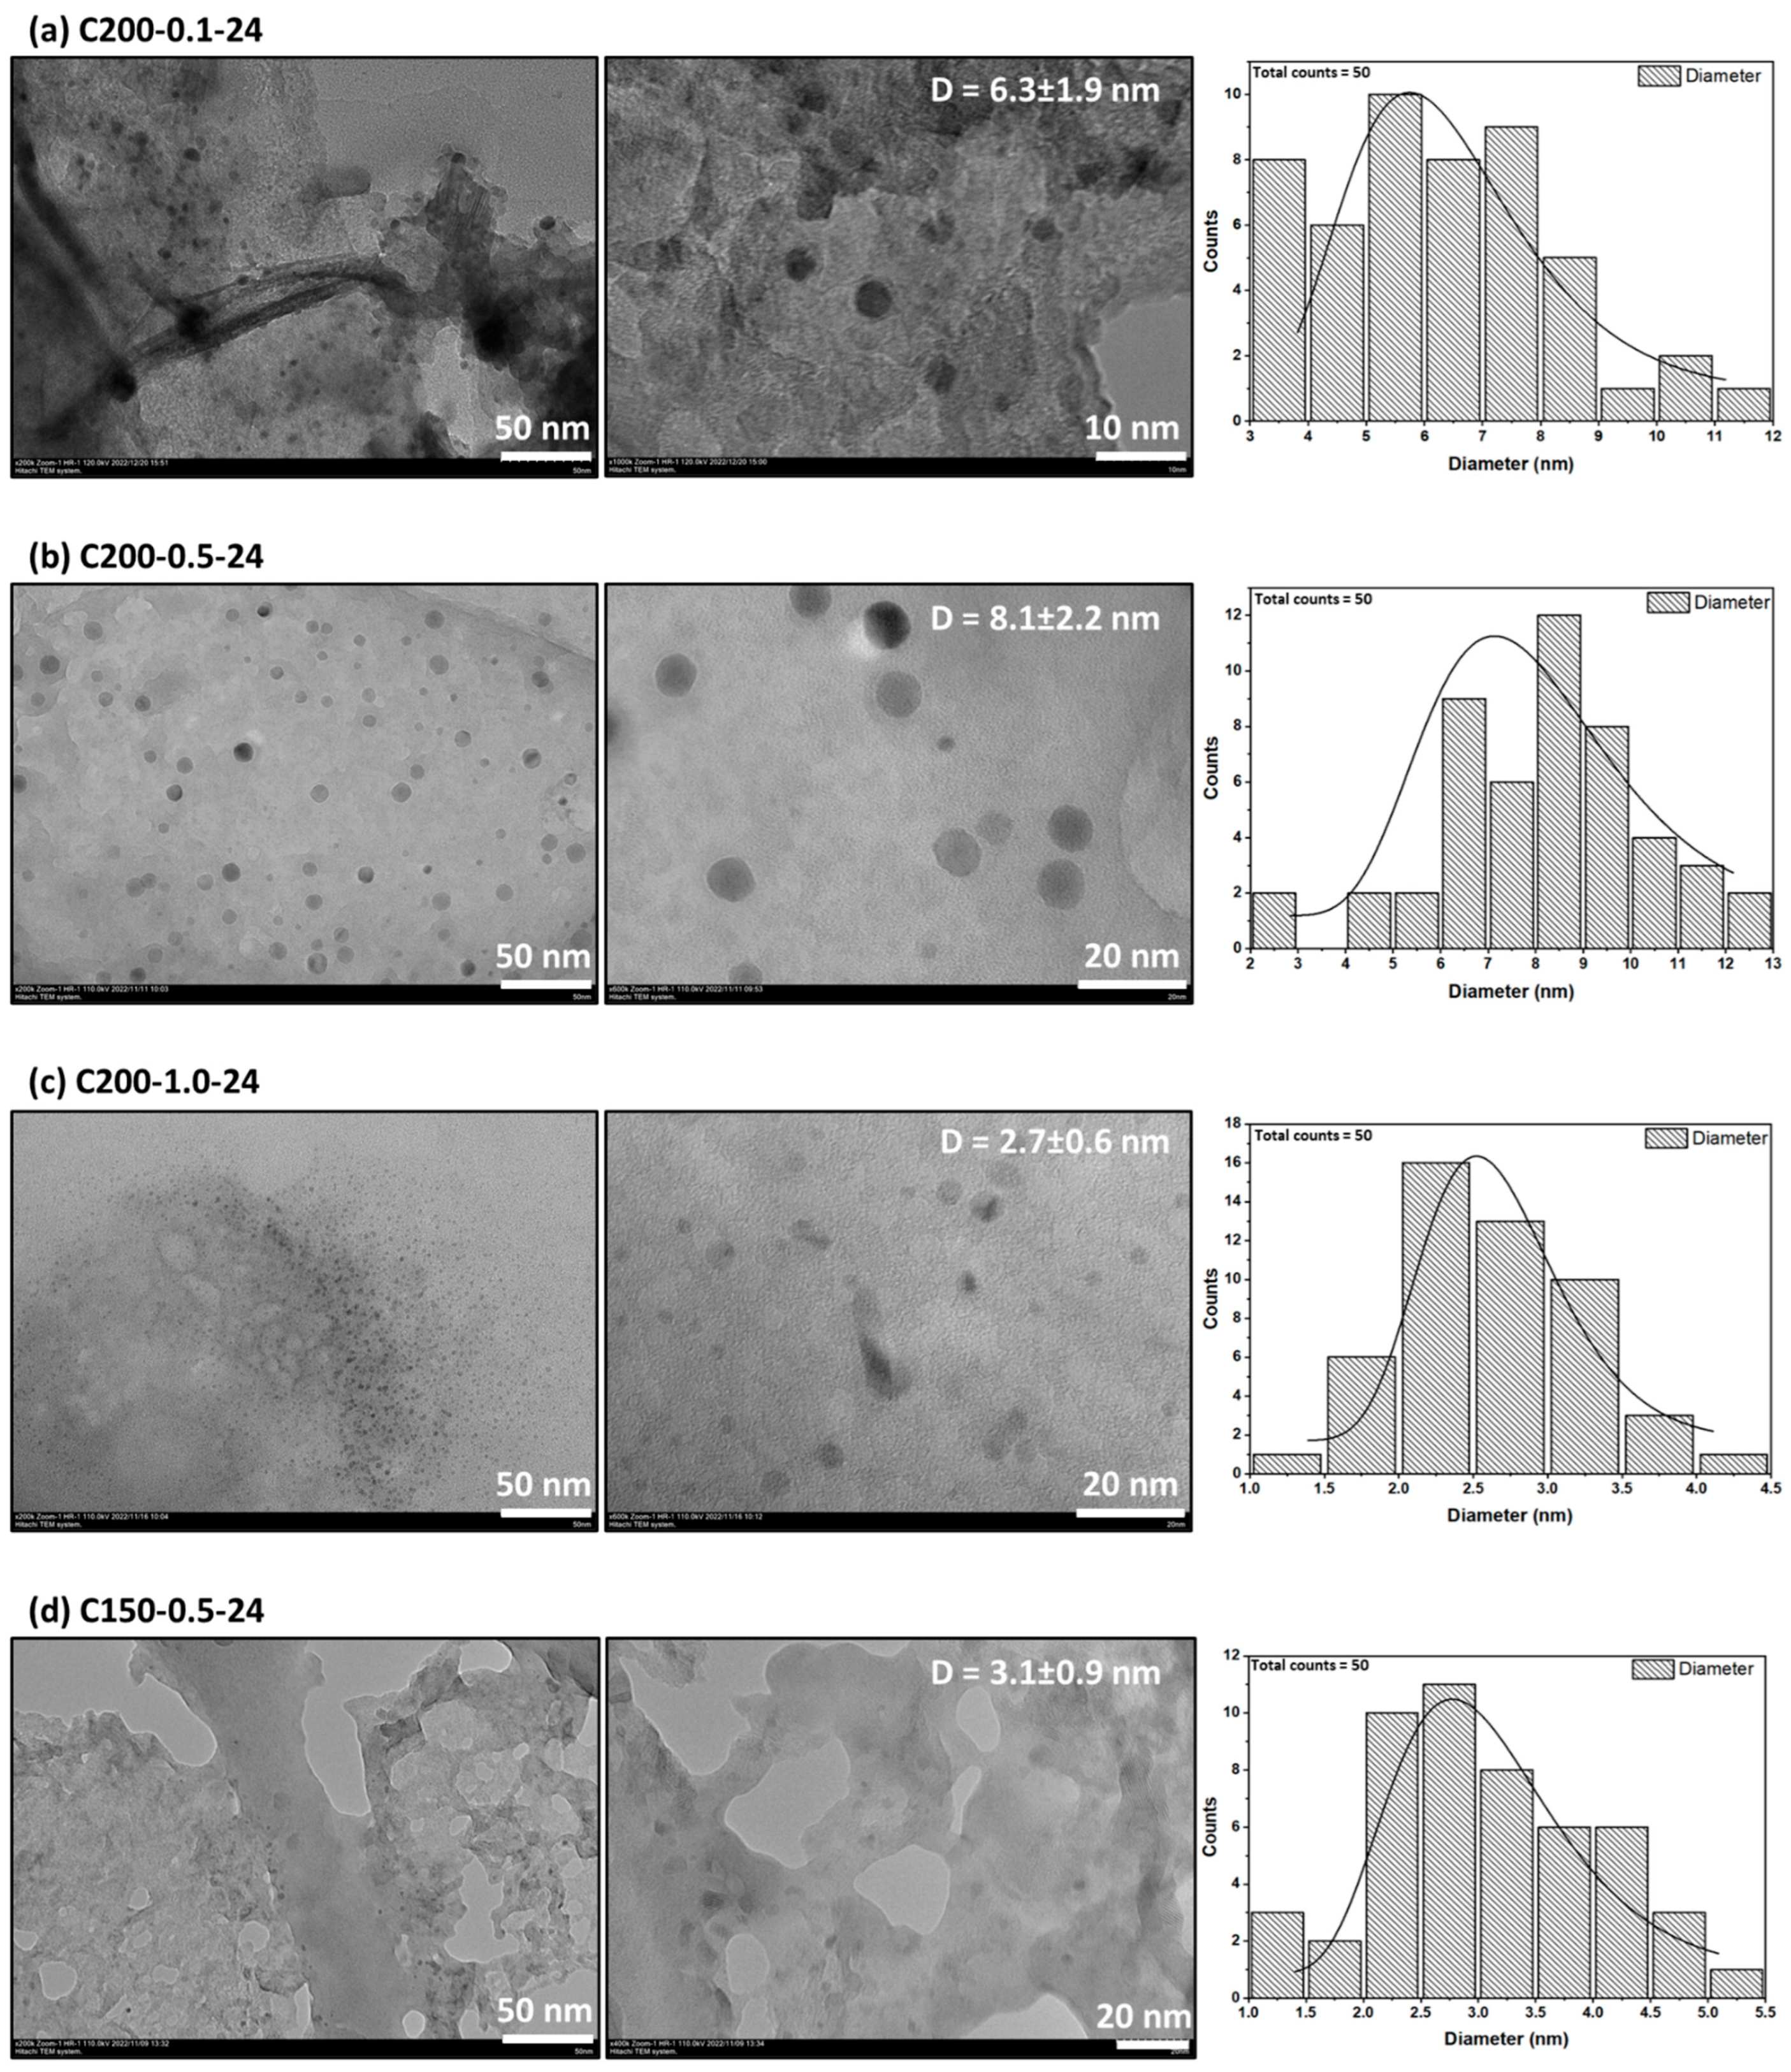
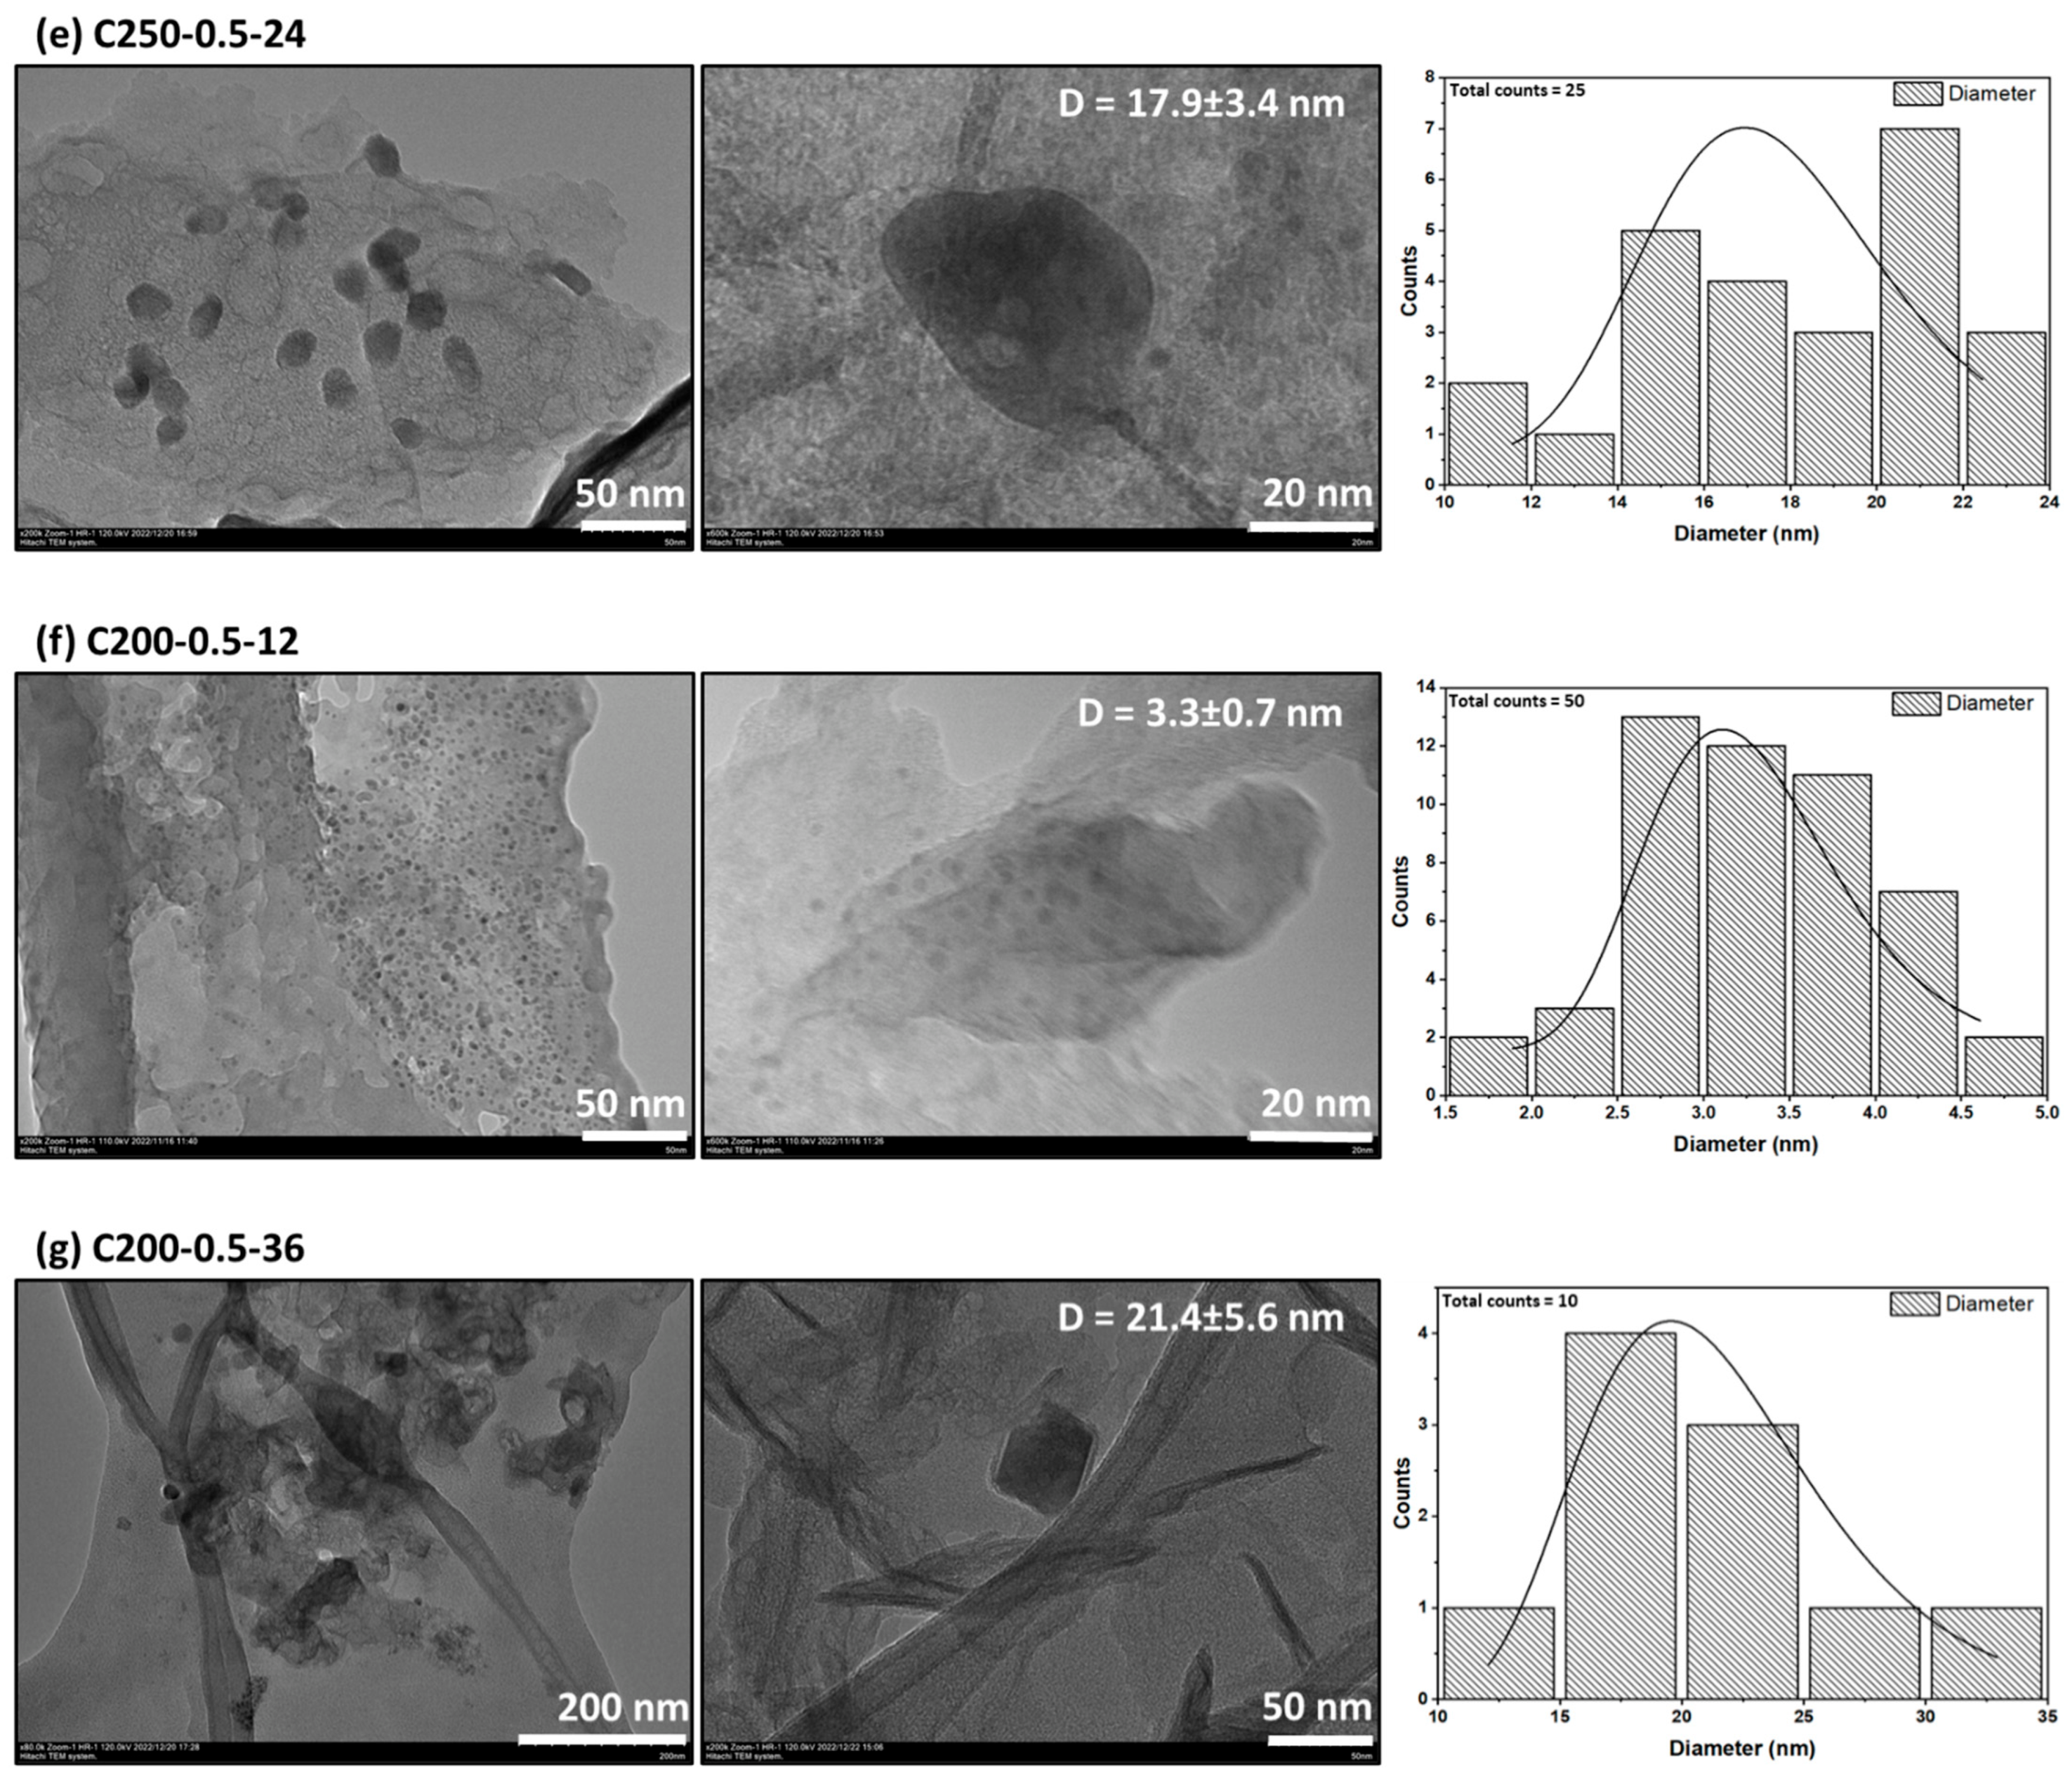
3.2. Morphological Properties

The morphology of the prepared CQDs in various hydrothermal conditions was investigated using a Hitachi TEM System (HT7830, RuliTEM, Japan), as shown in Figure 3a–g. The images reveal that the formed carbon nanoparticles have a spherical shape. These CQDs have a broad size distribution with mean size in the range from 2.7 ± 0.6 nm to 21.4 ± 5.6 nm, indicating that the hydrothermal parameters significantly affect the CQDs particle size formed. C200-0.5-24 (Figure 3b) has a diameter of 8.1 ± 2.2 nm at the optimal precursor mass during the hydrothermal treatment. It can be seen from Figure 3a,c the diameter of nanoparticles was reduced to 6.3 ± 1.9 nm and 2.7 ± 0.6 nm (C200-0.1-24 and C200-1.0-24, respectively) at lower and higher than the optimal precursor mass (0.1 g < 0.5 g > 1.0 g). Therefore, precursor mass restraint the size and the distribution of CQD nanoparticles formed. The C200-0.5-24 showed a clearly defined and well-distributed CQD nanoparticle size compared to C200-0.1-24 and C200-1.0-24 which the CQDs were smaller and agglomerates. Furthermore, the intense attraction between the nanoparticles caused by the CQDs’ high surface energy may also have contributed to the aggregation [16]. Hence, it causes a reduction in the interfacial area of nanoparticles and lowers the possibility of improving the interphase properties of photocatalytic degradation [27].
The effect of hydrothermal temperature and time conditions on kenaf-based CQDs samples are shown in Figure 3b,d,e and Figure 3b,f,g in ascending order (150 °C, 200 °C, 250 °C and 12 h, 24 h, 36 h, respectively). The CQDs nanoparticle size trend for both factors tends to form large spherical morphology dots as the hydrothermal temperature and time increase. The alteration of the diameter was increased from 3.1 ± 0.9 nm to 17.9 ± 3.4 nm and 3.3 ± 0.7 nm to 21.4 ± 5.6 nm for temperature and time, respectively. In addition, as shown in the histogram of particle size distribution, at higher temperatures (C250-0.5-24) and time (C200-0.5-36), the total counts were decreased as the CQDs were denatured. This proves that hydrothermal temperature and time (duration) control kenaf fibre’s carbonization rate. The rationale is that high temperature is more likely to cause severe carbonization and particle growth which are detrimental to fluorescence [28]. Yet again, the ideal temperature and time during the hydrothermal treatment is 200 °C and 24 h, respectively, denoted as C200-0.5-24.

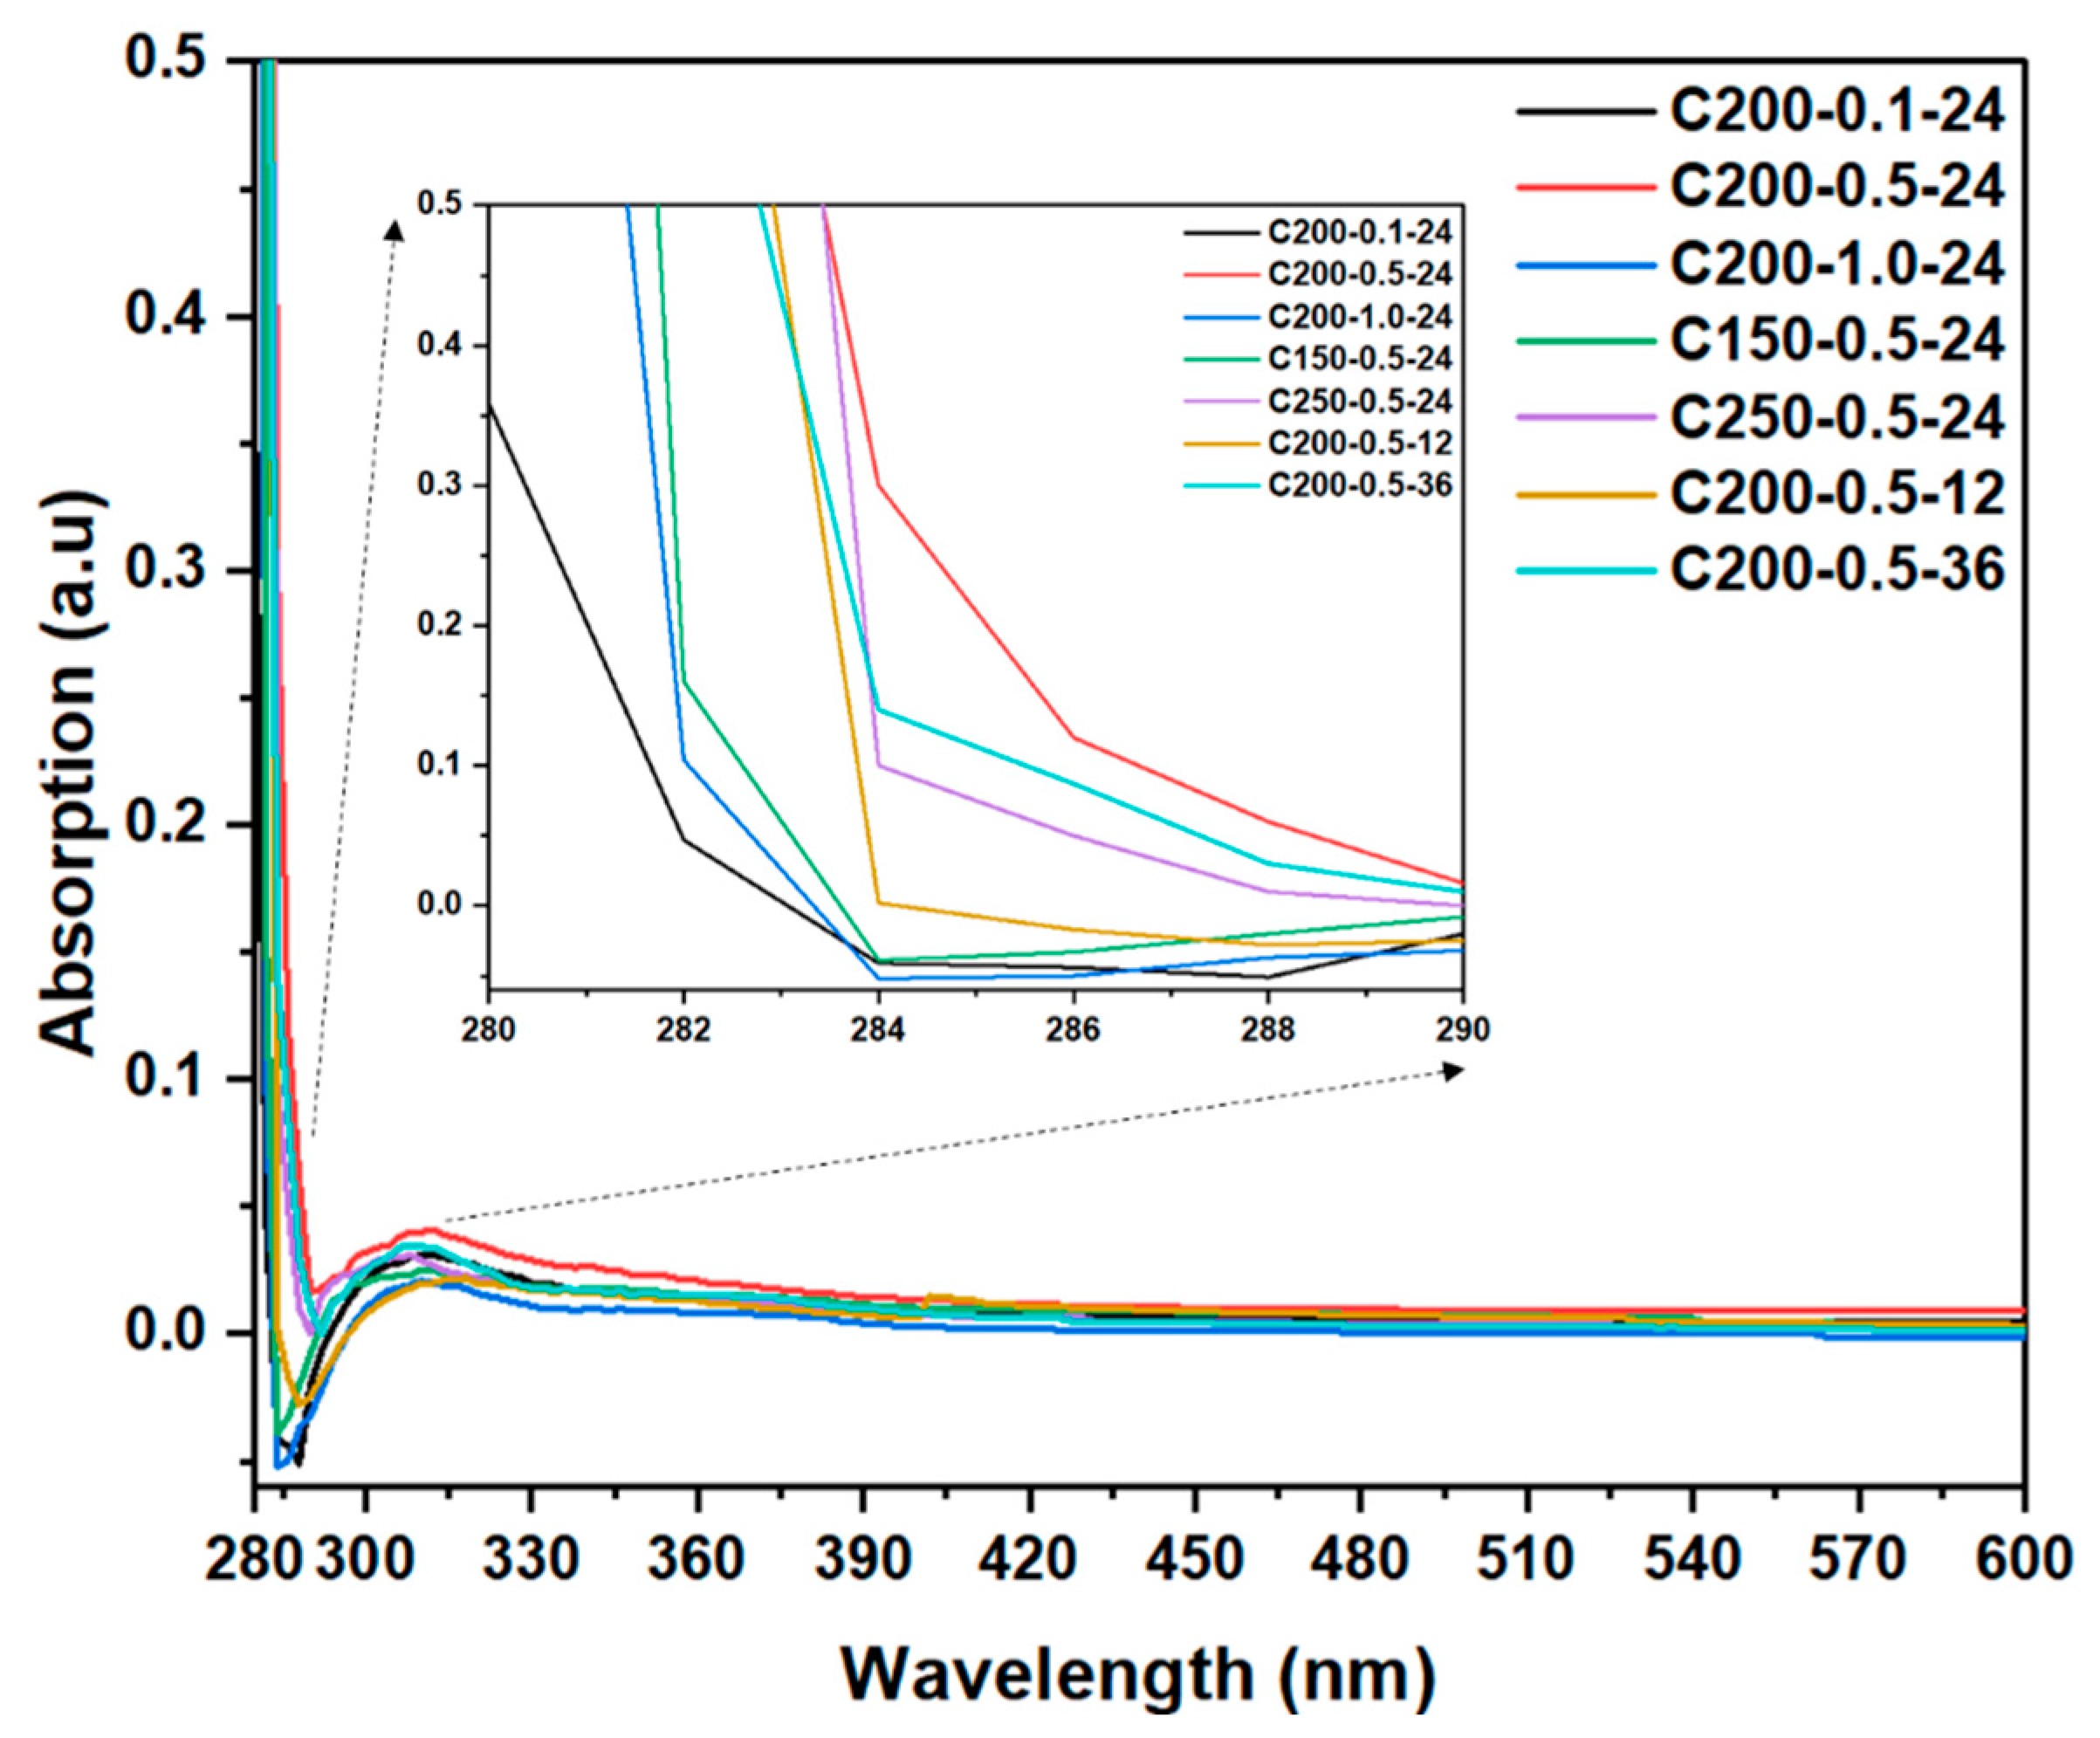
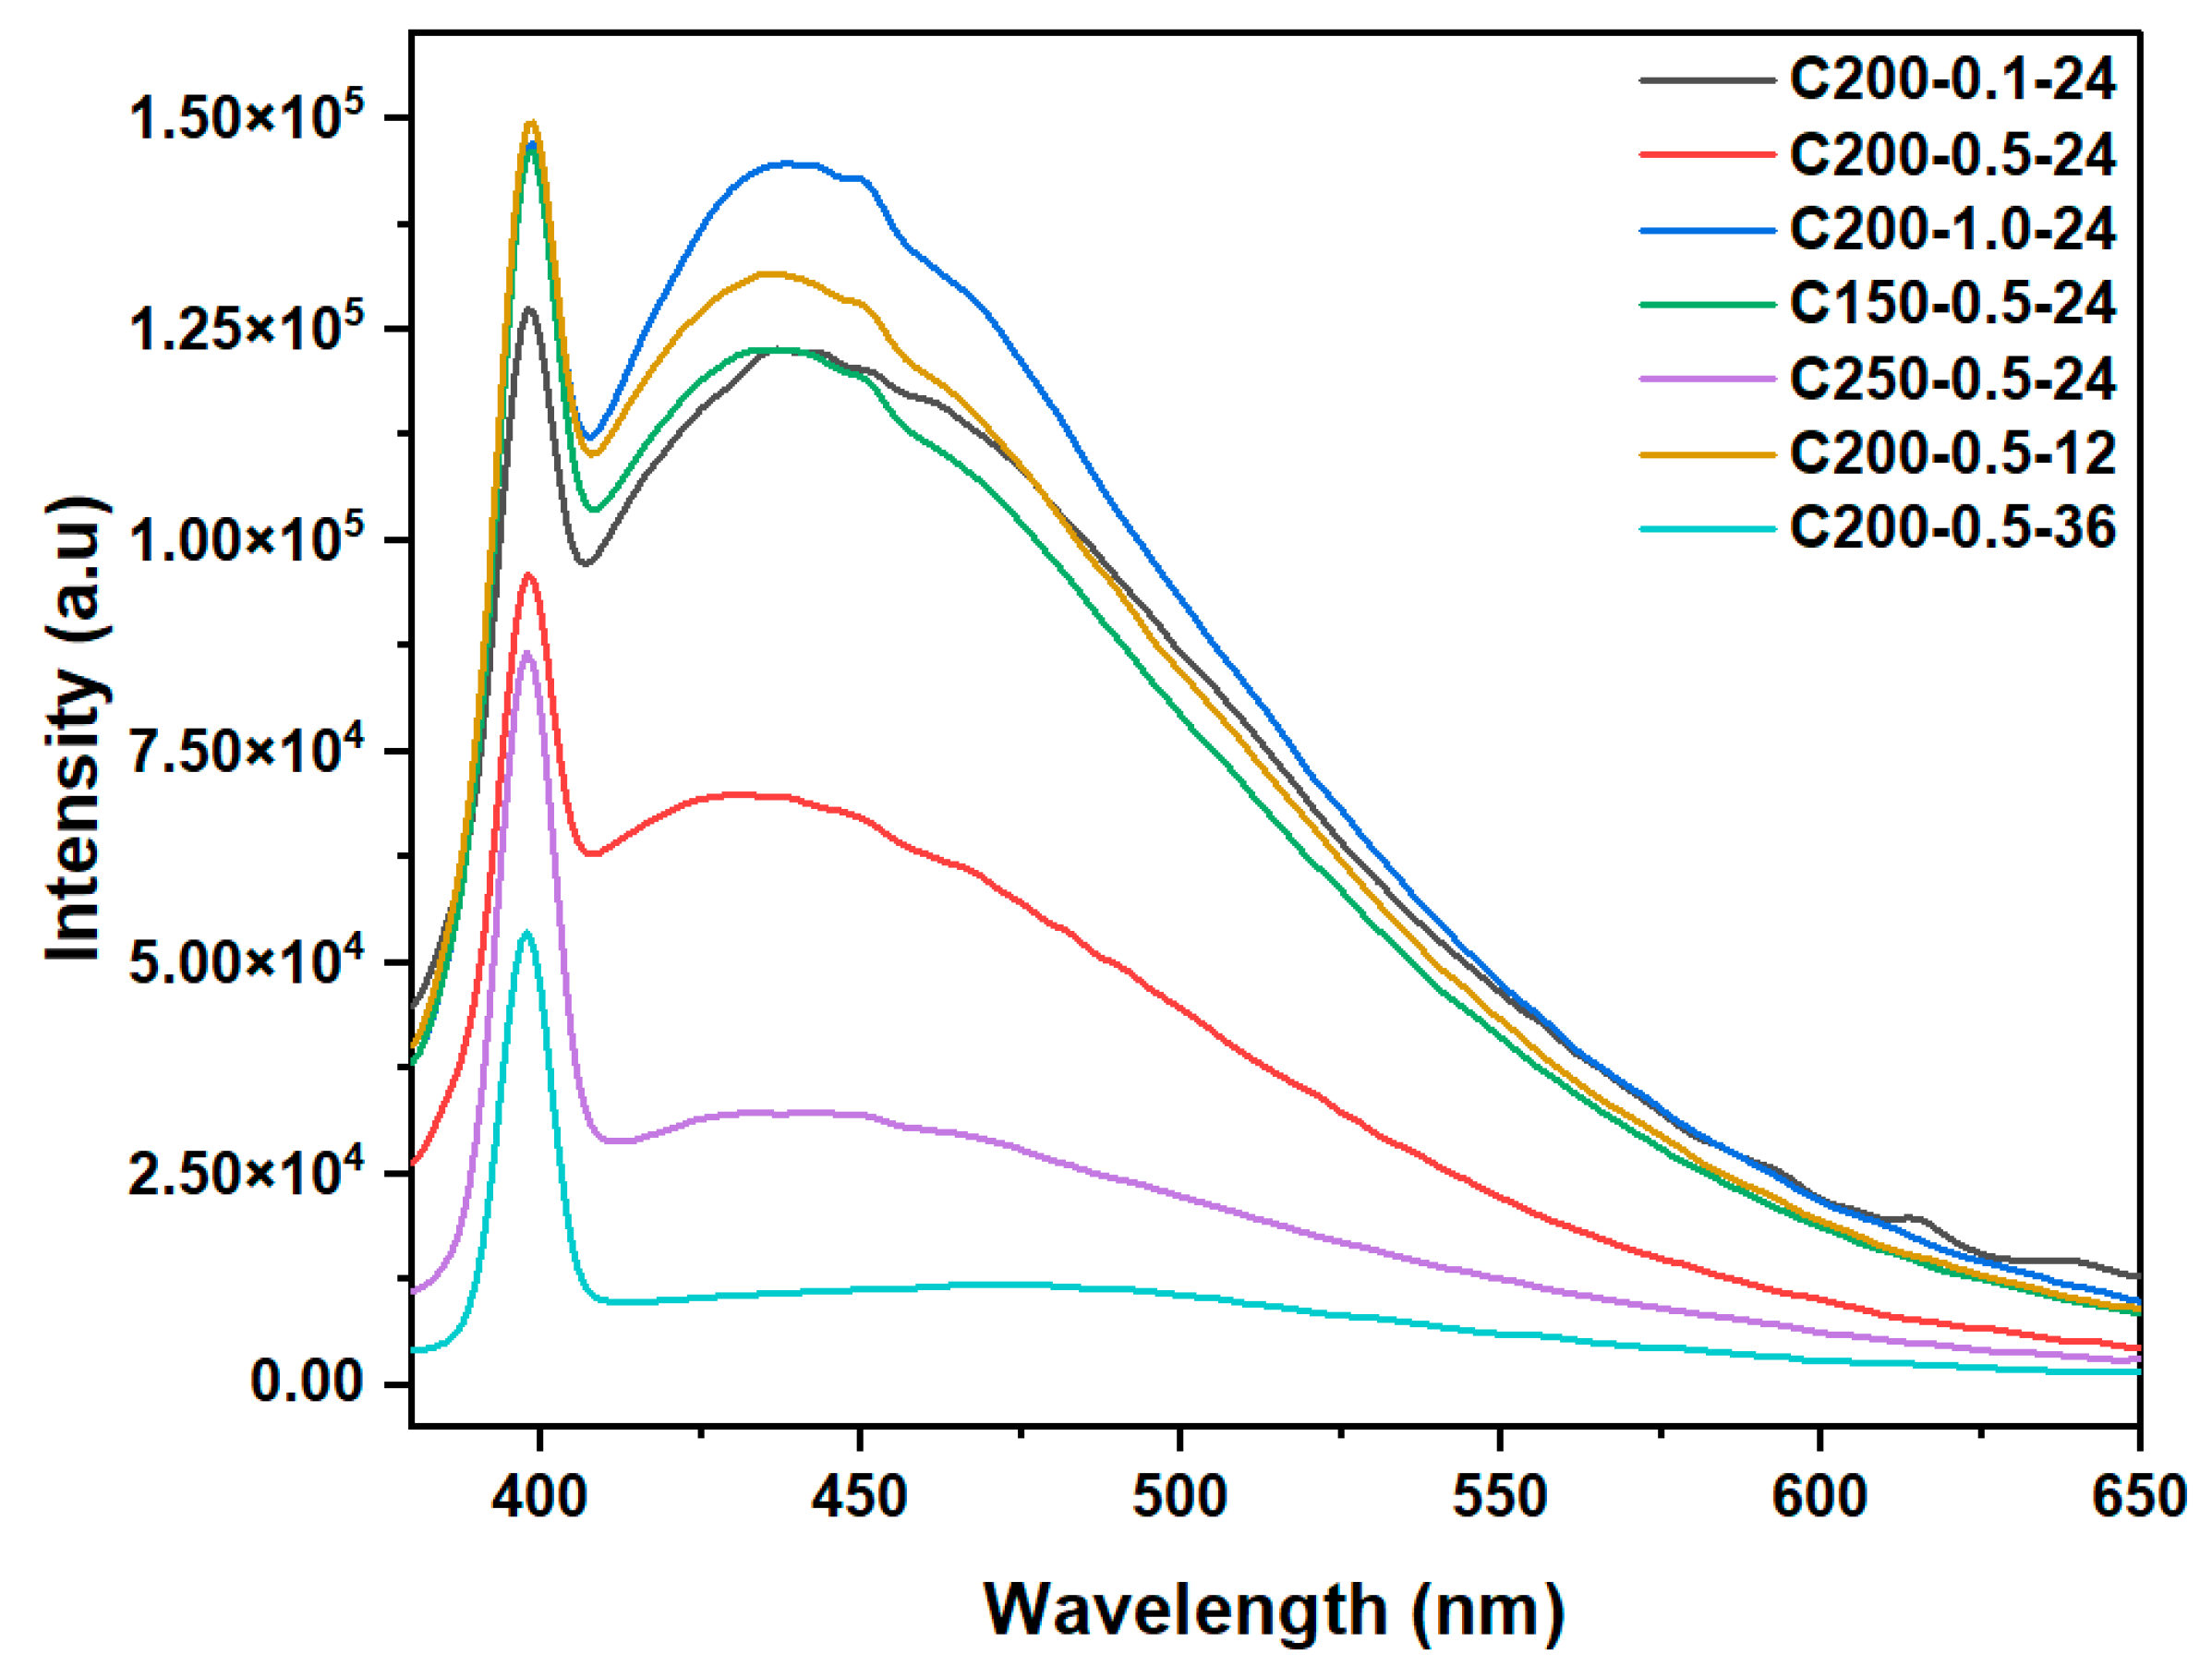
3.3. Optical Properties

Figure 4 shows UV–Vis spectra for various hydrothermal conditions with a shoulder absorption band of 280–330 nm. Meanwhile, the inset figure shows the x-axis focus range at 280–290 nm wavelength. The absorption band is associated with the C=O bonding n→π* electron transition [22]. As the agglomeration of CQDs nanoparticles increased, the band shifted towards the x-axis. This demonstrates that agglomeration significantly influences the intensity of light absorption and may also affect UV absorption and the photocatalytic activity of CQDs [29]. Furthermore, the wavelength shift was caused by agglomeration, which is not favourable to fluorescence properties [27].
Meanwhile, Figure 5 illustrates the photoluminescence (PL) spectra of all the CQDs samples n the wavelength of 380–650 nm. Unlike typical PL spectra CQDs reported, kenaf-based CQDs displayed a multi-peak emission feature at ~400 and ~450 nm. The emission peak at ~400 nm is attributed to the fluorescence of the carbon nucleus [30] and the emission peak at ~450 nm is attributed to the flourescence caused by the nano-interparticles distances due to the CQDs agglomeration [31]. The narrow PL emission area with the emission band centered at ~400 nm validates the narrow size distribution of CQDs because of similar quantum effects and emission traps on the carbon surface, which matches well with the results of the HRTEM histogram [32]. The decreased intensity of PL spectra at this wavelength followed the order of size distribution (std. dev.) of CQDs from small to large. This band might be due to radiative, structural, and surface defects assigned to n→π* transitions of CQDs carbon nucleus [33].
A drop in the luminous intensity of CQD nanocomposites and an increase in the band broadening at ~450 nm wavelength may be attributed to the quantum confinement effect due to the degree of agglomeration reduced and addition of large-sized CQDs. The positions of the CQDs’ PL spectra would be affected by the nanoparticle sizes due to their enclosed sp2 domains [34]. Moreover, these dual emissive spectra are caused by the interaction of CQDs and solvent, which results in partial agglomeration. The over-carbonization resulting from the hydrothermal treatment’s higher temperature and prolonged duration caused CQDs to lose their fluorescence. Additionally, it was discovered that the PL excitation spectra of these CQDs were the same as their UV–Vis absorption spectra, proving that the correlation between their emissions and their absorption-relevant moieties should exist.

3.4. Quantum Yield

The synthesized CQDs’ quantum yields (QY) are found to be 41.51%, 14.87%, 76.12%, 35.12%, 12.22%, 45.24%, and 5.00% for C200-0.1-24, C200-0.5-24, C200-1.0-24, C150-0.5-24, C250-0.5-24, C200-0.5-12 and C200-0.5-36, respectively. Low QY, in this instance, might be connected to the non-fluorescence feature, agreeing with the trend of the PL spectra and the HRTEM data. As demonstrated in Table 3, the resulting quantum yield is discovered to be comparable to and significant than the values of other carbon precursors that have been reported. The C200-1.0-24 generated from kenaf fiber showed the maximum fluorescence quantum yield of 76.12% in this research of optimal hydrothermal conditions.

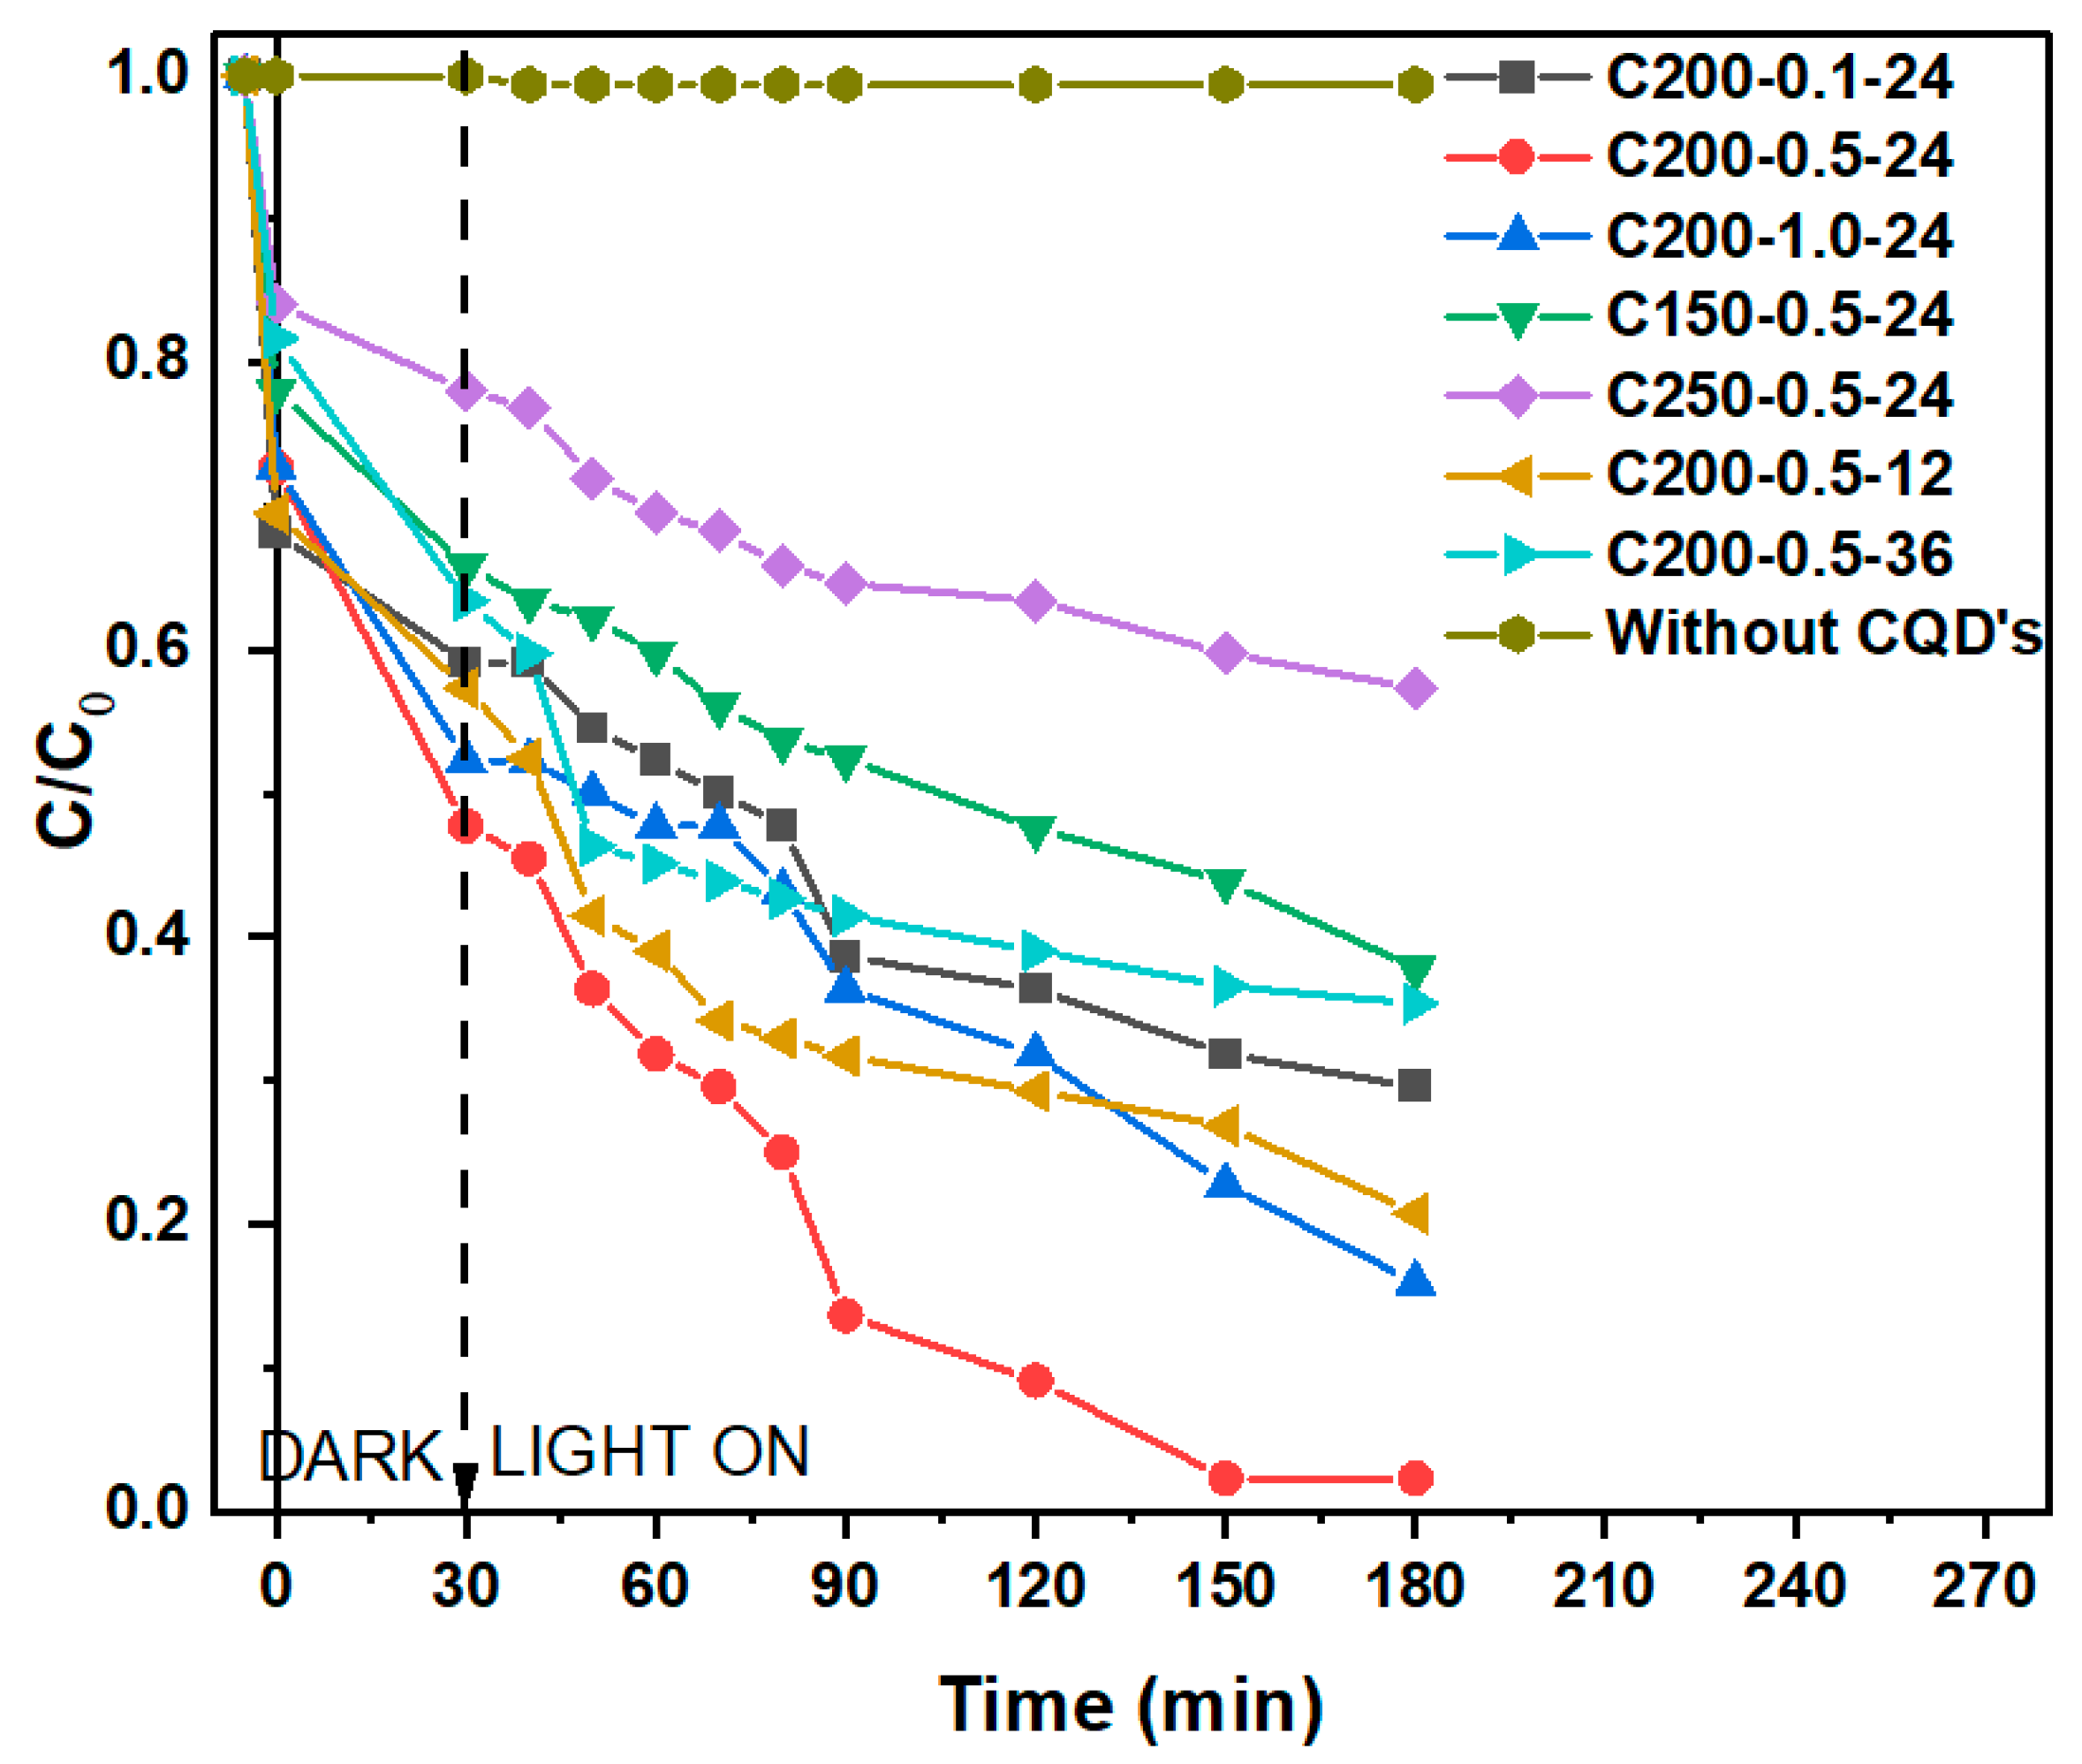
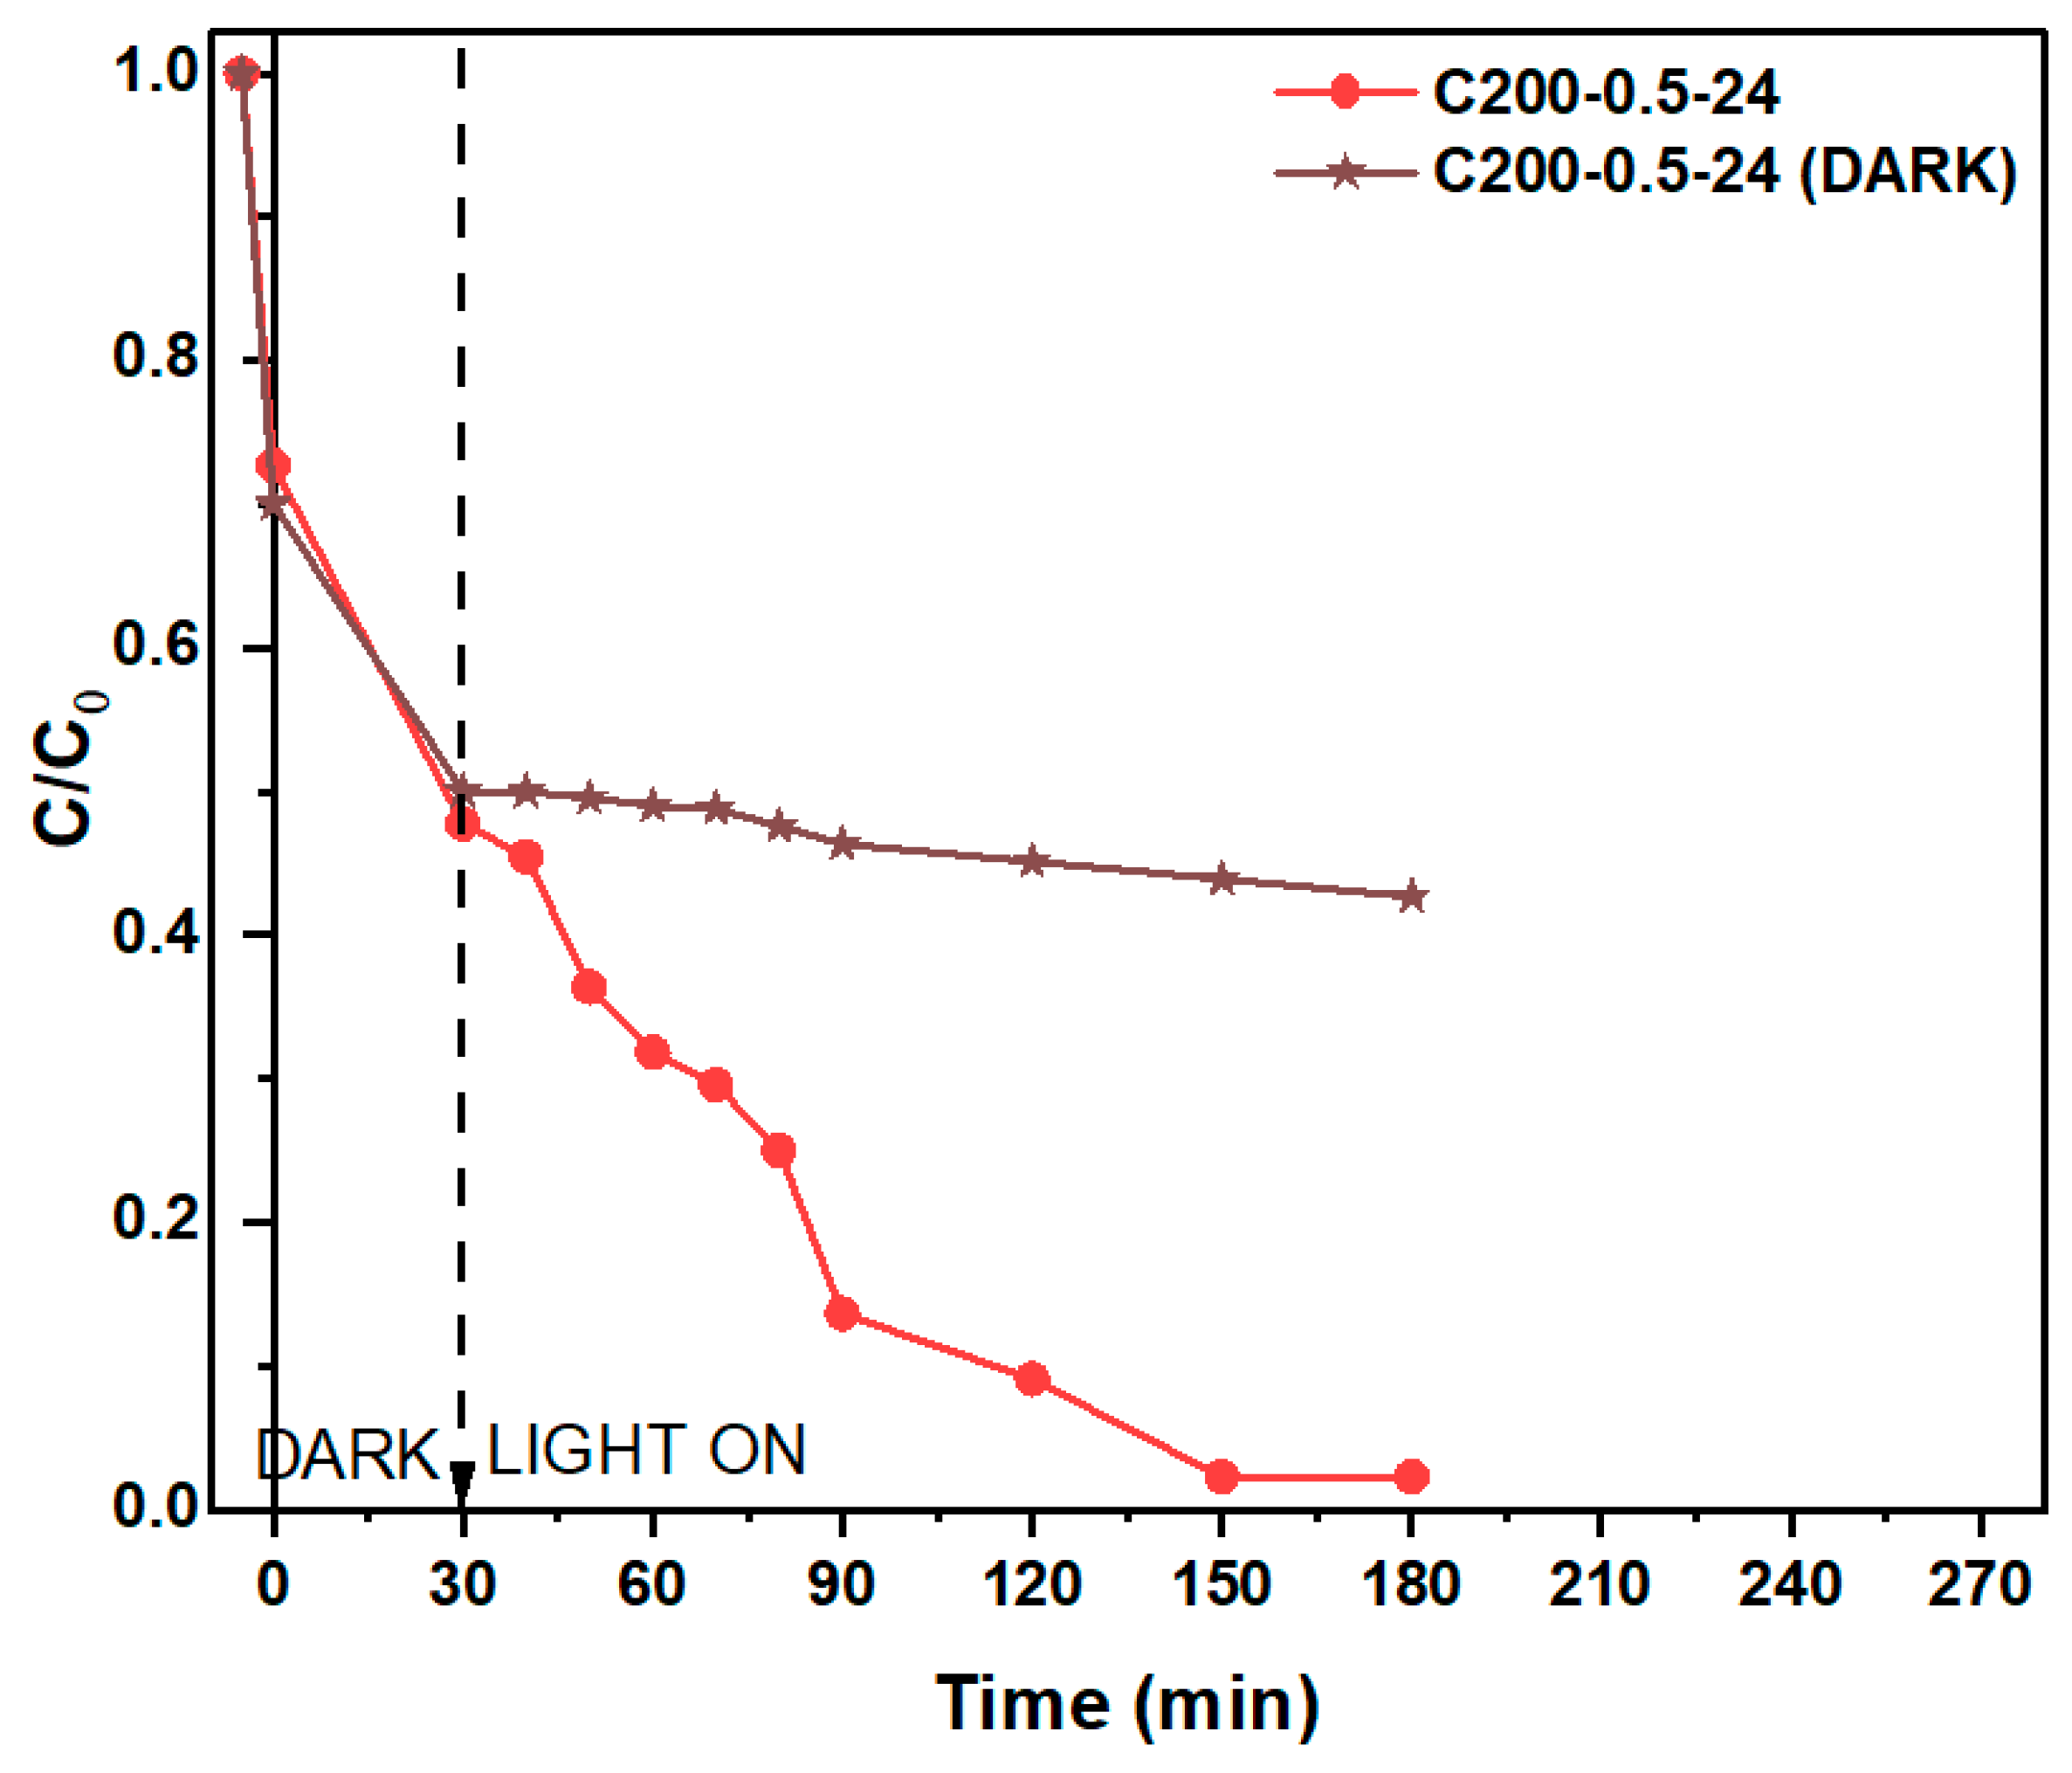
3.5. Photocatalytic Degradation Performance of CQDs

The efficiency of kenaf-based CQDs with various hydrothermal synthesis conditions was evaluated in batch setup containing MB solutions and the findings are presented in Figure 6. Decolorizing MB dye without CQDs is also conducted to confirm the performance of CQD samples. During the light off, the MB removal of all samples was 20–50%, indicating the adsorption process engaged in this study. Therefore, the first 30 min without light irradiation were to allow for adsorption rection. Based on the figure, C200-0.5-24 was the highest removal efficiency of MB from the solution. A significant difference between the sample can be observed in the time required to reduce the dye to the minimum level. The C200-0.5-24 shows the highest MB removal rate with 90% of MB being removed within 120 min.
Meanwhile, other CQDs achieved below 80% within the same timeframe given. In this work, the CQDs QY did not play an essential role in the photocatalytic degradation performance. As previously explained in detail in morphological structure examinations, clearly defined and well-dispersed CQDs were the most significant factor in photodegradation. Additionally, the CQDs’ surface imperfections and agglomerations, which are usually brought on by surface oxidation because of mild or severe hydrothermal conditions, may reduce contact area and negatively affect the efficiency of photocatalytic degradation. This is consistent with a similar observation made by Pellegrino et al., who believe that the aggregation of nanoparticles affects their optical characteristics and photocatalytic activity [29]. Figure 7 shows a comparison of the degradation of C200-0.5-24 (optimized CQD) under visible light irradiation and total dark. It shows that the CQD sample will undergo an adsorption reaction with minimal degradation in the total dark conditions. As observed, the adsorption capacity of the samples are identical in first 30 min; however, significant MB degradation was shown after introducing a visible light to the sample. Therefore, the CQD in the dark condition alone was not impactful compared to that under visible light irradiation after adsorption equilibrium [42].

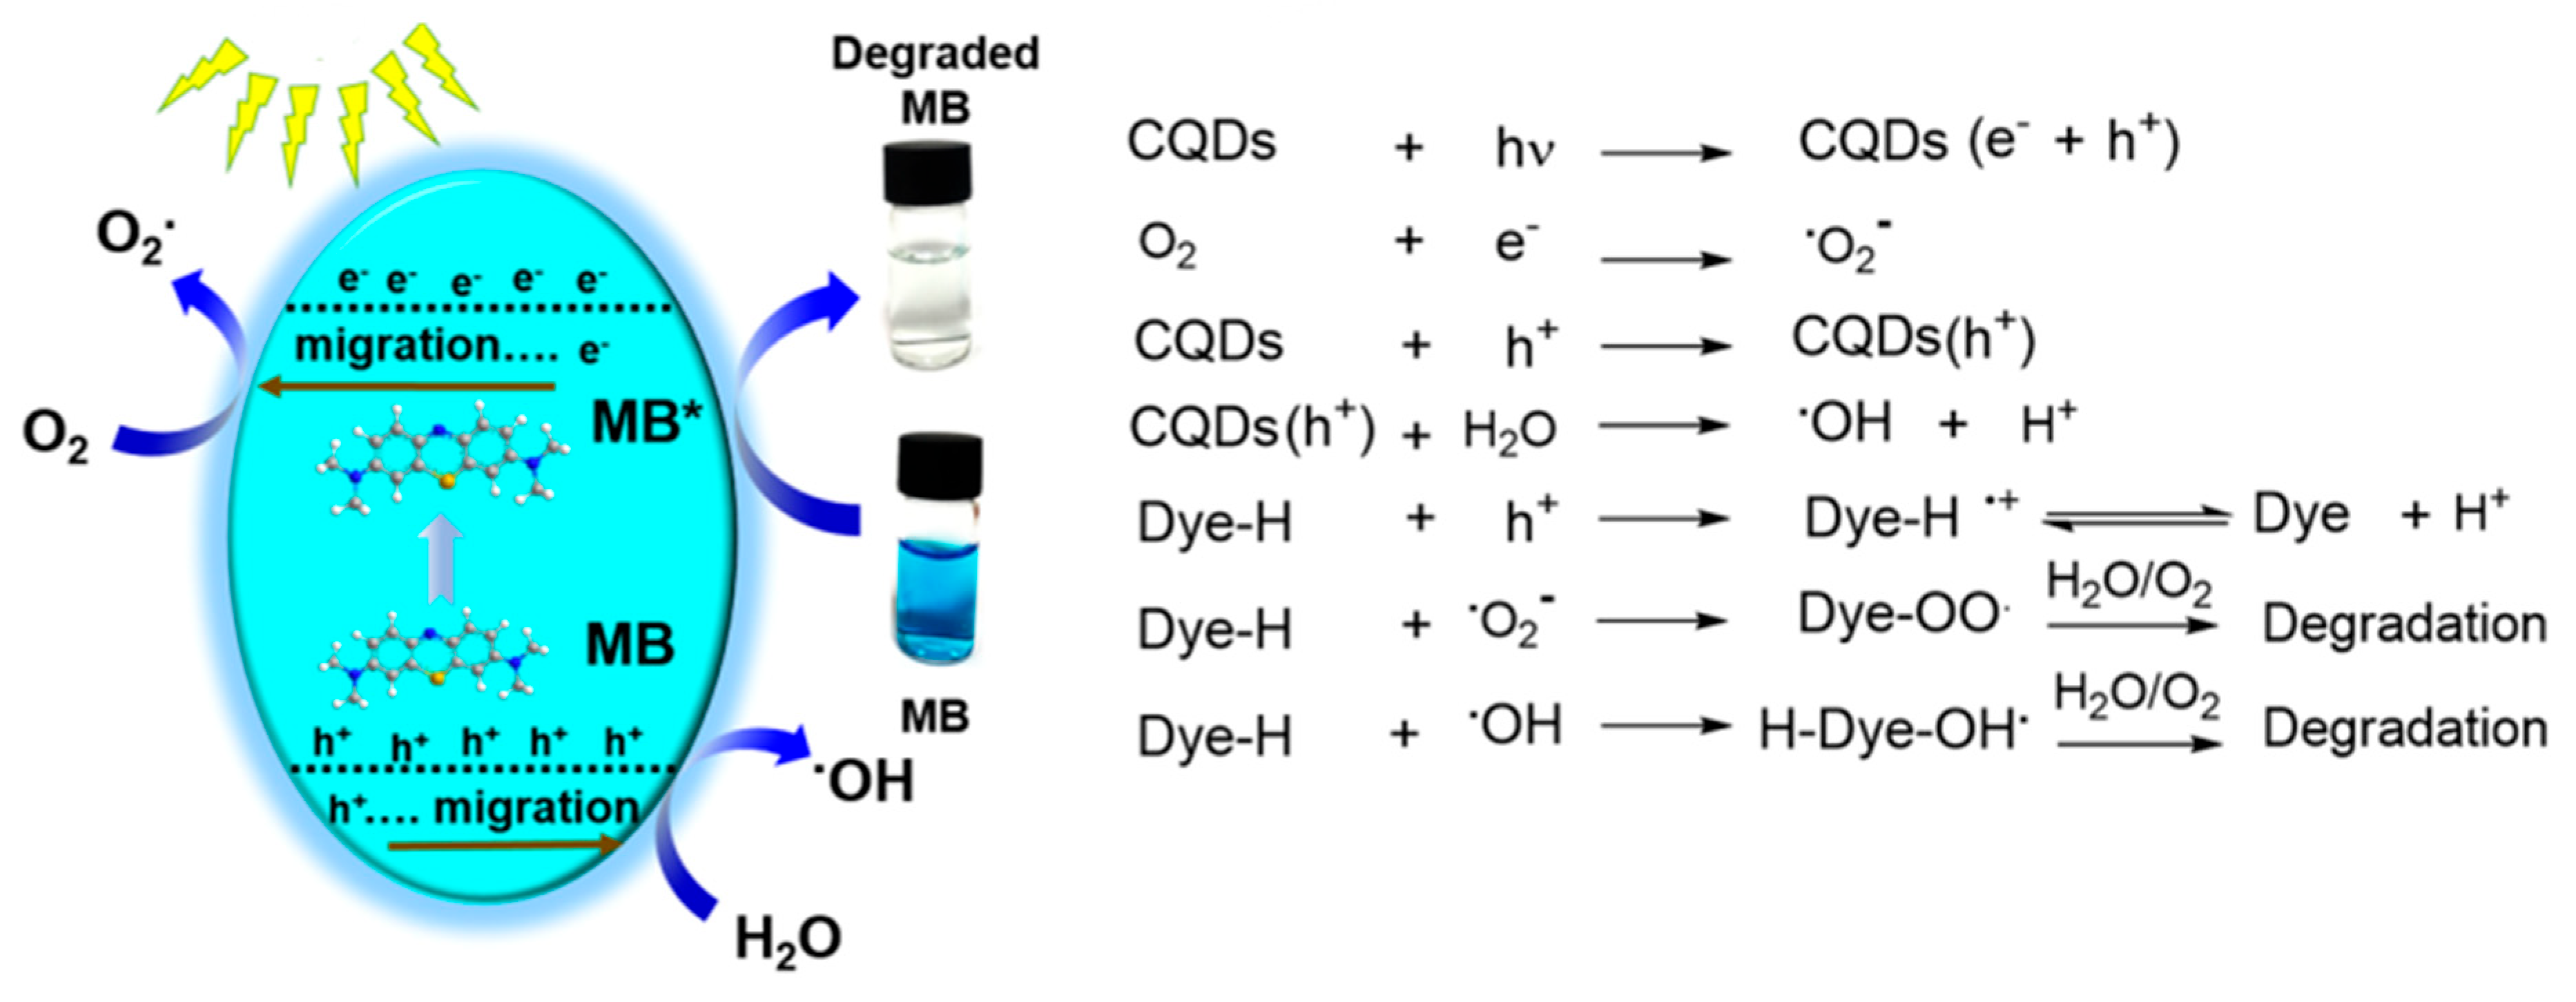
3.6. Proposed Photocatalytic Degradation Mechanism

Methylene blue, an organic pollutant, was degraded utilizing photocatalysts and light sources in the photocatalytic degradation process. Photocatalysts are photoexcited by UV, visible, or near-infrared light via a simple photocatalytic redox process, depending on their energy band gaps [43]. In order to activate the photocatalytic activity, the light adsorption (ultraviolet spectrum, visible light, or near-infrared light) must meet the photocatalyst’s band gap. In general, this process consists of three basic steps: (i) adsorption on the photocatalyst surface, (ii) electron excitation and transfer, and (iii) organic pollutant destruction on the reactive surface. A promising photocatalyst should have a small bandgap, high electron-hole separation, or strong visible light adsorption to increase photocatalytic degradation efficiency [44].
Figure 8 shows the photocatalytic degradation pathways over CQD. As photons (hv) are absorbed (h is the Planck constant, v is the frequency of the light), holes (h+) are produced in the valence band (VB) and electrons (e−) are produced in the conduction band (CB). Additionally, it was noted that the generated VB holes and superoxide radical anions (•O2) and hydroxyl radical (•OH) would combine with oxygen and water to form CB electrons and VB holes, which can degrade MB in wastewater [45]. The reactions that take place have the following mechanisms.

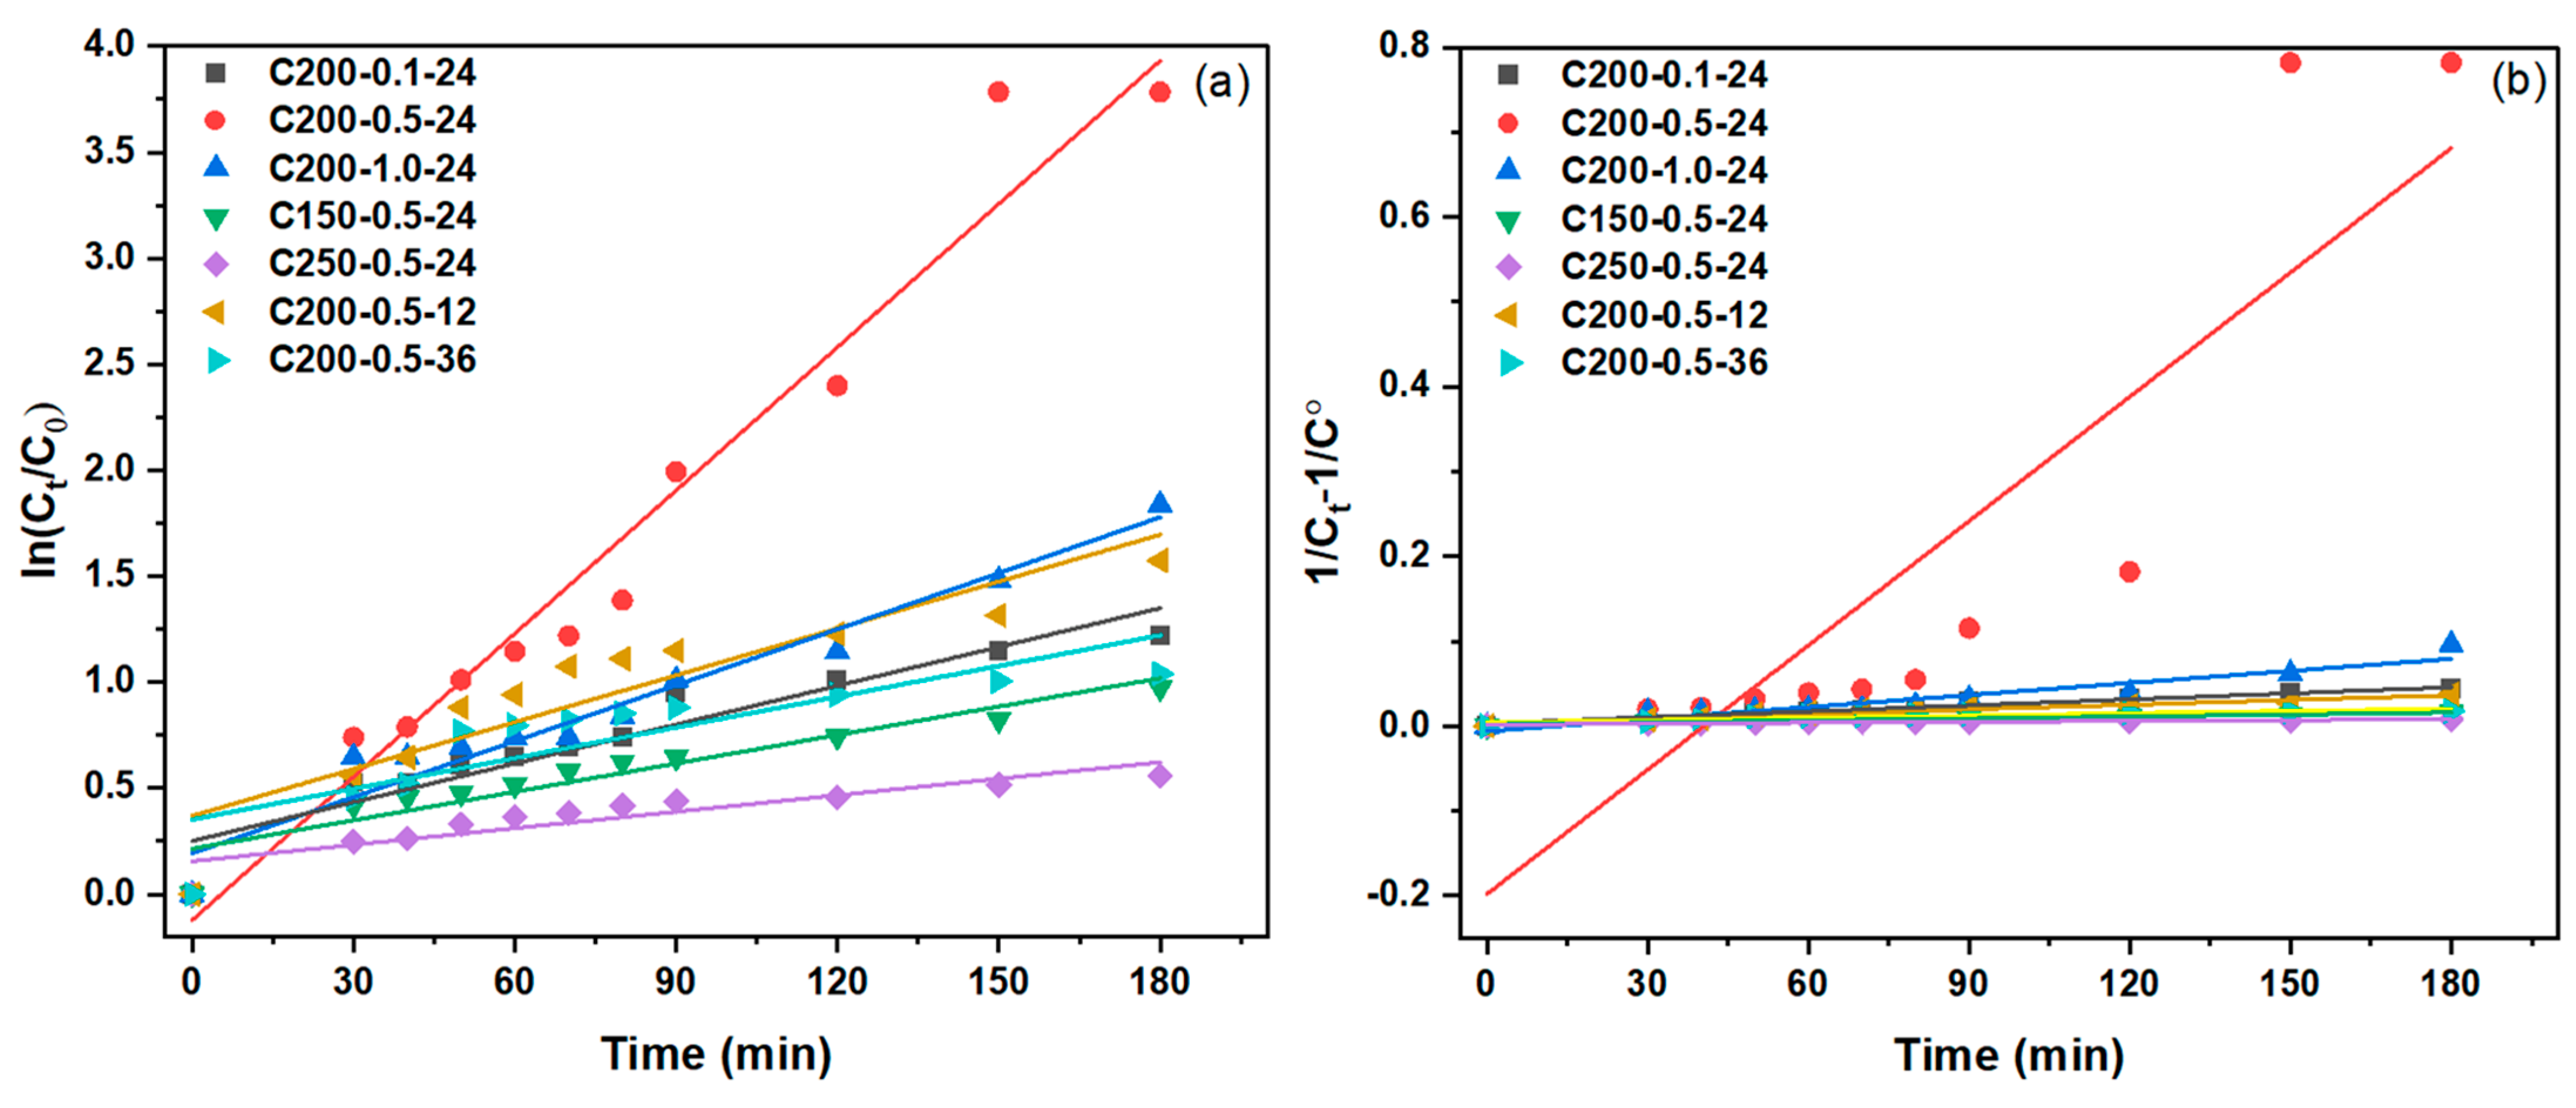
3.7. Reaction Kinetics Analysis

The degradation profile of the MB by all CQDs was fitted onto PFO and PSO, as shown in Figure 9a,b. Given the kinetic data presented in Table 4, the degradation profiles by C200-0.5-24 and C200-1.0-24 were well fitted to PFO, with R2 = 0.960 and 0.946 and degradation rate k1 = 0.023/min and 0.009/min, respectively. Therefore, the kinetics shows a physisorption mechanism that governs long-range binding on all surface coverage by van der Waals forces [47]. Contrary to the others, CQDs fit the PSO model with a range of R2 from 0.808 to 0.961, although with a very low degradation rate compared to the PFO. The PSO reaction implies that the MB degradation occurred in a chemisorption reaction between the MB and surface functional groups of CQDs [16]. Thus, C200-0.5-24 was the best CQD and had the highest decolorization rate constant of 0.023/min with a good correlation R2 = 0.960 compared to others.

4. Conclusions

In this work, kenaf-based CQDs were developed, and experiments were designed to assess the effect of temperature, precursor mass and time (duration) in hydrothermal synthesis treatment. All these process parameters play a crucial role in tuning CQDs’ morphology and photoluminescence properties. The investigation found that C200-0.5-24 obtained the highest photocatalytic degradation rate of 0.023/min with the optimum conditions by using 200 °C, 0.5 g and 24 h during the hydrothermal treatment. The degradation was performed in about 120 min with a degradation efficiency of 90%. The improvement of the morphological structure, which has a well-defined and widely disseminated nanoparticle and increases the interphase between MB and CQD, was the explanation for the outstanding photocatalytic activity of the optimized CQD. With the completion of this study, it is believed that the research objectives specified in the introduction have been achieved. The performance of the optimized CQD is still limited by their propensity to have surface defects which can affect the recombination of electrons and holes by acting as traps, thus deteriorating the quantum yield. Therefore, the recommendation was to analyze further the synthesizing CQD conditions such as solvent, phase, pH and many more. However, these results offer a promising way to produce future nanoparticle CQDs and could be applied to highly stable, durable, and economically feasible secondary or ternary heterogeneous photocatalysts.

Author Contributions

N.S., writing and original draft preparations, review and editing; N.S.S.; M.D.H.W., conceptualization and review; S.S., conceptualization, comprehensive revision and supervision. All authors have read and agreed to the published version of the manuscript.

Funding

This research was funded by FRGS, grant number FRGS/1/2020/TK0/UTP/02/22 and YUTP, grant number 015LC0-357.

Data Availability Statement

Not applicable.

Conflicts of Interest

The authors declare no conflict of interest.

References

  1. Liu, W.; Sun, M.; Ding, Z.; Gao, B.; Ding, W. Ti3C2 MXene embellished g-C3N4 nanosheets for improving photocatalytic redox capacity. J. Alloys Compd. 2021, 877, 160223. [Google Scholar] [CrossRef]
  2. Wu, X.; Zhao, J.; Wang, L.; Han, M.; Zhang, M.; Wang, H.; Huang, H.; Liu, Y.; Kang, Z. Carbon dots as solid-state electron mediator for BiVO4/CDs/CdS Z-scheme photocatalyst working under visible light. Appl. Catal. B 2017, 206, 501–509. [Google Scholar] [CrossRef]
  3. Bajorowicz, B.; Kobyla, M.P.; Go, A.; Nadolna, J.; Zaleska-medynska, A.; Malankowska, A. Quantum dot-decorated semiconductor micro- and nanoparticles: A review of their synthesis, characterization and application in photocatalysis. Adv. Colloid Interface Sci. 2018, 256, 352–372. [Google Scholar] [CrossRef] [PubMed]
  4. Saafie, N.; Zulfiqar, M.; Samsudin, M.F.R.; Sufian, S. Current Scenario of MXene-Based Nanomaterials for Wastewater Remediation: A Review. Chemistry 2022, 4, 1576–1608. [Google Scholar] [CrossRef]
  5. Wang, R.; Lu, K.-Q.; Tang, Z.-R.; Xu, Y.-J. Recent progress in carbon quantum dots: Synthesis, properties and applications in photocatalysis. J. Mater. Chem. A Mater. 2017, 5, 3717–3734. [Google Scholar] [CrossRef]
  6. Li, J.; Ma, Y.; Ye, Z.; Zhou, M.; Wang, H.; Ma, C.; Wang, D.; Huo, P.; Yan, Y. Fast electron transfer and enhanced visible light photocatalytic activity using multi-dimensional components of carbon quantum dots @ 3D daisy-like In2S3/single-wall carbon nanotubes. Appl. Catal. B 2017, 204, 224–238. [Google Scholar] [CrossRef]
  7. Heng, Z.W.; Chong, W.C.; Pang, Y.L.; Koo, C.H. An overview of the recent advances of carbon quantum dots/metal oxides in the application of heterogeneous photocatalysis in photodegradation of pollutants towards visible-light and solar energy exploitation. J. Environ. Chem. Eng. 2021, 9, 105199. [Google Scholar] [CrossRef]
  8. Ahuja, V.; Bhatt, A.K.; Varjani, S.; Choi, K.Y.; Kim, S.H.; Yang, Y.H.; Bhatia, S.K. Quantum dot synthesis from waste biomass and its applications in energy and bioremediation. Chemosphere 2022, 293, 133564. [Google Scholar] [CrossRef]
  9. Chahal, C.; van den Akker, B.; Young, F.; Franco, C.; Blackbeard, J.; Monis, P. Pathogen and Particle Associations in Wastewater: Significance and Implications for Treatment and Disinfection Processes. Adv. Appl. Microbiol. 2016, 97, 63–119. [Google Scholar]
  10. Boruah, A.; Saikia, M.; Das, T.; Goswamee, R.L.; Saikia, B.K. Blue-emitting fluorescent carbon quantum dots from waste biomass sources and their application in fluoride ion detection in water. J. Photochem. Photobiol. B 2020, 209, 111940. [Google Scholar] [CrossRef]
  11. Das, R.; Bandyopadhyay, R.; Pramanik, P. Carbon quantum dots from natural resource: A review. Mater. Today Chem. 2018, 8, 96–109. [Google Scholar] [CrossRef]
  12. Zhu, Z.; Yang, P.; Li, X.; Luo, M.; Zhang, W.; Chen, M.; Zhou, X. Green preparation of palm powder-derived carbon dots co-doped with sulfur/chlorine and their application in visible-light photocatalysis. Spectrochim. Acta A Mol. Biomol. Spectrosc. 2020, 227, 117659. [Google Scholar] [CrossRef] [PubMed]
  13. Wongso, V.; Chung, H.K.; Sambudi, N.S.; Sufian, S.; Abdullah, B.; Wirzal, M.D.H.; Ang, W.L. Silica–carbon quantum dots decorated titanium dioxide as sunlight-driven photocatalyst to diminish acetaminophen from aquatic environment. J. Photochem. Photobiol. A Chem. 2020, 394, 112436. [Google Scholar] [CrossRef]
  14. Sahoo, N.K.; Jana, G.C.; Aktara, M.N.; Das, S.; Nayim, S.; Patra, A.; Bhattacharjee, P.; Bhadra, K.; Hossain, M. Carbon dots derived from lychee waste: Application for Fe3+ ions sensing in real water and multicolor cell imaging of skin melanoma cells. Mater. Sci. Eng. C 2020, 108, 110429. [Google Scholar] [CrossRef] [PubMed]
  15. Genc, M.T.; Yanalak, G.; Arslan, G.; Patir, I.H. Green preparation of Carbon Quantum dots using Gingko biloba to sensitize TiO2 for the photohydrogen production. Mater. Sci. Semicond. Process. 2020, 109, 104945. [Google Scholar] [CrossRef]
  16. Chung Hui, K.; Lun Ang, W.; Soraya Sambudi, N. Nitrogen and bismuth-doped rice husk-derived carbon quantum dots for dye degradation and heavy metal removal. J. Photochem. Photobiol. A Chem. 2021, 418, 113411. [Google Scholar] [CrossRef]
  17. Chaudhary, N.; Verma, D.; Gopal Sharma, J.; Solanki, P.R. A novel bioinspired carbon quantum dots based optical sensor for ciprofloxacin detection. Mater. Lett. 2022, 308, 131090. [Google Scholar] [CrossRef]
  18. Wang, T.; Liu, X.; Ma, C.; Zhu, Z.; Liu, Y.; Liu, Z.; Wei, M.; Zhao, X.; Dong, H.; Huo, P.; et al. Bamboo prepared carbon quantum dots (CQDs) for enhancing Bi3Ti4O12 nanosheets photocatalytic activity. J. Alloys Compd. 2018, 752, 106–114. [Google Scholar] [CrossRef]
  19. Hasija, V.; Sudhaik, A.; Raizada, P.; Hosseini-Bandegharaei, A.; Singh, P. Carbon quantum dots supported AgI/ZnO/phosphorus doped graphitic carbon nitride as Z-scheme photocatalyst for efficient photodegradation of 2,4-dinitrophenol. J. Environ. Chem. Eng. 2019, 7, 103272. [Google Scholar] [CrossRef]
  20. Khiari, B.; Ghouma, I.; Ibn, A.; Amine, A.; Jellali, S. Kenaf stems: Thermal characterization and conversion for biofuel and biochar production. Fuel 2020, 262, 116654. [Google Scholar] [CrossRef]
  21. Gan, L.; Fang, X.; Xu, L.; Wang, L.; Wu, Y.; Dai, B.; He, W.; Shi, J. Boosted activity of δ-MnO2 by Kenaf derived carbon fiber for high-efficient oxidative degradation of bisphenol A in water. Mater. Des. 2021, 203, 109596. [Google Scholar] [CrossRef]
  22. Wongso, V.; Sambudi, N.S.; Sufian, S.; Isnaeni. The effect of hydrothermal conditions on photoluminescence properties of rice husk-derived silica-carbon quantum dots for methylene blue degradation. Biomass Convers. Biorefin. 2021, 11, 2641–2654. [Google Scholar] [CrossRef]
  23. Liu, N.; Lu, N.; Su, Y.; Wang, P.; Quan, X. Fabrication of g-C3N4/Ti3C2 composite and its visible-light photocatalytic capability for ciprofloxacin degradation. Sep. Purif. Technol. 2019, 211, 782–789. [Google Scholar] [CrossRef]
  24. Hsiao, P.H.; Timjan, S.; Kuo, K.Y.; Juan, J.C.; Chen, C.Y. Optical management of CQD/AgNP@SiNW arrays with highly efficient capability of dye degradation. Catalysts 2021, 11, 399. [Google Scholar] [CrossRef]
  25. Jafarov, M.A.; Nasirov, E.F.; Kazımzade, A.H.; Jahangirova, S.A. Synthesis and characterization of nanoscale material ZnS in porous silicon by chemical method. Chalcogenide Lett. 2021, 18, 791–795. [Google Scholar]
  26. Ţucureanu, V.; Matei, A.; Avram, A.M. FTIR Spectroscopy for Carbon Family Study. Crit. Rev. Anal. Chem. 2016, 46, 502–520. [Google Scholar] [CrossRef] [PubMed]
  27. Ashraf, M.A.; Peng, W.; Zare, Y.; Rhee, K.Y. Effects of Size and Aggregation/Agglomeration of Nanoparticles on the Interfacial/Interphase Properties and Tensile Strength of Polymer Nanocomposites. Nanoscale Res. Lett. 2018, 13, 214. [Google Scholar] [CrossRef]
  28. Zheng, J.; Wang, J.; Wang, Y.; Yang, Y.; Liu, X.; Xu, B. Facile and Rapid Synthesis of Yellow-Emission Carbon Dots for White Light-Emitting Diodes. J. Electron. Mater. 2018, 47, 7497–7504. [Google Scholar] [CrossRef]
  29. Pellegrino, F.; Pellutiè, L.; Sordello, F.; Minero, C.; Ortel, E.; Hodoroaba, V.D.; Maurino, V. Influence of agglomeration and aggregation on the photocatalytic activity of TiO2 nanoparticles. Appl. Catal. B 2017, 216, 80–87. [Google Scholar] [CrossRef]
  30. Yue, X.; Zhu, C.; Gu, R.; Hu, J.; Xu, Y.; Ye, S.; Zhu, J. Copper-Modified Double-Emission Carbon Dots for Rapid Detection of Thiophanate Methyl in Food. Foods 2022, 11, 3336. [Google Scholar] [CrossRef]
  31. Kainth, S.; Maity, B.; Shetti, N.P.; Basu, S.; Kakarla, R.R. Dual emissive carbon dots: Synthesis strategies, properties and its ratiometric sensing applications. Nano-Struct. Nano-Objects 2023, 33, 100931. [Google Scholar] [CrossRef]
  32. Jing, S.; Zhao, Y.; Sun, R.C.; Zhong, L.; Peng, X. Facile and High-Yield Synthesis of Carbon Quantum Dots from Biomass-Derived Carbons at Mild Condition. ACS Sustain. Chem. Eng. 2019, 7, 7833–7843. [Google Scholar] [CrossRef]
  33. Mai, X.D.; Phan, Y.T.H.; Nguyen, V.Q. Excitation-Independent Emission of Carbon Quantum Dot Solids. Adv. Mater. Sci. Eng. 2020, 2020, 9643168. [Google Scholar] [CrossRef]
  34. Jiang, K.; Feng, X.; Gao, X.; Wang, Y.; Cai, C.; Li, Z.; Lin, H. Preparation of multicolor photoluminescent carbon dots by tuning surface states. Nanomaterials 2019, 9, 529. [Google Scholar] [CrossRef]
  35. Hoan, B.T.; Tam, P.D.; Pham, V.H. Green Synthesis of Highly Luminescent Carbon Quantum Dots from Lemon Juice. J. Nanotechnol. 2019, 2019, 2852816. [Google Scholar] [CrossRef]
  36. Devi, S.; Gupta, R.K.; Paul, A.K.; Tyagi, S. Waste carbon paper derivatized Carbon Quantum Dots/(3-Aminopropyl)triethoxysilane based fluorescent probe for trinitrotoluene detection. Mater. Res. Express 2019, 6, 025605. [Google Scholar] [CrossRef]
  37. Ghezzi, F.; Donnini, R.; Sansonetti, A.; Giovanella, U.; la Ferla, B.; Vercelli, B. Nitrogen-Doped Carbon Quantum Dots for Biosensing Applications: The Effect of the Thermal Treatments on Electrochemical and Optical Properties. Molecules 2022, 28, 72. [Google Scholar] [CrossRef]
  38. Surendran, P.; Lakshmanan, A.; Vinitha, G.; Ramalingam, G.; Rameshkumar, P. Facile preparation of high fluorescent carbon quantum dots from orange waste peels for nonlinear optical applications. Luminescence 2020, 35, 196–202. [Google Scholar] [CrossRef]
  39. Lai, C.; Lin, S.; Xiong, L.; Wu, Y.; Liu, C.; Jin, Y. High quantum yield nitrogen-doped carbon quantum dots: Green synthesis and application as “on-off” fluorescent sensors for specific Fe3+ ions detection and cell imaging. Diam. Relat. Mater. 2023, 133, 109702. [Google Scholar] [CrossRef]
  40. Amjadi, M.; Manzoori, J.L.; Hallaj, T.; Azizi, N. Sulfur and nitrogen co-doped carbon quantum dots as the chemiluminescence probe for detection of Cu2+ ions. J. Lumin. 2017, 182, 246–251. [Google Scholar] [CrossRef]
  41. Chaudhary, N.; Gupta, P.K.; Eremin, S.; Solanki, P.R. One-step green approach to synthesize highly fluorescent carbon quantum dots from banana juice for selective detection of copper ions. J. Environ. Chem. Eng. 2020, 8, 103720. [Google Scholar] [CrossRef]
  42. Gengan, S.; Ananda Murthy, H.C.; Sillanpää, M.; Nhat, T. Carbon dots and their application as photocatalyst in dye degradation studies- Mini review. Results Chem. 2022, 4, 100674. [Google Scholar] [CrossRef]
  43. Baaloudj, O.; Kenfoud, H.; Badawi, A.K.; Assadi, A.A.; el Jery, A.; Assadi, A.A.; Amrane, A. Bismuth Sillenite Crystals as Recent Photocatalysts for Water Treatment and Energy Generation: A Critical Review. Catalysts 2022, 12, 500. [Google Scholar] [CrossRef]
  44. Jamaludin, N.; Rashid, S.A.; Tan, T. Natural Biomass as Carbon Sources for the Synthesis of Photoluminescent Carbon Dots. In Synthesis, Technology and Applications of Carbon Nanomaterials; Elsevier Inc.: Amsterdam, The Netherlands, 2018. [Google Scholar]
  45. Shahzad, W.; Badawi, A.K.; Rehan, Z.A.; Muhammad, A.; Ali, R.; Shah, F.; Ali, S.; Ismail, B. Enhanced visible light photocatalytic performance of Sr0.3(Ba,Mn)0.7ZrO3 perovskites anchored on graphene oxide. Ceram. Int. 2022, 48, 24979–24988. [Google Scholar] [CrossRef]
  46. Das, G.S.; Shim, J.P.; Bhatnagar, A.; Tripathi, K.M. Biomass-derived Carbon Quantum Dots for Visible-Light-Induced Photocatalysis and Label-Free Detection of Fe(III) and Ascorbic acid. Sci. Rep. 2019, 9, 15084. [Google Scholar] [CrossRef]
  47. Liu, J.; Wong, L.M.; Gurudayal; Wong, L.H.; Chiam, S.Y.; Yau Li, S.F.; Ren, Y. Immobilization of dye pollutants on iron hydroxide coated substrates: Kinetics, efficiency and the adsorption mechanism. J. Mater. Chem. A Mater. 2016, 4, 13280–13288. [Google Scholar] [CrossRef]
Figure 1. Synthesis process of kenaf-based CQDs.
Separations 10 00137 g001
Figure 2. FTIR spectra of CQD samples at various hydrothermal conditions.
Separations 10 00137 g002
Figure 3. TEM images at low and high magnification as well as histogram of CQD samples at various hydrothermal conditions (a) C200-0.1-24, (b) C200-0.5-24, (c) C200-1.0-24, (d) C150-0.5-24, (e) C250-0.5-24, (f) C200-0.5-12 and (g) C200-0.5-36.
Separations 10 00137 g003aSeparations 10 00137 g003b
Figure 4. UV–Vis absorption spectra of CQD samples at various hydrothermal conditions. Inset figure of the x-axis focus range at 280–290 nm wavelength.
Separations 10 00137 g004
Figure 5. PL spectra of CQD samples at various hydrothermal conditions.
Separations 10 00137 g005
Figure 6. Photocatalytic degradation of CQDs in MB (50 ppm) under visible light irradiation.
Separations 10 00137 g006
Figure 7. Comparison degradation of optimized CQD (C200-0.5-24) under visible light irradiation and total dark condition.
Separations 10 00137 g007
Figure 8. Anticipated mechanism of MB degradation under visible-light irradiation and postulated reactions. (Reprinted with permission from Ref. [46].)
Separations 10 00137 g008
Figure 9. (a) PFO and (b) PSO kinetic rate plots of MB degradation.
Separations 10 00137 g009
Table 1. Natural carbon sources synthesize CQD with respective method conditions and performances.
CQD
Precursor
Method Precursor Mass (g)Solvent
(Volume)
Temp (°C)Time (h)PerformancesRef.
Taro peelMicroprocessor-based sonicator2.0H2O2 (100 mL)RT4F−detection in water:
(10–160 ppm)
[10]
Raw palm
veneers
Hydrothermal0.1H2O (10 mL) +
thionyl chloride (200 µL)
2007Degradation of RhB: 71.7% in 45 min [12]
Rice huskHydrothermal0.1H2O (30 mL)20010Degradation of acetaminophen: 100% in 240 min[13]
Lychee wasteHydrothermal1.0H2O + ethanol (10 mL solution)1805Detection of Fe3+ ions 23.6 nM[14]
Ginkgo
biloba leaves
Microwave-assisted irradiation1.0H2O (50 mL)RT10 minH2 generation:
HER: 665 μmol/g.h
[15]
Rice huskHydrothermal0.5H2O (50 mL)1904Methylene blue degradation:
N-QDs 72.16%, Bi-QDs 68.91% within 2 h
Copper II ion removal: N-QDs 56.23%, Bi-QDs 33.13% within 1 h
[16]
Cinnamomum
tamala leaves extract
HydrothermalChopped leaves boiled in 100 mL H2OLeaves extract (40 mL)20012Detection of CIP: 1 to 100 μM, the detection limit of 6.06 μM[17]
RT-Room temperature.
Table 2. Nomenclature of CQD samples at various hydrothermal conditions.
SampleTemperature (°C)Mass (g)Time (h)
C200-0.1-242000.124
C200-0.5-242000.524
C200-1.0-242001.024
C150-0.5-241500.524
C250-0.5-242500.524
C200-0.5-122000.512
C200-0.5-362000.536
Table 3. CQD quantum yield from various carbon precursors.
Carbon PrecursorsQuantum Yield (%)References
Raw palm veneers0.90[12]
Rice husk20.80[22]
Lemon juice21.37[35]
Waste carbon paper5.10[36]
Citric acid (CA) and urea0.37[37]
Orange peels11.37[38]
CA and o-phenylenediamine33.55[39]
CA and l-cysteine82.00[40]
Banana juice32.00[41]
Kenaf fiber5.00–76.12This work
Table 4. Kinetic parameter of CQD samples at various hydrothermal conditions.
SamplePFOPSO
k1 (min−1)R2k2 (min−1)R2
C200-0.1-240.0060.8900.00020.947
C200-0.5-240.0230.9600.00490.740
C200-1.0-240.0090.9460.00050.890
C150-0.5-240.0040.8800.00010.961
C250-0.5-240.0030.8020.00010.873
C200-0.5-120.0070.8260.00020.945
C200-0.5-360.0050.6890.00010.808
Disclaimer/Publisher’s Note: The statements, opinions and data contained in all publications are solely those of the individual author(s) and contributor(s) and not of MDPI and/or the editor(s). MDPI and/or the editor(s) disclaim responsibility for any injury to people or property resulting from any ideas, methods, instructions or products referred to in the content.

